THE MEDICAL CARE COSTS OF OBESITY:AN INSTRUMENTAL VARIABLES APPROACH
John CawleyChad Meyerhoefer
Working Paper 16467http://www.nber.org/papers/w16467
NATIONAL BUREAU OF ECONOMIC RESEARCH1050 Massachusetts Avenue
Cambridge, MA 02138October 2010
The views expressed herein are those of the authors and do not necessarily reflect the views of theNational Bureau of Economic Research.
NBER working papers are circulated for discussion and comment purposes. They have not been peer-reviewed or been subject to the review by the NBER Board of Directors that accompanies officialNBER publications.
The Medical Care Costs of Obesity: An Instrumental Variables ApproachJohn Cawley and Chad MeyerhoeferNBER Working Paper No. 16467October 2010JEL No. D62,G22,H23,I1
ABSTRACT
This paper is the first to use the method of instrumental variables (IV) to estimate the impact of obesityon medical costs in order to address the endogeneity of weight and to reduce the bias from reportingerror in weight. Models are estimated using data from the Medical Expenditure Panel Survey for 2000-2005. The IV model, which exploits genetic variation in weight as a natural experiment, yields estimatesof the impact of obesity on medical costs that are considerably higher than the correlations reportedin the previous literature. For example, obesity is associated with $676 higher annual medical carecosts, but the IV results indicate that obesity raises annual medical costs by $2,826 (in 2005 dollars).The estimated annual cost of treating obesity in the U.S. adult non-institutionalized population is $168.4billion or 16.5% of national spending on medical care. These results imply that the previous literaturehas underestimated the medical costs of obesity, resulting in underestimates of the cost effectivenessof anti-obesity interventions and the economic rationale for government intervention to reduce obesity-related externalities.
John Cawley124 MVR HallDepartment of Policy Analysis and ManagementCornell UniversityIthaca, NY 14853and [email protected]
Chad MeyerhoeferRauch Business Center, Room 459Lehigh University621 Taylor StreetBethlehem, PA [email protected]
2
Introduction
In the United States, the prevalence of obesity, defined as a body mass index1 or BMI >
30, has been rising for at least five decades (e.g. Burkhauser et al., 2009; Komlos and Brabec,
2010) and has more than doubled in the past thirty years (Flegal et al., 1998). In 2007-2008,
33.8% of American adults were clinically obese (Flegal et al., 2010). This is troubling because
obesity is associated with an increased risk of myocardial infarction, stroke, type 2 diabetes,
cancer, hypertension, osteoarthritis, asthma, and depression, among other conditions (Dixon,
2010).
Many previous papers have estimated the correlation of obesity with medical care costs
(e.g. Finkelstein et al., 2009; Trasande et al., 2009; Thorpe et al., 2004; Finkelstein et al., 2003;
Kortt et al., 1998). Typically, this involves estimating cross-sectional models using large
secondary datasets such as the National Medical Expenditure Survey of 1987 (NMES) and the
more recent Medical Expenditure Panel Survey (MEPS). The most recent such paper, which
examines data from the MEPS, estimates that the obese had average medical spending that was
$1,429 (in 2008 dollars), or 41.5%, higher than the average medical spending of healthy weight
individuals, and that the aggregate medical costs associated with obesity totaled $86 billion
(Finkelstein et al., 2009).
These studies have made an important contribution to the literature by demonstrating the
significance of medical costs associated with obesity and diseases linked to obesity. As a result,
these papers have been heavily cited and widely influential.2 For example, these estimates have
1 Body mass index is defined as weight in kilograms divided by height in meters squared. 2 For example, Finkelstein et al. (2003) has been cited 210 times, as of September 1, 2010, according to the ISI Web of Knowledge.
3
been used to calculate the cost effectiveness of anti-obesity interventions (Brown et al., 2007;
Wang et al., 2003) and to justify government action (e.g. U.S. D.H.H.S., 2010).
However, the previous estimates have important limitations. The most significant is that
they represent the correlation of obesity with medical care costs, not the causal effect of obesity
on medical care costs. The correlation is an overestimate of the causal effect if, for example,
some people became obese after suffering injury or chronic depression, and have higher medical
costs because of the injury or depression (which is likely to be unobserved by the
econometrician). The correlation is an underestimate of the causal effect if, for example, obese
people have less access to treatment (e.g. if they are more economically disadvantaged in ways
unobserved by the econometrician). Another limitation is that these studies are usually based
on self-reported, rather than measured, height and weight, and this reporting error biases the
coefficient estimates (Bound, Brown and Mathiowetz, 2002).
This paper builds on the previous research by addressing both of these problems –
endogeneity of weight and reporting error in weight – by estimating models of instrumental
variables. Our instrument for the respondent’s weight is the weight of a biological relative, an
instrument used in the previous literature to estimate the impact of weight on other outcomes
such as wages (e.g. Cawley 2004; Kline and Tobias, 2008) and mortality (Smith et al., 2009).
We estimate the IV model using the 2000-2005 MEPS, the leading source of data on medical
care costs and utilization for the U.S. non-institutionalized population. Our results indicate that
the effect of obesity on medical care costs is much greater than previously appreciated. The
model also passes two falsification tests: it does not find an impact of obesity on medical care
costs for conditions that are unrelated to obesity, and biologically unrelated children (e.g.
stepchildren) are not significant predictors of respondent weight.
4
We allow for nonlinearities in the relationship between BMI and medical care costs, and
show that predicted medical expenditures are U-shaped across the BMI continuum. This
implies that much of the medical cost of obesity is attributable to a small percentage of the
population with very high body weight.
The limitations of cost of illness studies are widely recognized (Shiell et al., 1987; Roux
and Donaldson, 2004). For example, they are not useful for prioritizing the allocation of
medical resources because that would amount to a circular argument: some conditions have a
large amount of resources devoted to them and thus have a high cost of illness, but that does not
imply that even more funding is needed (see, e.g., Shiell et al., 1987). This paper does not
estimate the medical care costs of obesity in order to argue that treatment of obesity should be
prioritized above treatment of other conditions, but so that the medical care consequences of
obesity will be more accurately known, so that, e.g., the external costs of obesity through health
insurance may be better understood and so that future studies can more accurately calculate the
cost-effectiveness of interventions to prevent obesity.
Empirical Model
Identification: Method of Instrumental Variables
Ideally, to measure the effect of obesity on medical care costs we would conduct a
randomized controlled trial in which a large number of people would be divided between a
treatment group and a control group, after which the treatment group would be endowed with
enough extra weight to make them obese. By comparing the medical costs before and after the
treatment, between the treatment and control groups (i.e. a difference in differences model) we
could accurately estimate the causal effect of obesity on medical costs. Such a randomized
5
experiment would, of course, be unethical, so we must rely on a natural experiment. We follow
the previous literature (e.g. Cawley 2004; Kline and Tobias, 2008; Smith et al., 2009) and use
the weight of a biological relative as an instrument for the weight of the respondent.
There are two requirements for an instrument. First, it must be powerful. The weight of
a biological relative is a powerful predictor of the weight of a respondent because roughly half
the variation in weight across people is genetic in origin (Comuzzie and Allison, 1998). As we
describe in the Results section below, our instrument set easily exceeds the conventional
benchmark for power of F=10 in the first stage (Stock, Wright and Yogo, 2002). The second
requirement is validity – the instrument must be uncorrelated with the error term in the second
stage. In the present context, this means that the weight of a biological relative must be
uncorrelated with the respondent’s residual medical care costs after controlling for predicted
respondent weight and other observed characteristics.
One might be concerned that the second requirement is not met if the weight of both the
respondent and the biological relative are affected by a common household environment that is
also directly correlated with the respondent’s medical expenditures. However, research in
behavioral genetics finds no detectable effect of shared household environment effect on
weight. Adoption studies have consistently found that the correlation in weight between a child
and its biological parents is the same for children raised by their biological parents and children
raised by adoptive parents (Vogler et al, 1995; Stunkard et al, 1986; Sorensen and Stunkard,
1993). Other studies have found that the weights of unrelated adopted siblings are uncorrelated
(Grilo and Pogue-Geile, 1991). Studies of twins reared apart (which by necessity are based on
small samples) also find no effect of a shared family environment on weight; i.e. there is no
6
significant difference between the correlation in the weight of twins reared together and twins
reared apart (Price and Gottesman, 1991; Maes et al, 1997).
With hundreds of behavioral genetics studies on the subject, there are of course some
studies that detect a shared family environment on BMI (e.g. Nelson et al., 2006), but the
preponderance of evidence is that any such effects are so small as to be undetectable and
ignorable (Hewitt, 1999; Grilo and Pogue-Geile, 1991; Maes et al., 1997). For example, a
recent study using the same data as Nelson et al. (2006) concluded: “We also did not find any
support for shared environmental effects on BMI at any age.” (Haberstick et al., 2010, p. 501).
This may be contrary to conventional wisdom but it is a robust finding; a comprehensive
review concluded that “[E]xperiences that are shared among family members appear largely
irrelevant in determining individual differences in weight and obesity” (Grilo and Pogue-Geile,
1991), and more recently Wardle et al. (2008) note: “Contrary to widespread assumptions about
the influence of the family environment, living in the same home in childhood appears to confer
little similarity in adult BMI beyond that expected from the degree of genetic resemblance.”
(Wardle et al., 2008, p. 398.)
As a result of this surprising but consistent finding, the similarity in weight between
biological relatives can be attributed to genetics, which provides us with a plausible natural
experiment to identify the causal impact of weight on medical care costs. (To reassure
economists concerned whether this identifying assumption would pass muster with the medical
community, we note that the use of the weight of a biological relative as an instrument for the
weight of a respondent in an IV model passed peer review of the British Medical Journal; see
Smith et al. (2009)). Later in this paper we conduct a falsification test that uses the weight of a
stepchild (when available) instead of a biological child and find that the weight of a stepchild is
7
not a significant predictor of respondent weight. This finding is one more piece of evidence
consistent with a lack of common household environment effect in weight.
In the previous literature on the medical care costs of obesity, coefficients are likely
biased because of measurement error in BMI that is due to using self-reported, rather than
measured, weight and height.3 (Only self-reports or proxy-reports of weight and height are
available in the MEPS.) Numerous studies have documented systematic misreporting of height
and weight (e.g. Plankey et al, 1997; Villanueva, 2001). For example, Cawley and Burkhauser
(2006) examine data from the National Health and Nutrition Examination Survey III, which
contains data on both self-reported and measured weight and height. Using self-reported, rather
than measured, data to calculate BMI results in considerable underestimation of the prevalence
of obesity; e.g. among white females, the prevalence of obesity is 21.57% based on
measurements but 17.42% based on self-reports (Cawley and Burkhauser, 2006). Another
source of reporting error is that much of the information contained in the MEPS is reported by a
single household member, or proxy, and it is possible that proxies may not provide accurate
height and weight information for others in the household (on the other hand, proxies may be
more honest about other people’s weight than respondents are about their own weight). Both of
these sources of reporting error are expected to bias the coefficient estimates in the previous
literature. An additional benefit of the IV method is that it addresses the problem of
measurement error (see, e.g. Bound et al., 2002).
3 The direction of the bias due to reporting error in weight is ambiguous, because the reporting error in weight is not classical – errors are not independent of the true value of the variable; in particular, those who are heavier tend to underreport their weight more. See Burkhauser and Cawley (2008) for more on reporting error in weight, and see Bound et al. (2002) for details on the bias resulting from reporting error and the use of IV methods to reduce bias from reporting error.
8
Two-Part Model of Medical Expenditures
To estimate the impact of BMI and obesity on medical spending we use a two-part
model (2PM) of medical expenditures (Jones, 2000). The first part of the 2PM estimates the
probability of positive medical expenditures, while the second part estimates the level of
medical expenditures conditional on having any. We specify the first part as a Logit model and
the second part as a Gamma GLM with log link.4 Following the suggestion of Manning and
Mullahy (2001), we used modified Park tests to determine the proper choice of the conditional
variance function for the GLM, and Hosmer-Lemeshow tests to confirm that our choice of link
function is consistent with the data generating process.5
Given our specification of the 2PM, both parts of the model require the use of nonlinear
instrumental variables techniques. Because both the Logit model and the Gamma model are
among the class of GLMs, one can use the instrumental variable estimator of Carrol et al.
(1995) and Hardin et al. (2003) to determine the effect of weight on medical expenditures when
4 Identifying the appropriate function form for the second part of 2PM requires analysis of various characteristics of the expenditure distribution. An additional consideration in this case is that we seek to provide estimates for the overall population of non-elderly adults as well as seven sub-populations (men, women, white, non-white, private insurance, Medicaid, uninsured), so our estimator must perform well across sixteen different combinations of data sample and empirical specification. The two most widely used estimators for the second part of the 2PM are: 1) OLS of the log of the dependent variable; and 2) the GLM estimator. A significant drawback of the log OLS approach is that re-transformation of the estimates back to the raw scale requires knowledge of the degree and form of heteroscedasticity. In our application this would entail the difficult task of accurately diagnosing and correcting for heteroscedasticity on each sub-sample, making the GLM approach attractive in comparison. However, GLMs can be inefficient if the log-scale disturbances are heavy-tailed (Manning and Mullahy, 2001), so we examined the kurtosis of the log-scale residuals from an OLS model of medical expenditures and found it has an average value of 3.2 in our data. While this is slightly larger than the normal distribution, a properly specified GLM model should be reasonably efficient under this degree of skewness. 5 The Park tests indicated that the conditional variance is proportional to the square of the conditional mean (λ ranges from 1.91 - 2.06 and is precisely estimated), which is consistent with a gamma-class model. To perform the Hosmer-Lemeshow tests we regressed the prediction errors from each model on deciles of the distribution of predicted expenditures. If the F-test of coefficients on the decile indicators is jointly significant it indicates that the model does not fit the data well over the distribution of predicted expenditures. We rejected the null hypothesis that the decile coefficients are jointly equal to zero for only three out of sixteen models, which suggests that the gamma model with log link is broadly appropriate. In addition, Hill and Miller (2009) found that this specification performed relatively well on the 1996-2003 sample of non-elderly MEPS respondents with private insurance.
9
the endogenous and mismeasured regressor is either BMI or a discrete indicator for obesity.6 In
both cases, our primary set of instruments for the two-part IV models is the BMI, BMI squared,
and BMI cubed of the respondent’s oldest biological child.7
Prior research suggests that the relationship between body weight and health status is
nonlinear. In particular, the underweight (BMI<18.5) and obese (BMI>=30) have higher
mortality than the healthy weight (18.5<=BMI<25) and overweight (25<=BMI<30) (Flegal et
al., 2005; Seidell, 1996). To accommodate nonlinearities in the relationship between medical
expenditures and weight status we estimate a second set of two-part IV models in which the
endogenous regressors are the respondent’s BMI and BMI squared. We also estimated exactly
identified IV models that include as endogenous regressors the respondent’s BMI, BMI squared,
and BMI cubed. This specification confirms the U-shaped relationship, but we report results
from the model that includes BMI squared but not BMI cubed because the confidence intervals
around predicted medical expenditures are much narrower.
6 This approach incorporates a linear first stage, which is most appropriate when the endogenous and mismeasured regressor is continuous. While it is not uncommon in applied research to employ IV methods that incorporate a linear first stage in cases where this regressor is discrete, the resulting coefficient estimate is not unbiased. If the regressor suffers only from nonclassical measurement error then the true effect will generally lie between the OLS and IV estimate in the case of a simple univariate regression (Black et al. 2000 ). When the regressor of interest is both endogenous and mismeasured, Frazis and Loewenstein (2003) demonstrate that the true effect lies within bounds applied to the IV estimate. An alternative approach is to specify the exact distribution of both the binary endogenous regressor and the outcome variable. Even if the distributional assumptions are not correct and the treatment effect estimate is biased, this estimator may still be preferred from a mean square error standpoint. Deb's treatment effects gamma model provides an estimator of this type that is appropriate for modeling skewed outcomes, such as medical expenditures (Deb, 2007). The estimation approach makes use of simulated maximum likelihood techniques to predict the impact of the treatment variable (obesity), which is assumed to follow a normal distribution, on an outcome variable (medical expenditures) generated from a gamma distribution (Deb and Trivedi, 2006a and 2006b). To test the sensitivity of our results to an alternative estimator that explicitly accounts for the discrete nature of the endogenous and mismeasured regressor, we re-estimated all of our models using the treatment effects gamma model. While the marginal effects of obesity we derived using this approach were very similar to those derived from the approach of Carrol et al. (1995) on all samples except the uninsured, we prefer the method of Carrol et al. (1995) because it produced more consistent medical expenditure predictions across the full range of the BMI distribution. 7 We obtained similar results using three other instrument sets: (1) BMI, BMI squared, and BMI cubed of the youngest child; (2) BMI and BMI squared of the youngest child and the BMI of the second youngest child; (3) BMI and BMI squared of the oldest child and the BMI of the second oldest child. All instrument sets have the same theoretical justification, but we prefer the BMI, BMI squared, and BMI cubed of the oldest child because there is a higher response rate to the height and weight questions for older children.
10
The impact of obesity on medical expenditures may vary across the distribution of
medical spending. Furthermore, the marginal impact on medical expenditures of an increase in
body weight is presumably greater for individuals of poorer health status with multiple chronic
conditions. To explore this possibility we estimate the conditional quantile treatment effect
(QTE) of obesity at different points in the medical expenditure distribution using Frolich and
Melly's (2008) implementation of the IV estimator of Abadie, Angrist, and Imbens (2002). In
this case the instrument must be discrete, so we use the obesity status of the oldest biological
child.8
All of our IV models control for the following regressors: gender, race/ethnicity (white,
black, Hispanic, other race), respondent age (indicators for whether age in years is 20-34, 35-44,
45-54, or 55-64), education level (no high school diploma, high school graduate, some college,
bachelor’s degree or higher), census region (northeast, midwest, south, or west), whether the
respondent lives in an MSA, household composition (number of household members age 0-5
years, 6-17, 18-64, and 65 or older), whether the survey information was self-reported as
opposed to proxy-reported, whether the individual was employed, fixed effects for year, the
gender of the oldest child, and the age of the oldest child in months.9 For sub-group estimates
the set of regressors is modified to drop irrelevant control variables.
8 Obesity is defined as a BMI at or above the 95th percentile for children of the same age and gender according to the 2000 CDC growth charts (U.S. D.H.H.S., 2000). 9 In addition to this standard set of regressors we also estimate models that include controls for health insurance status (private or public insurance), employer size (indicators of whether the firm contained less than 25, 25-100, 101-500, or over 500 employees), whether the individual belonged to a union, whether the individual was married, and net income per adult equivalent (total household income minus health insurance premiums divided by the square root of household size). Including these additional regressors has little effect on the estimated impact of BMI and obesity on medical expenditures.
11
Data: Medical Expenditure Panel Survey (MEPS)
The Medical Expenditure Panel Survey (MEPS) is a comprehensive, nationally
representative survey of the U.S. civilian non-institutionalized population that has been
conducted annually since 1996 and uses an overlapping panel design. Respondents are
surveyed about their medical care use and expenditures over the course of two years through
five interview rounds. In addition, information from the household is supplemented by
expenditure data collected directly from participants’ medical service providers and pharmacies
through a Medical Provider Component. We use data from the 2000-2005 waves of the MEPS,
and convert medical expenditures in each year to 2005 dollars.
We limit the sample to adults between the ages of 20 and 64 with biological children
between the ages of 11 years (132 months) and 20 years (240 months), and exclude pregnant
women. Relationship mappings contained in the restricted-use MEPS data allow us to identify
biological children, stepchildren, and foster children and thus ensure that only biological
children are used as instruments. We do not use information on children younger than age 11
because rates of non-response for their height and weight begin to exceed 14% and worsen as
the children get younger. Weight and height of each individual in the household is reported by
a single respondent, most often the wife/mother.10 We excluded eighteen individuals with
implausibly high BMIs (greater than 80), as well as two individuals with extremely high
reported medical expenditures in excess of $292,000, bringing our final estimation samples to
9,852 men and 13,837 women.
We use two primary measures of medical spending in our empirical models: total
medical expenditures and expenditures by all third party payers (typically, public and private
10 The exception to this is when all adult members of the household are present during the interview, in which case each adult will self-report their own height and weight.
12
insurers). These include all spending on inpatient events, ambulatory visits, prescription drugs,
and home health care services, but exclude spending on over-the-counter medications. Medical
expenditures by source of payment are collected directly from households as well as from the
household's medical care providers for every medical event. In addition, MEPS respondents are
asked whether their medical visits or other events are related to any specific medical conditions.
These responses are then professionally coded using the International Classification of
Diseases, Ninth Revision (ICD-9), and subsequently collapsed to into 259 clinically relevant
medical conditions using the Clinical Classification System (CCS) developed by the Agency for
Healthcare Research and Quality (AHRQ, 2007).
MEPS data are collected through a stratified multi-stage probability design, which we
account for in the calculation of the standard errors for our marginal effects. In particular, we
use the method of balanced repeated replications to estimate standard errors in our 2PM and the
method of bootstrapping with 500 replications in the IV QTE models. Both methods account
for clustering at the PSU-level, stratification, and weighting.
Results
Summary Statistics
Descriptive statistics for the main set of variables used in our empirical analysis are
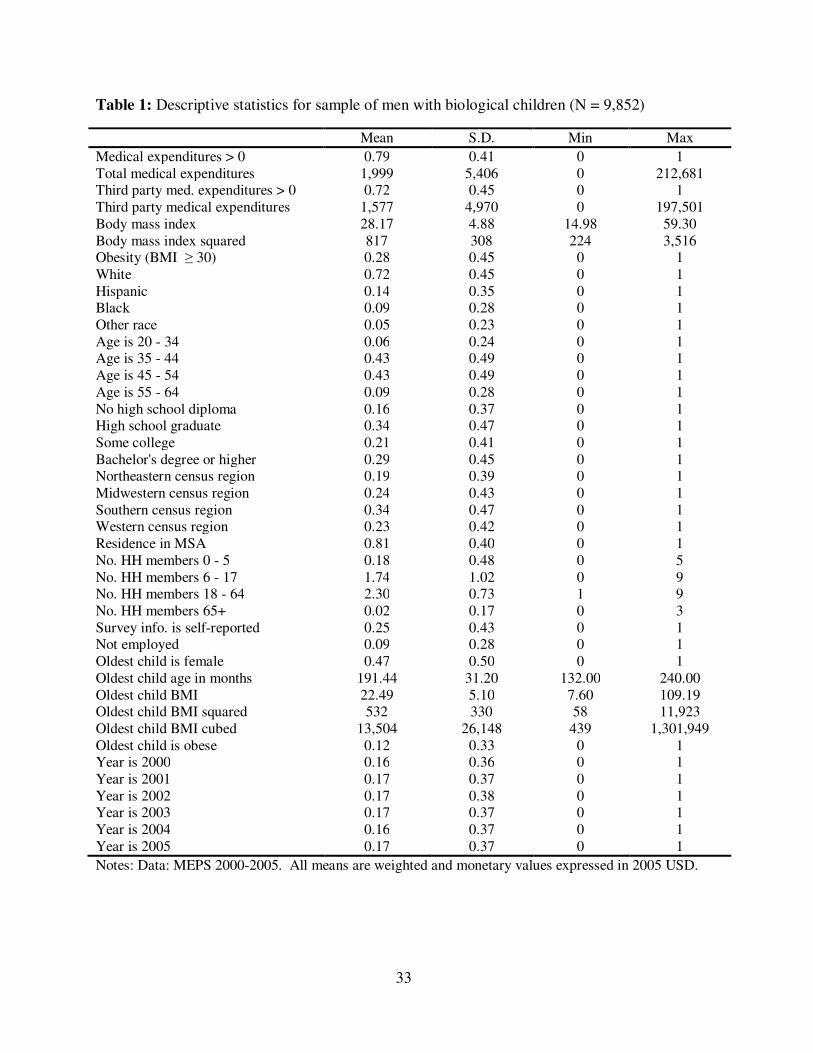
contained in Table 1 for men and Table 2 for women. (The samples are limited to adults with
biological children, as they are the only MEPS respondents for whom we can estimate the IV
model.) Among men, 79% incur some medical expenditures in the survey year, and the
unconditional average medical expenditures in that year was $1,999 (which includes zeros for
those with no expenditures) in 2005 dollars. Among women, 88% incurred some medical
13
expenditures, and the unconditional average medical expenditures in that year was $2,617.
These expenditures are lower than those for the comparable population of all men and women
(i.e. those both with and without biological children) (AHRQ, 2010). For both men and women,
approximately 78% of expenditures are covered by third party payers.
In our sample, the average BMI (calculated using self-reported or proxy-reported weight
and height) is 28.17 for men and 27.37 for women. For both the men and women in our sample,
the prevalence of obesity is 28%; this is significantly lower than the prevalence of obesity based
on measured weight and height in the NHANES 2007-08, which is 32.2% among men and
35.5% among women (Flegal et al., 2010). This gap is likely due to reporting error, although to
some extent it could be due to random variation in the samples. Tables 1 and 2 indicate that
25% of men and 83% of women self-report their weight; for the remainder, weight is proxy
reported by the primary respondent for the household.
Power and validity of instruments
We now present empirical evidence regarding the power and validity of the instruments.
Because we must test the power of our instrument set in both parts of the 2PM across seven
populations for two measures of weight status (BMI and obesity), we calculated 32 first stage F-
statistics. The values of the F statistics range from 31 to 281, with an average of 144. In each
case, the power of the instruments easily exceeds the conventional minimum standard of power
of F=10 (Stock, Wright, and Yogo, 2002). In addition, Hansen's test for over-identification is
consistent with the validity of our instruments (Hansen, 1982). In order to compute the Hansen
J-statistic we estimate linear IV models using GMM for both the first and second parts of the
2PM when the endogenous regressor is BMI and when it is an indicator for obesity. Because
we use three instruments (BMI, BMI squared, and BMI cubed of the adult's oldest biological
14
child) the J-statistic follows a chi-square distribution with 2 degrees of freedom.11 We fail to
reject the null hypothesis that the instruments are valid in each of the 32 tests.
Weight, obesity, and medical expenditures
Table 3 lists regression results for the entire sample (row 1) and various subpopulations:
e.g. men, women, white, nonwhite, those with private insurance, those with Medicaid, and the
uninsured. Each cell of the table lists the marginal effect (reflecting both parts of the two-part
model) and the standard errors of the marginal effect. The first two columns of Table 3 contain
the results of the non-IV two-part Gamma GLM models in which the key regressor is BMI
(column 1) or obesity (column 2). Column 1 indicates that weighing an additional unit of BMI
beyond the mean is associated with $51 higher annual expenditures for the pooled sample, $61
higher annual medical expenditures for men and $48 higher annual medical expenditures for
women. Column 2 indicates that obesity (relative to having a BMI less than 30) is associated
with $676 higher medical expenditures for the pooled sample, $582 higher medical
expenditures for men and $768 higher medical expenditures for women.
The middle two columns of Table 3 provide results from our IV 2PM. The point
estimates of the marginal effects on BMI and the indicator for obesity are considerably higher
for IV than non-IV. The standard errors are also much higher; as a result, the IV marginal
effects on BMI and the indicator variable for obesity are not statistically significant for men or
Medicaid recipients, despite being much larger than the non-IV estimates that are statistically
significant.
11 Letting r denote the total number of included and excluded instruments in the model, and q denote the number of included instruments (the right-hand-side exogenous variables), optimal GMM estimator for the parameter vector sets equal to zero q linear combinations of the r sample orthogonality conditions. As a result, there are r-q sample orthogonality conditions that are close to zero, but are not set equal to zero. Hansen (1982) shows that the test statistic based on the convergence of these orthogonality conditions to zero in probability has an asymptotic chi-square distribution with r-q degrees of freedom.
15
Column 3 of Table 3 indicates that weighing an additional unit of BMI beyond the mean
raises medical expenditures by $154 in the pooled sample, $82 for men (which is not
statistically significant), and $178 for women. Column 4 indicates that obesity (relative to
being non-obese) raises medical expenditures by $2,826 for the pooled sample, $1,171 for men
(which is not statistically significant), and $3,696 for women. A comparison of the results of
the IV and non-IV models indicates that the causal effect of obesity on medical expenditures is
four times higher than its association, for both the pooled sample and for women; in other
words, the previous literature has considerably underestimated the impact of obesity on medical
costs.
Results for specific subgroups indicate that the impact of obesity on medical costs is
higher for the uninsured ($3,496) than for those with private insurance ($2,624), but the
difference is not statistically significant (see Table 3, column 4). Despite the fact that the
association between obesity and medical expenditures is twice as large for whites ($827) as
non-whites ($414), the causal effect of obesity is nearly the same for the two groups ($2,773 for
whites versus $2,851 for non-whites).
The final two columns of Table 3 list results for a model of third-party medical
expenditures, which represent a possible pathway for obesity-related externalities. Specifically,
some of the medical costs of obesity may be borne by other enrollees in private insurance pools
or by taxpayers in the form of higher expenditures by the Medicaid program. The results in the
final column indicate that obesity is associated with substantial externalities: obesity raises
annual third-party medical expenditures by $2,499 in the pooled sample, which is 88% of the
effect of obesity on total medical costs. The impact of obesity on third-party medical
expenditures is significantly higher for women ($3,316) than men ($978, which is not
16
statistically significant). Despite the large point estimate of the impact of obesity on third-party
medical expenditures for the Medicaid population ($3,647), it is not statistically significant,
meaning that one cannot reject the null hypothesis that obesity does not raise medical costs in
this large public health insurance program.
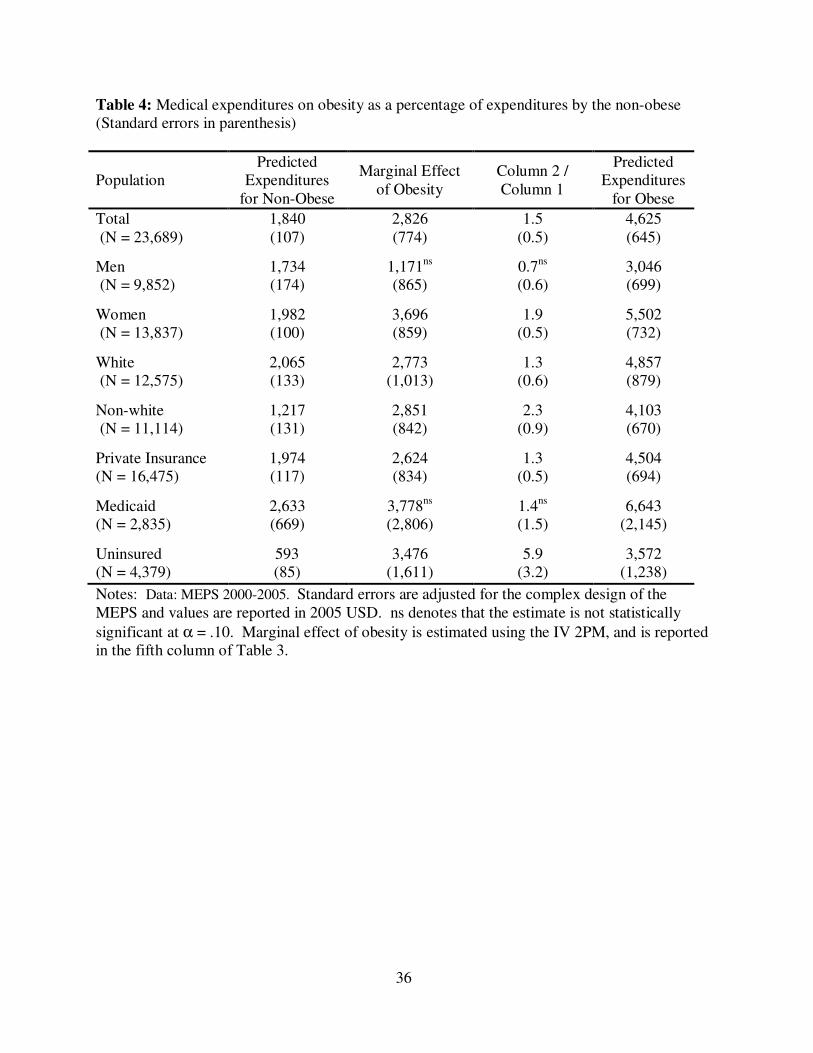
Table 4 contains the predicted per capita medical expenditures of the non-obese (column
1) and obese (column 4), with the marginal effect of obesity (the difference between the medical
expenditures of the non-obese and obese) estimated from the IV 2PM. For most sub-
populations, the obese have medical expenditures that are on the order of two to three times
higher than the non-obese. Furthermore, the increase in medical expenditures resulting from
obesity is larger than the total predicted expenditures for the non-obese; that is, in most
subgroups obesity causes a doubling of medical expenditures (the exception is for men, for
whom obesity raises medical expenditures by 70%). For the pooled sample, obesity raises
predicted medical expenditures by roughly 50%, from $1,840 to $2,826. For women, obesity
raises predicted medical expenditures by roughly 90%, from $1,982 to $3,696. The largest
relative increase in expenditure occurs among the uninsured, for whom obesity raises medical
expenditures by 490%, from $593 to $3,476.
While the marginal effects reported in Tables 3 and 4 are informative, they predict the
impact of changes in body weight at the mean (i.e. mean BMI or mean weight of all those who
are obese), which can be misleading if the relationship between weight and medical
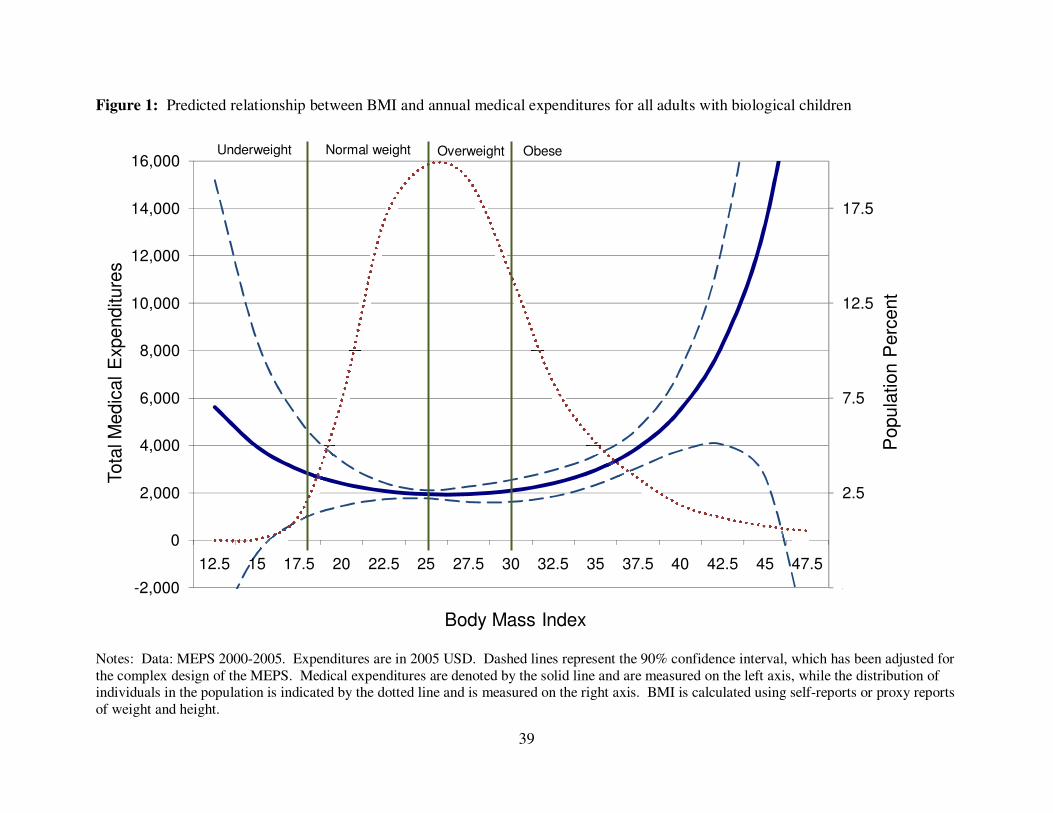
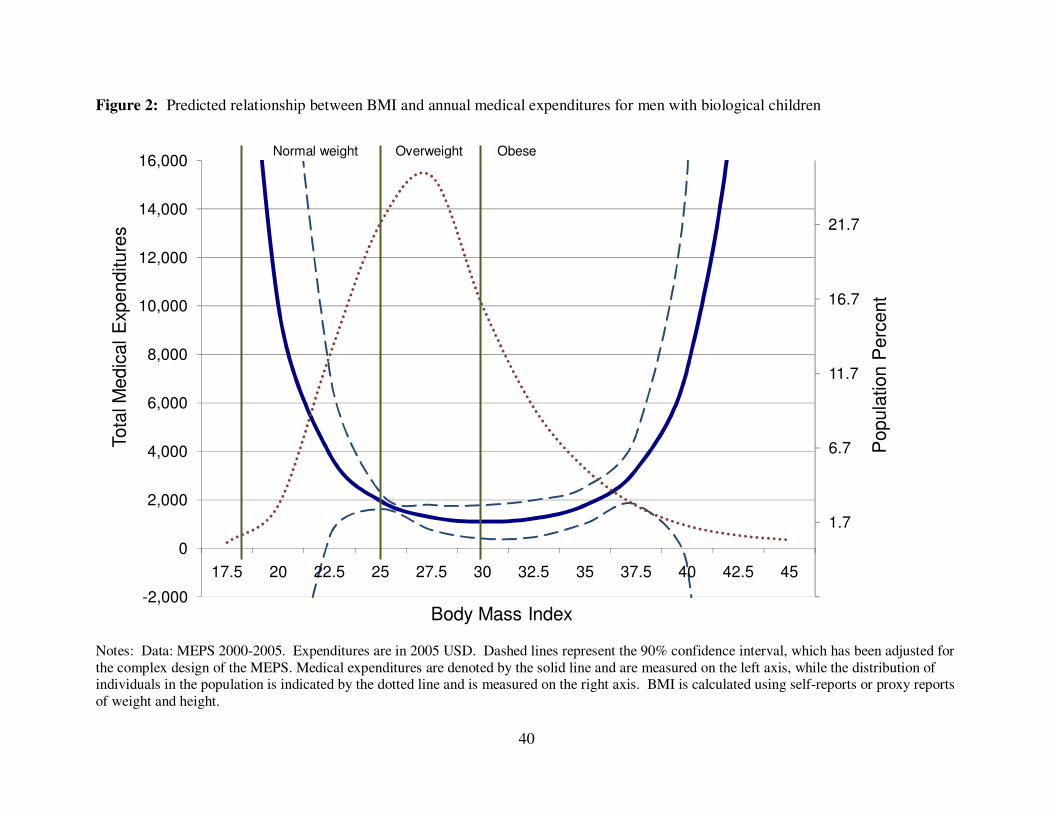
expenditures is nonlinear. We illustrate the nonlinear relationship between predicted medical
expenditures over the range of BMI (calculated using self-reports or proxy reports of weight and
height, and thus contain reporting error) for all adults (Figure 1), men (Figure 2), and women
(Figure 3), allowing for nonlinearity through the inclusion of BMI squared (in addition to BMI)
17
in our IV 2PM.12 Medical expenditures are denoted by the solid line and are measured on the
left axis, while the distribution of individuals in the population is indicated by the dotted line
and is measured on the right axis. Figures 1, 2, and 3 each reveal a clear U-shaped pattern in
which medical expenditures decline as BMI moves from the underweight to normal range, then
remain nearly constant throughout the normal and overweight range, then increase at an
increasing rate as BMI moves into the obese range and reaches more severe levels of obesity.
The pattern is asymmetric, with medical expenditures much higher for the extremely obese than
for the underweight. Moreover, the distribution of BMI shown in dotted lines indicates that a
very small percentage of the sample is underweight, which is associated with somewhat
elevated medical costs, but a large percentage (28%; see Tables 1 and 2) is obese, which is
associated with much higher medical costs. Figures 1-3 reveal that the large average effects of
obesity shown in Table 3 ($1,171 for men and $3,696 for women) are explained by relatively
few individuals with very high BMI that incur very high medical expenditures. Medical
expenditures don't increase rapidly with BMI until BMI reaches the range of 37-40, which is
approximately two standard deviations above the mean.
We next investigate whether the average treatment effect of obesity varies across the
distribution of total expenditures. Table 5 contains IV quantile treatment effect estimates for
men and women at five different points in the distribution: the 20th, 40th, 60th, 80th, and 90th
percentiles. Obesity has a small impact on expenditures for relatively healthy individuals with
low baseline expenditures; it raises medical expenditures by just $108 for men and $180 for
women at the 20th percentile of expenditures. However, obesity raises medical
12 We also estimated models that included BMI, BMI squared, and BMI cubed; these models also yielded a U-shaped pattern of medical care costs over BMI, but the standard errors were considerably higher, so we prefer the model that includes BMI and BMI squared but omits BMI cubed.
18
expenditures significantly at the upper end of the distribution. For example, at the 90th
percentile of annual medical expenditures, the IV estimate of the impact of obesity on medical
expenditures is $2,832 for men and $8,307 for women. At each of the five percentiles we
examine, the point estimates for women are higher than those for men, although the estimates
for women at the 60th and 80th percentiles of expenditures are not statistically significant.
Estimates of the aggregate direct medical costs of obesity for the U.S.
The literature on the cost of obesity is motivated in part by the desire to provide
estimates of the direct medical cost of obesity for the U.S. population and for public and private
payers. Our IV estimates allow us to provide estimates of the direct cost of obesity that are
arguably more accurate than those in the previous literature. Table 6 contains estimates of
annual medical costs (in 2005 USD) due to obesity based on our IV 2PM model that correspond
to the population of adults with biological children, which averaged 33.4 million people during
2000-2005. Our estimates indicate that the annual direct medical cost of obesity averaged $22.9
billion over the six year period, of which $20.6 billion (90%) was borne by third party payers.
In the most recent data, from 2005, the cost of obesity in this population was $25.5 billion, of
which $22.6 billion (89%) was borne by third party payers.
Finkelstein et al. (2009) estimate, using the 2006 MEPS, that the medical cost of obesity
for the full non-institutionalized U.S. population of adults aged 18 and older was $85.7 billion
in 2008 USD. We estimate that in 2005 the medical cost of obesity among the subpopulation of
adults with biological children was $25.5 billion. Under the assumption that the effect of
obesity in our subpopulation generalizes to the full non-institutionalized population of adults
aged 18 and older, we estimate that total medical costs for the full non-institutionalized
19
population of adults aged 18 and older was $185.7 billion in 2008 USD, which is roughly twice
the estimate of Finkelstein et al. (2009).13
To put our estimate of the costs of obesity in context, total U.S. health expenditures in
2005 for the non-institutionalized populations of adults sampled in the MEPS were $1.02
trillion (in 2005 dollars). Generalizing to the full U.S. population of non-institutionalized adults
and all categories of medical expenditures, our estimate of $168.4 billion (in 2005 dollars) in
medical costs attributable to obesity implies that 16.5% of U.S. national health expenditures is
spent treating obesity-related illness. In contrast, previous estimates of the association of obesity
with medical costs implied that obesity is responsible for 9.1% of annual medical spending
(Finkelstein et al., 2009).
Generalizability
Because of the instrument we use in our IV models, we are forced to limit our sample to
adults with a biological child between the ages of 11 and 20 years. As a result, our estimates of
obesity-attributable medical expenditures may not generalize to adults without children. To
explore differences between the two populations, we estimated the ordinary (non-IV) two-part
GLM version of our model for the full sample of 20-64 year old adults (i.e. unconditional on
number of children), as well as for the sample of 20-64 year old adults with biological children
between the ages of 11 and 20 years. Comparing non-IV estimates for the two groups may
yield information about the generalizability of results based on our IV sample to the general
population. On average, the medical care costs associated with obesity were approximately 20
percent larger for the full sample of adults. One possible explanation is that the obese who have
13 Using the MEPS sampling weights we determined that non-institutionalized population of adults 18 years of age and older was 222.6 million in 2005, whereas the subpopulation of adults with biological children was 33.7 million. Therefore, we first multiplied our subpopulation estimate by 222.6/33.7 to inflate it to the full population, and then multiplied by 1.10242 (obtained from the Bureau of Labor Statistics’ inflation calculator) to inflate it from 2005 to 2008 USD.
20
biological children are in relatively better health than the obese who are childless. Although it
is not possible to estimate IV models for the entire population of adults, the above comparison
suggests to us that the IV results for adults with children may underestimate the effect of obesity
on medical care costs for the general population of adults.
Falsification Tests
In order to test the validity of our results we perform two falsification tests. The logic
behind the first test is that there are some types of medical expenditures that obesity should not
affect. It is challenging to find a category of medical costs that is unrelated to obesity because
obesity has been linked by physicians to so many ailments (see, e.g., Dixon, 2010). However,
we are aware of no established medical relationship between obesity and epilepsy, brain
damage, and central nervous system disorders. Thus, our falsification test consists of using our
IV method to examine whether obesity appears to affect expenditures on those conditions.14 If
our IV method indicates that obesity affects expenditures on such conditions, then that would
suggest that the IV method lacks specificity and that the earlier results may be spurious.
We first estimate the non-IV two-part GLM models, and find that an additional unit of
BMI is associated with $87 higher spending on epilepsy, brain damage, and central nervous
system disorders. Given that a causal link is improbable, this result is consistent with non-IV
models suffering from omitted variables bias. In contrast, the results of our IV model indicate
that the causal effect of BMI on such expenditures is a statistically insignificant $5. Likewise,
the results of non-IV two-part GLM indicate that obesity is associated with an additional $1,232
in spending on epilepsy, brain damage, and central nervous system disorders, but the results of
our IV model indicate that the causal effect of obesity on such expenditures is much smaller
14 Expenditures on epilepsy, brain damage, and central nervous system disorders are identified as those with Clinical Classification System CCS codes of 83, 85, 93-95, 210, 211.
21
($83) and not statistically significant. Our interpretation of these results is that: 1) non-IV
models suffer from bias due to omitted variables; and 2) the IV model does not fail the
falsification test. Not failing a falsification test is of course different from proof that the model
is valid, but it does increase confidence that the earlier findings are not spurious but reflect a
true causal effect of obesity on total medical care expenditures.
Our second falsification test is to examine whether the weight of biologically unrelated
stepchildren appear to be powerful instruments for respondent weight. The logic is that
stepchildren and stepparents, lacking any biological relation, cannot be similar in weight
because of genetics so if the weights of the two are strongly correlated it must be for reasons
other than genetics, which suggests that the instrument may be invalid. There are 407 non-
elderly men and women in our original sample with stepchildren between the ages of 11 and 20.
When we conduct F-tests of the power of our instruments in this case, the test statistics range
between 2.1 and 4.1 and we cannot reject the null hypotheses that they are uncorrelated. In
contrast, the average F-statistic is 144 when we test for power on the sample of adults with
biological children and the null is strongly rejected in all cases.
Falsification tests are never definitive but can be helpful in demonstrating the sensitivity
and specificity of the model. The results of these two falsification tests are consistent with the
identifying assumptions of IV (i.e. the validity of the instrument) and are consistent with the
model being sensitive and specific.
22
Discussion
This paper provides the first estimates of the causal impact of obesity on medical costs.
The impact of obesity on annual medical costs (in 2005 dollars) is estimated to be $2,826 for
men and women pooled, $3,696 for women, and $1,171 for men (which is not statistically
significant). These averages are driven by relatively few individuals with very high BMI and
very high medical expenditures.
Our IV model indicates that the causal effect of obesity on medical costs is significantly
higher than the correlation of obesity with medical costs reported in the previous literature. We
find that the effect of obesity on medical care costs is $3,115, which is roughly twice the
estimate of $1,429 in Finkelstein et al. (2009); both estimates are in 2008 dollars.15 This
paper’s estimate of the national medical care costs of obesity-related illness is $185.7 billion,
which is slightly more than twice the estimate of $85.7 billion by Finkelstein et al. (2009)16;
both estimates are in 2008 dollars. The results of this paper suggest that 16.5% of U.S. national
health expenditures are spent treating obesity-related illness, which is considerably higher than
the previous estimate of 9.1% (Finkelstein et al., 2009).
Two important differences should be kept in mind when comparing our paper to the
earlier literature (e.g. Finkelstein et al., 2009). First, this paper compares the obese to the non-
15 Specifically, the IV estimate of the impact of obesity on medical costs for men and women combined is $2,826 in 2005 dollars (Table 3); adjusting from 2005 dollars to 2008 dollars requires multiplying by 1.10242 (according to the Bureau of Labor Statistics’ inflation calculator), which results in the final estimate of $3,115 in 2008 dollars. 16 Finkelstein et al. (2009) also provide estimates of the medical care costs of obesity that are based on data from the 2006 National Health Expenditure Accounts which, unlike MEPS, includes the institutionalized population and a wider array of health-related expenditures such as over-the-counter medicines. They multiply the fraction of total spending attributable to obesity from the MEPS by the total spending in NHEA, on the assumption that the percentage of medical costs due to obesity is the same for institutionalized and non-institutionalized populations. Because the NHEA covers a wider array of expenditures and the sicker institutionalized population, this results in a higher estimate of the aggregate medical costs of obesity: $147 billion in 2008 dollars. We focus in this paper on the MEPS data and thus compare our results to the MEPS results of Finkelstein et al. (2009).
23
obese (which includes the healthy weight and the overweight), whereas Finkelstein et al. (2009)
compares the obese to the healthy-weight. (The models used in this paper do not include an
indicator variable for overweight because we lack additional instruments for additional
categories of weight classification.) It is reasonable to combine the healthy weight and
overweight in this context, as the health care costs of the two groups are similar (see Figures 1-
3) and the overweight do not have higher mortality risk than the healthy-weight (see e.g. Mehta
and Chang, 2009, and Flegal et al., 2005). A second important difference to keep in mind is
that the estimates in this paper are based on adults with at least one biological child (because of
our IV strategy), whereas the previous literature typically uses all adults. As a result, the
individuals in our sample may be healthier on average.
One might ask whether our estimates of the causal effect of obesity on medical costs are
implausibly high. Physicians have documented biological pathways through which obesity
raises the risk and severity of type 2 diabetes, sleep apnea, hypertension, myocardial infarction,
Dixon, 2010). Part of the challenge in identifying an appropriate falsification test was finding
conditions for which there was no medical literature linking it to obesity. Estimates of the
impact of obesity on medical care costs would be suspect if they were not substantial. There are
at least two reasons that our estimates are higher than the associations reported in the previous
literature. First, previous estimates likely suffer omitted variables bias; e.g., obese people may
also be disadvantaged and lack access to medical care. Second, reporting error in weight and
height may bias previous estimates, and this reporting error is addressed by our IV method.
Our finding that the causal impact of obesity on medical care costs is greater than
previously appreciated has important implications. For example, many estimates of the cost-
24
effectiveness of anti-obesity interventions are based on published estimates of the association of
weight with medical care costs, which underestimate the causal effect. For example, cost-
effectiveness estimates for the school-based interventions Coordinated Approach to Child
Health or CATCH (Brown et al., 2007) and Planet Health (Wang et al., 2003) are based on the
estimates of the association of weight with medical costs reported in Gorsky et al. (1996) and
Oster et al. (1999). As a result, the cost-effectiveness of CATCH and Planet Health have likely
been underestimated.
Likewise, the results of this paper are informative regarding the cost effectiveness of
government programs to reduce and prevent obesity. Trasande (2010) recently estimated the
cost-effectiveness of government spending to reduce childhood obesity using the estimates of
adult medical expenditures attributable to obesity from Finkelstein et al. (2009). To the extent
that our IV estimates are more accurate estimates of the impact of obesity on medical care costs,
Trasande (2010) understates the cost-effectiveness of government spending to reduce childhood
obesity.
The results of this paper also indicate that insurance companies spend more treating
obesity-related illness than was previously thought, and thus there may be a better business case
for insurance companies to cover effective treatments for obesity (such as prescription drugs for
weight loss (e.g. Xenical and Meridia), bariatric surgery, and nutrition counseling) than was
previously appreciated.
The externalities associated with obesity that operate through insurance are also greater
than previously appreciated. Our estimates indicate that obesity raises third-party spending on
medical care by $2,499 (this includes spending by private insurers as well as public insurers
25
such as Medicaid). One approach to limiting such externalities in private health insurance is to
vary insurance premia based on weight, although this also limits the extent of risk-pooling.
The magnitude of externalities is also relevant for government policy because “External
costs provide one of the strongest economic justifications for government interventions…”
(Zohrabian and Philipson, 2010, p. 2468). The estimates in this paper imply that the economic
case for government intervention to reduce obesity-related externalities has been
underestimated. Some have noted that one way to internalize some of the external costs of
obesity is to charge the obese higher premiums for public health insurance such as Medicare
(Finkelstein and Zuckerman, 2008), although that may not be consistent with the redistributive
goals of the programs.
Bhattacharya and Sood (2007, 2010) point out that the obesity externalities that operate
through pooling of risk in insurance result in deadweight loss only to the extent that they distort
decisionmaking. (The pooling of obesity-related medical costs always results in a transfer from
the non-obese to the obese, but this may or may not entail deadweight loss to society.17) There
are two major ways that the obesity externality that operates through insurance distorts
consumer decisionmaking. First, consumers may buy less insurance because the pooling of
obesity-related medical care costs raises insurance premia. The literature on the premium
elasticity of demand for health insurance finds that consumers are modestly sensitive to the
price of insurance (e.g. Gruber and Washington, 2005; Marquis and Long, 1995), which is
consistent with some deadweight loss through this channel. The second way in which the
obesity externality distorts consumer decisionmaking is through moral hazard; risk pooling
ensures that the obese do not pay the full medical care costs of their obesity so they may invest
17 Because obesity is partly genetic, some may consider a certain amount of risk pooling through health insurance to be desirable.
26
less in weight loss or preventing weight gain. Using methods of instrumental variables that
exploit state Medicaid expansions, Rashad and Markowitz (2010) and Bhattacharya et al. (2009)
find evidence that having health insurance (i.e. the extensive margin) raises BMI. Bhattacharya
et al. (2009) find weaker evidence that the generosity of insurance (i.e. the intensive margin)
raises BMI. Bhattacharya and Sood (2007) calculate that the welfare loss in the U.S. associated
with this second channel totals $150 per capita (in 1998 dollars). In summary, the obesity
related externality that operates through insurance seems to be not just a transfer from the non-
obese to the obese, but to also impose deadweight loss on society by distorting decisions about
purchases of insurance and about optimal investment in weight loss and prevention of weight
gain.
Future directions for research include finding additional natural experiments that affect
weight but do not directly affect medical care expenditures. These would shed light on the
generalizability of the results generated from the natural experiment we exploit. It would also
be useful to test explanations for differences between subsamples in the impact of obesity on
medical expenditures. For example, our point estimate of the impact of obesity on medical
expenditures is higher for Medicaid recipients ($3,778) and the uninsured ($3,496) than those
with private insurance coverage ($2,624); it would be useful to know whether this is due to
differences in the health impact of obesity across the three groups or due to differences in access
to medical care.
This paper has several limitations. The first limitation that should be discussed in any
paper that uses IV concerns the validity of the instrument. Our identifying assumption is that
the weight of a biological relative is strongly correlated with the respondent’s weight, but
uncorrelated with residual medical care costs. A large literature in behavioral genetics confirms
27
that there is a strong genetic component to weight, and that any similarity in weight due to
shared environment is so small as to be undetectable. However, other threats to the validity of
the instrument are that the genes that affect weight may also affect other things that could
directly affect residual medical care costs (pleitropy), and the genes that affect weight may lie
next to genes that directly affect residual medical care costs (proximity matters because genes
are inherited in blocks). We are unable to test whether these are problems in the current
context, and can only follow the previous literature (e.g. Smith et al., 2009; Kline and Tobias
2008; Cawley, 2004) in acknowledging them as possible limitations of the instrument.
Although our instrument passes the standard statistical tests for power and over-identification,
there is no way to prove the validity of any instrument; one can only fail to reject the null
hypothesis that the instrument is valid.
Like the previous literature, this paper uses BMI, which has been criticized as a measure
of fatness because it does not distinguish fat from muscle (Burkhauser and Cawley, 2008).
Ideally, we use more accurate measures of fatness such as percent body fat, but only the
components of BMI (weight and height) are available in the MEPS. Another limitation is that
weight and height are self-reported or proxy-reported instead of measured. Although the IV
method helps eliminate the influence of reporting error, measured values would be preferable.
Another limitation is that we can implement our IV method only for adults with biological
children, and thus caution should be used when generalizing our results to the entire population
of U.S. adults.
Despite these limitations, this paper makes an important contribution by providing the
first estimates of the causal impact of obesity on medical care costs, which are significantly
higher than the estimates of the association that are published in the previous literature, and thus
28
have important implications for insurance, government policy, and estimates of the cost-
effectiveness of anti-obesity interventions.
29
Works Cited Abadie, A., J. Angrist and G. Imbens. 2002. "Instrumental Variables Estimates of the Effect of
Subsidized Training on the Quantiles of Trainee Earnings." Econometrica 70:91-117. Agency for Healthcare Research and Quality (AHRQ). 2007. Clinical Classification Software
(CCS) for ICD-9-CM Fact Sheet. http://www.hcup-s.ahrq.gov/toolssoftware/ccs/ccsfactsheet.jsp. Accessed July 22, 2010.
Agency for Healthcare Research and Quality (AHRQ). 2010. MEPSnet/HC Query Tool. http://www.meps.ahrq.gov/mepsweb/data_stats/MEPSnetHC.jsp. Accessed July 22, 2010.
Bhattacharya J, Bundorf K, Pace N, Sood N. 2009. “Does health insurance make you fat?” NBER Working Paper #15163.
Bhattacharya, J., and N. Sood. 2007. “Health Insurance and the Obesity Externality.” Advances
in Health Economics and Health Services Research, 17:279–318. Bhattacharya, J., and N. Sood. 2010. “Who Pays for Obesity?” Unpublished manuscript,
Stanford University. Black, D.A., M.C. Berger, and F.A. Scott. 2000. "Bounding Parameter Estimates with
Nonclassical Measurement Error.", Journal of the American Statistical Association, 95(451):739-748.
Bound, John, Charles Brown, and Nancy Mathiowetz. 2002. “Measurement Error in Survey Data.” In Handbook of Econometrics, volume 5, eds. James Heckman and Ed Leamer, 3705-3843. New York: Springer-Verlag.
Brown III HS, Pérez A, Li Y-P, Hoelscher DM, Kelder SH, Rivera R. 2007. “The cost-effectiveness of a school-based overweight program.” Int J Behav Nutr Phys Act. 4:47.
Burkhauser, Richard V., and John Cawley. 2008. “Beyond BMI: The Value of More Accurate Measures of Fatness and Obesity in Social Science Research.” Journal of Health
Economics, 27(2): 519-529. Burkhauser, Richard V., John Cawley, and Maximilian D. Schmeiser. 2009. “The Timing of
the Rise in U.S. Obesity Varies With Measure of Fatness.” Economics and Human
Biology, 7(3): 307-318. Carrol, R., D. Ruppert, and L. Stefanski. 1995. Measurement Error in Nonlinear Models.
Chapman and Hall: New York, NY. Cawley J. 2004. “The impact of obesity on wages.” Journal of Human Resources. 39(2):451-
74. Cawley, John and Richard V. Burkhauser. 2006. “Beyond BMI: The Value of More Accurate
Measures of Fatness and Obesity in Social Science Research.” National Bureau of
Economic Research Working Paper #12291. Deb, P. 2007. STATA ado file and documentation for TREATREG2, version 1.1.1. Deb, P. and P. Trivedi. 2006a. "Maximum Simulated Likelihood Estimation of a Negative
Binomial Regression Model with Multinomial Endogenous Treatment." The STATA
Journal 6(2):246-255. Deb, P. and P. Trivedi. 2006b. "Specification and Simulated Likelihood Estimation of a Non-
Normal Treatment-Outcome Model with Selection: Application to Health Care Utilization." Econometrics Journal 9:30-331.
Dixon, John B. 2010. “The effect of obesity on health outcomes.” Molecular and Cellular
Endocrinology 316 (2010) 104–108.
30
Finkelstein E.A., Trogdon J.G., Cohen J.W., Dietz W. 2009. “Annual medical spending attributable to obesity: payer- and service-specific estimates.” Health Affairs Web Exclusive. July 27 2009.
Finkelstein, E.A., I.C. Fiebelkorn, and G. Wang. “National Medical Spending Attributable To Overweight And Obesity: How Much, And Who’s Paying?” Health Affairs, W3- 219.
Finkelstein, Eric A., Ian C. Fiebelkorn, and Guijing Wang. 2004. “State-level estimates of annual medical expenditures attributable to obesity.” Obesity Research, 12(1): 18-24.
Finkelstein, Eric A., Laurie Zuckerman L. 2008. The fattening of America. NJ: John Wiley & Sons, Inc.
Flegal KM, Carroll MD, Kuczmarski RJ, Johnson CL. 1998. “Overweight and obesity in the United States: prevalence and trends, 1960-1994.” Int J Obes Relat Metab Disord. 22(1): 39-47.
Flegal KM, Carroll MD, Ogden C, Curtin LR. 2010. “Prevalence and Trends in Obesity Among US Adults, 1999-2008.” Journal of the American Medical Association, 303(3):235-241.
Flegal, K., B. Graubard, D. Williamson, and M. Gail. 2005. "Excess Deaths Associates with Underweight, Overweight, and Obesity." Journal of the American Medical Association, 293(15):1861-1867.
Frazis, H. and M. Loewenstein. 2003. "Estimating Linear Regressions with Mismeasured, Possibly, Endogenous, Binary Explanatory Variables." Journal of Econometrics, 117:151-178.
Frolich, M. and D. Melly. 2008. "Estimation of Quantile Treatment Effects with STATA." Working Paper. University of Mannheim, July 22nd.
Gorsky RD, Pamuk E, Williamson DF, Shaffer PA, Koplan JP. The 25-year health care costs of women who remain overweight after 40 years of age. Am J Prev Med. 1996;12(5): 388–394.
Grilo, Carlos M. and Michael F. Pogue-Geile. 1991. “The Nature of Environmental Influences on Weight and Obesity: A Behavioral Genetic Analysis.” Psychological Bulletin 110(3): 520-537.
Gruber, Jonathan and Ebonya Washington. 2005. “Subsidies To Employee Health Insurance Premiums And The Health Insurance Market,” Journal of Health Economics, 24(2): 253-276.
Haberstick, Brett C., Jeffery M. Lessem, Matthew B. McQueen, Jason D. Boardman, Christian J. Hopfer, Andrew Smolen, and John K. Hewitt. 2010. “Stable Genes and Changing Environments: Body Mass Index Across Adolescence and Young Adulthood.” Behavioral Genetics, 40(4): 495-504.
Hanson, L. 1982 "Large Sample Properties of Generalized Method of Moments Estimators." Econometrica 50:1029-1054.
Hardin, J., H. Schmiediche, and R. Carroll. 2003. “Instrumental Variables, Bootstrapping, and Generalized Linear Models.” The STATA Journal, 3(4): 351-360.
Hill, S and G. Miller. 2009. "Health Expenditure Estimation and Function Form: Applications of the Generalized Gamma and Extended Estimating Equations Models." Health
Economics Published Online: May 11 2009, DOI: 10.1002/hec.1498. Jones, A. 2000. “Health Econometrics” Chapter 6 in Anthony J. Culyer and Joseph P.
Newhouse, editors, Handbook of Health Economics, Volume 1A, pp. 265-336.
31
Kline, Brendan, and Justin L. Tobias. 2008. “The wages of BMI: Bayesian analysis of a skewed treatment-response model with nonparametric endogeneity.” Journal of Applied
Econometrics, 23: 767-793. Komlos, John, and Marek Brabec. 2010. “The Trend of Mean BMI Values of US Adults, Birth
Cohorts 1882-1986 Indicates that the Obesity Epidemic Began Earlier than Hitherto Thought.” NBER Working Paper #15862.
Kortt, Michael A., Paul C. Langley, and Emily R. Cox. 1998. “A Review of Cost-of-Illness Studies on Obesity.” Clinical Therapeutics, 20(4): 772-779.
Machlin, S. and D. Woodwell. 2009. "Healthcare Expenses for Chronic Conditions among Non-Elderly Adults: Variations by Insurance Coverage, 2005–06 (Average Annual Estimates)", MEPS Statistical Brief #243. Agency for Healthcare Research and Quality, Rockville, MD.
Maes, Hermine H.M., M. C. Neale, and L. J. Eaves. 1997. “Genetic and Environmental Factors in Relative Body Weight and Human Adiposity.” Behavior Genetics 27(4): 325-351.
Markowitz, Sara and Inas Rashad Kelly. 2009/2010. “Incentives in Obesity and Health Insurance,” Inquiry, 46:418-432.
Marquis, M. Susan, and Stephen H. Long. 1995. “Worker Demand for Health Insurance in the Nongroup Market.” Journal of Health Economics, 14(1): 47–63.
Medicare Payment Advisory Commission (MedPAC). 2008. Data Book: Health Care Spending
and the Medicare Program, June 2008. Washington, D.C. Mehta, Neil K. and Virginia W. Chang. 2009. “Mortality Attributable to Obesity Among
Middle-Aged Adults in the United States.” Demography, 46(4): 851-872. Nelson MC, Gordon-Larsen P, North KE, Adair LS. 2006. “Body mass index gain, fast food
and physical activity: effects of shared environment over time.” Obesity 14:701–709. Oster G, Thompson D, Edelsberg J, Bird AP, Colditz GA. Lifetime health and economic
benefits of weight loss among obese persons. Am J Public Health. 1999;89(10):1536–42.
Plankey, M., Stevens, J., and P. Rust. 1997. “Prediction Equations Do Not Eliminate Systemic Error in Self-Reported Body Mass Index”, Obesity Research, 5(4): 308-314.
Price, R. Arlen, and Irving I. Gottesman. 1991. "Body Fat in Identical Twins Reared Apart: Roles for Genes and Environment." Behavior Genetics 21(1): 1-7.
Roux, Larissa and Cam Donaldson. 2004. “Economics and Obesity: Costing the Problem or Evaluating Solutions?” Obesity Research, 12(2): 173-179.
Seidell, J., W. Verschuren, E. van Leer, and D. Kromhout. 1996. "Underweight, Overweight, and Mortality." Archives of Internal Medicine, 156(9): 958-963.
Shiell A, Gerard K, Donaldson C. 1987. “Cost of illness studies: an aid to decision-making?” Health Policy, 8:317–23.
Smith, George D., Jonathan AC Sterne, Abigail Fraser, Per Tynelius, Debbie A. Lawlor, and Finn Rasmussen. 2009. “The association between BMI and mortality using offspring BMI as an indicator of own BMI: large intergenerational mortality study.” British
Medical Journal, 339:b5043. Sorensen, Thorkild I. A. and Albert J. Stunkard. 1993. “Does Obesity Run in Families Because
Of Genes? An Adoption Study Using Silhouettes as a Measure of Obesity.” Acta
Psychiatrica Scandanavia 370 supplement: 67-72.
32
Stock, J.H., J.H. Wright, and M. Yogo. 2002. "A Survey of Weak Instruments and Weak Identification in Generalized Method of Moments." Journal of Business and Economic
Statistics 20(4): 518-529. Stunkard, A. J., T. I. A. Sorensen, C. Hanis, T. W. Teasdale, R. Chakraborty, W. J. Schull, and
F. Schulsinger. 1986. “An Adoption Study of Human Obesity.” New England Journal
of Medicine 314(4): 193-198. Thorpe, Kenneth E., Curtis S. Florence, David H. Howard, and Peter Joski. 2004. “The Impact
Of Obesity On Rising Medical Spending.” Health Affairs, 23(6): W4480-W4486. Trasande, Leonardo, Yinghua Liu, George Fryer, and Michael Weitzman. 2009. “Effects Of
Childhood Obesity On Hospital Care And Costs, 1999–2005.” Health Affairs 28(4): w751–w760.
Trasande, Leonardo. 2010. “How Much Should We Invest In Preventing Childhood Obesity?” Health Affairs, 29(3): 372-378.
U.S. Department of Health and Human Services. 2002. 2000 CDC growth charts for the United States: methods and development. Vital and National Health Statistics, Series 11, No. 246, May.
U.S. Department of Health and Human Services. The Surgeon General’s Vision for a Healthy
and Fit Nation. Rockville, MD: U.S. Department of Health and Human Services, Office of the Surgeon General, January 2010.
Villanueva, Elmer V. 2001. “The Validity of Self-reported Weight in US adults: A Population-based Cross-Sectional Study”, BMC Public Health, vol. 1 no. 11.
Vogler, G. P., T. I. A. Sorensen, A. J. Stunkard, M. R. Srinivasan, and D. C. Rao. 1995. “Influences of Genes and Shared Family Environment on Adult Body Mass Index Assessed in an Adoption Study by a Comprehensive Path Model.” International
Journal of Obesity 19: 40-45. Wang LY, Yang Q, Lowry R, Wechsler H. 2003. “Economic analysis of a school-based
obesity prevention program.” Obesity Research, 11:1313-24. Wardle, Jane, Susan Carnell, Claire MA Haworth, and Robert Plomin. 2008. “Evidence for a
strong genetic influence on childhood adiposity despite the force of the obesogenic environment.” Am J Clin Nutr, 87:398 – 404.
Zohrabian, Armineh and Tomas J. Philipson. 2010. “External Costs of Risky Health Behaviors Associated with Leading Actual Causes of Death in the U.S.: A Review of the Evidence and Implications for Future Research.” Int. J. Environ. Res. Public Health 2010, 7, 2460-2472.
33
Table 1: Descriptive statistics for sample of men with biological children (N = 9,852)
Notes: Data: MEPS 2000-2005. All means are weighted and monetary values expressed in 2005 USD.
Mean S.D. Min Max
Medical expenditures > 0 0.79 0.41 0 1 Total medical expenditures 1,999 5,406 0 212,681 Third party med. expenditures > 0 0.72 0.45 0 1 Third party medical expenditures 1,577 4,970 0 197,501 Body mass index 28.17 4.88 14.98 59.30 Body mass index squared 817 308 224 3,516 Obesity (BMI ≥ 30) 0.28 0.45 0 1 White 0.72 0.45 0 1 Hispanic 0.14 0.35 0 1 Black 0.09 0.28 0 1 Other race 0.05 0.23 0 1 Age is 20 - 34 0.06 0.24 0 1 Age is 35 - 44 0.43 0.49 0 1 Age is 45 - 54 0.43 0.49 0 1 Age is 55 - 64 0.09 0.28 0 1 No high school diploma 0.16 0.37 0 1 High school graduate 0.34 0.47 0 1 Some college 0.21 0.41 0 1 Bachelor's degree or higher 0.29 0.45 0 1 Northeastern census region 0.19 0.39 0 1 Midwestern census region 0.24 0.43 0 1 Southern census region 0.34 0.47 0 1 Western census region 0.23 0.42 0 1 Residence in MSA 0.81 0.40 0 1 No. HH members 0 - 5 0.18 0.48 0 5 No. HH members 6 - 17 1.74 1.02 0 9 No. HH members 18 - 64 2.30 0.73 1 9 No. HH members 65+ 0.02 0.17 0 3 Survey info. is self-reported 0.25 0.43 0 1 Not employed 0.09 0.28 0 1 Oldest child is female 0.47 0.50 0 1 Oldest child age in months 191.44 31.20 132.00 240.00 Oldest child BMI 22.49 5.10 7.60 109.19 Oldest child BMI squared 532 330 58 11,923 Oldest child BMI cubed 13,504 26,148 439 1,301,949 Oldest child is obese 0.12 0.33 0 1 Year is 2000 0.16 0.36 0 1 Year is 2001 0.17 0.37 0 1 Year is 2002 0.17 0.38 0 1 Year is 2003 0.17 0.37 0 1 Year is 2004 0.16 0.37 0 1 Year is 2005 0.17 0.37 0 1
34
Table 2: Descriptive statistics for sample of women with biological children (N = 13,837)
Notes: Data: MEPS 2000-2005. All means are weighted and monetary values expressed in 2005 USD.
Mean S.D. Min Max
Medical expenditures > 0 0.88 0.32 0 1 Total medical expenditures 2,617 6,565 0 220,924 Third party med. expenditures > 0 0.80 0.40 0 1 Third party medical expenditures 2,050 6,199 0 218,323 Body mass index 27.37 6.42 14.50 78.3 Body mass index squared 790 410 210 6,131 Obesity (BMI ≥ 30) 0.28 0.45 0 1 White 0.66 0.47 0 1 Hispanic 0.15 0.35 0 1 Black 0.14 0.34 0 1 Other race 0.06 0.23 0 1 Age is 20 - 34 0.11 0.31 0 1 Age is 35 - 44 0.52 0.50 0 1 Age is 45 - 54 0.34 0.47 0 1 Age is 55 - 64 0.03 0.18 0 1 No high school diploma 0.16 0.37 0 1 High school graduate 0.34 0.47 0 1 Some college 0.25 0.43 0 1 Bachelor's degree or higher 0.24 0.43 0 1 Northeastern census region 0.19 0.39 0 1 Midwestern census region 0.24 0.43 0 1 Southern census region 0.35 0.48 0 1 Western census region 0.22 0.42 0 1 Residence in MSA 0.81 0.39 0 1 No. HH members 0 - 5 0.16 0.44 0 5 No. HH members 6 - 17 1.72 1.00 0 9 No. HH members 18 - 64 2.12 0.80 1 9 No. HH members 65+ 0.03 0.20 0 3 Survey info. is self-reported 0.83 0.37 0 1 Employed 0.25 0.43 0 1 Oldest child is female 0.49 0.50 0 1 Oldest child age in months 191.38 31.09 132.00 240.00 Oldest child BMI 22.66 5.22 6.70 109.19 Oldest child BMI squared 541 321 45 11,923 Oldest child BMI cubed 13,820 23,206 2,803 1,301,949 Oldest child is obese 0.13 0.34 0 1 Year is 2000 0.15 0.36 0 1 Year is 2001 0.16 0.37 0 1 Year is 2002 0.18 0.38 0 1 Year is 2003 0.17 0.38 0 1 Year is 2004 0.17 0.38 0 1 Year is 2005 0.17 0.37 0 1
35
Table 3: Marginal effects of BMI and obesity on annual medical expenditures (Standard errors in parenthesis)
Population Non-IV (Total Exp.) IV (Total Exp.) IV (Third Party Exp.)
BMI Obesity BMI Obesity BMI Obesity
Total (N = 23,689)
51 (9)
676 (118)
154 (37)
2,826 (774)
136 (33)
2,499 (679)
Men (N = 9,852)
61 (12)
582 (133)
82ns (55)
1,171ns (865)
70ns (49)
978ns (771)
Women (N = 13,837)
48 (11)
768 (157)
178 (36)
3,696 (859)
157 (32)
3,316 (756)
White (N = 12,575)
64 (14)
827 (182)
152 (48)
2,773 (1,013)
138 (41)
2,527 (863)
Non-white (N = 11,114)
32 (11)
414 (143)
162 (47)
2,851 (842)
136 (45)
2,464 (831)
Private Insurance (N = 16,475)
56 (12)
684 (141)
143 (41)
2,624 (834)
131 (36)
2,398 (735)
Medicaid (N = 2,835)
49 (22)
839 (445)
193ns (127)
3,778ns (2,806)
186ns (133)
3,647ns (2,882)
Uninsured (N = 4,379)
24 (9)
310 (146)
195 (113)
3,496 (1,611)
--- ---
Notes: Data: MEPS 2000-2005. Standard errors are adjusted for the complex design of the MEPS and values are reported in 2005 USD. ns denotes that the estimate is not statistically
significant at α = .10.
36
Table 4: Medical expenditures on obesity as a percentage of expenditures by the non-obese (Standard errors in parenthesis)
Population Predicted
Expenditures for Non-Obese
Marginal Effect of Obesity
Column 2 / Column 1
Predicted Expenditures
for Obese
Total (N = 23,689)
1,840 (107)
2,826 (774)
1.5 (0.5)
4,625 (645)
Men (N = 9,852)
1,734 (174)
1,171ns (865)
0.7ns (0.6)
3,046 (699)
Women (N = 13,837)
1,982 (100)
3,696 (859)
1.9 (0.5)
5,502 (732)
White (N = 12,575)
2,065 (133)
2,773 (1,013)
1.3 (0.6)
4,857 (879)
Non-white (N = 11,114)
1,217 (131)
2,851 (842)
2.3 (0.9)
4,103 (670)
Private Insurance (N = 16,475)
1,974 (117)
2,624 (834)
1.3 (0.5)
4,504 (694)
Medicaid (N = 2,835)
2,633 (669)
3,778ns (2,806)
1.4ns (1.5)
6,643 (2,145)
Uninsured (N = 4,379)
593 (85)
3,476 (1,611)
5.9 (3.2)
3,572 (1,238)
Notes: Data: MEPS 2000-2005. Standard errors are adjusted for the complex design of the MEPS and values are reported in 2005 USD. ns denotes that the estimate is not statistically
significant at α = .10. Marginal effect of obesity is estimated using the IV 2PM, and is reported in the fifth column of Table 3.
37
Table 5: Marginal (treatment) effect of obesity at different points in the distribution of total annual medical expenditures (Standard errors in parenthesis)
Percentile Men Women
20th 108 (27)
180 (96)
40th 281 (86)
460 (204)
60th 532
(151) 1,258ns (3,954)
80th 1,321 (537)
3,429ns (4,326)
90th 2,832 (1444)
8,307 (4,903)
Notes: Data: MEPS 2000-2005. Standard errors are adjusted for the complex design of the MEPS and values are reported in 2005 USD. ns denotes that the estimate is not statistically
significant at α = .10.
38
Table 6: Annual medical cost of obesity for non-elderly adults with biological children (Billions of 2005 USD; 90% confidence interval in parenthesis)
Year Total Expenditures Third Party Exp. Population (millions)
2000 16.9
(9.2, 24.6) 15.1
(7.7, 22.4)
30.8
2001 20.8
(11.3, 30.4) 18.7
(9.7, 27.7)
33.2
2002 24.1
(13.3, 34.8) 21.5
(11.2, 31.7)
35.0
2003 23.6
(12.6, 34.7) 21.2
(10.7, 31.7)
34.2
2004 26.8
(15.2, 38.3) 24.3
(13.1, 35.4)
33.7
2005 25.5
(14.2, 36.9) 22.6
(11.9, 33.3)
33.7
'00 - '05 Average 22.9
(12.8, 33.1) 20.6
(10.9, 30.2) 33.4
Notes: Data: MEPS 2000-2005. Confidence intervals are adjusted for the complex design of the
MEPS.
39
Figure 1: Predicted relationship between BMI and annual medical expenditures for all adults with biological children
Notes: Data: MEPS 2000-2005. Expenditures are in 2005 USD. Dashed lines represent the 90% confidence interval, which has been adjusted for the complex design of the MEPS. Medical expenditures are denoted by the solid line and are measured on the left axis, while the distribution of individuals in the population is indicated by the dotted line and is measured on the right axis. BMI is calculated using self-reports or proxy reports of weight and height.
Figure 2: Predicted relationship between BMI and annual medical expenditures for men with biological children
Notes: Data: MEPS 2000-2005. Expenditures are in 2005 USD. Dashed lines represent the 90% confidence interval, which has been adjusted for the complex design of the MEPS. Medical expenditures are denoted by the solid line and are measured on the left axis, while the distribution of individuals in the population is indicated by the dotted line and is measured on the right axis. BMI is calculated using self-reports or proxy reports of weight and height.
-3.3
1.7
6.7
11.7
16.7
21.7
-2,000
0
2,000
4,000
6,000
8,000
10,000
12,000
14,000
16,000
17.5 20 22.5 25 27.5 30 32.5 35 37.5 40 42.5 45
Tota
l M
edic
al
Expenditure
s
Body Mass Index
Popula
tion
Perc
ent
Obese Overweight Normal weight
41
Figure 3: Predicted relationship between BMI and annual medical expenditures for women with biological children
Notes: Data: MEPS 2000-2005. Expenditures are in 2005 USD. Dashed lines represent the 90% confidence interval, which has been adjusted for the complex design of the MEPS. Medical expenditures are denoted by the solid line and are measured on the left axis, while the distribution of individuals in the population is indicated by the dotted line and is measured on the right axis. BMI is calculated using self-reports or proxy reports of weight and height.