+ All Categories
Home > Documents > The Medical Center of Louisiana is a member of the LSU Health Sciences Center – Health Care

The Medical Center of Louisiana is a member of the LSU Health Sciences Center – Health Care

Date post: 30-Dec-2015
Category:
Upload: colorado-morse
View: 22 times
Download: 3 times
Share this document with a friend
Description:
Trauma Services FISCAL YEAR STATISTICS 2005 ANNUAL REPORT. The Medical Center of Louisiana is a member of the LSU Health Sciences Center – Health Care Services Division, and is affiliated with LSU and Tulane Schools of Medicine. Table of Contents. 2. - PowerPoint PPT Presentation
Popular Tags:
41
The Medical Center of Louisiana is a member of the LSU Health Sciences Center – Health Care Services Division, and is affiliated with LSU and Tulane Schools of Medicine. Trauma Services FISCAL YEAR STATISTICS 2005 ANNUAL REPORT
Transcript

The Medical Center of Louisiana is a member of the LSU Health Sciences Center – Health Care

Services Division, and is affiliated with LSU and Tulane Schools of Medicine.

Trauma ServicesFISCAL YEAR STATISTICS

2005ANNUAL REPORT

Table of Contents

2

I. Introduction Trauma Program Representatives ..........................................3 Trauma Program Overview....................................................4

II. 2005 Fiscal Year Report – Patient Statistics Patient Demographics ............................................................9 Fatal Trauma ..........................................................................10 Parish of Injury Vs. Residence...............................................11 Patient Triage Summary ........................................................12 Mechanism of Injury..............................................................13 Severity of Injury ...................................................................14 Patient Transportation ............................................................15 Injury Severity Score (ISS) by Mechanism of Injury ...........16 Etiology By Intent..................................................................17 Intentional Injuries .................................................................18 Trauma Activation Levels by Injury Severity Score .............19 Vehicular Trauma ..................................................................20 Emergency Center Trauma Admissions by Day Of Week ....21 Emergency Center Trauma Admissions by Shift...................22 Emergency Center Major Trauma Patient Turnaround Time.23

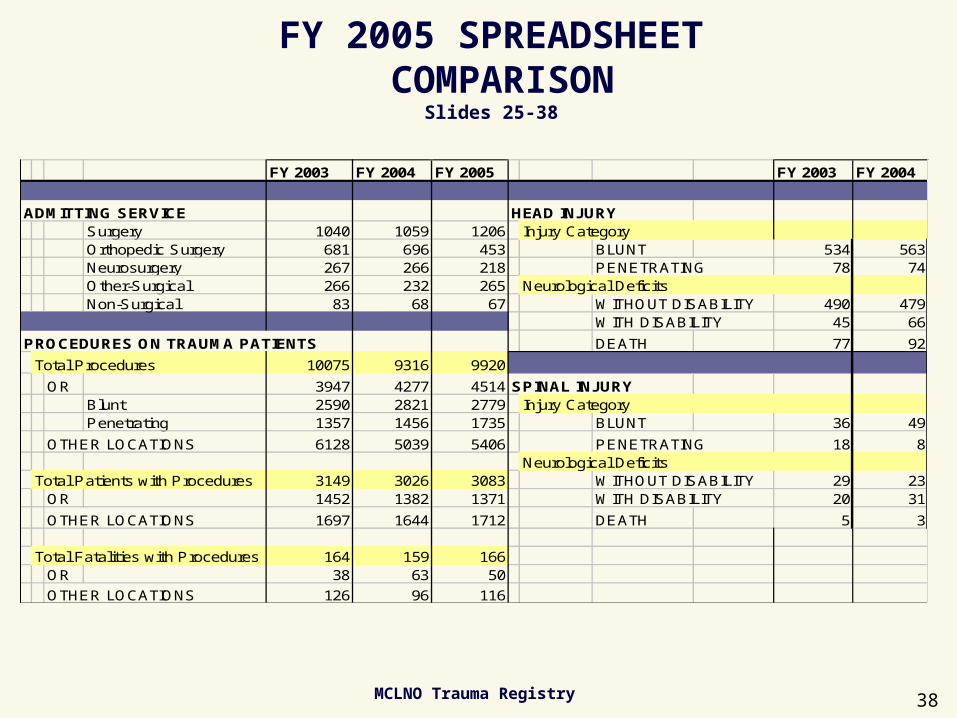
Emergency Department Disposition ......................................24 Admitting Service ..................................................................25 Procedures on Trauma Patients..............................................26 Head Injury ............................................................................27 Spinal Injury...........................................................................28 Hospital Discharge Disposition .............................................29 Eye & Organ Procurement.....................................................30 Drug & Alcohol Results for Trauma Activations ..................31 Reimbursement Summary......................................................32 FY 2003 Spreadsheet Comparison

- Slides 9-10 ...............................................................33 - Slides 11-14 .............................................................34 - Slides 15-16 .............................................................35 - Slides 17-19 .............................................................36 - Slides 21-24 .............................................................37 - Slides 25-38 .............................................................38 - Slides 29-32 .............................................................39

III. Other American College of Surgeons Certificate of Verification....40 Louisiana Department of Health & Hospitals License ..........41

TRAUMA PROGRAM REPRESENTATIVESNorman McSwain, MD, Trauma Program Director

Trauma Program Manager

Eileen Mederos, RN

Trauma Coordinators

Cynthia Armstrong, RN

Sharon Carter, RN

Mary Anne Ernst, RN

Bridget Schumert, RN

Donna Welsh, RN

Robin Whitfield, RN

Trauma Program Secretary

Angel Johnson

Trauma Registry

Med. Rec. Services Dir., Carroll Johnson, RHIT

Admin. Manager, Miriam Roberts, RHIT, CTR Data Manager, Vicki Holloway, RHIA, CCS

General Surgical Services

Alan Marr, MD

Sharon Weintraub, MD

Orthopedic Services

Barry Riemer, MD

Phyllis Carboni, RN

Emergency Medicine Services

Kathleen Hubbell, MD

Jullette Saussy, MD

Associate Dir., Trauma Program

John Hunt, III, MD, MPH

Director, Neurosurgical Trauma

Deepak Awasthi, MD

Director, Emergency Medicine

Jorge Martinez, MD, JD

Director, Orthopedic Trauma

Kyle Dickson, MD

Director, Trauma Rehabilitation

Gary Glynn, MD

Physical Medicine and Rehab

Mary Daut, MD

Diagnostic Radiology

Erick Blaudeau, MD

Neuro-Surgical Services

Michael Carey, MD

Anesthesiology

Alan Kaye, MD

Pediatric Intensivist

Olugbenga Akingbola, MD

Gary Duhon, MD

Edwin Frieberg, MD

Nursing Administrators

Emergency Services

Olander Holloway, RN, JD

Perioperative, Critical Care Services

Betty J. Adams, MN, RN

Case Management

Charlotte Godchaux, MN, RN

New Orleans Health Department

Director, Kevin Stephens, Sr. , MD, JD

Perioperative Services Joan Heck, MSN, RN

Emergency Center Kevin Beck, BSN, RN

Surgical Intensive Care Unit Mary Luce, RN

Surgical Intermed. Care Unit Vicki Hirsch, BSN, RN

Neuro Science Center Frida Orrego, RN

Medical Intensive Care Unit Dan Kiff, BSN, RN

Operating Suites Kevie Richardson, RN

Blood Bank Cynthia Eicher, MHS, MT

Anesthesia Jay Buras, CRNA

Respiratory Therapy Nelson Page, RRT

Physical/Occupational Therapy Anna Smith, PT

Continued Care Coordinator Karen Chabert, RN

University Hospital-ED Gaynell Grieg, RN

3

TRAUMA PROGRAM OVERVIEW

The Trauma Program at the Medical Center of Louisiana operates under the guidance of

the Director of Trauma, with the 24-hour support of the departments of Surgery, Emergency Medicine,

Orthopedics, Neurosurgery, Radiology, Pathology, all Surgical subspecialties, Blood Bank, Nursing, and

Allied Health personnel. The Trauma Program includes full-time in-house faculty who manage and

supervise resuscitation and surgical interventions in all cases. On April 9, 1996 the American College of

Surgeons verified Charity Hospital as a Level I Trauma Center. This verification is for three years, and

the Trauma Center successfully underwent re-verification March 5, 1999 and again in March 2002.

With over 4,000 trauma patients a year, this makes Charity’s Level I Trauma Center one of the busiest

verified inner-city centers in the country. Subsequently, the Trauma Center has been licensed and

designated as a Primary Trauma Center by the Division of Health and Human Resources according to

state statute.

4

Since its inception, Trauma Team members have consistently filled a leadership role in the

development and implementation of optimal trauma care for the State of Louisiana. Responsibilities are

held within the following committees and organizations:

• American Association for Parenteral and Enteral Nutrition

• Louisiana State Committee on Trauma

• American Association for the Surgery of Trauma • Louisiana State Highway Safety Council

• American College of Surgeons Committee on Trauma • Metropolitan Safety Council

• American Nurses Association • Society of Trauma Nurses

• National and International Surgical, Orthopedic, and NeuoSurg Assoc.

• American Trauma Society

• Eastern Association for the Surgery of Trauma

• New Orleans Surgical Society

• Emergency Nurses Association

• Orleans Parish Medical Society

• Gubernatorial Ad Hoc Committee on Trauma 5

The in-house Trauma Team consists of an attending trauma surgeon, chief surgical resident,

and additional surgical residents at other levels. The surgical faculties are trauma-committed surgeons

with special interest and expertise in trauma care. The Trauma Team evaluates, resuscitates and

definitively treats all major traumas.

In addition to the medical support, trauma office staff are fundamental to Charity’s trauma

services progress, execution and evaluation. Working in conjunction with the Director of the Trauma

Program, the Trauma Program Manager and the Coordinators are responsible for the organization of

services necessary for an interdisciplinary approach in the delivery of optimal care to the trauma

patient. Clinical monitoring, concurrent performance improvement, and community outreach and

prevention programs are but a few of the services implemented by the Trauma Program personnel.

While the main goal of the Trauma Service is optimal patient care, the service also provides

leadership in education and research. There are on-going educational programs for nursing, residents

and students in the form of attending rounds and operative supervision as well as didactic discussions

and conferences. Trauma surgical faculty members are nationally and internationally recognized for

their expertise in research, and research work done at the Trauma Center has been presented many

times at the national and international levels.

6

Trauma Team member education is pre-eminent for the Trauma Services. Outreach and

educational efforts occur simultaneously. The Trauma Program has become a well-recognized

educational resource and has not only been the preceptor of students from many colleges and

universities in our own community, but has received medical personnel from all over the world wanting

to interact with the Trauma Center. A strong part of the Trauma Program’s outreach is providing

education to all care providers. This is accomplished through a variety of mechanisms, including

monthly orientation of new hospital personnel to their responsibilities within the Trauma Center,

monthly interdisciplinary trauma care conferences, and continuing staff in-services, workshops, and

updates on the optimal care of the trauma patient to prehospital care providers, physicians and nurses.

In addition, the Trauma Committee members organize and teach trauma education courses. These

courses include but are not limited to, Advanced Trauma Life Support, Advanced Cardiac Life Support,

Trauma Nurse Core Curriculum, and Advanced Trauma Care for Nurses.

A Level I Trauma Center has the highest level of response for the major trauma patient, as

well as trauma related research, teaching and outpatient care programs. The Trauma Team requires

the cohesive medical approach of physicians, nurses, technicians and ancillary staff to assure that the

trauma patient is evaluated, resuscitated and treated expeditiously and appropriately. In addition, the

program continues to be active in allied initiatives with one of the most active trauma injury prevention

programs in the country, to our rehabilitation with the overall objective to continually reduce deaths

and disabilities from trauma. 7

MEDICAL CENTER OF LOUISIANAMEDICAL CENTER OF LOUISIANACHARITY HOSPITALCHARITY HOSPITAL

TRAUMA PROGRAMTRAUMA PROGRAMANNUAL REPORTANNUAL REPORT

Patient StatisticsPatient Statistics

Fiscal Year

2005

PATIENT DEMOGRAPHICSn = 3907n = 3907

RACE

White33% Black

62%

Asian1%

Other4%

AGE

Elderly3%

Adults89%

Peds8%

GENDER

Female23%

Male77%

Trauma is endemic in young Afro-American males in Orleans Parish. These data mirror national data which demonstrate that trauma is a disease of young people

and the #1 cause of death in people less than age 44.

(Pediatrics: 0-12; Adults: 13-64; Elderly 65+)

FY 2005

MCLNO Trauma Registry 9

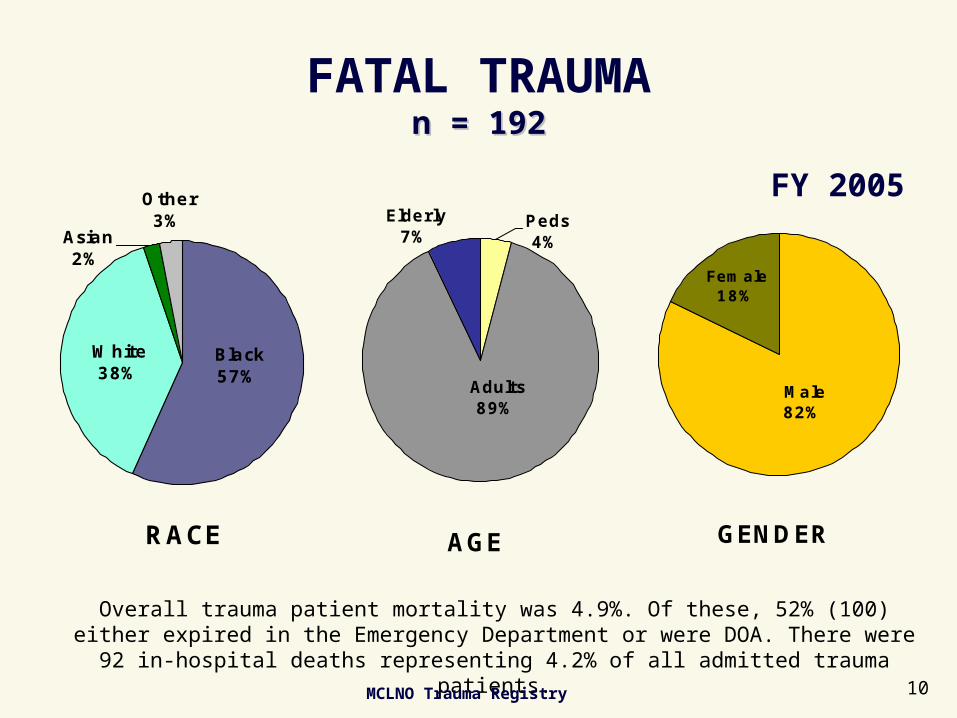
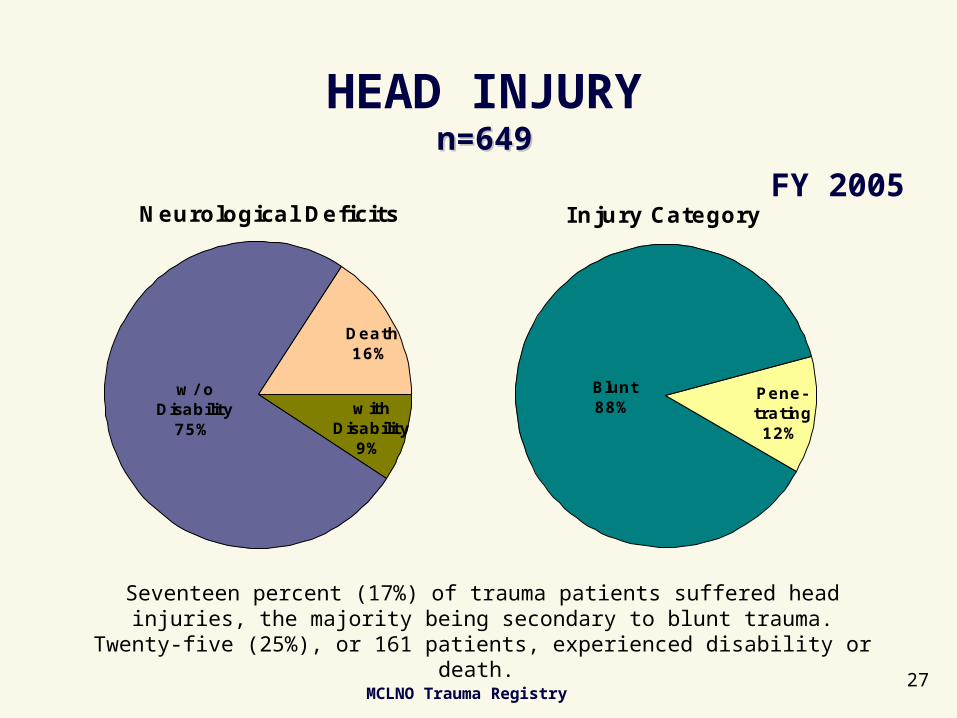
FATAL TRAUMAn = 192n = 192

RACE

White38%

Black57%

Asian2%

Other3%

AGE

Elderly7%

Peds4%

Adults89%

GENDER

Female18%

Male82%

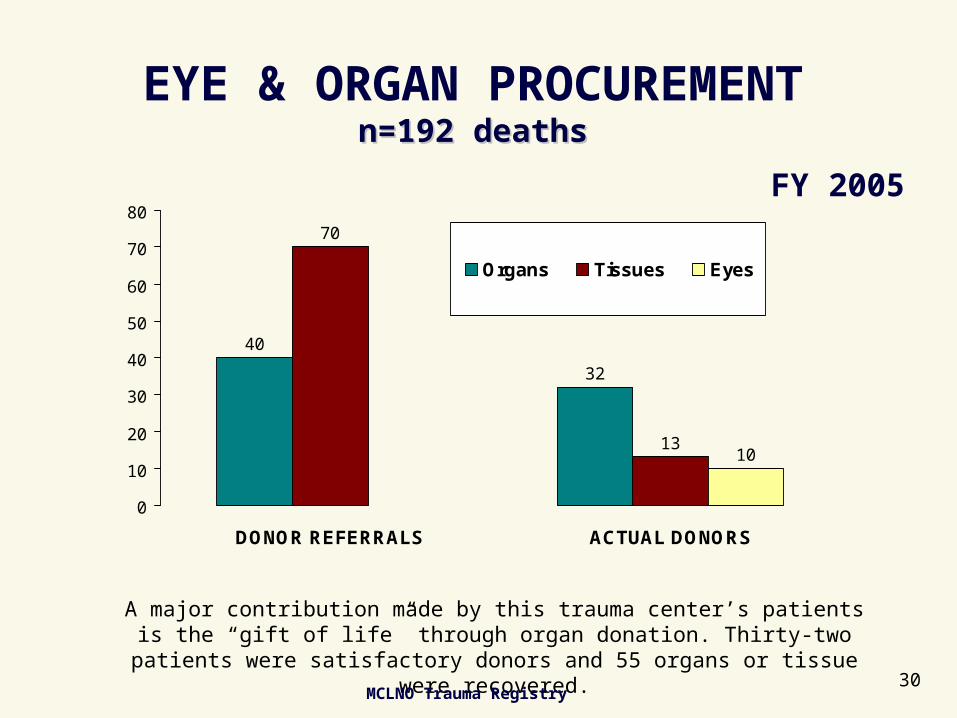
Overall trauma patient mortality was 4.9%. Of these, 52% (100) either expired in the Emergency Department or were DOA. There were 92 in-hospital deaths

representing 4.2% of all admitted trauma patients.

FY 2005

MCLNO Trauma Registry 10

PARISH OF INJURY vs. RESIDENCEn=3907n=3907

46% of patients treated were residents of parishes other than Orleans. Patients who were known to be injured in outside parishes accounted for 10% of all evaluations

and/or admissions. The actual number increased from 417 last year to 585 this year. This increase is the result of recent contractual agreements with outside parishes.

Parish of I njury

Plaque-mines1%

Unknown32%

Other3%Wash./ St.

Tamm2%

Saint Bernard

1%

J efferson8%

Orleans53%

Parish of Residence

Plaque-mines1%

Unknown1%

Out of State3%

Wash./ St. Tamm

5%

Other14%

St. Bernard4%J efferson

16%

Orleans56%

FY 2005

MCLNO Trauma Registry 11

PATIENT TRIAGE SUMMARYn=2092n=2092

True +43%

False +39%

False -13%

True -5%

True + {Predicted Major Trauma/Actual Major Trauma

True – {Predicted Non-Major Trauma/Actual Non-Major Trauma

OVERTRIAGE=False + {Predicted Major Trauma/Actual Non-Major Trauma

UNDERTRIAGE=False – {Predicted Non-Major Trauma/Actual Major Trauma

FY 2005

MCLNO Trauma Registry12

MECHANISM OF INJURYn=3907n=3907

Blunt71%

Burn1%

Penetrating28%

Blunt trauma accounts for 71% of all trauma cases seen by this facility, which is designated as the official Orleans Parish Trauma Center. Penetrating trauma

accounts for 28% which has increased by 5% since FY 2004.

FY 2005

MCLNO Trauma Registry13

SEVERITY OF INJURYn=3907n=3907

Major & Non-Fatal

50%

Major & Fatal5%

Minor45%

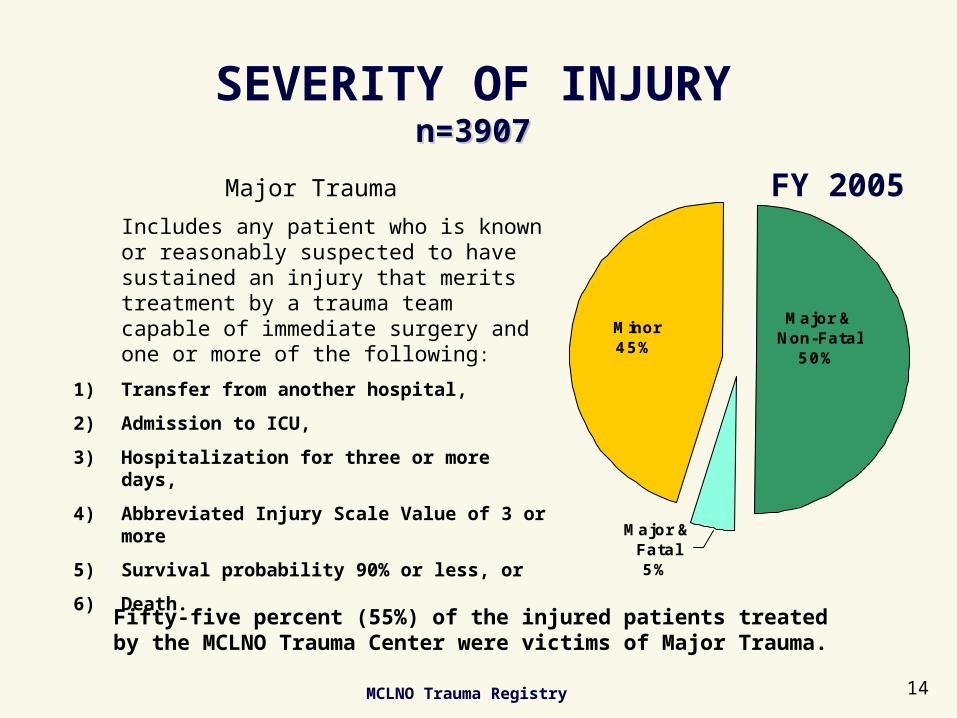
Fifty-five percent (55%) of the injured patients treated by the MCLNO Trauma Center were victims of Major Trauma.

Major Trauma

Includes any patient who is known or reasonably suspected to have sustained an injury that merits treatment by a trauma team capable of immediate surgery and one or more of the following:

1) Transfer from another hospital,

2) Admission to ICU,

3) Hospitalization for three or more days,

4) Abbreviated Injury Scale Value of 3 or more

5) Survival probability 90% or less, or

6) Death.

FY 2005

MCLNO Trauma Registry 14

PATIENT TRANSPORTATIONn=3907n=3907

OverallTransports

Inter-hospitaln=57615%

Pre-hospitaln=2623

67%

Self13%

Police3%

Other2%

PrehospitalTransport

West Jeff6%

Guardian1%

Other EMS 6%

East J eff5%

Acadian5%

NOHD72%

Lifeguard2%

Air3%

I nterhospitalTransport

NOHD9%

Other EMS21%

AMR1%

EmergyStat4%

Air EMS11%

AMED2%Acadian

EMS52%

Seventy-nine percent (79%) of patients transported were brought to MCLNO via an ambulance. The New Orleans Health Department ambulance service, was

responsible for 72% of the pre-hospital care.

FY 2005

MCLNO Trauma Registry15

INJURY SEVERITY SCORE (ISS)BY MECHANISM OF INJURY

n=1500n=1500**

167

86

118

149

278

167

665454

48

159154

0

50

100

150

200

250

300

ISS 1-5 ISS 6-10 ISS 11-15 ISS 16-20 ISS 21-25 ISS >25

# o

f P

ati

en

ts in

Th

ou

sa

nd

s

BLUNT

PEN

The injury severity score (ISS) is a way of assigning severity of injury numerically for standardization and outcome prediction. ISS is related linearly with mortality, and an ISS >= 15 is considered major trauma.

*Activated Patients who were either

admitted or died in the ED.

FY 2005

MCLNO Trauma Registry 16

ETIOLOGY BY INTENTn=3907n=3907

Accidental66%Assault

31%

Undetermined2%

Self-Inflicted1%

Thirty-one percent (31%) of all patients seen and treated were victims of intentional assault. Violence prevention remains a top priority of the Trauma

Center’s Outreach and Community Activity Program.

FY 2005

MCLNO Trauma Registry17

INTENTIONAL INJURIESn=1296n=1296

Stab24%

Other25%

Firearm48%

Self-inflicted3%

vs. Another97%

Where the data are known, 97% of intentional injuries were the result of an assault and 3% were self inflicted. Gunshot and stabbings continue to be the

major cause of intentional injuries.

FY 2005

MCLNO Trauma Registry 18

TRAUMA ACTIVATION LEVELSBY INJURY SEVERITY SCORE

n=1502n=1502**

Injury Severity Score

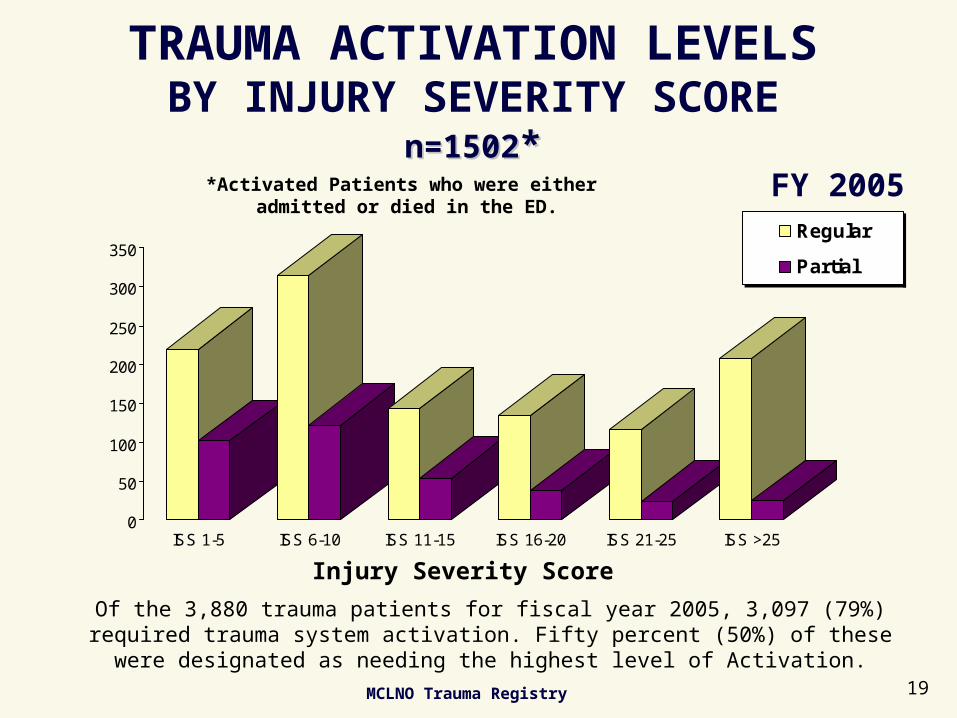
Of the 3,880 trauma patients for fiscal year 2005, 3,097 (79%) required trauma system activation. Fifty percent (50%) of these were designated as needing the

highest level of Activation.

0

50

100

150

200

250

300

350

ISS 1-5 ISS 6-10 ISS 11-15 ISS 16-20 ISS 21-25 ISS >25

Regular

Partial

*Activated Patients who were either admitted or died in the ED.

FY 2005

MCLNO Trauma Registry 19

VEHICULAR TRAUMA

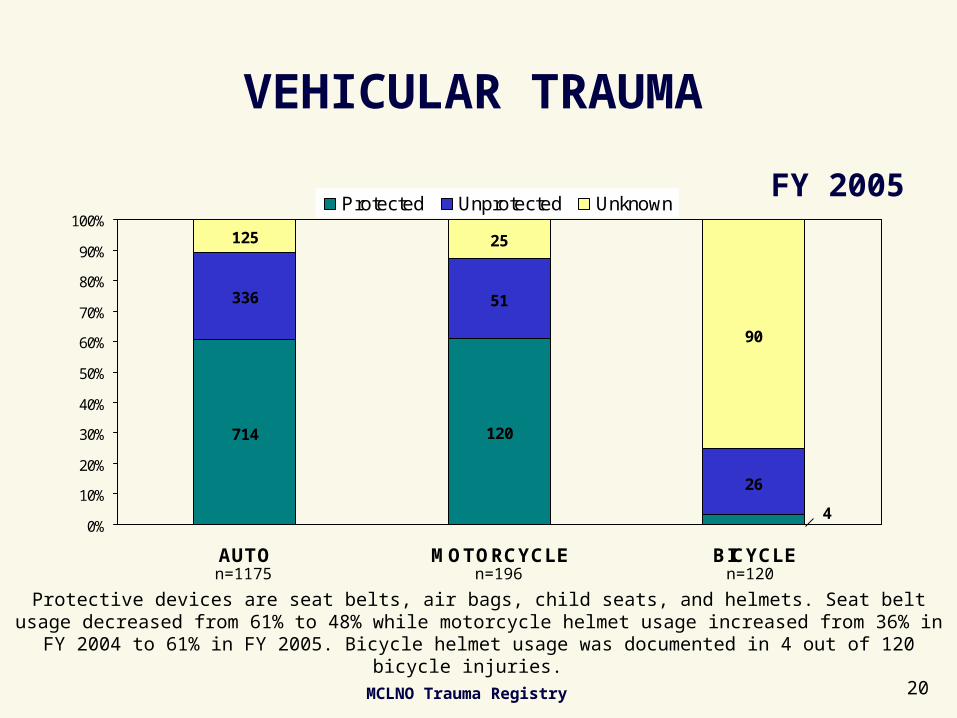
Protective devices are seat belts, air bags, child seats, and helmets. Seat belt usage decreased from 61% to 48% while motorcycle helmet usage increased from 36% in FY 2004 to 61% in FY

2005. Bicycle helmet usage was documented in 4 out of 120 bicycle injuries.

714 120

336 51

26

125 25

90

40%

10%

20%

30%

40%

50%

60%

70%

80%

90%

100%

AUTO MOTORCYCLE BICYCLE

Protected Unprotected Unknown

n=1175 n=196 n=120

FY 2005

MCLNO Trauma Registry 20

EMERGENCY CENTER TRAUMA ADMISSIONSby Day of Week

n=3907n=3907

692

548490

528484

539

626

0

100

200

300

400

500

600

700

SUN MON TUE WED THU FRI SAT

DAY

Weekends remain the most active period, with Saturday, Sunday, and Monday accounting for 48% of the total weekly admissions. (Day

is 0800 to 0759.)

FY 2005

MCLNO Trauma Registry 21

EMERGENCY CENTER TRAUMA ADMISSIONSby Shiftn=3512n=3512

982

1603

1140

0

200

400

600

800

1000

1200

1400

1600

1800

0801 - 1600 1601 - 2400 0001 - 0800

SHIFT

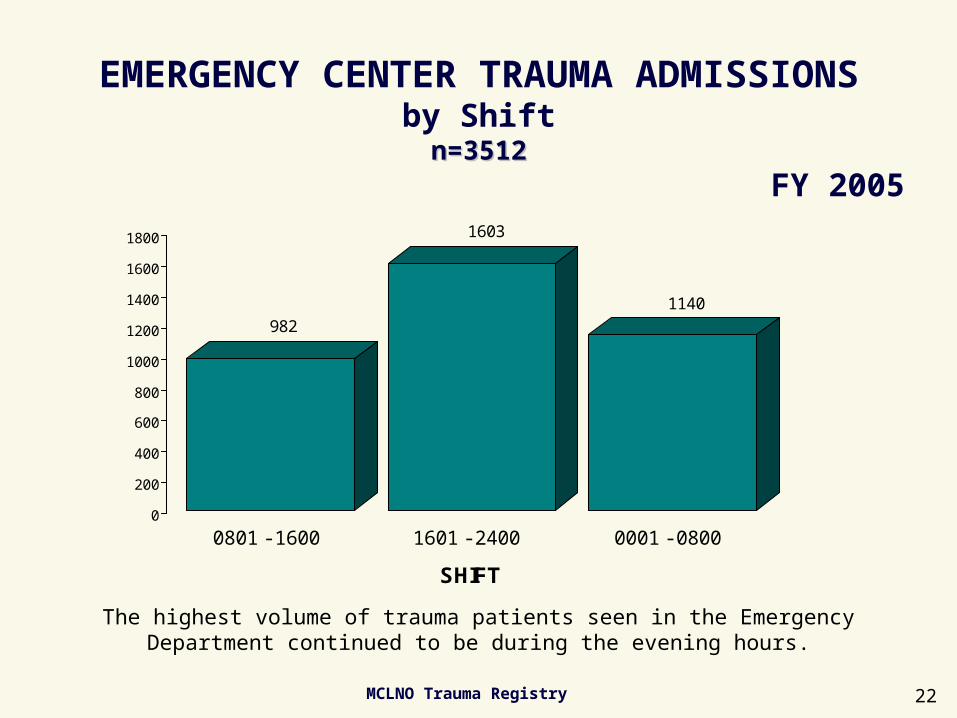
The highest volume of trauma patients seen in the Emergency Department continued to be during the evening hours.

FY 2005

MCLNO Trauma Registry 22

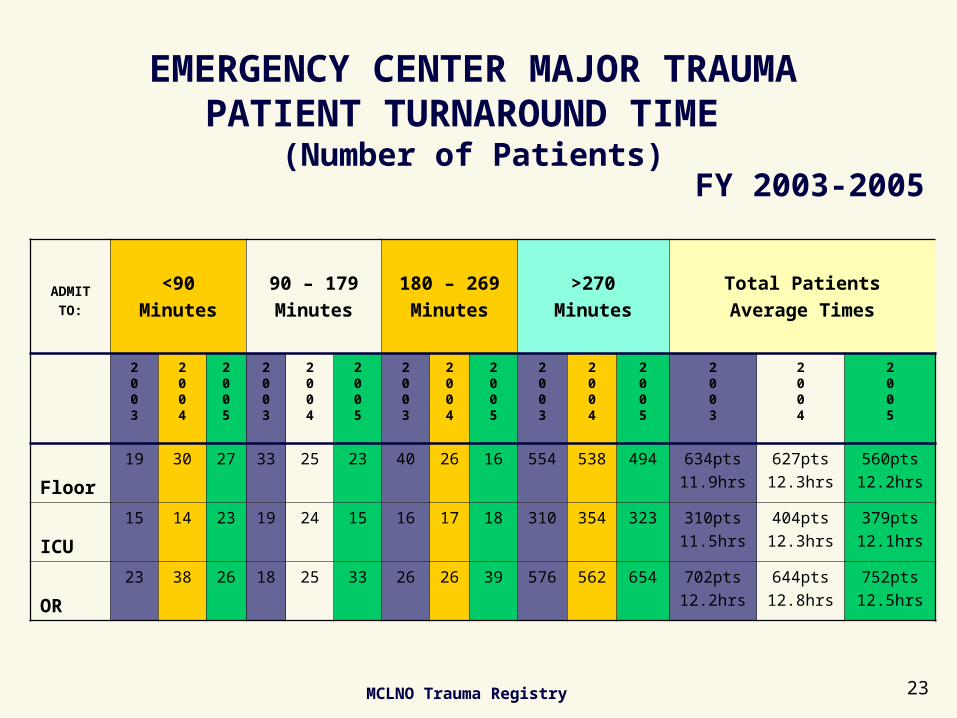
EMERGENCY CENTER MAJOR TRAUMAPATIENT TURNAROUND TIME

(Number of Patients)

ADMITTO:

<90Minutes

90 – 179Minutes

180 – 269Minutes

>270Minutes

Total PatientsAverage Times

2003

2004

2005

2003

2004

2005

2003

2004

2005

2003

2004

2005

2003

2004

2005

Floor

19 30 27 33 25 23 40 26 16 554 538 494 634pts11.9hrs

627pts12.3hrs

560pts12.2hrs

ICU

15 14 23 19 24 15 16 17 18 310 354 323 310pts11.5hrs

404pts12.3hrs

379pts12.1hrs

OR

23 38 26 18 25 33 26 26 39 576 562 654 702pts12.2hrs

644pts12.8hrs

752pts12.5hrs

FY 2003-2005

MCLNO Trauma Registry 23

EMERGENCY DEPARTMENT DISPOSITION

n=3907n=3907

ADMITTED55%

Trans1%

Died3%

Home41%

Floor18%

OR21%

ICU10%

Stepdown 6%

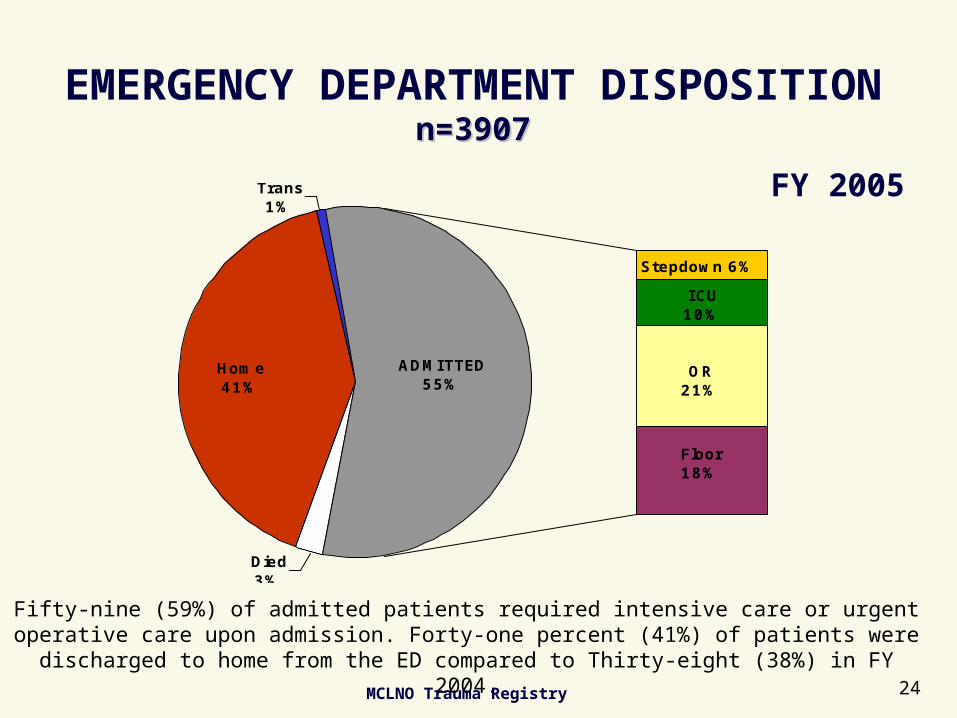
Fifty-nine (59%) of admitted patients required intensive care or urgent operative care upon admission. Forty-one percent (41%) of patients were discharged to home from

the ED compared to Thirty-eight (38%) in FY 2004.

FY 2005

MCLNO Trauma Registry 24

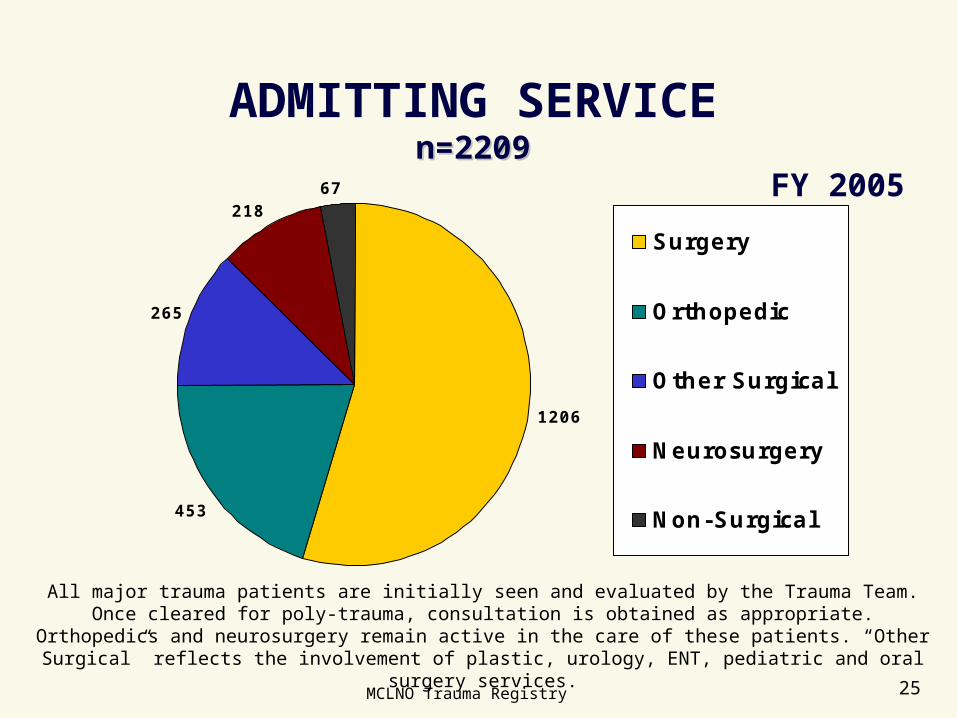
ADMITTING SERVICEn=2209n=2209

1206

453

265

21867

Surgery

Orthopedic

Other Surgical

Neurosurgery

Non-Surgical

All major trauma patients are initially seen and evaluated by the Trauma Team. Once cleared for poly-trauma, consultation is obtained as appropriate. Orthopedics and neurosurgery remain

active in the care of these patients. “Other Surgical” reflects the involvement of plastic, urology, ENT, pediatric and oral surgery services.

FY 2005

MCLNO Trauma Registry 25

PROCEDURES ON TRAUMA PATIENTS

Number of ProceduresN=932

Number of ProceduresN=9,920

Total Patients(with Procedures)

n=3,083

O.R.44%

Other Loca-tions56%

Total Fatalities(with Procedures)

n=166

O.R.43%Other

Loca-tions57% Total Procedures

n=9,920

OR-Blunt28%

Other Locations

54%OR-

Penetrating18%

OR46%

There were 9,920 total procedures performed on 3,083 patients (79% of all trauma patients).

SURVIVORS = 3.2 avg. # procedures – FATALITIES = 5.6 avg. # procedures

FY 2005

MCLNO Trauma Registry 26

HEAD INJURYn=649n=649

Seventeen percent (17%) of trauma patients suffered head injuries, the majority being secondary to blunt trauma. Twenty-five (25%), or 161

patients, experienced disability or death.

Neurological Deficits

Death16%

w/ o Disability

75%with

Disability9%

I njury Category

Pene-trating12%

Blunt88%

FY 2005

MCLNO Trauma Registry27

SPINAL INJURYn=71n=71

Neurological Deficits

Death7%

w/ o Disability

52%

with Disability

41%

I njury Category

Penetrating25%

Blunt75%

One point eight percent (1.8%) of patients suffered spinal cord injury with 48% of these patients having disability or death. This represents

34 patients.

FY 2005

MCLNO Trauma Registry28

HOSPITAL DISCHARGE DISPOSITION

n=3907n=3907Expired

5%

Home80%

Rehab3%

AcuteCare3%

SNF/Resid.

3%Medical

9%

AMA3%

Non-Medical

3%

Home Expired AMA Non-Medical Acute Care SNF/ Resid. Rehab

Eighty-three percent (83%) of all patients were discharged home or left against medical advice; 363 (9%) were transferred to medical facilities.

FY 2005

MCLNO Trauma Registry29

EYE & ORGAN PROCUREMENTn=192 deathsn=192 deaths

A major contribution made by this trauma center’s patients is the “gift of life” through organ donation. Thirty-two patients were satisfactory

donors and 55 organs or tissue were recovered.

40

32

70

1310

0

10

20

30

40

50

60

70

80

DONOR REFERRALS ACTUAL DONORS

Organs Tissues Eyes

FY 2005

MCLNO Trauma Registry30

DRUG & ALCOHOL RESULTSFOR TRAUMA ACTIVATIONS

(BASED ON PERCENTAGE OF TESTED POPULATION)

33%30%

39%

27%

67%

58%

71%

25% 25% 23%

36%

64%

0%

10%

20%

30%

40%

50%

60%

70%

80%

ALL ACTIVATIONS BLUNT PENETRATING FATALITIES

Te

ste

d p

op

ula

tio

n w

ith

po

sti

ve

va

lue

s

Alcohol Only Drugs Only Alcohol & Drugs

n=

14

32

n=

11

18

n=

95

7

n=

93

6

n=

66

2

n=

81

7

n=

29

5

n=

51

n=

41

n=

33

n=

29

8

n=

49

6

FY 2005

MCLNO Trauma Registry31

REIMBURSEMENT SUMMARYn=3907n=3907

FY 2005 Payor Types

Medicaid14%

Medicare2%

Private9%

MAP15%

Free Care6%

Self Pay54%

The Trauma Center provides services for all patients regardless of payor status. Forty (40%) of patients have some form of payment assistance.

*Includes private insurance, worker’s compensation, HMO/PPO. MAP represents Medicaid Applied For.

2003 2004 2005

SelfPay

1794 1688 2105

*Private 261 340 345

MAP 1162 841 577

Medicare 68 102 92

Auto 7 56 15

Medicaid 463 556 533

Free Care

278 297 240

FY 2005

MCLNO Trauma Registry 32

FY 2005 SPREADSHEET COMPARISON

Slides 9-10

MCLNO Trauma Registry 33

FY 2003 FY 2004 FY 2005 FY 2003 FY 2004 FY 2005

PATIENT DEMOGRAPHICS Fatal Trauma 214 182 192

All Patients 4033 3880 3907 MORTALITY RATES 5.3% 4.7% 4.9%

RACE RACEBlack 2593 2427 2429 Black 160 111 109White 1289 1277 1288 White 51 58 73Asian 40 54 52 Asian 1 6 4Other 111 122 138 Other 3 7 6

AGE AGEPediatric 365 349 323 Pediatric 7 4 8Adult 3519 3405 3452 Adult 194 163 170Elderly 146 125 127 Elderly 14 15 14

GENDER GENDERMale 2992 2875 3005 Male 190 148 158Female 1040 1005 902 Female 25 34 34

FY 2005 SPREADSHEET COMPARISON

SLIDES 11-14

MCLNO Trauma Registry 34

FY 2003 FY 2004 FY 2005 FY 2003 FY 2004 FY 2005

PARISH OF INJURY VS RESIDENCE PATIENT TRIAGE SUMMARY

Parish of Injury TRUE + 724 759 909

ORLEANS 2033 2054 2089 TRUE - 94 74 97

JEFFERSON 136 175 302 OVERTRIAGE-- FALSE + 633 688 820

ST. BERNARD 60 58 58 UNDERTRIAGE-- FALSE - 250 218 266

WASH/ST. TAMMANY 26 33 66

PLAQUEMINES 34 27 26 MECHANISM OF INJURY

OTHER 87 124 133 Blunt 3027 2932 2808

UNKNOWN 1657 1409 1233 Penetrating 942 895 1099

Parish of Residence Burn 64 53 57

ORLEANS 2399 2224 2140

JEFFERSON 555 554 633 SEVERITY OF INJURY

ST. BERNARD 169 141 153 Minor Trauma 1816 1744 1650

WASH/ST. TAMMANY 110 181 205 Major Trauma 2217 2136 2257

PLAQUEMINES 82 71 35 FATAL 214 182 192

OTHER 534 521 560 NON-FATAL 2003 1954 2065

UNKNOWN 37 44 54

OUT OF STATE 147 144 127

MCLNO Trauma Registry 35

FY 2003 FY 2004 FY 2005 FY 2003 FY 2004 FY 2005

PATIENT TRANSPORTATION INJURY SEVERITY SCORE

SELF/FAMILY 702 700 583 Activated Patients

Admits & ED Deaths

POLICE 78 73 102 ISS 1-5

OTHER 23 27 15 Blunt 218 188 167

Prehospital Total Penetrating 157 111 154

EMERGENCY MEDICAL SERVICES 2606 2552 2623 ISS 6-10

NOHD 1974 1954 1897 Blunt 230 237 278

Lifeguard EMS 93 71 59 Penetrating 132 139 159

Guardian ~~~~ ~~~~ 24 ISS 11-15

Acadian EMS ~~~~ 51 142 Blunt 117 144 149

AMR 82 76 17 Penetrating 42 33 48

East Jefferson 95 116 128 ISS 16-20

West Jefferson 25 52 168 Blunt 109 130 118

Other EMS 125 125 114

Air EMS ~~~~ 39 74 Penetrating 80 49 54

Interhospital Total ISS 21-25

GROUND EMS 598 472 521 Blunt 79 90 86

Acadian EMS 298 239 300 Penetrating 49 42 54

Amed EMS ~~~~ 12 9 ISS >25

EmergyStat ~~~~ 36 23 Blunt 97 148 167

AMR 15 16 6 Penetrating 68 67 66

NOHD ~~~~ 45 51

Other EMS 220 110 112

AIR EMS 26 56 62

FY 2005 SPREADSHEET COMPARISON

SLIDES 15-16

MCLNO Trauma Registry

FY 2005 SPREADSHEET COMPARISON

SLIDES 17-19FY 2003 FY 2004 FY 2005 FY 2003 FY 2004 FY 2005

ETIOLOGY BY INTENT TRAUMA ACTIVATION LEVELS BY ISSAccidental 2754 2690 2559 Activated Patients - Admits & ED DeathsAssault 1156 1097 1229 ISS 1-5Self-Inflicted 73 50 51 Regular 283 218 220Undetermined 50 43 68 Partial 92 81 102

ISS 6-10

INTENTIONAL INJURIES Regular 279 287 315Self-Inflicted 43 41 39 Partial 83 89 122Versus Another 1155 1099 1257 ISS 11-15

FIREARM 539 511 628 Regular 121 124 144STABBING 276 261 309 Partial 38 53 54OTHER 340 327 320 ISS 16-20

Regular 154 152 134

VEHICULAR TRAUMA Partial 35 27 38Auto ISS 21-25

PROTECTED 674 718 714 Regular 112 119 116UNPROTECTED 419 311 336 Partial 16 13 24UNKNOWN /NA 124 139 125 ISS >25

Motorcycle Regular 154 202 208PROTECTED 59 79 120 Partial 11 13 25UNPROTECTED 74 101 51UNKNOWN 33 39 25

BicyclePROTECTED 3 1 4UNPROTECTED 18 32 26UNKNOWN 119 91 90

36

MCLNO Trauma Registry

FY 2005 SPREADSHEET COMPARISON

Slides 21-24

37

FY 2003 FY 2004 FY 2005 FY 2003 FY 2004 FY 2005

TRAUMA CENTER ARRIVALS BY DAY OF WEEK ED MAJOR TRAUMA PATIENT TURNAROUND TIMES

Monday 609 557 548 Floor AVERAGE TIME11.9hrs 12.3hrs 12.2hrs

Tuesday 512 483 490 <90 MINUTES 19 30 27

Wednesday 561 548 528 90 - 179 MINUTES 28 25 23

Thursday 546 550 484 180 - 269 MINUTES 40 26 16

Friday 540 545 539 >270 MINUTES 547 538 494

Saturday 637 630 626 ICU AVERAGE TIME11.5hrs 12.3hrs 12.1hrs

Sunday 628 567 692 <90 MINUTES 15 14 23

90 - 179 MINUTES 22 24 15

TRAUMA CENTER ARRIVAL BY SHIFT 180 - 269 MINUTES 16 17 18

0801 - 1600 971 967 982 >270 MINUTES 310 354 323

1601-2400 1585 1555 1603 OR AVERAGE TIME12.2hrs 12.8hrs 12.5hrs

0001-0800 1088 990 1140 <90 MINUTES 23 38 26

90 - 179 MINUTES 27 25 33

EMERGENCY DEPARTMENT DISPOSITION 180 - 269 MINUTES 26 26 39

Admitted 2328 2308 2184 >270 MINUTES 576 562 654

OR 717 702 834

ICU 366 404 385

STEPDOWN 272 230 246

FLOOR 973 972 719

Transferred 30 29 31

Died 148 79 100Home 1527 1464 1592

MCLNO Trauma Registry

FY 2005 SPREADSHEET COMPARISON

Slides 25-38

FY 2003 FY 2004 FY 2005 FY 2003 FY 2004

ADMITTING SERVICE HEAD INJURYSurgery 1040 1059 1206 Injury CategoryOrthopedic Surgery 681 696 453 BLUNT 534 563Neurosurgery 267 266 218 PENETRATING 78 74Other-Surgical 266 232 265 Neurological DeficitsNon-Surgical 83 68 67 WITHOUT DISABILITY 490 479

WITH DISABILITY 45 66

PROCEDURES ON TRAUMA PATIENTS DEATH 77 92

Total Procedures 10075 9316 9920

OR 3947 4277 4514 SPINAL INJURYBlunt 2590 2821 2779 Injury CategoryPenetrating 1357 1456 1735 BLUNT 36 49

OTHER LOCATIONS 6128 5039 5406 PENETRATING 18 8Neurological Deficits

Total Patients with Procedures 3149 3026 3083 WITHOUT DISABILITY 29 23OR 1452 1382 1371 WITH DISABILITY 20 31

OTHER LOCATIONS 1697 1644 1712 DEATH 5 3

Total Fatalities with Procedures 164 159 166OR 38 63 50

OTHER LOCATIONS 126 96 116

38

MCLNO Trauma Registry

FY 2005 SPREADSHEET COMPARISON

Slides 29-32

39

FY 2003 FY 2004 FY 2005 FY 2003 FY 2004 FY 2005

HOSPITAL DISCHARGE DISPOSITION DRUG & ALCOHOL RESULTS FOR TRAUMA ACTIVATIONSMedical All Activations +/Tested +/Tested +/Tested

ACUTE CARE 98 99 122 ALCOHOL ONLY 703/2221 424/1543 469/1432REHAB FACILITY 165 131 129 DRUG ONLY 795/1522 609/854 612/957SNF/RESIDENTIAL 28 69 112 ALCOHOL & DRUG 275/765 260/843 275/1118

Non-Medical 59 87 122 BluntAMA 138 123 128 ALCOHOL ONLY 499/1615 289/1071 277/936Expired 214 182 192 DRUG ONLY 555/1143 436/628 441/662Home 3331 3189 3102 ALCOHOL & DRUG 201/602 197/671 207/817

Penetrating

EYE & ORGAN PROCUREMENT ALCOHOL ONLY 204/606 135/472 192/496Donor Referrals 57 116 110 DRUG ONLY 240/379 173/226 171/295

ORGANS 14 33 40 ALCOHOL & DRUG 74/163 63/172 68/298TISSUES 43 83 70 Fatals

ALCOHOL ONLY 9/51 14/57 14/51Actual Donors 13 24 55 DRUG ONLY 24/42 34/41 29/41

ORGANS 7 13 32 ALCOHOL & DRUG 4/19 11/35 12/33TISSUES 5 6 13EYES 1 5 10

REIMBURSEMENTPrivate 261 340 345Medicare 68 102 92Medicaid 463 556 533Auto 7 56 15MAP 1162 841 577Free Care 278 297 240Self-Pay 1794 1688 2105

American College of Surgeons

Certificate of Verification

40

Louisiana Department ofHealth & Hospitals License

41


Recommended