THE MENLO ROUNDTABLE A Journal of Student Research and Writing from Menlo School Daniel Crankshaw ’09 Tess Brown ’10 Molly Crowe ’11 Ryan Denenberg ’10 Isaac Lambing ’10 Justin Lannin ’11 Ethan Leibovich ’11 Sam Parker ’11 Nick Maruyama ’10 Bobby Pender ’11 Abby McCall ’12 Shelby Rachleff ’10 Megan Hodge ’12 James Carpenter ’10 Priyanka Nigam ’11 Jack Sieber ’11 ISSUE 6 • SPRING 2O10
Transcript
THE M
ENLO
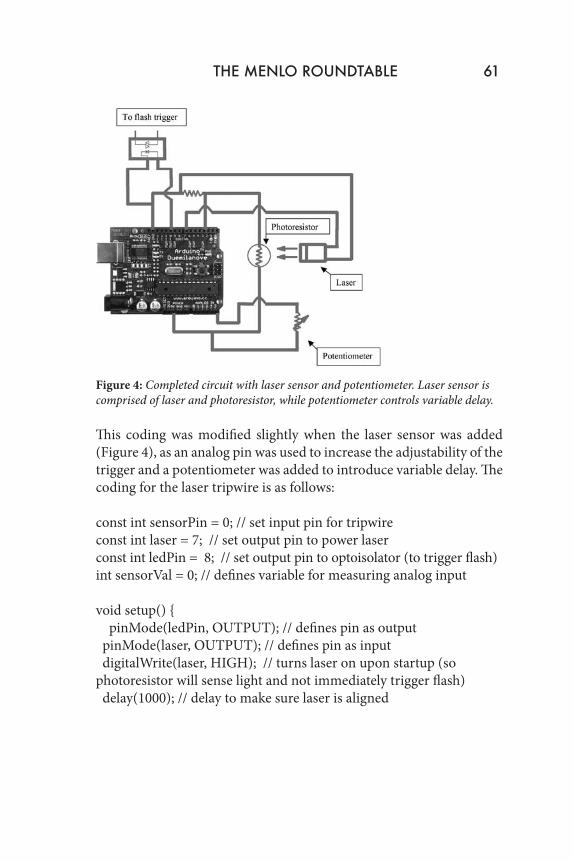
ROU
ND
TABLE •
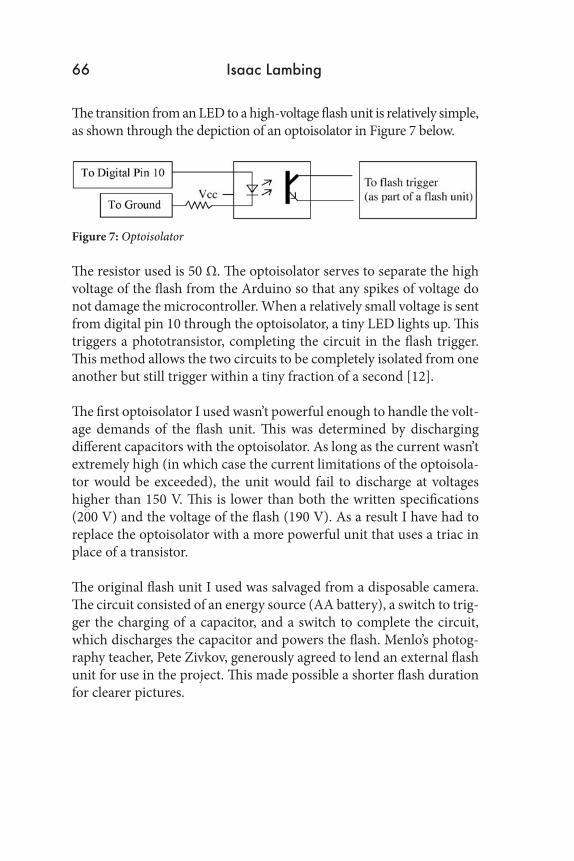
ISSUE 6 •
SPRING
2010
THE MENLO
ROUNDTABLEA Journal of Student Research and Writing from Menlo School
Daniel Crankshaw ’09Tess Brown ’10 Molly Crowe ’11
Ryan Denenberg ’10 Isaac Lambing ’10 Justin Lannin ’11
Ethan Leibovich ’11
Sam Parker ’11
Nick Maruyama ’10
Bobby Pender ’11
Abby McCall ’12
Shelby Rachleff ’10
Megan Hodge ’12
James Carpenter ’10
Priyanka Nigam ’11
Jack Sieber ’11
ISSUE 6 • SPRING 2O10
High-speed image of ornament breakingPhoto by Isaac Lambing ’10
THE MENLO ROUNDTABLEIssue 6 • Spring 2010
1 Molly Crowe ’11 William Blake’s Depiction of Reality
5 Tess Brown ’10 The Power of Wind
13 Justin Lannin ’11, Ethan Leibovich ’11 Alexander the Great’s Journey Through the Persian Empire
17 Ryan Denenberg ’10 Paris is Worth a Mass: How the Protestant Reformation Forever Changed the Relationship Between Religion and Politics in Europe
21 Shelby Rachleff ’10 The 1968 Democratic National Convention
33 Sam Parker ’11, Bobby Pender ’11, Abby McCall ’12, James Carpenter ’10, Nick Maruyama ’10, Megan Hodge ’12 Rocket Power Technical Report
45 Daniel Crankshaw ’09 Nuclear Magnetic Resonance: The Foundation of Magnetic Resonance Imaging
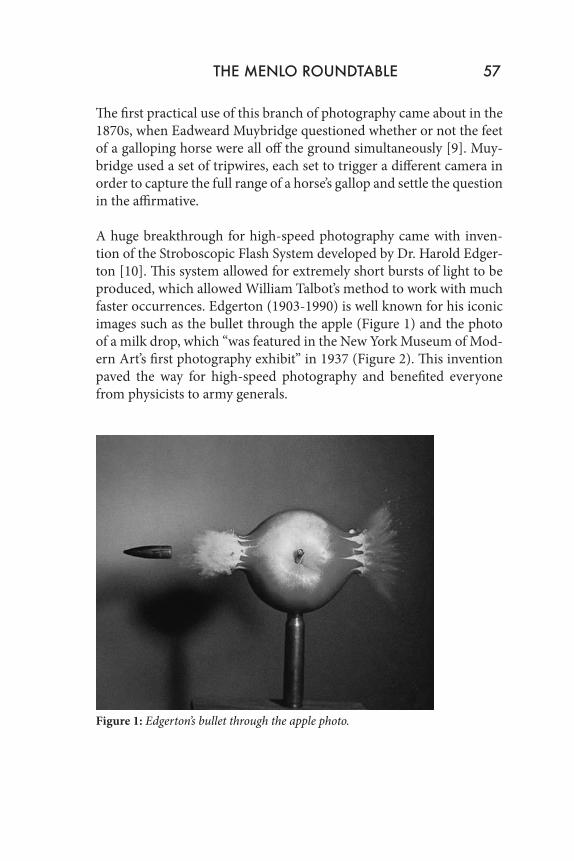
55 Isaac Lambing ’10 High-Speed Photography
77 Priyanka Nigam ’11, Jack Sieber ’11 J&P Industries: Flood Environment Housing and Next Generation Family Cars
William Blake’s Depiction of Reality
Molly Crowe
In William Blake’s Songs of Innocence and Experience, poems are paired with another, for example, “The Lamb” and “The Tyger,” the two “Holy Thursday” poems, and “Infant Joy” and “Infant Sorrow.” The purpose of creating complementary poems in this way is to fully represent the world and its inhabitants. By placing the poems one after another, Blake juxtaposes good against evil and shows that there exists a bal-ance in life between joy and hardship.
Blake’s poem “Infant Joy” is obviously about the happiness that a new-born child brings to the world; however, “Infant Sorrow” demonstrates the pain and grief a newborn can entail. Without the other poem, each by itself would unjustly show either a pure and idyllic world or a world of pain and distress. “Infant Joy” is a conversation between a baby and its parent involving each one’s point of view. The structure of the poem is reminiscent of a nursery rhyme, which gives the reader a sense of lightness and delight. The diction of the baby, “‘I happy am, / Joy is my name,’” and the repetition exemplify the enthusiasm and happiness of childhood. However, without the second poem, “Infant Sorrow,” the first seems facile and unrepresentative. The next poem details the suf-fering and distress of a newborn’s parents, but from the baby’s perspec-tive. The screaming baby is a prisoner and a fiend (“Struggling in my father’s hands / Striving against my swaddling bands”) who is already at odds with the world. Through both these poems Blake shows the dichotomy of childhood and thereby captures the true essence of in-fancy. Newborns are in reality neither all joy nor all sorrow.
The different “Holy Thursday” poems show opposite views of how English society treats its orphans, specifically in London. The first paints a picture that equates the children with little “angels” who are wonderfully taken care of by the Church. They are walking on Holy Thursday to St. Paul’s Cathedral, “… they like Thames’ waters flow.” By
This paper was written for Lynn Anderson’s British Literature class in the fall of 2009.
comparing the children to lambs, flowers, and angels, Blake reinforces his point that all the orphans are innocent and joyous. Blake stresses that they are happy and blissfully singing—“[T]hey raise to heaven the voice of song” —because they are well looked after by the Church: “Beneath them sit the aged men, wise guardians of the poor.” But he then argues against this sanguine view of English society with the next “Holy Thursday” poem. He uses the technique of short rhetorical questions to show how ashamed people should be of the way society treats orphans and the horrible conditions they are made to endure. He expresses outrage and disappointment because even in such a “rich and fruitful land” babes can be reduced to misery. Each poem shows opposite ends of the spectrum. One tells the reader of a joyful scene of nurtured orphans and the other condemns a supposedly Christian society for its lack of benevolence. Blake needs both to correctly depict the reality of the time and the situation the children are in.
Lastly, Blake pairs “The Lamb” with “The Tyger.” These two poems rep-resent opposing forces: good and evil. “The Lamb” is written from a child’s point of view and begins by asking about the lamb’s origin. The question, “Little Lamb, who made thee?” is answered in the second stanza: by he who “calls himself a Lamb.” The structure of the poem, the question and answer, and the fact that a child is the speaker exem-plifies the naïveté and gentleness of the lamb itself and what the lamb represents, Jesus. The second stanza characterizes the creator, Jesus, as meek and mild. Both the lamb and Jesus symbolize all that is good and peaceful in the world and the idea that God must be compassionate to create such a wondrous thing. However, the next poem, “The Tyger,” exemplifies the opposite of the lamb. The tiger is representative of the violence and malice that exist in the world. The structure of this poem is similar to “The Lamb”; it poses the question, how could God create such a beautiful yet monstrous being as a tiger? Blake equates God to a blacksmith: “What the hammer? What the chain? / In what fur-nace was thy brain?” The entire poem consists of questions, all asking, “What immortal hand or eye / Dare frame thy fearful symmetry?” or, in other words, what kind of God could allow such evil and violence in the world? Both “The Lamb” and “The Tyger” interrogate the creator of such creatures, and when the poems are put together, the question is
2 Molly Crowe
how God can create something so innocent and gentle and then some-thing so cunning and fierce. The lamb and the tiger represent the good and evil in the world, and if either poem had to stand alone, it could not fairly convey reality.
William Blake was clever to write complementary poems; they show the dichotomy in two opposing views of reality. In these three particu-lar pairings, Blake demonstrates that the world is not one-sided. Life is neither completely awful nor wonderful; people are both caring and selfish; and God created both good and evil. Blake’s poems can seem simple and childlike on the surface, but each pairing exposes the world as it truly is.
THE MENLO ROUNDTABLE 3
4 THE MENLO ROUNDTABLE
The Power of Wind
Tess Brown
It’s not what you think. I was not assigned to write about green energy. This essay does not glorify the power of wind. On the contrary, you will learn that in the rush to find renewable resources, our society may have overlooked some important unintended consequences. Although it’s always more fun to talk about benefits than costs, this paper lies at the intersection of the two. It is divided into three parts. The first is a letter addressed to the town board of Hammond, New York, where a debate over the installation of wind turbines is currently taking place. The second explains the pros and cons of industrial-sized wind turbines. And the third is a personal reflection piece. Through this paper, I hope to illuminate the full story behind wind energy._____________
Town Board of HammondHammond, NY 13646
Re: Wind Energy Facilities Laws
Dear Town Board:
I am Tess Brown of Oak Island, in Chippewa Bay. The St. Lawrence River is my home away from home. My great-grandfather bought a piece of property located on the mainland, known as Three Ledges, in the 1930s and our family has been gathering there every summer ever since. I made my first trip to the River when I was six months old. I grew up as a river rat. I spent the summers hunting for frogs, fishing for perch, jumping freighter waves in our little Boston Whaler, exploring the islands to meet new friends, and enjoying a daily swim or just floating in the river’s fresh water. As I am almost eighteen years old, I have grown very attached to this special place.
I am writing to express my deep concerns about the hasty movement towards passing the town’s Laws 1 and 2 regarding wind energy facilities
This paper was written for Mark Clevenger’s Creative Non-Fiction class in the fall of 2009.
in the town of Hammond. I believe that it is a necessity for the community to spend ample time researching and addressing the environmental and public health issues that would result from the development of industrial-scale wind turbines. Wind turbine projects have already begun in other areas of upstate New York and a lot of negative reactions have been reported. It is important for the town of Hammond to recognize these people’s stories and the likely consequences of industrial-scale wind turbines.
Thank you for your time.
Sincerely,Tess BrownChippewa Bay, NY_____________
Wind is invisible. Wind makes many different noises: it whistles when quick, creates crashing waves when forceful, and amplifies the low tone of an empty old-fashioned Coke bottle when softly blowing. Wind is tasteless. Its only touch is the rippling of your clothes against your skin and your hair swirling in your face. It smells of whatever it carries: orange groves or redwoods burning. Wind is simply moving air that is caused by differences in air pressure. How could wind be harmful?
Wind is a renewable resource. Wind turbines or windmills transform the kinetic energy of the wind into mechanical or electrical energy that can be used for practical purposes. As of January 2005, wind power generated enough electricity to power 1.6 million average American households (4.3 million people). The public demand for clean renewable energy has surged, thus the growth of wind energy nationwide has been rapid and large-scaled. The U.S. Department of Energy has announced a goal of obtaining 6% of U.S. electricity from wind power by 2020. Wind energy has become an increasing portion of the nation’s energy supply.
I completely support and encourage the usage of alternative energy sources that are clean and effective, and I believe that wind is an excellent resource. However, wind turbines have caused some intensive debates. These towers are mostly tubular and made of steel. Their blades
6 Tess Brown
are made of fiberglass-reinforced polyester or wood-epoxy. Industrial wind turbines, which produce the most energy, are huge. For example, the GE 1.5 megawatt model has 115-foot blades atop a 212-foot tower to form a total height of 323 feet. The alarm concerning these industrial wind turbines is that they are installed too close to where people live, work, and go to school, and that they endanger much of the wildlife where they are located. Wind projects have already been established in many parts of the country and in Europe, and many complaints have followed. Currently, the locations of these industrial-sized wind turbines are determined by the wind power companies, which seem to disregard public health. The wind turbines have recently invaded my family’s vacation home in the St. Lawrence River County, threatening the survival of this national landmark and the wellbeing of the people who live there.
Hal E. Graham is a Cohocton, New York, wind farm leaseholder. My mother heard him speak at a meeting held in nearby Clayton, and he has been a major figure publicized in many local newspapers for those who are against installing large wind turbines in the town of Hammond. He has one industrial-sized wind turbine on his property 2,000 feet from his house. Mr. Graham is a strong believer in finding new sources of alternative energy. He thinks that renewable wind energy is a great resource and he was not opposed to receiving income from the wind company to house a wind turbine. However, he soon found this powerful energy source intolerable to live with. The developer, First Wind, of Newton, Massachusetts, guaranteed Mr. Graham and his wife that “they would not hear anything louder than the sounds of a refrigerator 200 feet away.” However, Mr. Graham stated that the noise “makes the windows on his house rattle” and “at times, it is almost unbearable.” The noise is noted to be like a jet taking off in your own backyard, yet the jet never seems to leave the ground. Mr. Graham explained that when he lies down to go to bed at night he can actually feel the thump, thump, thump of the rotating blades in his chest. Instead of counting sheep, he is forced to count the beats of the blades rotating around and around. The red light at the top of wind turbines that flickers at night to warn airplanes of their presence constantly flashes into the house. He can see the light on the kitchen table, reflecting off the teacups, and
THE MENLO ROUNDTABLE 7
flashing like an ongoing siren in his house. Mr. Graham complained to the wind company, yet they replied that they were simply within their guidelines and there was nothing they could do. Both he and his wife have difficulty sleeping, causing endless health problems. Mr. Graham’s turbine also becomes highly dangerous in the wintertime. Since the rotating blades are not in motion continuously, when they are at rest they collect mounds of snow and ice, which can be flung off in every direction once the turbines start up again. Mr. Graham and a few of his neighbors have been traveling to talk to other communities to provide firsthand information about the risks of placing wind turbines too close to where people live, work, and go to school. The farm he lives on has been in his family since the 1700s, yet he sees no other alternative than to simply abandon his home.
Nina Pierpont lives in Franklin County, New York. She is a doctor and an ecologist and has written a book concerning her research and findings about wind turbines and their negative side effects. Wind energy companies arrived in her county with a strong purpose, yet no controls. They were not being regulated by the legislature or the New York State Energy Research and Development Authority (NYSERDA). Dr. Pierpont has been researching and interviewing to gain an understanding of the health and wildlife problems that these industrial wind turbines cause. During her testimony to NYSERDA, she argued, “it is irresponsible of the wind turbine companies—and governments—to continue building wind turbines so close to where people live until there has been a proper epidemiological investigation of the full impact on human health.” Wind turbines emit a constant low-frequency vibration and noise that people are very sensitive to. These vibrations can disturb one’s inner-ear vestibular system, which is responsible for balance and spatial orientation. Therefore, people living too close to wind turbines for a prolonged period of time can develop a disorder related to the inner-ear disruption known as Visceral Vibratory Vestibular Disturbance (VVVD), which can cause nervousness, chest tightness, heart disorders, nightmares, and even cognitive development issues in small children. Dr. Pierpont, along with other scientists and physicians, has also identified Wind Turbine Syndrome (WTS). The symptoms of this disorder begin when local turbines go into operation and go away when the turbines are at rest or when the person leaves
8 Tess Brown
the area. The symptoms that characterize WTS are: sleep problems—noise or physical sensations of pulsation or pressure make it hard to go to sleep and cause frequent awakening; headaches that increase in frequency or severity; dizziness, unsteadiness, and nausea; exhaustion, anxiety, anger, irritability, and depression; problems with concentration and learning; and tinnitus (ringing in the ears). However, WTS does not affect everyone. These symptoms are known as “risk factors” since some are susceptible to them and others are not. Epidemiologic studies are currently in progress to determine what makes someone more vulnerable to WTS.
Along with severe health problems, there are harmful impacts of wind turbines on waterfowl, fish, and other wildlife in a major wetlands area. The U.S. Fish and Wildlife Service recommends that wind turbines should not be placed near wetlands, shorelines, or in other known wildlife concentration areas, especially where fog or low clouds are common during spring and fall migration. The St. Lawrence River is a major national wetlands area and serves as a major migratory pathway for many species of birds. The impact of the height of these turbines, the size of their blades, and the noise, vibration, and flicker may all affect the wildlife in the area. There have been incidents at other wind turbine projects where many hundreds of birds and bats have been killed within a few months of the start of turbine operation. The 1000 Islands Region of the St. Lawrence River is a unique place of natural beauty and wildlife habitat enjoyed not only by the residents but also by many visitors who help the economy. Special care should be taken not to disrupt this national resource.
_____________
Again, I am completely behind using wind power as a renewable energy source. However, industrial-sized wind turbines should not be installed close to where people live, endangering their health, or in areas where an abundance of wildlife may be put at risk, or in a place whose economy depends on recreation and relaxation of residents and vacationers, like me. The River is a place of peace and relaxation, where all my worries slip away and there is no such thing as time. It serves as more than a vacation spot. It has become a place to escape and a place
THE MENLO ROUNDTABLE 9
to enjoy the simplest things in life: taking a nap on the screen porch during a soft rain, reading a book until three in the morning without having to worry about the tasks of the next day, munching on chips and salsa with my family at cocktail hour, going out for a cruise to watch the sunset, and just floating on the River for hours.
The River is a place where my family gathers together and is able to wind down. Uncle Chris travels from Vermont where he works as a Fed Ex driver. Aunt Anne makes the trek from Guatemala where she holds the position of country manager for Catholic Relief Services (CRS). Venturing from California, my cousin Sarah spends her vacation away from the pestering fifth graders she teaches. Uncle Rick, an engineer working for a pollution control equipment company, and his wife Holly, a midwife, drive 10 hours from Ann Arbor, Michigan. Each member of my family has a highly demanding job that produces varying stress levels, yet each schedules the time to get away and enjoy at least a week at the River. My family can escape the fast-paced, rampaging technological and industrial world to a place where everyone forgets their responsibilities and straining issues. Here there are no flat tires on a packed delivery day, there are no temporary shelters needing to be built, there are no kids who just learned how to “give the finger,” there is no pollution to control, and there are no complications from births. We lose our stress here. Our minds unwind and our bodies decompress. However, if constant noise, low-frequency vibration, and flicker, which potentially cause irritability and mood changes and further increase levels of anxiety, poisoned this serene atmosphere, the River would lose much of its value and my family would lose its refuge. Not only is it a place of leisure time, but it is also the place where my family bonds and becomes unified. It’s the place where we play Cranium or hearts for hours. It’s the place where we sit around the fire roasting marshmallows until they are gooey enough to smoosh between two sticks of chocolate and a graham cracker. It’s the place where we talk; the place where we laugh; the place where my eight-year-old cousin Jessie teaches everyone the steps of an Irish jig. There is no TV at the River. We have only ourselves for entertainment. My brother, cousins and I team up against all the old folks in intense charade games, acting out movies such as Harold and Kumar Go to White Castle, watching
10 Tess Brown
them struggle as they guess classic films like Casablanca. My uncle and my brother strum on their acoustic guitars while the rest of the family attempts to make up songs, blurting out lyrics such as “You can have some fun. Under the sun. At the River.” We have huge family dinners where my brother, 22, and I, almost 18, hold permanent spots at “the kids’ table.” My grandma makes her specialty jambalaya and we devour the whole pot of it. My family can be loud, boisterous, and at times just strange. We are spread out from coast to coast, even to other countries, yet the River is our home away from home. It’s our family’s place. It’s our central station. These industrial wind turbines pose a threat to my family’s core. I would be very sad if these intrusive structures upset my family’s behaviors and traditions. If the River became sensorily uncomfortable, I am worried that my family’s dynamics would become disrupted, that we would become more distant. I don’t want my family patterns to change. I don’t want the atmosphere to change. On river nights, the stars dazzle in an ink sky. There are no city lights or even buildings taller than two stories to brighten the black night—only the stars. The blinking red lights atop the comparable forty-story wind turbines would look like an alarm flashing throughout the world. You would be able to see this flashing light through our curtainless windows throughout slumberless nights. Inside our house, you would be able to hear them. They would echo off the heart pine floors and the beaded fir walls of the all-wood cottage. There is little carpeting or drapery to absorb sounds. Even my fifty-pound dog’s footsteps reverberate throughout the house. Wood is like a tambourine for sound. In my house, that thump, thump, thump, would be echoed, magnified, drowning out the soft rustling of the cattails in the marsh that nearly surrounds my house.
I love listening to the bullfrogs at night unimpeded by steel mechanical sounds. Many wildlife creatures have created their home on our island long before we arrived; the place wouldn’t be the same without the numerous crawlers. I love waking up early in the morning to see a soft goldish-brown baby deer decorated with white spots wading in the tall grass. When I see a tall grey-blue washed heron standing tall on the rock point, I like to approach the dock slowly, cut the boat engine and drift until the heron soars off. I like the natural emptiness of the land.
THE MENLO ROUNDTABLE 11
Driving through it, I can see miles of uninhabited fields of green grass and trees with no construction or industries to be seen—just space. I love the night after a big storm; the sleeping may be humid and sticky and hot, yet it is so quiet and so still. I love watching a flock of redwing blackbirds fly in formations over the marsh, flapping their wings, revealing their unique strip of red under their black feathers. I love to listen to the wind—the natural wind. The natural wind lets you think as you sit on the Adirondack chairs. It cools you down as you lie tanning on the wooden dock. It provides great sailing or tubing weather. It calms you with its soft humming. I would truly hate for people to suffer through health problems, for the wildlife to be diminished, for the natural beauty of the St. Lawrence to be dampened, for the industrial world to invade the simple and organic atmosphere. What would I hate most? Never being able to hear the natural wind again.
12 Tess Brown
Alexander the Great’s Journey Through the Persian Empire
Justin Lannin & Ethan Leibovich
Introduction
In the year 334 BC, Alexander the Great and his army of over 40,000 men left the Macedonian Empire and set out on their two-year quest to conquer the Persian Empire. Motivated by both a desire to capture the Persian Emperor Darius III and Alexander’s wish to travel to the Far East, their journey took them all the way from present-day Greece to India. While chasing Darius they sacked, burned, and looted many key Persian cities, including Susa and the Persian capital, Persepolis. The segment we studied begins in 331 BC, as Alexander arrived in Babylon after defeating Darius’s forces in the Battle of Gaugamela. Alexander headed to Babylon with aspirations of taking control of the prospering intellectual and commercial center, and this is exactly what he did. He took control of the city but left the inhabitants un-harmed, and quickly left to sack Susa while leaving some of his gener-als in charge of Babylon. Upon arrival in Susa, Alexander and his men quickly looted the treasury and left the city, sending the majority of his men to Persepolis along the Persian highway known as the Royal Road. Alexander, on the other hand, wanted to take a more direct route to the capital, and thus took a select group of men through the desert and across the Zagros Mountains. They arrived at a pass known as the Persian Gates, where a Persian Army ambushed them. The Persians lined the hills surrounding the narrow pass and bombarded Alexan-der’s men with stones and arrows as they tried to pass through. After a month of heavy casualties and no success crossing the pass, Alexander decided to retreat and devise a new plan. He and some of his men went through a nearby pass and were able to sneak up behind the Persian
This paper was written for Nancy McPhaul’s Ancient GreekHistory class in the fall of 2009.
army without alerting them, enabling them to finally travel through the pass safely. Once through the Zagros Mountains, Alexander and his men quickly advanced to Persepolis so that they could loot its treasury before the Persians emptied it. One evening in Persepolis, a fire broke out in the palace where Alexander was staying, a fire that eventually spread and engulfed the entire city. Some historians believe the fire was an ac-cident, whereas others suggest it was Alexander’s revenge for the Per-sians’ having burnt the Athenian Acropolis in 480 BC. Alexander then continued his pursuit of the Persian king. Unfortunately he was unable to capture him alive, as Darius was killed by his own men and left on the side of the road. Alexander found Darius’s corpse and was enraged that a man of such power and nobility had been killed with such dis-respect. He eventually sent Darius’s body back to Persepolis, where he was given a royal funeral and buried alongside his predecessors. Researching Alexander’s Route on Google Earth
Trying to track the path that Alexander took through present-day Iraq and Iran is difficult because of the great geographical challenges that he faced on his journey. One of the biggest challenges was the moun-tain ranges in Iran. For example, the Zagros Mountains appear to have affected his choice of path because it looks as though he had to go all the way around them instead of taking a more direct route. Granted, he was following Darius for most of this segment of his conquest, so he might have been just following him through the mountains. Unless he was able to scale some of the mountains, however, there are only a few possible routes he could have taken to get from one city to another, all of which are very narrow. Although these narrow passes might have hindered his own progress, they could also have been helpful in di-minishing the strength of the armies he faced along the way. Alexander was often outnumbered, and the narrow pathways could have helped him “even out” the battle, as his enemies could only deploy a relatively small part of their forces along the front line at any given time. On the other hand, the Persians should have known the land better (as it was part of the Persian Empire, and Alexander took mapmakers to chart
14 Justin Lannin & Ethan Leibovich
the terrain), so they should have been able to predict his movements and bottle up his army, as they did at the Persian Gates. Even in this difficult and unfamiliar terrain, Alexander was able to direct his troops to victory in many battles. Something that might have helped him ma-neuver as successfully as he did is that there appear to have been many rivers (some now dried up and some still present) along the routes he had to travel. Even if he was unfamiliar with the geography, he could just follow the rivers from place to place. But his pathway does not follow any single riverbed, so he may have had to do a fair number of river crossings and portages to keep his army moving. Relevance of This Region’s Geography to Current Events
After looking at the geography that Alexander the Great had to negoti-ate in present-day Iraq and Iran, you can really appreciate the difficul-ties facing the U.S. troops in the wars in that area today. Because the area is so mountainous, it must be very difficult to mobilize any force, and what is even more challenging is that the enemy the troops are trying to follow and fight has a significant “home-field advantage” of knowing the local geography and the best ways to move and fight in it. Being foreign to this land must hinder any progress that the troops want to make because there is no easy way to travel.
Domestic life is also probably affected by the geography of Iran and Iraq. The mountains split through the land, leaving many towns and villages isolated. Travel seems to be difficult between these communi-ties, although in a few cases there are now highways that could ease travel. Any big cities we found were built in the plains where many buildings can be built and many people can live.
Conclusion
On his great conquest of the present-day Middle East and into Asia, Alexander would have had to face great geographical challenges. This makes his conquest of the area even more impressive because of all of the feats he had to accomplish, both in terms of sheer mileage he and his troops traveled and in terms of navigating through the terrain.
THE MENLO ROUNDTABLE 15
Today the geography still affects life in the area and the way that people live their lives. Through this project we learned that geography affects all kinds of travel and political events, past and present, and has a huge influence on the course of history. To view the full Google Earth project, including a video with author commentary, go to http://roundtable.menloschool.org/issue6.html.
16 Justin Lannin & Ethan Leibovich
Paris is Worth a Mass: How the Protestant Reformation Forever Changed the Relationship Between Religion and Politics in Europe
Ryan Denenberg
For more than a century after Martin Luther initiated the Protestant split from the Catholic Church in 1517, Europe was wracked by civil strife, largely stemming from religious violence. Indeed, such violence claimed hundreds of thousands of lives, Protestant and Catholic, over the course of various religious wars and conflicts. In an ironic twist, much of Luther’s impulse to affect moral change was ultimately em-ployed in war-making. The struggle between the two Christian sects would produce permanent political and social change across Europe, tearing apart empires, ending dynasties, and forever weakening the once all-powerful political hold of the Catholic Church. On the sur-face, it might appear as though the sole source of conflict was a differ-ence in religious belief, as had been the case with the iconoclasm in Antwerp. However, in reality, the religious difference between Catho-lics and Protestants merely provided a medium through which oppos-ing political entities could vie for power, providing each side with the opportunity and ‘just’ cause with which to destroy the other. In the sixteenth century, religious passion had not yet given way to pol-itics as the sole motivation for inter-religious violence in Europe. For example, during the Protestant riots in Antwerp in 1566, the violence targeted Catholic “idolatry” quite narrowly and was carried out in a controlled and organized manner. This would suggest that the Protes-tant response to Margaret of Parma’s edict against Protestant worship was not motivated by politics, or else they would have attacked Span-ish governmental infrastructure and killed their Catholic enemies en masse. However, the target of the mob’s rage was Catholic icons alone, and rather than endangering the city’s Catholics, the riot caused no
This paper was written for Katharine Hanson’s Advanced Placement European History class in the fall of 2009.
18 Ryan Denenberg
bloodshed between the two sides. An English merchant’s agent who witnessed the rioting was awed by the order and precision with which the mob desecrated chapels, burned Catholic books, and destroyed religious art. He also noted that the Catholic worshippers and cler-gymen were left unharmed, and more miraculously, no looting took place. When the disorder had subsided, “[A]ll were gone home again, as if there had been nothing done.”1 The specific targeting of religious icons and not government institutions, as well as the lack of bloodshed caused by this Calvinist uprising, is proof positive that in this case the violence was purely the result of religious tension itself. However, even within the region of the Netherlands this was an isolated instance. The issue of religion was used mostly as a blanket excuse by the nobility to shed the shackles of imperial and royal authority. Since the early days of the Reformation, Dutch nobles had converted to Protestantism as a convenient way to escape Charles V’s authority. Charles had been steadily raising taxes and attempting to expand imperial power at the expense of the nobles. The proud nobility clung to their age-old au-tonomy, and, knowing that Charles was devoutly Catholic, seized the opportunity to convert, thus absolving themselves of any obligation to show fealty towards him. Then, when confronted with the tyranny of King Phillip and his Spanish Inquisition, Protestant and Dutch nobles alike united under William of Orange in 1581 in the Union of Utrecht. In a show of nationalistic anti-Spanish sentiment, they put aside their religious differences and seized the opportunity to declare indepen-dence. This makes it abundantly clear that the Protestant-Catholic conflict in the region did not stem solely or even primarily from reli-gion. Dutch Catholics turned on their Spanish co-religionists for the sake of independence. They had put their political ambitions before their religious beliefs.2
Similarly, in France the Religious Wars were not actually a result of inter-religious hatred, but rather the rivalry between the Valois and Bourbons. The Concordat of Bologna provided monetary incentive for the Valois to maintain Catholicism, as they were able to collect bribes from nobles who aspired to high-ranking clerical office. However, the Huguenots, who were Calvinist, represented 40% of the nobility as well as a large portion of the middle class, making them a potent political force. The Bourbons, most notably Henry of Navarre, gave their sup-port to the Huguenots. Because this threatened a source of revenue
THE MENLO ROUNDTABLE 19
for the crown, the Valois began to inspire the sort of anti-Protestant violence that culminated in the St. Bartholomew’s Day Massacre of 1572. A prominent Huguenot, Admiral Coligny, had gained the king’s ear, much to the dismay of the king’s mother, Catherine de’ Medici. In order to curb his influence, Catherine plotted to have him killed along with several other troublesome Huguenot leaders. While on the surface this might appear to be merely anti-Protestant hatred, it was in fact quite politically motivated. First, she hoped to eliminate Coligny, thus enabling her to regain control of her son, the king, so that she might once more determine French political policy. Then her second-ary motive was to decimate the Huguenot leadership who threatened the strong source of revenue that the Catholic faith offered France. Un-der the guise of religious righteousness, she had her political enemies slaughtered. One witness to the massacre described the cruel way in which the body of Coligny was treated, hung mutilated for all to see.3 Here is further evidence of political motives at work, because the muti-lation and public display of his corpse made him an example, a warning to Huguenots to abandon their war against the crown. When Henry of Navarre took power he took two actions that further suggested that he found religion to be a useful political tool. First, famously remarking that “Paris is worth a mass,” he converted to Catholicism. Understand-ing that it would be necessary in order to be accepted by the French masses as their king, he sacrificed his faith for political gain. Then in 1598 he issued the Edict of Nantes, granting liberty of conscience and worship to the Huguenots, who on religious grounds were now his de jure enemies insofar as he was a newly converted Catholic. Again this suggests that he cared more for his political ambition than his faith, as he tolerated so-called heretics simply because they were his longtime political allies.
A similar story unfolded in England, where Henry VIII severed his ties with the Catholic Church for his own personal and political gain, using the new Church of England to expand his power. The first and most basic reason for his formation of the Church of England was that he wanted a divorce. His wife at the time, Catherine of Aragon, had not borne him a son, but when he asked Pope Clement VII for an annul-ment he was refused, as Catherine’s nephew the Holy Roman Emperor was effectively determining papal policy. But there were a number of
20 Ryan Denenberg
other factors that appealed to Henry, namely the acquisition of Church lands and other wealth throughout England and Wales. This would en-rich the English coffers and expand the power of the crown. With Eng-lish ties to the Church severed, Henry did just that. He also passed the Supremacy Act in 1534, making him the official head of the Church of England. This bestowed upon the king not just the earthly title of sovereign, but also the spiritual title of the protector of the faith. This made him more than just the king in the eyes of the people: it made his rule a mandate of God’s will. Henry had ended hundreds of years of Catholic dominance and appointed himself England’s ‘pope.’ He had clearly bent the Christian faith to his own devices, namely the consoli-dation of his political power.
While the rampant religious conflict of the sixteenth century may ap-pear to have been largely motivated by differences in faith, the root of the violence draws more water from the spring of politics. This shows the first cracks in what had once been a stalwart and apparently ever-lasting papal dominance not just of religious life, but social and political as well. In Northern Europe at least, the papacy was reduced to a relic of the Middle Ages. With leaders now using faith as a tool rather than a basis for policy—as a means rather than as a sacred end in itself—the first signs of secularized thinking emerge. Christianity is seen not as an unbreakable moral code, but rather as an easily manipulated system of belief capable of providing rationale for power. Further exemplifica-tions of this concept can be seen in the divine-right absolutists who fol-lowed immediately after, all the way to the Islamic fascists of today. No longer were religion and politics one and the same. Faith had become a tool in the political arsenal that the modern leader possesses.
Notes
1. “The Protestant Fury: Antwerp, 1566,” in Sears McGee et al., eds., Kings, Saints and Parliaments, 2nd ed. (Kendall-Hunt, 1994), 195.
2. For a similar series of events during the American Revolution, see Charles P. Hanson, Necessary Virtue: The Pragmatic Origins of Religious Liberty in New England (University Press of Virginia, 1998).
3. John McKay et al., A History of Western Society: Since 1300, 9th ed. (Houghton Mifflin, 2008), 204.
This paper was written for Nancy McPhaul’s Advanced Placement United States History class in the spring of 2009.
The 1968 Democratic National Convention
Shelby Rachleff
“Democracy is in the streets,” was the cry of protestors at the 1968 Democratic National Convention in Chicago. The protestors, a mixture of young people, student activists, veterans, rabble-rousers and other assorted types were in Chicago for a purpose: to demonstrate their position against the United States’ involvement in Vietnam. Controversy arose when their protest turned violent; the Chicago police force began to suppress protestors through physical methods, clubbing them, beating them, restoring the so-called peace. The presence of the Youth International Party (YIPPIES), known for drug use, radicalism, and “theatrical” and obscene public appearances, was a legitimate threat to conservative Chicago, eliciting an overprotective response on the part of the police to suppress any potential violent outbreaks. While the behavior of the protestors was disrespectful and provocative, it did not attain the level of violence that would have been necessary to warrant the police response. Given the peaceable behavior of the majority of the protestors at the convention, the unrestricted police brutality against civilian protestors was not justified. The protest, meant to illuminate how U.S. involvement in Vietnam had made a “mockery of democracy,” was intended and designed to be non-violent; participants affiliated with Students for a Democratic Society (SDS) abstained from physical violence throughout the convention.1 The stereotype of all activists as hippies and degenerates put the Chicago police on high alert, ready to strike preemptively without fully considering how or against whom, on an individual level, they were acting. Subsequent coverage of the convention by both the media and the Walker Commission Report served to vindicate protestors by laying blame on the Chicago authorities and police for the violence at the convention.
The New Student Way
“The goal written on the university walls was ‘Create two, three, many Columbias.’” — Tom Hayden, Founder of SDS2
The 1960s provided the perfect mix of social rallying points to spawn a strong student movement. The war in Vietnam was a reality experienced by the youth of the day firsthand through the draft as well as through increasing media coverage. This was the generation who saw their friends and brothers sent to fight a war whose purpose few of them could adequately define, and they were outraged. Chants of, “Hey hey, LBJ, how many kids did you kill today?” surrounded the White House, and organizations like SDS were born. Students for a Democratic Society, founded in 1962 at the University of Michigan by a group of students including soon-to-be-leader Tom Hayden, bonded over the wholehearted embracement of and belief in the ideals proffered by their Port Huron Statement. “We are people of this generation, bred in at least modest comfort, housed now in universities, looking uncomfortably to the world we inherit,” read one section of their manifesto.3 SDS, therefore, saw itself as the vanguard of idealistic yet politically focused middle class students campaigning for radical social changes that would eliminate the racism, sexism, and general bourgeois apathy to which they had grown disgustedly accustomed. Socialism seemed to be the ideal ideological fit for this envisioned society. SDS staged protests against the war in Vietnam, produced publications advocating civil rights (as they were closely related to the Student Nonviolent Coordinating Committee, or SNCC), and staged protests against any form of U.S. involvement in situations that didn’t warrant it, thereby laying the groundwork throughout the early sixties for the 1968 Democratic National Convention.
Students for a Democratic Society was experiencing rapid growth on both social and political levels in the months proceeding the convention (DNC). On a literal level, membership soared from 35,000 in April 1968 to more than 80,000 in November.4 Part of the reason for this jump was the Columbia Sit-In in the spring of 1968, which served to catalyze the shift in the model of protest used by SDS to bring about
22 Shelby Rachleff
social and political change. Students at Columbia University in New York City staged a protest against the school’s relation to the Vietnam war (particularly war research), as well as against the university’s plans to build a new gym in the Morningside Park district, a primarily African American neighborhood whose residents objected to the project. The campus protestors barricaded themselves inside Columbia buildings and took a dean hostage as a “political prisoner.”5 This protest was of great importance not only because it brought various student groups together in a large-scale demonstration fueled by both foreign-policy and domestic concerns, but also because it showcased the power of student protests and served as inspiration for the protests at the Democratic Convention. The term “participatory democracy,” a reference to the Port Huron Statement made in this context by then-SDS member Mark Rudd, was used to describe the Columbia movement; students were taking political action, demanding their view of equality through protests. Therefore, more so than filling out a ballot, they were taking “democracy” into their own hands. They were, in another phrase of the time, “taking it to the streets.”
Radical Protestors and the Trial of the Chicago Seven
“Your Honor, I am glad to see Mr. Schultz finally concedes that things like levitating the Pentagon building, putting LSD in the water, 10,000 people walking nude on [in?] Lake Michigan, and a $200,000 bribe attempt are all playing around.” — Leonard Wineglass, Defense Attorney for the Chicago Seven 6
The YIPPIES, who were known for their subversive ways, used language that gave conservatives reason to see them more as a threat to the peace of the convention than as a legitimate political organization. The opening section of the YIPPIE Manifesto read:
Come all you rebels, youth spirits, rock minstrels, bomb throwers, bank robbers, peacock freaks, toe worshippers, poets, street folk, liberated women, professors and body snatchers; it is election day and we are everywhere.7
The spectacle of YIPPIES openly advocating the congregation of “bomb throwers” and “bank robbers” was just cause for the city of
THE MENLO ROUNDTABLE 23
Chicago to worry about their imminent presence, especially with political figures present, and especially in the wake of the riots that had followed the assassination of Martin Luther King, Jr., in April. However, the juxtaposition of these violent terms against a call for “peacock freaks” and “toe worshippers” gave their manifesto a comical air, something the YIPPIES were known for. The YIPPIES were not a violent organization; they were not the splinter-cell, militant Marxist-Leninist Weathermen. They were not American terrorists looking to force America into a proletarian uprising through the use of bombs or physical violence. When the humor and sarcasm in their manifesto was not understood, however, they acquired a threatening image more appropriate to the Weathermen.
The behavior of the YIPPIES was a shock for conservative Chicago, a city whose policemen had by and large joined the force out of a desire to protect conventional 1950s-era social values. Recollections from Vice President Hubert Humphrey about his interactions with radical protestors further serve to prove that these particular protestors deliberately set out to provoke a harsh response from the police: “It’s not very pleasant to…have people throw urine [and human excretia] on you…by people who say they believe in peace and brotherly love…I don’t consider that peace-making.”8 Humphrey certainly had a point. The police were there to protect the public, including the presidential candidates, from harm; having fecal matter thrown at a political figure constitutes harm. Therefore, the police were responding to a legitimate threat of assault towards a public figure; their response, in that sense, was justified. Humphrey also alluded to the YIPPIES making a mockery of the disciplined non-violence of SDS; they undermined the message of peace by acting as the “jokesters” of the activist bunch, and ended up being more detrimental than helpful to the cause of youth activism.
In the aftermath of the convention, eight men considered as the main instigators of the Chicago protests were charged with “intent to incite, organize, promote and encourage and… [speaking] to an assemblage of persons for the purpose of inciting, organizing, promoting and encouraging a riot, in violation of Title 18, United States Code, Section 2101,” and found guilty.9 What began as the trial of the Chicago Eight (Dave Dellinger, Rennie Davis, Tom Hayden, Abbie Hoffman, Jerry
24 Shelby Rachleff
Rubin, John Froines, Lee Weiner, and Bobby Seale) turned to a trial of only the first seven, as Seale ended up being tried separately and under more charges. Prosecution witnesses such as Chicago Police Chief Robert Murray testified to the violent and obscene measures the protestors employed to elicit a response from the police, including yelling vulgar abuse and throwing objects at the police, ranging from rocks to cigarette butts.10 This style of provocation fit with the reputation of the YIPPIES (of which Rubin and Hoffman were founders), and resulted in an initial guilty verdict. In 1972, however, the remaining five (Froines and Weiner had been found innocent in the first trial) of the Chicago Seven were found innocent on appeal of violating the Anti-Riot Act of 1968, and charges for both this and for contempt were dropped, dispelling the legal notion that the convention protestors had merited the police beating they received.11
The Implications of Clubs and Communism
“You just can’t bury your head in the sand or get all touchy-feely when you’re a cop. That’s for the talking heads and the sops to cry over. And Christ, was there a lot of them. I think that we were realists and we did the job that most everyone wanted us to do even though they didn’t always want to admit it out loud.” — Steve Nowakowski, Chicago Police12
The protest at the 1968 Democratic National Convention, meant to illuminate how U.S. involvement in Vietnam had made a “mockery of democracy,” was planned to be a non-violent protest by an organization of students; leaders and students involved in SDS abstained from physical violence throughout the protest.13 The Wednesday of the convention marked the highest point of tension between the police and the protestors. As the protestors prepared to march peacefully to the convention hall, Mayor Daley prepared a counter-attack, putting the National Guard on standby, ready to stop the protestors from making it to their mark by “any means necessary,” a sign of both preemptive and indiscriminate action on the part of Chicago authorities.14 The result was a bloody conflict. The police, a group of men who generally abhorred the New Left and hippie culture, saw a protestor tearing down an American flag, catalyzing the conflict
THE MENLO ROUNDTABLE 25
between the declaredly non-violent protestors on one side and fierce protectors of American society and values on the other, with the flag as the symbolic manifestation of those values. The desecration of the flag was therefore meant and understood as a declaration of war on both the physical and ideological levels; not only were the police fighting a potentially “dangerous” army of young people, they were fighting a manifestation of the threat of communism to their society. Ideological differences, however, do not justify the use of force against a protestor; after all, desecration of the flag is not against the law. Rennie Davis, one of the leaders of the protest and another declaredly non-violent leader, was beaten by the police in the act of trying to calm down protestors agitated by the harsh police response.15 Sixty people, a mix of protestors and non-affiliated convention attendees, were hospitalized with injuries from this police battle.16
To say that the “long-haired hippie freaks” and the conservative Chicago police force didn’t see eye-to-eye would be to put it mildly; however, their fundamental issues with each other stemmed from controversy over the same issue: communism. The concept of the United States’ failure to remain the “initiator of the United Nations” in spirit was a rallying point for the bourgeois members of SDS.17
Student organizations at the time did tend to focus on communism, with organizers like Tom Hayden quoting Mao and nearly all of them looking favorably on Marxist thought.18 The Port Huron Statement reflects a desire to achieve a society in which all men are equals, one in which the division of nations that causes a war like Vietnam doesn’t exist. As stated earlier, the police were ardently anti-communist, having mainly come of age during the height of the Red Scare in the 1950s.19
Their response, therefore, was not unanticipated; in January of 1968, Rennie Davis, along with Tom Hayden and Dave Dellinger (among others) met to discuss the inevitability of arrest at the convention, even if they practiced non-violence.20 Their presentiment of the police attacks suggests the existence of a bias against the protestors, no matter what their actions. The fact that the police retaliated in such a violent manner against peaceable citizens exercising their first amendment rights to freedom of assembly and speech supports argument that
26 Shelby Rachleff
their response was unjustified. There was already a history of police intervention against student protests. During the Columbia Sit-In, 692 students were arrested, with more than 1000 police officers coming to disperse them.21 Another prior instance of police reaction to student protestors was the Yip-In at New York’s Grand Central Station, also in the spring of 1968, where injuries ended up tallying to more than one hundred. Todd Gitlin, Berkeley professor of sociology and at the time an SDS member, points out that even New York Mayor John V. Lindsay declared the police to have used “excessive force” during the Yip-In.22 These previous instances of police brutality allowed Hayden and others to foreshadow their own fate. The New Left was repugnant to most American police, a clear and present subversive threat to law and order. In that sense the protestors arrived at the convention with the odds against them, and their taunts only served to incite an already hostile police force to the point of physical action.
The National Opinion
“Mayor Daley, a family man, welcomes you to a family town.” — Billboard in Chicago, August 196823
The Walker Report to the National Commission on the Causes and Prevention of Violence, written by attorney and eventual governor of Illinois Daniel Walker, was commissioned by President Lyndon B. Johnson to establish what had really happened between the police and the protestors at the Chicago convention. After taking the testimony of thousands of firsthand witnesses, participants, and police officers, the Walker Commission published its findings on December 1, 1968, stating that:
The nature of the response was unrestrained and indiscriminate police violence on many occasions, particularly at night. The violence was made all the more shocking by the fact that it was often inflicted upon persons who had broken no law, disobeyed no order, made no threat. These included peaceful demonstrators, onlookers, and large numbers of residents who were simply passing through, or happened to live in the areas where confrontations were occurring.24
THE MENLO ROUNDTABLE 27
This commission report eschewed the notion that the provocation of the protestors was equal to the clubs wielded by the police force. And because the Report compiled firsthand testimony from such an array of witnesses, and because it was commissioned by the President and not the city of Chicago, the report was accepted as factual and thorough. The Walker Report therefore argues for a verdict of innocence for the protestors. The fact that so many spectators and passers-by were assaulted makes the violence described in the Walker Report all the more shocking for its indiscriminate nature. However, the document wasn’t universally accepted, especially by the leaders of the protests. Tom Hayden later wrote that the report “covered up the real conspirators who gave the police their orders in Chicago: Daley, Humphrey, Johnson.”25 The “unbiased” nature of the report could therefore be called into question. The Chicago authorities were left blameless, unlike in such other accounts of the convention as John Schultz’s No One Was Killed.26 Even so, the report did serve to assuage some of the blame against the protestors.
“Mayor Daley was permitted to take over the media. Our own editorialists told us that we didn’t really see what we saw under those blue helmets. The violent scenes of police crowd dispersal became ‘riots,’” read one New York Times article from October 1968.27 The men “under those blue helmets,” the police, were protected by the Chicago authorities. This article seemed to corroborate the previously discussed pre-convention conspiracy theories of Hayden, Dellinger, and Davis. The initial media cover-up of police brutality lent weight to the notion that the Chicago city government, and Mayor Daley in particular, realized that something had gone wrong at the convention and that it would hurt their image if the true story of the trial got out. In the weeks following the convention, however, public opinion about the police response began to change. Donald Janson’s article in the New York Times, exposing the media slant and attributing it to Daley, reached a mainstream audience who otherwise would not have likely known about the events of August in much detail. Janson maintained that the “hippies” were unfairly blamed for acts of vandalism committed by the police.28 The mainstream media thus played a role in helping to expose the reality of the police actions at the convention by continuing to follow the story after the convention was over.
28 Shelby Rachleff
Looking Forward
“The ’60s are gone, dope will never be as cheap, sex never as free, and the rock and roll never as great.” — Abbie Hoffman
Spanning the course of the Chicago convention, protestors shouted abuse at the police, and the police responded by giving vent to their own pent-up aggression towards a changing society personified by the “long-haired hippies.” While the protestors did end up successful in the sense that they were ultimately not found guilty of inciting a riot, the convention did result in the deterioration of the structure and legitimacy of SDS. Following the convention the group fragmented, with the militant Weathermen breaking away, a split that had been foreshadowed at the time of leader Mark Rudd’s instrumental role at Columbia. Jerry Rubin and Abbie Hoffman are both dead. Tom Hayden has been active in California state politics, and Dave Dellinger continued to protest, even getting arrested at the age of eighty-three.29
While their respective organizations may have ended in relative failure, the idealism represented by the youth activism of groups like SDS are what have enabled the degree of student activism visible in the United States today. In fact, SDS is beginning to show up on college campuses nationwide once again. Perhaps the world is a stage for student protest once again; the whole world might soon be watching.
Notes
1. James Miller, Democracy Is in the Streets: From Port Huron to the Siege of Chicago (Cambridge: Harvard University Press, 1994), 284.
2. Ibid.
3. Tom Hayden, “The Port Huron Statement,” in Takin’ It To The Streets, ed. Alexander Bloom and Wini Breines (New York: Oxford University Press, 2003), 51.
4. David Barber, A Hard Rain Fell: SDS and Why It Failed (Jackson: University Press of Mississippi, 2008), 5.
5. Todd Gitlin, The Sixties: Years of Hope, Days of Rage (New York: Bantam Books, 1993), 306-307; Miller, 290-292.
THE MENLO ROUNDTABLE 29
6. United States of America vs. David T. Dellinger, Rennard C. Davis, Thomas E. Hayden, Abbott H. Hoffman, Jerry C. Rubin, Lee Weiner, John R. Froines, and Bobby G. Seale, 69CRI80 (Ill. 1969).
7. Abbie Hoffman and Jerry Rubin, “YIPPIE Manifesto,” in Bloom and Breines (New York: Oxford University Press, 2003), 278.
8. Charles Kaiser, 1968 in America: Music, Politics, Chaos, Counterculture, and the Shaping of a Generation (New York: Grove Press, 1988), 247.
9. United States of America vs. David T. Dellinger, Rennard C. Davis, Thomas E. Hayden, Abbott H. Hoffman, Jerry C. Rubin, Lee Weiner, John R. Froines and Bobby G. Seale, 69CRI80 (Ill. 1970).
10. Ibid.
11. Douglas O. Linder, “The Chicago Seven Trial: A Chronology,” The Chicago Seven Trial, http://www.law.umkc.edu/faculty/projects/ftrials/Chicago7/chronology.html (accessed February 27, 2009).
12. Frank Kusch, Battleground Chicago: The Police and the 1968 Democratic National Convention (Chicago: University of Chicago Press, 2008), 14.
13. Miller, 284.
14. Mark Hamilton Lytle, America’s Uncivil Wars: The Sixties Era From Elvis to the Fall of Richard Nixon (New York: Oxford University Press, 2006), 261.
15. Lytle, 261.
16. “Convention was Dissidents’ ‘D-Day’,” Chicago Tribune, September 7, 1968.
17. Hayden, 51; Barber, 54-55.
18. Kaiser, 230.
19. Kusch, 13.
20. David Farber, Chicago ’68 (Chicago: University of Chicago Press, 1994), 80.
21. Gitlin, 307-308.
30 Shelby Rachleff
22. Ibid.
23. Kaiser, 230.
24. Daniel Walker, “The Walker Comission,” in Bloom and Breines (New York: Oxford University Press, 2003), 370.
25. Michael R. Belknap, American Political Trials (Westport: Greenwood Publishing Group, 1994), 250
26. Gitlin, 326.
27. Donald Janson, “Newsmen Assail Chicago Papers,” New York Times, October 13, 1968, http://www.nytimes.com (accessed February 26, 2009).
28. Ibid.
29. Linder, “The Chicago Seven Trial.”
BibliographyPrimary Sources
“Civic Leaders, Groups Hail Daley and Police for Actions,” Chicago Tribune, September 2, 1968.
“Mayor Daley Defends His City,” Chicago Tribune, September 7, 1968.
Hayden, Tom. “The Port Huron Statement.” In Takin’ It To The Streets, edited by Alexander Bloom and Wini Breines, 50-61. New York: Oxford University Press, 2003.
Hoffman, Abbie, and Jerry Rubin. “YIPPIE Manifesto.” In Takin’ It To The Streets, edited by Alexander Bloom and Wini Breines, 278-279. New York: Oxford University Press, 2003.
Janson, Donald. “Newsmen Assail Chicago Papers.” New York Times, October 13, 1968.
Lukas, J. Anthony. “U.S. Judge Orders Contempt Terms in Chicago Trial.” New York Times, February 15, 1970.
United States of America vs. David T. Dellinger, Rennard C. Davis, Thomas E. Hayden, Abbott H. Hoffman, Jerry C. Rubin, Lee Weiner, John R. Froines, and Bobby G. Seale, 69CRI80 (Ill. 1970).
THE MENLO ROUNDTABLE 31
Walker, Daniel. “The Walker Commission.” In Takin’ It To The Streets, edited by Alexander Bloom and Wini Breines, 369-375. New York: Oxford University Press, 2003.
Secondary Sources
Barber, David. A Hard Rain Fell: SDS and Why It Failed. Jackson: University Press of Mississippi, 2008.
Belknap, Michael R. American Political Trials. Westport: Greenwood Publishing Group, 1994. Farber, David. Chicago ‘68. Chicago: University of Chicago Press, 1994.
Gitlin, Todd. The Sixties: Years of Hope, Days of Rage. New York: Bantam Books, 1993.
Kaiser, Charles. 1968 in America: Music, Politics, Chaos, Counterculture, and the Shaping of a Generation. New York: Grove Press, 1988.
Kusch, Frank. Battleground Chicago: The Police and the 1968 Democratic National Convention. Chicago: University of Chicago Press, 2008.
Linder, Douglas O. “The Chicago Seven Trial: A Chronology.” The Chicago Seven Trial. http://www.law.umkc.edu/faculty/projects/ftrials/Chicago7/chronology.html.
Lytle, Mark Hamilton. America’s Uncivil Wars: The Sixties Era From Elvis to the Fall of Richard Nixon. New York: Oxford University Press, 2006.
Miller, James. Democracy Is in the Streets: From Port Huron to the Siege of Chicago. Cambridge: Harvard University Press, 1994.
32 Shelby Rachleff
Rocket Power Technical Report
Sam Parker, Bobby Pender, Abby McCall, James Carpenter, Nick Maruyama & Megan Hodge
1 Abstract
Our objective this year was to create a robot for the FTC competition HotShot!, which involved shooting Whiffle balls into a variety of different goals. We created a conveyor belt with a ramp to pick the balls up and get them into a holding box. We built the box with a hole in one side with mesh netting attached so that the balls could travel down to reach the shooter. At the shooter the balls would be propelled forward by passing through two wheels spinning in opposite directions. On the day of the competition our robot ended up not working at all as we had expected. Our shooter had a loose chain and a lot of friction interfering with the DC motor. We decided that we should have gone with a simpler design because too many problems came up with ours. We also decided that we should have tried various different approaches rather than just revising the same idea over and over again as we did. Our strategy was constantly refined during the competition as we adapted to mechanical problems and varying opponents, and was ultimately a strong point for our team.
2 Introduction
Over the course of three and a half months, our team designed and constructed a robot to compete in the 2010 First Tech Challenge. The challenge this year, called HotShot!, consisted of a 30-second autonomous mode and a two-minute tele-operated mode. At the start of the game each robot, two per team, was preloaded with up to eight balls, and during the autonomous mode a team could score points in four ways: by hitting the ball chute lever or by scoring in the one-point goal area, the raised five-point goal, or the ten-point off-field goal. The autonomous program proved essential, as points scored in autonomous
This paper was written for Marc Allard’s Robotics class in the spring of 2010.
mode were awarded double point value. The basic idea for our robot included the abilities to pick up the balls, store them, and consistently shoot them into the upper 5-point goal and the 10-point off-field goal. Our final design was only able to score in the one-point goal, but due to our consistency and our understanding of the importance of strategy, scouting, and defense, we had great success at the FTC Challenge.
Figure 1: The robot at the competition 3 Robot Overview
3.1 Specifications
Size: 17 in x 17 in x 16 inWeight: 15 pounds
Motors: 8 DC Motors • 4 to power wheels in All-Wheel Drive• 2 to power conveyor belt• 1 to power shooter• 1 to power spinning ball accelerator
Motor Controllers: 4 DC Motor ControllersWheels: 6 Full-Size Wheels• 4 for locomotion• 2 for shooter
34 Sam Parker et al.
3.2 Key Features
The first main part of our robot was the conveyor belt. It enabled us to lift the balls to the storage area and the path to the shooter. Figure 2 shows how we mounted the polycarbonate material in a way that allowed it to flex while still keeping pressure on the ball moving upwards. The polycarbonate is only attached to the frame of the robot at the bottom, so the top can move up to an inch to accommodate a ball coming up the conveyor belt. The DC motors used to power the conveyor belt are also visible to the left of the belt. The black plastic was added to ensure that balls did not fall out the sides of the conveyor belt while traveling up.
Figure 2: Conveyor belt
The next main element of our robot was the storage box used to hold the balls on the robot. It was mounted near the top of the robot so that once the balls were released they could roll to the shooter using gravity, gaining momentum and eliminating the need for another motor. Balls exit the top of the conveyor belt and fall directly into the box, which can hold up to five balls. In Figure 5, the hole seen in the bottom of the box on the left side allows balls to fall into the path towards the shooter. This easy design worked very well for us, even though we could not regulate when the balls would fall through.
THE MENLO ROUNDTABLE 35
Figure 3: Storage box
The last critical part of the robot was the shooter. The shooter operated on the same principle as a baseball pitching machine: two wheels spin very fast in opposite directions so that when a ball rolls between the wheels, it is shot out at a high speed. For this design to work, we needed to make sure that the wheels had just enough space between them to fit a Whiffle ball, but not so much that the ball could avoid one of the wheels and not be properly shot out. We also needed to gear the wheels 9-to-1 against the motor to make sure that they spun fast enough. It turned out that the only way to meet both of these criteria with the gears and wheels we had was to use a chain and sprockets to connect one wheel to the other. The chain, which can be seen in the bottom right of Figure 4, was the most troublesome part of the robot. In order to work it needed to fit perfectly onto the sprockets, but our chain was a little too loose and kept falling off. Because of this and the fact that our gearing system had too much friction, the shooter often got jammed, damaging the motor. We ultimately decided to get rid of the shooter by removing the left wheel, as seen here. This way the balls could just roll out of the front of the robot into the one-point goal.
36 Sam Parker et al.
Figure 4: Shooter
4 Design Strategy
Our design focused around our shooter, which we expected to be able to shoot into the off-field goal. In order to make this possible, our first problem was being able to pick up balls and raise them so that we could store them high on the robot before shooting them out near the bottom. Our solution was to create a conveyor belt out of non-stick material that pinched the balls and raised them to the top of the robot. On one side of the passageway was a belt of non-stick material powered by a DC motor at each axle. On the other side was a polycarbonate board covered with a layer of nonstick that was mounted to the main frame only at the bottom. The passageway was not quite large enough to fit a ball all the way up, thus forcing the polycarbonate to bend and keeping pressure on the ball. In this way we were able to get enough tension on the ball to raise it with the conveyor belt.
We had trouble getting the balls to get caught on the conveyor belt, so we added an extra DC motor with more non-stick material attached to shoot the balls towards an incline into the conveyor belt. This worked by applying a lot of small forces on the ball in the form of spinning pieces of fabric, with the end result of greatly accelerating the ball towards the conveyor belt.
THE MENLO ROUNDTABLE 37
The storage space for the balls went through many different theoretical designs. Our first idea was just to build a box of plastic that could hold about eight balls, with a hole in the bottom where balls could drop through to the shooter. Then we thought this was not effective enough at holding balls, so we drew up a system of rails that could transport the balls downwards in either a spiral or a snake pattern to the shooter. That, we decided, was far too complicated, so we also considered a straight rail from the top of the conveyor belt to the shooter, which would be fast but couldn’t hold many balls. Eventually we came back to the box idea and finally built and mounted the box onto our robot.
Lastly, we experimented with a number of ways to feed the balls into the shooter. Our main problem was that the hole in the box was not in line with the center of the shooter where the balls would have to end up. One of the proposals was a bent plastic ramp between the hole in the bottom of the storage box and the shooter. We weren’t able to secure our plastic to the robot in a way that would make this possible, so we next thought of trying to bend metal rails to guide the balls to the shooter. However, the rails proved unbendable, so we tried to use a loose net to funnel the balls straight to the shooter. The net was too loose, however, and ended up just catching the balls in a slack spot and not getting them to the shooter at all. We finally decided on a net to let the balls run sideways and down from the hole in the box to a plastic ramp, which led into the shooter.
The shooter was always a source of trouble to our team because of the friction in so many spinning axles. Also, the chain and sprockets did not mesh as tightly as we wanted, so the chain was liable to slip off the sprockets or jam in the teeth. After borrowing some lubricant from another team, we were finally able to get our shooter working smoothly. However, the shooter was almost parallel to the floor, so it wasn’t able to shoot into the off-field or high goals. For our first match, we planned on using the shooter to shoot balls into the low goal, but the balls ended up going much too far or rolling out of the low goal. Since we didn’t need the balls to be shot into a goal on the ground, we just took a wheel off the shooter and took its coding out of our programs. This way, the balls could simply roll out of the front of the robot straight into the low goal. Although anti-climactic, this strategy ended up being our best way of scoring points
38 Sam Parker et al.
5 Software Strategy Our autonomous program was designed to move the robot directly towards the center goal and unload all our balls into the one-point goal. We decided on this strategy because the one thing our robot could do consistently was move and let balls roll out of the front end. We thought it was more valuable to get five balls into the low goal than to try to hit an elbow and release the ball chute, because the balls would be worth an additional five points at the end of the match. Our program coded for each of the wheels independently using wait commands, as that was the easiest way to make adjustments on the go. Our robot would immediately pivot about ten degrees to the left, then move forward for three seconds to stop right in front of the low goal. This movement jostled free the balls we had stored in the storage box, so they would fall through the hole and roll out the front of the robot.
The main objective of our tele-op code was simply to code for each function of the robot with a separate area of the controller. First, we set all the wheels to respond to one joystick to keep things simple for our driver. A few of the functions of the robot we decided should always be running during game play; these included the spinning ball pusher and the conveyor belt, so those were set to start running at 100 percent from the beginning of the program and never stop. Other functions, like the shooter, were more advantageous when turned on and off, so we had separate buttons on the controller. One set the shooter to 100 percent power, one set it to 50 percent power, and one turned it off. When we eventually decided to dismantle the shooter, we deleted all of the code to run it. Our tele-op program worked to perfection in all matches. 6 Robot Characterization
In order to create the graph in Figure 5, we had our robot run for four seconds at a certain power level on all wheels. We measured the distance that the robot traveled in those fours seconds, and then used that value to calculate the robot’s average speed in feet per second. The averaged values shown in the graph below are an average of the three tests run at each power level.
THE MENLO ROUNDTABLE 39
Figure 5: Speed vs. Power
7 FTC Result
Our robot came into NorCals without any testing, so we were learning on the fly. In our four qualifying matches, we won two and lost two, but one of our losses was originally a win before the head referee overturned a disqualification for the other team. We finished in 19th place out of 34 teams. We had a number of problems during the day that affected our design. In our first match, a plastic piece of the robot got caught in the foam floor of the arena so that our robot could only move backwards. Our driver then accidental backed it into a wall, hitting the power switch and turning off our robot mid-game. We corrected this after the match by raising the robot to give it more clearance and moving the power switch to a more protected position. We also ran into problems with our shooter in the early going and decided to take it off and change our strategy a little. Removing the shooter was a last-minute decision but it turned out to be a good one. Rather than shoot the balls, we dropped them into the goal during the autonomous stage. We also had some problems with the ramp to the conveyor belt because balls got jammed inside, making it impossible to pick up and shoot any loose ones in the field. We had to rely on our
40 Sam Parker et al.
four preloaded balls and our teammate’s balls for points, which in the end was not a reliable enough strategy to win.
8 Conclusion
From our experiences in class and at NorCals we learned a lot about what we should have done in building our robot. First, we made our robot too complex, causing it to be very unreliable and prone to failure. After NorCals we realized that the simplest robots were the most successful, so we should have designed the robot in the first place to only go for the one-point goal. By removing the need for a shooter and a space-hogging conveyor belt, we could have made the robot much more reliable and efficient. Although our tele-op software was consistent, our autonomous program was inconsistent and only ran for about 12 seconds. We now realize that autonomous was crucial to win matches because all points scored are worth double. If we could rewrite our software now we would make a consistent program that dropped all the preloaded balls into the 1-point goal. After scoring, the robot would back up to hit the ball chute lever for another 5 points. If we had gotten this down, we could have scored 21 points in autonomous mode, which alone would have been enough to win several of our matches. Strategy was even more important than we had thought, and we ended up spending most of our time at NorCals scouting other teams. By scouting other teams we were able to defend against their strengths both in tele-op and autonomous modes with great success.
THE MENLO ROUNDTABLE 41
9 Appendix
Bill of Materials • FTC Robot, Team 3055 Menlo School • 2/18/10
Level Part No. Description Quantity U/M Unit Cost Total1 W739074 TETRIX
Tubes2 80mm $1.58 $3.16
1 W739073 TETRIX Flat Building Plates
3 each $5.98 $17.94
1 W739069 TETRIX Channel
4 416mm $7.98 $31.92
1 W739068 TETRIX Channel
3 288mm $11.98 $35.94
1 W739067 TETRIX Channel
5 160mm $7.18 $35.90
1 W739066 TETRIX Channel
5 96mm $5.58 $27.90
W739065 TETRIX Channel
1 32mm $4.78 $4.78
W739070 TETRIX Flat Bars
2 288mm $4.38 $8.76
W739057 12V Rechargeable NiMh Battery Pack
1 each $31.96 $31.96
W739025 TETRIX Wheel
6 3” diam $15.96 $95.76
W739088 TETRIX Axles
8 100mm $2.39 $19.12
W735871 TETRIX Axles
2 250mm $4.79 $9.58
W739172 TETRIX Axle Hubs
14 each $3.18 $44.52
W739091 TETRIX Bronze Bushings
15 each $6.38 $95.70
W739092 TETRIX Axle Set Collars
6 each $1.58 $9.48
42 Sam Parker et al.
Level Part No. Description Quantity U/M Unit Cost TotalW739028 TETRIX
Gears10 40-tooth $9.98 $99.80
W739085 TETRIX Gear
2 120-tooth $23.96 $47.92
W739171 TETRIX Sprocket Pack
2 32-tooth $13.98 $27.96
W739173 TETRIX Chain with Links
1 each $11.96 $11.96
W739089 TETRIX Motor Mount
7 each $15.96 $111.72
W739061 TETRIX Flat Brackets
6 each $2.78 $16.68
W739063 TETRIX Servo Joint Pivot Brackets
2 each $4.78 $9.56
W739062 TETRIX L Brackets
18 each $2.38 $42.84
W739090 TETRIX Gear Hub Spacer
4 each $3.18 $12.72
W739079 TETRIX Motor Shaft Hubs
7 each $3.18 $22.26
W739078 TETRIX Split Clamps
3 each $3.18 $9.54
W739097 Socket Head Cap Screws
60 1/2” $0.09 $5.26
W739098 Socket Head Cap Screws
29 5/16” $0.10 $2.77
W739094 TETRIX Kep Nuts
79 each $0.02 $1.86
THE MENLO ROUNDTABLE 43
(continued)
Level Part No. Description Quantity U/M Unit Cost TotalW758335 Cable Ties 13 each $0.02 $0.30 W739083 TETRIX DC
Drive Motor8 each $23.96 $191.68
W991444 HiTechnic DC Motor Controller
4 each $63.96 $255.84
W731903 TETRIX Motor Power Cable
7 each $1.56 $10.92
W739129 TETRIX On/Off Switch
1 each $5.56 $5.56
NXT Brick Module
1 each $300.00 $300.00
TOTAL: $1,659.57
44 Sam Parker et al.
(continued)
Nuclear Magnetic Resonance: The Foundation of Magnetic Resonance Imaging
Daniel Crankshaw
1 Motivation
I have been interested in physics for a while, but the only physics I have been exposed to has been basic classical physics, acting as an introduc-tion and laying the foundation for further study. I have studied me-chanics, electromagnetism, optics, fluid mechanics and some thermo-dynamics, but not any modern physics or quantum mechanics. I was interested in going beyond the physics encountered in my classrooms, so I have been doing some reading on my own about current physics experiments and some of the theory behind quantum mechanics. Dr. Dann was aware of this, so when he bought a Magnetic Resonance Imaging (MRI) machine this year, he suggested I do some experiments with it for my second semester project, as this would teach me a lot about quantum mechanics (as MRIs work using quantum interactions) and introduce me to the world of experimental physics.
The project will explore how atoms of different elements interact with one another at the quantum level. In essence, it will be taking pictures of chemical reactions to see whether chemists’ theories for how ele-ments and chemicals interact with each other are correct. I will be able to do this by imaging a single element and determining at what fre-quency resonance occurs, repeating this process for another element, and then imaging a chemical composed of the two elements. When this third image is taken, the two resonant frequencies of the two ele-ments can be seen, but then at least one more resonant frequency peak can be seen, which represents the quantum interference of the two ele-ments. It is the quantum mechanical effect of the electron wave func-tions of one atom interfering with those of another.
This paper was written for Dr. James Dann’s Applied Science Research class in the spring of 2009.
This idea was first carried out by Robinson et al., [1] where the authors used two-dimensional Nuclear Magnetic Resonance (NMR) spectros-copy to obtain spectra of trifluoroethanol and para-difluorobenzene and observed the interference effects of the electron wave functions. MRI imaging is a vital aspect of diagnostic medicine, as it is a nonin-vasive procedure that allows doctor to see soft tissue. Functional MRI (or fMRI) is also a key tool in brain and cognitive research, as it allows investigators to observe blood flow to different sections of the brain in real time.
2 Theory
All elementary particles have an intrinsic quality called spin. Although it behaves similarly to angular momentum (hence the name), some particles that have spin (like electrons), are point particles and there-fore cannot literally spin. Instead, the spin is due to a “circulating flow of energy in the wave field” [2]. Spins can have either half or full inte-ger values. Additionally, every particle can be in a spin up or spin down state, which correspond to slightly different energy levels, causing their spin values to be positive or negative. The spin of a particle also gives rise to its magnetic moment, another intrinsic quality. But more than just elementary particles can have spins. Nuclei can as well, for ex-ample. In that case, spin is the part of the angular momentum of the nucleus that is separate from the motion of the center of mass.
The particle most MRIs interact with is the proton, as it constitutes the entire nucleus of the hydrogen atom. So when protons, which each have a spin of either +1/2 or -1/2, are placed in a strong magnetic field, a process called spin polarization occurs. This means that while most of the protons’ spins are randomly aligned, there is a slight net align-ment in the direction of the magnetic field. A +1/2 spin is the lower energy state of protons and is the state they are in when they are placed in the magnetic field with no other interactions occurring. The energy of a particle in a particular spin state is given by the following equation (where m = 1/2 corresponds to spin up and m = -1/2 corresponds to spin down.
46 Daniel Crankshaw
THE MENLO ROUNDTABLE 47
mI = I, I-1, ... 1-I, -I
The small net alignment is due to the thermal energy of the particles (as they are at room temperature). This energy causes some of the par-ticles to be in the higher energy spin down state. The net magnetiza-tion has a direction and is referred to as the bulk magnetization vec-tor. This vector lies in the direction of the static magnetic field, in this case Earth’s field. The spins of each proton precess around this vector, resulting in one component of the magnetic moment in the direction of the bulk magnetization vector and one in the transverse plane, as illustrated below.
Figure 1: Magnetization
The BE vector is Earth’s magnetic field (the static magnetic field), the disc represents the transverse plane, MZ is the component of the mag-netic field in the direction of the bulk magnetization vector, and MXY is the component of the magnetic moment in the transverse plane. The direction of MXY for every proton is randomly distributed, however, so they all end up canceling out, resulting in a net magnetization in the z direction only.
U = –gmieh
2mp
NMR experiments control the bulk magnetization vector by applying an alternating electromagnetic field to the sample. If the frequency of this pulse matches the frequency at which the spins are precessing (the resonant frequency), then this energy induces a spin transition. The energy difference between levels is given by the following equation:
And the Larmor frequency, the resonant frequency of the protons, is given by this equation:
When the electromagnetic pulse is sent through the sample, it tips the bulk magnetization vector from being in the z-direction into the trans-verse plane by some angle θ. As this new bulk magnetization vector is excited, it precesses about BE. The B1 coil (the pickup coil) can detect the MXY component, as it induces a current in the coil. This current is only induced when the precessing magnetization vector’s frequency matches the resonant frequency of the pickup coil, which is set by the user. Through a Fourier transform, the MRI machine can determine where the resonant frequency is. This can then be plotted on the y-axis with position (x) or k-space (1/x) on the x-axis to create a one-dimensional plot.
One important measurement to make when conducting MRI experi-ments is the T1 relaxation time. This is a measurement of how long it takes for an equilibrium magnetization to be reached. In essence, it is a measurement of a transfer of energy, in this case the energy trans-fer between the spins of the sample and the surrounding material (re-ferred to as the lattice). This T1 time, along with the T2 time, a similar measurement but in this case of the energy transfer between neighbor-ing spins, provides a more unique signature to a particular MRI signal, allowing for more accurate imaging in the body. One can compare the different T1 and T2 times and tell more accurately where in the body the signal is coming from.
48 Daniel Crankshaw
∆U =gehB0
2mp
f =e
4πmp
∆Uh
= g B0
3 Results
In order to get clear results from MRI and NMR experiments, there must be no large disturbances in the magnetic field, in this case Earth’s field. This is partially because the homogeneity of the field is very im-portant in determining where the protons are located. An unexpected spike or dip in the magnetic field means that the Larmor frequency will be changed (either up with a spike or down with a dip), which means that the frequency picked up by the MRI will be wide, resulting in an inaccurate picture. A magnetic field with a known gradient, on the other hand, can be used to take 2D images. Additionally, magnetic field interferences can prevent the spin alignment from happening as it should, which then prevents any sort of accurate picture from being produced, as the production of many different frequencies can drasti-cally reduce the signal-to-noise ratio.
The classroom where the EFNMR is located happens to have many sources of magnetic noise. There are multiple other science and engi-neering projects being carried out in the room, many of which include the use of extremely strong magnets. Additionally, the fluorescent lights used to light the room produce noise, as do the many computers located around the classroom. These, along with other factors, produce a background noise of about 50 μV. In order to get clear pictures, the noise level must be below 10 μV, and below 5 μV for the best results. This is because the signal induced in the pickup coil is usually no more than 50-70 μV, and the signal-to-noise ratio must be at least 5:1 to get a significant signal. Therefore, in order to get a better picture, it proved necessary to reduce the ambient noise. This was accomplished by building a Faraday Cage (albeit one with two open sides).
The first cage constructed was built out of thin aluminum sheet metal about 1.5 mm thick. The four sides of the cage were connected using 30 cm wide strips of aluminum bent into L-joints and screwed into two sides of the cage, four for each joint. This cage reduced the noise by about a factor of two, but there was still too much noise to proceed with any experiments. The next cage was built out of aluminum as well, but was about 13 mm thick and with the four sides welded together, forming a much better electrical connection along the corners. The
THE MENLO ROUNDTABLE 49
added thickness provides far more insulation against electric and mag-netic fields, both of which can interfere with NMR experiments.
This new cage lowered the noise far enough to conduct experiments (about 4 μV). However, the strong magnetic pulse induced eddy cur-rents in the shield, which need to die down before a signal can be picked up. Finding the right delay is tricky, however, and took a while, especially because the shield being used in this experiment is thicker than the shield Magritek designed, so the delay must be longer than they advise. Finally, the correct delay was determined to be 130 ms. With the shield, this yielded a good result. (See Appendix A.) The reso-nant frequency of protons in Earth’s magnetic field in the classroom is about 2100 Hz, and with the shield the experiment yielded a signal-to-noise ratio of about 60:1.
While the shield dispels magnetic and electric fields very effectively, the same principle means that when there is a large magnetic pulse in the MRI machine, there is an induced current in the shield. The MRI machine creates a magnetic field running through the center of the so-lenoid. Normally this would not induce a current in the shield, but due to fringing effects there is magnetic flux through the shield. According to Faraday’s Law, the time derivative of magnetic flux is equal to the induced emf (dφ/dt = ε) and the magnetic flux is the integral of B • dA. So as the magnetic pulse in the MRI machine changes in intensity, the derivative is non-zero and there is an induced emf, resulting in eddy currents. Luckily, these eddy currents die down very quickly, but until they do the interference they create makes it impossible to pick up an MRI signal, necessitating a longer delay.
The final experiment I attempted was a measurement of the T1 relax-ation time for Earth’s magnetic field. At first I was having difficulty getting a reading with a reasonable margin of error. The process works by creating a magnetic pulse to get an MRI signal, measuring the am-plitude of the signal after a constantly increasing amount of time, and then integrating along the best fit line. This provides the T1 time. When I started the time interval at 300 ms after the pulse instead of 0 seconds, I was able to get a good signal with only about a 10% margin of error. My T1 time from Earth’s magnetic field was 2600 ms +/- 300, and my T1 time from the polarization magnetic field was 2500 ms +/- 265.
50 Daniel Crankshaw
4 Appendices
4.1 Appendix A: PulseAndCollectMacro
Figure 2: Screenshot of the results of the PulseAndCollectMacro. This screenshot shows both the FID graph (upper left), and the frequency amplitude graph(generated from a Fourier Transform). The FID signal is an oscillatory decaying signal, with a max amplitude of about 60 μV. The bottom of the screenshot shows the parameters used to get the signal.
THE MENLO ROUNDTABLE 51
4.2 Appendix B: Photos
A
52 Daniel Crankshaw
B
Figure 3: Photos of the experimental setup from multiple angles. A: A side view of the setup. The MRI machine is visible inside the shield. The polarization coil is visible on the outside of the MRI and the ground can be seen connecting the shield to the ground of the MRI machine. B: A top view with a better view of the shield and the ground.
THE MENLO ROUNDTABLE 53
5 Bibliography
1. Robinson, Jeremy, et al, Journal of Magnetic Resonance 182 (2006) 343.
2. Ohanian, Hans. (1990). Principles of Quantum Mechanics. Prentice-Hall (Englewood Cliffs, NJ).
The goal of this project is to produce a system using an Arduino micro-controller that allows the user to capture events on photographic film that happen too quickly to be viewed by the human eye. The system consists of multiple sensors (laser, sound, and infrared) that all serve to trigger a camera strobe. The final product includes the ability to switch between these sensors and set a variable delay time through a physical interface (potentiometers and switches).
2 Introduction
High-speed photography doesn’t need much of an introduction; we’ve all seen the pictures of water balloons mid-burst and apples immedi-ately after a bullet has cruised through their center. What does need some clarification, however, is how these pictures are obtained. Trial and error? Huge expensive rigs? Hardly. While trial and error does come into play every so often with some of the slower moving col-lisions (like drops of water), it is very time consuming and becomes nearly impossible when attempting to capture an object approaching the speed of a bullet. Expensive rigs, while sometimes used, are hardly necessary to begin capturing high-speed events.
The two main methods used in high-speed photography involve either an extremely fast shutter or a strobe [1]. Both of these methods use some sort of sensor to trigger them, as human reactions are too slow to capture most instances. The fast shutter method does not require any special circumstances, although the strobe method does. If a strobe is used, the subject must be placed in a pitch-black room. The camera is manually set to a long exposure time (anywhere from three to ten sec-
This paper was written for Dr. James Dann’s Applied Science Research class in the spring of 2010.
onds) and the flash triggers for a split second. The split second the flash is on is the only time when the film is being exposed, which allows for the capturing of a precise moment.
This project will utilize the strobe method, allowing the user to replicate high-speed photography using a microcontroller. It includes multiple sensing options that are used in conjunction with a microcontroller to trigger a flash. These sensing options include a microphone, laser, and infrared sensor. These will be explained in detail further in the paper, but ultimately all the sensors serve to trigger the flash unit.
The idea for the project came from a website [2] that listed the top 40 projects that use the Arduino (a cheap, widely used microcontroller) [3]. The article that ultimately led to this project was entitled “How to: High-speed Photography using the Arduino” [4].
The system created for this project is interesting not only for the amaz-ing pictures it can produce, but for its successor: high-speed videog-raphy. This allows the whole process of whatever is happening (a bulb shattering, for example) to be played back frame by frame and viewed in excruciating detail. It has huge potential beyond simple entertain-ment, as it can be used to understand occurrences that happen much too fast to be taken in by the human eye. Videos played back in slow motion can be used to analyze everything from surface tension to missile accuracy [5]. The techniques for high-speed videography are completely different than for high-speed photography, however, as the cameras utilize a rotating prism rather than a shutter to capture im-ages [6]. As a result my work is limited to photography, which has less scientific use but high entertainment value.
While the definitive start to high-speed photography is speculative, some consider it to be the result of experiments done in 1851 by Wil-liam Henry Fox Talbot [7]. He attached a newspaper article to a rotat-ing wheel (rotating fast enough that the article could not be read) and then, in a dark room, exposed the newspaper to light for a fraction of a second using a Leyden Jar [8] (an early form of what we know as a capacitor) to generate a spark. The resulting image that was captured on a wet plate was sharp enough to be legible.
56 Isaac Lambing
The first practical use of this branch of photography came about in the 1870s, when Eadweard Muybridge questioned whether or not the feet of a galloping horse were all off the ground simultaneously [9]. Muy-bridge used a set of tripwires, each set to trigger a different camera in order to capture the full range of a horse’s gallop and settle the question in the affirmative.
A huge breakthrough for high-speed photography came with inven-tion of the Stroboscopic Flash System developed by Dr. Harold Edger-ton [10]. This system allowed for extremely short bursts of light to be produced, which allowed William Talbot’s method to work with much faster occurrences. Edgerton (1903-1990) is well known for his iconic images such as the bullet through the apple (Figure 1) and the photo of a milk drop, which “was featured in the New York Museum of Mod-ern Art’s first photography exhibit” in 1937 (Figure 2). This invention paved the way for high-speed photography and benefited everyone from physicists to army generals.
Figure 1: Edgerton’s bullet through the apple photo.
THE MENLO ROUNDTABLE 57
Figure 2: Edgerton’s milk drop photo.
3 Design and Construction
The duration of the flash from a typical flash unit hacked from a digital camera is about 1/1700th of a second, or approximately 590 microsec-onds [11]. Given the relatively low velocity of a falling water droplet, the disposable flash is able to capture a splash with relative sharpness. However, this ultimately means that it is necessary to utilize a higher quality flash unit so that shorter flash durations can be achieved. This allows for other sorts of pictures to be taken, like projectiles firing from an air gun or a Christmas ornament being shattered with a baseball bat. If I were to try to take a picture of a projectile from an airsoft gun traveling, say, 300 feet per second (a relatively slow speed) with a dis-posable camera flash, the BB would travel approximately: 2.1 in: (300 ft)*(12 ft/in)/(1700) during the time light is being expelled from the flash. The photo taken from such an endeavor would be no more than a streak of white.
The three different sensors, (laser/tripwire, sound, and infrared) all ultimately work in the same way. They take an input (movement of a physical object or a sound wave) and send a signal to the Arduino to trigger the flash circuit. This concept is outlined in Figure 3.
58 Isaac Lambing
Figure 3: The basic circuit. To illustrate the basics, the flash circuit is represented by an LED and the sensor by a switch. See Figure 4 for the completed circuit.
This circuit is used to show how the final setup will work. The switch serves in place of a sensor (either laser trip-wire, infrared, or micro-phone), and the LED saves the place of what will be the high-voltage flash unit. When the switch closes (or the sensor is triggered) a sig-nal is sent to the Arduino, which then lights the LED (or triggers the flash). An optoisolator must also be used in conjunction with the flash. By isolating the flash from the Arduino, this serves to eliminate any damage to the chip from a large voltage spike. The resistance of the resistor is 10,000 Ω, which limits the amount of current that travels to the digital input. The basic coding for the Arduino is as follows:
const int buttonPin = 2; // the number of the pushbutton pin const int ledPin = 13; // the number of the LED pin // variables (named as integers) will change: int buttonState = 0; // variable for reading the pushbutton status void setup() { // initialize the LED pin as an output: pinMode(ledPin, OUTPUT); // initialize the pushbutton pin as an input: pinMode(buttonPin, INPUT); } void loop(){
THE MENLO ROUNDTABLE 59
// read the state of the pushbutton value: buttonState = digitalRead(buttonPin); // check if the pushbutton is pressed. // if it is, the buttonState is HIGH: if (buttonState == HIGH) { // turn LED on: digitalWrite(ledPin, HIGH); } else { // turn LED off: digitalWrite(ledPin, LOW); } }
(This coding is adapted from a tutorial on the Arduino website, found here: http://Arduino.cc/en/Tutorial/Button.)
The laser sensor (Figure 4) will function as a tripwire. The laser will be powered by one of the Arduino’s digital pins and will be focused on a photoresistor. The photoresistor will serve as a break in a circuit between +5 V and an analog input on the Arduino. An analog input is used so that the system can be fine-tuned; a ‘cutoff ’ value can be set so that the code triggers only when the current drops below a certain level. When an object is dropped and breaks the line of the laser, the photoresistor increases in resistance and decreases the flow of current into the analog input. This drop in current is sensed by the Arduino and used to do two things. First, the power to the laser is turned off so that it will not be captured in the picture. Second, after a manually set delay (normally no more than 10 milliseconds), the Arduino triggers the flash circuit to light the scene and expose the film in the camera for a split second.
60 Isaac Lambing
Figure 4: Completed circuit with laser sensor and potentiometer. Laser sensor is comprised of laser and photoresistor, while potentiometer controls variable delay.
This coding was modified slightly when the laser sensor was added (Figure 4), as an analog pin was used to increase the adjustability of the trigger and a potentiometer was added to introduce variable delay. The coding for the laser tripwire is as follows:
const int sensorPin = 0; // set input pin for tripwireconst int laser = 7; // set output pin to power laserconst int ledPin = 8; // set output pin to optoisolator (to trigger flash)int sensorVal = 0; // defines variable for measuring analog input void setup() { pinMode(ledPin, OUTPUT); // defines pin as output pinMode(laser, OUTPUT); // defines pin as input digitalWrite(laser, HIGH); // turns laser on upon startup (so photoresistor will sense light and not immediately trigger flash) delay(1000); // delay to make sure laser is aligned
THE MENLO ROUNDTABLE 61
} void loop(){ sensorVal=analogRead(sensorPin); // set variable equal to value from analog input if (sensorVal<500) // if laser is broken, causing analog reading to drop below predetermined value, then:{ digitalWrite(laser, LOW); // turn laser off (so it won’t be in picture) digitalWrite(ledPin, HIGH); // trigger flash delay(10); digitalWrite(ledPin, LOW); // stop voltage to flash circuit delay(5000); //wait 5 seconds so that flash doesn’t trigger again while shutter is open } else { digitalWrite(ledPin, LOW); // keep flash off digitalWrite(laser, HIGH); // keep laser on }}
The sound sensor (Figure 5) works in a slightly different way. A regular studio microphone was hooked up to a guitar amplifier to provide a large enough signal even when very faint sounds (e.g., a water drop) needed to be heard. The signal from the amplifier was constantly fed into a digital pin on the Arduino through a diode in order to prevent the Arduino from receiving the negative portion of the sound wave, which could cause damage. The microcontroller checks this signal to see if the signal passes a threshold range determined in the program-ming. If it is above the predetermined range, then the Arduino will trigger the flash circuit and expose the film in the camera.
62 Isaac Lambing
Figure 5: Sound sensor. The diode is used to prevent negative voltage from potentially damaging the Arduino.
Coding:const int led = 3;const int input = 2;int soundVal = 0;
The infrared sensor (Figure 6) can be thought of as a modified trip-wire. Two infrared sensors are placed two inches apart. Each sensor is made up of an infrared LED and an infrared transistor facing each other. When voltage is applied to the LED, infrared light triggers the base of the photo-transistor, which allows voltage to flow into an in-put in the Arduino. However, when an object passes through a sensor, the infrared light path is broken and voltage is abruptly stopped. The Arduino pin senses this and starts a timer. When the second sensor is tripped, the timer stops and the elapsed time is stored as a variable. This variable is then multiplied by a certain number based on when you want the flash to trigger (e.g., 10 for 20 inches past the sensor, 15 for 30 inches past the sensor), and added as a delay. This allows the user to set the Arduino to trigger when the projectile has traveled a specific distance without the need for trial and error.
Figure 6: Infrared projectile sensor. Two infrared sensors are used to determine a projectile’s speed and set the delay for the flash trigger appropriately. (To decrease clutter in the diagram only one sensor is shown.)
The infrared sensor uses infrared LEDs and transistors to detect the speed of a moving object and delay the flash an appropriate amount of time so that the moving object is frozen in a pre-determined spot. The coding and diagram (see Figure 4) are presented separately from the main code and diagram for ease of understanding, but they will
64 Isaac Lambing
ultimately be combined together in the final product. The coding is as follows:
const int led = 8; // set led pinconst int first = 9; // set first infrared pinconst int second = 10; // set second infrared pinconst int delayPot = 3; // set delay potentiometer pinint firstState = 0; //variable for state of first infrared sensorint secondState = 0; // variable for state of second infrared sensorint val; // variable used for delaylong startTime; // variable used for timelong elapsedTime; // variable used for time
void setup () { pinMode (led, OUTPUT); // establish led pin as output pinMode (first, INPUT); // establish first pin as input pinMode (second, INPUT); // establish second pin as output}
Void loop () { val=analogRead(delayPot); // set val equal to reading from potenti-ometer val=map(val, 0, 1023, 30, 0); map potentiometer values to 0-30 firstState = digitalRead(first); // variable = reading from first sensor secondState = digitalRead(second); // variable = reading from sec-ond sensor if (firstState == LOW) { // if first sensor is tripped startTime = millis(); // set startTime = time elapsed since start } if (secondState == LOW) { // when second sensor is tripped elapsedTime = millis() - startTime; // determine elapsed time delay (elapsedTime*val/2); // delay time for object to pass preset dist digitalWrite(led, HIGH); // trigger flash delay(10); // delay digitalWrite(led, LOW); // turn flash off } }
THE MENLO ROUNDTABLE 65
The transition from an LED to a high-voltage flash unit is relatively simple, as shown through the depiction of an optoisolator in Figure 7 below.
Figure 7: Optoisolator
The resistor used is 50 Ω. The optoisolator serves to separate the high voltage of the flash from the Arduino so that any spikes of voltage do not damage the microcontroller. When a relatively small voltage is sent from digital pin 10 through the optoisolator, a tiny LED lights up. This triggers a phototransistor, completing the circuit in the flash trigger. This method allows the two circuits to be completely isolated from one another but still trigger within a tiny fraction of a second [12].
The first optoisolator I used wasn’t powerful enough to handle the volt-age demands of the flash unit. This was determined by discharging different capacitors with the optoisolator. As long as the current wasn’t extremely high (in which case the current limitations of the optoisola-tor would be exceeded), the unit would fail to discharge at voltages higher than 150 V. This is lower than both the written specifications (200 V) and the voltage of the flash (190 V). As a result I have had to replace the optoisolator with a more powerful unit that uses a triac in place of a transistor.
The original flash unit I used was salvaged from a disposable camera. The circuit consisted of an energy source (AA battery), a switch to trig-ger the charging of a capacitor, and a switch to complete the circuit, which discharges the capacitor and powers the flash. Menlo’s photog-raphy teacher, Pete Zivkov, generously agreed to lend an external flash unit for use in the project. This made possible a shorter flash duration for clearer pictures.
66 Isaac Lambing
4 Schematic
The final product not only adds the ability to switch between all three sensors on the fly, but includes an LCD display so that the user can view which sensor is currently selected and the variable delay time or distance (depending on the sensor). Two potentiometers are used, one for selecting the delay/distance (val1) and one for selecting the sensor to be used (val2). Depending upon the value of the second potentiom-eter (used to select sensor), the program skips to one of three sections, each of which houses the code not only for that sensor but for the vari-able delay and the LCD display.
Figure 8: Flowchart of final set-up.
#include <LiquidCrystal.h> // include the library code:const int laserSensor = 5;const int laser = 9;const int flash = 8;const int soundSensor = 2;const int infraredFirst = 10;const int infraredSecond = 11;int sensorVal = 0;int soundVal = 0;int firstVal = 0;
THE MENLO ROUNDTABLE 67
int secondVal = 0;const int sensorPot = 4;const int delayPot = 3;int val;int val2;long startTime;long elapsedTime;LiquidCrystal lcd(7, 6, 5, 4, 3, 2); // initialize the library with the numbers of the interface pins
void setup() { pinMode(flash, OUTPUT); pinMode(laser, OUTPUT); lcd.begin(16, 2); // set cursor for lcd }
Figure 9: Picture taken in the first testing of the laser tripwire.
70 Isaac Lambing
THE MENLO ROUNDTABLE 71
In the first testing of the laser tripwire, as seen in Figure 9, the laser was set slightly above the plane of the table (the beam itself was ap-proximately 8 mm above the table) and the pen was dropped from a height of about 2 ft above the surface of the table. The camera was po-sitioned slightly below the plane of the table. The flash triggered while the pen was still millimeters above the surface, producing a relatively clear image given the amount of ambient light that was impossible to eliminate from the room.
Figure 10: Another picture taken in the first testing of the tripwire.
In the picture in Figure 10, the falling object is a roll of electrical tape.
Figure 11: Picture taken with laser tripwire.
Figure 11 depicts a Christmas ornament immediately after its initial impact with the ground. (The object was thrown at the ground from a height of approximately 4 ft). The laser used for the flash trigger can be seen because it came on again before the shutter closed.
Figure 12: Picture taken with laser tripwire; delay time adjusted.
The photo in Figure 12 was taken with the same method as the shot in Figure 11, but the delay time was adjusted so the flash would occur later in the breaking process.
72 Isaac Lambing
Figure 13: First slap picture.
In the photo in Figure 13, the sound sensor was used, although it was not sensitive enough to capture the sound immediately, and as a result the shot occurs too late. There is some ghosting as well: to the right of the face you can faintly see the subject before he was slapped. The room was not completely dark and so the film was lightly exposed be-fore the triggering of the sound sensor.
Figure 14: Another slap picture.
In the photo in Figure 14, results are still not as hoped for. Image clar-ity would have benefited from the use of multiple flash units. Even so, a slight ripple can be seen in the subject’s lips. Given the limited patience of the participants, this proved to be the best shot attainable.
THE MENLO ROUNDTABLE 73
Figure 15: Picture taken with sound sensor.
The photo in Figure 15 was triggered via sound: a metal weight (invis-ible behind the frontmost fragment) was dropped from above. There is slight ghosting in this image as well; the faint image of the ornament sitting on the ground is visible in the background.
74 Isaac Lambing
6 Appendix A
Part Description: Use: Cost: Place of Purchase:Arduino Control the interaction be-
tween triggers and flash & allow for delay
$30 Already purchased from Sparkfun
Flash unit from disposable camera
Expose camera film $10 Already purchased from Walgreens
Camera Flash Upgrade from disposable flash unit
n/a Borrowed from Pete Zivkov
5 V laser pointer Tripwire sensor $5 Dealextreme.comPhototransistor Sense laser for tripwire sensor n/a ASR part cabinetMicrophone Initial sound sensor n/a Already ownedGuitar amp Amplify signal from
microphonen/a Already owned
Small microphone For use in final sound sensor $2 SparkfunAmplification Circuit
For use in final sound sensor $5-$10 Sparkfun
Optoisolator Trigger flash unit $1 each Already purchased from Digikey
Various resistors Circuitry n/a ASR part cabinetDiode Prevent negative voltage from
Mr. Pete Zivkov, for lending a Vivitar strobe for use in the project and allowing it to be modified in ways seen fit.
Dr. James Dann, for teaching the Applied Science Research class and allowing his students to pursue individual projects such as this during second semester, as well as helping with troubleshooting the countless problems that arose throughout the course of this project.
Jordan Jadallah and Charles Lewis, for allowing me to slap them in the face repeatedly in an attempt to capture the distortion in their faces mid-slap. You guys are troupers.
76 Isaac Lambing
J&P Industries: Flood Environment Housing and Next Generation Family Cars
Priyanka Nigam & Jack Sieber
1 Abstract
In our engineering class we were given the task of designing and en-gineering a house that could withstand a flood and accommodate a family of five people, one of them handicapped, and a pet. We also enhanced a 4-wheel drive chassis to create a car this family could use. This paper details the research and design of the products.
2 Corporation Overview
J&P Industries is a company that prides itself on the safety and func-tionality of its products. While other companies may immediately get a nail and hammer once an idea pops into their head, we take the time and effort to plan our projects, adding the quality and safety that are essential to our philosophy.
3 The Amphibian: Housing for Flood Areas
3.1 Product Overview
People live in flood areas all over the world, from the Netherlands to New Orleans. For centuries they have been dealing with the conse-quences of living in these areas: belongings lost and homes destroyed. This destruction has both an emotional and financial impact on these people, who need to completely rebuild their houses and replace fur-niture and other necessities. Today, there is a great need for a solution to this problem so that people do not need to restart their lives after every flood.
This paper was written for Joanie Banks-Hunt’s Engineering Iclass in the spring of 2010.
To solve this problem, J&P Industries has designed a new style of hous-ing that will be able to withstand devastating floods. The Amphibian is a state-of-the art modern housing style designed to ensure that both people and their possessions will be safe in the case of a flood. These houses are adaptable based on the flood levels of the area in which they are placed and the size and demographics of the families they serve. Our basic model easily accommodates five people and a pet; it is even equipped with an elevator to ensure handicapped accessibility. Our versatile, flood-proof houses will guarantee that people will never again have to start over from scratch when a flood hits their town.
3.2 Research
To ensure that these houses were truly suited for flood areas, we did research on the types of floods that the house must be able to with-stand and on ideas that already exist or are being developed to solve this problem.
We began by looking at the flood levels that devastate many areas in the American Midwest. Floods are categorized as a yearly flood (how-ever, this is not considered a flood by many because water does not uniformly cover the landscape), a 10-year flood, and a 100-year flood. A 10-year flood comes on an average of 10 years, and does not usually rise above 6 or 7 feet. However, a 100-year flood can rise as high as 11 feet or more. People around the world have experimented with various solutions to this problem.
We researched different places around the world where flooding is regular. The houses were able to adapt in various ways, from becom-ing a boat to having a waterproof veneer around the exterior. Holland is an example of a place where people have been engineering con-stantly to push back the water. The marshy soil on the coastline was extremely fertile for farming, but the potential farmland was subject to tidal flooding. A permanent dam would not suffice, as the spongi-ness of the soil, so useful for farming, actually leaked water under-neath the dams. Hundreds of years ago, Dutch farmers used the most
78 Priyanka Nigam & Jack Sieber
abundant renewable energy source around to pump harmful saltwater out of their farmland: the wind. Windmills use the power of the wind to constantly pump the leaking seawater back into the ocean. In Hol-land, where more than half of the land is below sea level, dams and windmills together create the most feasible solution. Though formerly able to combat tidal flooding, the dams and windmills are becoming insufficient to handle the rising waters caused by global warming. Re-cently, architects have teamed up with environmental engineers to cre-ate a new type of house, a house that could potentially rise with the water. However, this solution poses another plethora of problems. For instance, the plumbing, electricity, gas, and sewage would have to all be safely disconnected or extended as the house rose. On the other hand, some houses in New Orleans use a different method to over-come hurricane-induced flooding. FEMA recommends either raising the house or building a veneer around the exterior. We decided that the most economically feasible way to create a house that would be nearly impervious to flooding would be to build one that was raised one floor, high enough to evade a 100-year flood.
3.3 Selection and Preparation
After our research, we were able to develop a model that we believed would work the best for flood-area housing. Instead of designing a house that floats with the water level, or is surrounded by a steel wall, or sealed to be waterproof, we decided to design a house that was permanently elevated. The main reason for this choice was that an elevated house was the most effective way to limit the repairs needed after a flood while still being cost-effective. Both the steel wall and the waterproof house require scarce and costly materials. Also, they are not very practical. The base of the steel wall would need to be placed very deep into the ground to prevent it from sliding around when the ground gets wet. Because dirt turns into mud when mixed with water, it is possible that the ground the wall is buried in will become too soft to hold up the wall against the pressure of floodwater. The waterproof house is not practical either, because it would be very hard to ensure that all parts of the house were coated and the doors and windows
THE MENLO ROUNDTABLE 79
completely sealed when closed. While the floating house did not have these problems, it did have another, that of utilities running through pipeline and cables. When the house rose, the plumbing and electrical wires would not rise with it, and as a result would either break due to the force of the rising or would have to be severed to allow the house to rise in the first place. This would then later require a full rewiring of the house’s electrical system and a full reworking of the plumbing and sewage system, an arduous and expensive task. Clearly, these designs are deficient in several ways. On the other hand, an elevated house is cost-effective and practical and does not have this utilities problem.
3.4 Conceptualization
While there are other designs of elevated houses, our houses have sev-eral unique aspects that make them stand out from the rest. Instead of simply wasting the space under the house, we made part of the space into a garage, since cars would be exposed to the flood in any case, and some of the other space we made into storage space for items that could withstand exposure to water. We also left space under the house that could be used as a covered outdoor area. There is a pet area on the third floor to provide access to facilities like play areas. The house also accommodates handicapped people by offering an elevator and a suite on the first floor. We also have a dock that is necessary because it allows food, water, and other supplies to be transported into the house by boat. It also ensures that the family will not be trapped inside the house during the flood. These aspects of our house’s design make it a distinctive choice for housing in flood areas.
80 Priyanka Nigam & Jack Sieber
3.5 Synthesis and Product Details
3.5.1 Materials The main materials used in the design of the model of the house are wood and hot glue. We made all of the walls and floors as well as the elevator and the elevator shaft out of sheets of balsa and birch wood. We made the stairs and the dock out of Popsicle sticks. To attach the various pieces of our house together, we used hot glue. To raise the house, we used wooden pillars, and we also used wooden pillars as rafters to provide support for each level of the house. The walls are reinforced by wooden pole cross-sections. The whole house is built on a foam board foundation.
3.5.2 Improvements
In the process of designing the house, we made a few alterations and improvements from our original plans. One improvement was an above-ground greenhouse, although the owner can choose to make it part of the interior of the house or a sunroom. This garden allows one to grow fresh fruits and vegetables even in areas where houses are placed so close together that there is little room for gardening. It also provides people with a potential source for fresh food in a flood, be-cause the greenhouse walls shelter the plants from the elements. We also changed the design of our dock. Originally, we were going to have a set dock from which one could raise and lower a raft. But this design had the potential for failure since it would be hard to raise and lower a raft with people in it by hand if the electricity were to fail, as often occurs in a flood. So, we changed the design, and our house now has a dock that adjusts to the water level. One end is secured to the house, while the other end, where the raft is located, is free to float as water rises. This eliminates the need of lowering and raising the raft by hand and makes the raft handicap-accessible. These improvements help to make our design more accommodating to all people and provide for a better quality of life during a flood.
THE MENLO ROUNDTABLE 81
82 Priyanka Nigam & Jack Sieber
3.5.3 Figures and Photos of Product Details
Photo 1: Whole house.
At this stage the house is still incomplete, since the top floor still needs walls and the garden has not yet been added. But the overall appear-ance of the house is clear. The stairs and the elevator shaft can be seen on the bottom right. The garage is in the middle of the bottom. The second floor windows are designed to maximize natural lighting inside the house.
Photo 2: Second-floor balcony and windows.
Photo 2 is a view of the second-floor balcony and the windows of the dining room (left) and the living room (right). People have been placed on the patio to provide a sense of the scaling of the house. As one can see, the house has fairly high ceilings and the balcony is quite large. There is more than enough room for the family to eat dinner outside or to simply enjoy a nice evening together. The safety railing was added to stop people from accidentally slipping off.
THE MENLO ROUNDTABLE 83
Photos 3 & 4: Garage door and crank system.
Photos 3 and 4 above show the garage and the crank system used to operate the garage door. The photo on the left is of the closed garage, while the photo on the right is of the opened garage. The white stars indicate the location of the white tubing containing the cable that con-nects the door and the crank. The crank system is visible beneath the grey rhombuses. On the left the crank is in the “rest” position since the garage door is closed. On the right, the crank is in the upright position and is kept from unwinding by a lever (labeled in both pictures) that moves up and down.
Figure 1: Garage pulley system.
Figure 1 shows the various components of the garage pulley system and how the system works. As the crank is turned, the string gets pulled and shortened and the garage door rises.
84 Priyanka Nigam & Jack Sieber
Figure 2: Elevator Pulley System.
Figure 2 diagram highlights the elevator crank system. As one turns the crank, the string shortens and the elevator rises.
3.5.4 Google Sketch Up Drawing of House (Several Perspectives)
THE MENLO ROUNDTABLE 85
3.6 Evaluation
When we came to build the model of our house, we had to take certain measures into account. The first was the size of the house. We origi-nally had quite a large design with many more rooms than our cur-rent design has, but we had to take into account the limited size of the base of the house, which was dictated by the size of the available foam board foundation. As a result of this limitation, we had to consolidate our design and make sure every bit of space was used as efficiently as possible. Limiting the size also reduced the cost of the house since fewer materials were needed and all of the materials were being used as efficiently as possible. We also had to take into account the size of the people to make sure the scaling was right for the height of each floor, for the distance between each step on the stairs, and for room sizing.
When we were building the model, we also realized that we would have to change details other than size to meet our design goals. For example, we had to change our elevator pulley design, because our original de-sign of having a horizontal series of pulleys laid flat across the top of the elevator was not feasible. Instead, we changed it to a vertical pulley system that attached to the top of the elevator shaft at one end and to the top of the elevator car at the other. We also changed our original pulley system used to open the garage. We decided that the best way to design a mechanism to lift the garage door was to attach one side of the cable to the middle of the door and then pass the cable through a series of pipes to lead the cable to the crank. This way the cable would stay in place and the door would open easily. Overall, our finished product did fulfill all of our design goals: a house that can withstand a flood, is handicap-accessible, and is comfortable while being commercially feasible and cost-effective.
3.7 Optimization
At J&P Industries, we are always focused on the future, developing new products and improving previous ones. Thus, while this generation of amphibian housing will keep people and their belongings safe from
86 Priyanka Nigam & Jack Sieber
floods, we also have several plans for new features and enhancements that we plan to add in the next generation of houses to further improve the utility and practicality of these houses.
One of these new features is the addition of solar panels to the house as an alternative means of supplying energy. The addition of these solar panels would not only make the house more eco-friendly but would also provide a back-up source of energy during a flood if the power lines were down or if electricity were simply shut off. Because UV ra-diation, which is what solar panels use, is able to pass through clouds and thus reaches Earth even in cloudy conditions, these solar panels would ensure a supply of electricity to cook food and gain access to information during a flood.
Another new feature we plan to add to our current design is a better drainage system. While the house does have a slanted roof and slightly slanted deck to allow rainwater to runoff, it does not have a complete drainage system. So we plan to add gutters along the edge of the sec-ond-floor deck and the roof and then down the side of the house to provide a pathway for draining water to the ground. We also plan to add a drainage system to the above-ground garden. The base of the garden bed will be a three to four-inch deep slanted box made of metal. The end at the edge of the roof will be open, so water will catch in this metal box and then travel off the roof. The above-ground garden will be lined with sand to allow for the most water retention, so that the water does not simply travel through the dirt and out the metal base.A third new feature that we plan to include in our next design is an elevated garage. Currently the garage is on the ground floor, meaning that in a flood any cars inside the garage will be damaged. To guarantee that even cars are safe in a flood, we plan to make the garage an ex-tended part of the second floor. There will be a ramp from the ground to the entrance of the garage to get the cars up to the raised garage. These improvements and enhancements will polish our current design to make the house even more convenient and accommodating.
THE MENLO ROUNDTABLE 87
88 Priyanka Nigam & Jack Sieber
4 The Legacy: The Next Generation of Family Cars
Figure 3: The Legacy.
4.1 Product OverviewAutomobiles have the highest rate of accidents among all modes of transportation. This is because the driver of a car is in full control, whereas planes, trains, and boats have auxiliary systems that can step in and help prevent accidents. Most new airplanes include a fly-by-wire system, where the pilot’s control of the yoke is not directly related to the maneuvering of the plane.
We decided to combat the fundamental cause of most car accidents, human error. If a driver failed to notice that he or she was in imminent danger, an auxiliary system could use motion sensors as part of safety systems to stop the car before a collision occurred, helping to prevent serious injuries to the driver and passengers. We have also made the car more family-friendly by adding two more doors to the traditional four-door car. Easy access to the back seats allows every member of the family to get in and out quickly.
4.2 Research
4.2.1 Suspension Systems
The suspension system is a necessary aspect of any car. Increasing the friction between the car’s tires and the road allows the driver to steer the car. It also makes the ride of the car more comfortable. The reason it is so important is that roads are bumpy, and when a car travels over these bumps, the wheels are pushed upwards. Without the suspension system, this vertical acceleration would cause the wheels to lift off the road and then come crashing down.
There are four main types of suspension: the coil spring, the air spring, the leaf spring, and the torsion bar. The coil spring is most common and works by compressing and expanding as the wheels move. The leaf spring is an older form of suspension used mainly on trucks. The torsion bar is a bar that attaches to the wheel and the car’s frame (it works by twisting as the wheels move). The air spring works by a compression and expansion of a gas-filled chamber, providing resistance in either direction.
4.2.2 Accidents and Collisions
Over 6,000,000 accidents occur every year in the United States, and over 40,000 people die every year in these accidents. Up to 75% of these accidents occur at low speeds on city streets, usually because the driver is distracted. Car accidents are the leading killer of children in the United States. About 700 children die every day in car accidents.
Various safety precautions have already been taken to reduce these numbers. All cars now come equipped with seat belts, and special car seats have been developed to keep young children safe. But these steps are not enough. Some car manufacturers, like Volvo, are developing sensors that slow down or even stop the car when triggered to prevent an accident. According to Volvo, this new system could reduce whip-lash injuries by 50% and could drastically reduce damages to cars in low-speed accidents.
THE MENLO ROUNDTABLE 89
90 Priyanka Nigam & Jack Sieber
4.3 Conceptualization
We decided to focus on safety in the development of our car. There are several family- and safety-oriented cars on the market, but ours has some unique design features. First, it is a six-door car. This makes all the seats easily accessible, so any family member should be able to sit in any seat. The headlights are green when the car is going forward and red when going backwards. This notifies other cars on the road of the direction the car is going. Our design also includes proximity sensors that activate when the car gets too close to any object in front of it. When they activate, they bring the car to a stop to prevent a col-lision. The design also includes three roll bars on the top of the car as well as metal bars along the doors. The roll bars ensure that passengers will not be crushed or otherwise injured if the car rolls over. The metal bars in the side of the car provide protection to passengers sitting on the side in case the car is hit from the side. These bars will protect side passengers from a potentially fatal or crippling accident. These main design features make the car safe and family-friendly.
Figure 4: Whole Car.
Figure 4 shows the three doors on each side and the direction they open in.
4.4 Synthesis and Product Details
4.4.1 Materials
We used several different types of materials in our car design. The car has a wooden chassis and a wooden frame and body. It also has a metal axle and metal spring suspension. The car also has a small but power-ful motor, headlights that change color depending on whether motion is forward or in reverse, and turn lights. Four 3 V batteries are used to power the motor and both sets of lights. Conjoined parts are attached using hot glue, with the exception of the electronic parts that are sol-dered together.
4.4.2 Improvements
While developing our car, we came across various problems. The first problem we came across was the length of our car. The basic car size was not long enough to accommodate the six-door car we were de-signing. So the first improvement we made was to extend the axle of the car. This was an important enhancement because it expanded the size of the car so that three doors were able to easily fit on each side and there was more legroom.
Another improvement to our original design was that we altered the suspension to a spring suspension from a beam suspension that worked by connecting one front wheel with the back wheel on the same side with a flexible piece of metal wire. Instead, the suspension is now at-tached separately to each wheel, which allows the car to drive over large bumps since the front and back wheels can rise and fall independently of the others. The spring suspension is also able to absorb more energy, which results in a smoother and more comfortable ride. The last im-provement we made was to add turn signals to the car. Turn signals are important because they are essential to optimizing the safety of the car. They serve to inform everyone else on the road of the driver’s aims and allow them to prepare for this.
THE MENLO ROUNDTABLE 91
92 Priyanka Nigam & Jack Sieber
4.4.3 Figures and Photos of Product Details
Photo 5: Whole car view.
Photo 5, a view of the whole car, is an incomplete image, but it shows the headlights and the six windows that will become part of the six doors.
Photo 6: Spring suspension system.
Photo 6 shows the car’s spring suspension system. The white arrows point to the springs that make up the system. This feature allows the wheels to rise and fall so the car can get over a bump. It also helps ab-sorb shock to reduce the bumpiness and choppiness of the ride.
THE MENLO ROUNDTABLE 93
Figure 5: Motor, headlights, and taillights circuitry.
Figure 5 is a circuit diagram of the bidirectional motor of the car and the bidirectional LEDs used as headlights and taillights. The motor and the lights are connected in parallel, and there is a DPDT throw switch to control the direction of the current and thus switch the direction of the motor and the color of the lights.
Figure 6: Turn signal circuitry.
Figure 6 is a circuit diagram of the turn signals on the car. There are four turn signals, but they are connected in two sets of parallel circuits made of two turn signals each. So when the SPST switch is pushed to the right, the two right turn signals turn on. But when the SPDT switch is turned to the left, the left side turn signals turn on.
4.5 Evaluation
Our original design goal was to create a hovercraft that had motion sensors to help steer the hovercraft, since they tend to be hard to con-trol. But after getting feedback on this idea and brainstorming about it, we decided to change our design goals completely. This is because we decided that it is not a commercially viable product; a hovercraft simply takes too much energy to run, and thus is not cost-effective or realistic. Our new design goals were to design a car that was safe and family-friendly.
We did fulfill some of our new design goals, but because we did not receive all of the materials we needed, we were unable to fulfill all of them. We did succeed in making the car family-friendly and eco-friendly by creating a lightweight car with six doors. We increased the safety of this car by adding forward and reverse headlights as well as turn signals. But we were not able to set up the proximity sensor sys-tem, which was supposed to prevent accidents by stopping the car if it got too close to another car, because we did not receive proximity sen-sors in time. Consequently, our corporation decided to add this feature into the next generation of J&P Industries’ safety and family cars.
4.6 Optimization
Since we are always looking to improve our products, we already have a few enhancements we plan to add to the next generation of the “Leg-acy” car model. The first new feature we plan to add is a brake system with brake lights. Currently, our car can only start and stop, so we plan to add a brake system that allows the car to slow down as well, an im-portant feature for safety and comfort since the sudden stop can both jerk the passengers and surprise other drivers on the road. Another performance enhancement we plan to add to the next generation of safety vehicles is a more elaborate and detailed sensor system. This system will measure the car’s speed and the distance between the car and any object in front of it. Using this information, it will calculate whether the car is traveling at a safe distance behind the car or not. If the distance is not safe, they will lightly trigger the brakes to slow the
94 Priyanka Nigam & Jack Sieber
car down until it is at a safe distance again, instead of just stopping the car as it does currently. The last feature we plan to add is a rearview camera. Because the car is long and larger than average, it may be hard to see what is going on behind the car. The rearview camera will help drivers see what is behind the car to make sure they don’t back over any objects or hit any unseen people. These important new features will serve to increase the safety of the car. 5 Bibliography
5.1 Sources for the House Section
“Barriers to the Sea.” 21 May 2003. Modern Marvels. 12 December 2009. < http://www.veoh.com/collection/jay21157-extremeengineering/watch/v6487411WmsexArD>.
“Flood Recovery Guidance: New Orleans Parish.” 12 April 2009. US Department of Security: FEMA. 13 December 2009.< http://www.fema.gov/hazard/flood/recoverydata/katrina/katrina_la_resources.shtm#1>.
Carlsen, Spike. “How to Build Stronger Retaining Walls.” May 2001. Reader’s Digest. 12 December 2009. < http://www.rd.com/how-to-build-stronger-retaining-walls/article18062.html>.
“Keeping Your Family Safe: Important Information about Propane Safety and Floods.” Propane Exceptional Energy. 6 December 2009. <http://www.propanefl.com/index.htm>.
5.2 Sources for the Car Section
Bell, Kirk. “Top 10 Family-Friendly Car Features.” MSN Autos. 12 December 2009. < http://editorial.autos.msn.com/article.aspx?cp-documentid=924372&page=0>.
THE MENLO ROUNDTABLE 95
“Car Accident Statistics.” 2005. Car-Accidents.com. 12 December 2009. < http://www.car-accidents.com/pages/stats.html>.
Erickson, Norma. “How to Avoid America’s Number One Child Killer.” eHow. 12 December 2009. < http://www.ehow.com/how_5413835_avoid-number-one-child-killer.html>.
Harris, William. “How Car Suspensions Work.” 1 May 2005. HowStuffWorks.com. 12 December 2009. <http://auto.howstuffworks.com/car-suspension.htm>.
96 Priyanka Nigam & Jack Sieber
The Menlo RoundtableDr. Charles Hanson, Editor
For the online version of The Roundtable, go to http://roundtable.menloschool.org.
Menlo School • 50 Valparaiso Avenue • Atherton, CA 94027 • 650.330.2000
THE M
ENLO
ROU
ND
TABLE •
ISSUE 6 •
SPRING
2010
THE MENLO
ROUNDTABLEA Journal of Student Research and Writing from Menlo School
Daniel Crankshaw ’09Tess Brown ’10 Molly Crowe ’11
Ryan Denenberg ’10 Isaac Lambing ’10 Justin Lannin ’11
Ethan Leibovich ’11
Sam Parker ’11
Nick Maruyama ’10
Bobby Pender ’11
Abby McCall ’12
Shelby Rachleff ’10
Megan Hodge ’12
James Carpenter ’10
Priyanka Nigam ’11
Jack Sieber ’11
ISSUE 6 • SPRING 2O10
High-speed image of ornament breakingPhoto by Isaac Lambing ’10