32
The Methods Section
| Date post: | 29-Dec-2015 |
| Category: |
Documents |
| Upload: | griffin-hodges |
| View: | 214 times |
| Download: | 0 times |

The Methods Section

Purposes
–To describe how you collected, organized and analyzed the data
–Ensure that enough detail is provided to verify the findings.
–Enable replication of the study by an appropriately trained person.

Goals of the Methods
• Allows:
-replication of findings
- interpretation of results
-assessment of the quality of the study
and the validity of the conclusions:--Appropriateness of study design
--Quality assurance
--Bias control
Tasks for the Methods
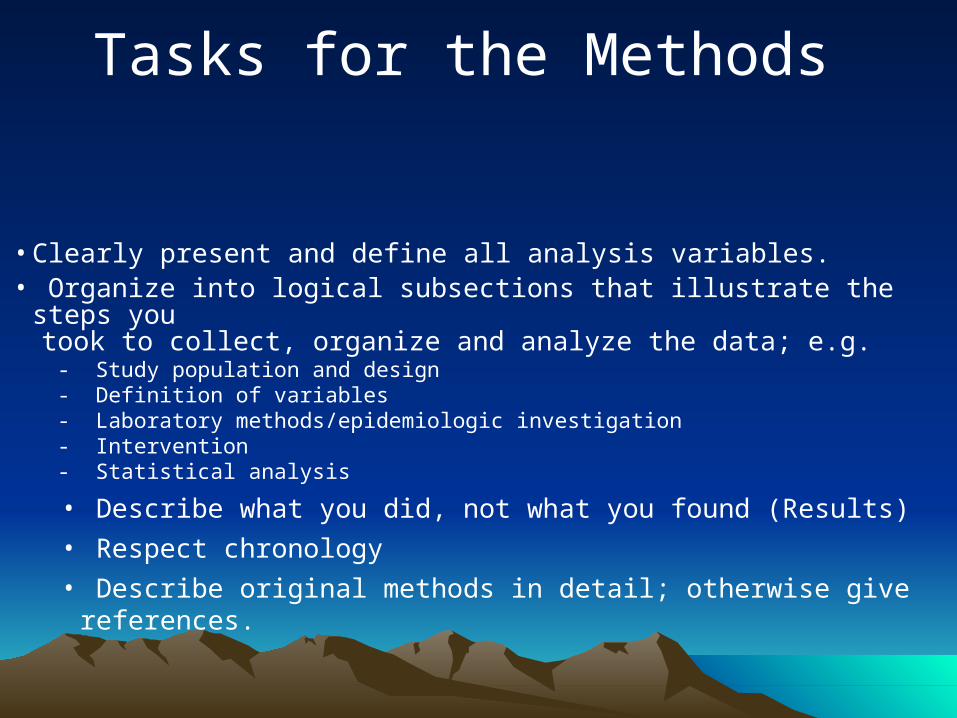
• Clearly present and define all analysis variables.• Organize into logical subsections that illustrate the steps you took to collect, organize and analyze the data; e.g.
- Study population and design- Definition of variables- Laboratory methods/epidemiologic investigation- Intervention- Statistical analysis
• Describe what you did, not what you found (Results)
• Respect chronology
• Describe original methods in detail; otherwise give references.
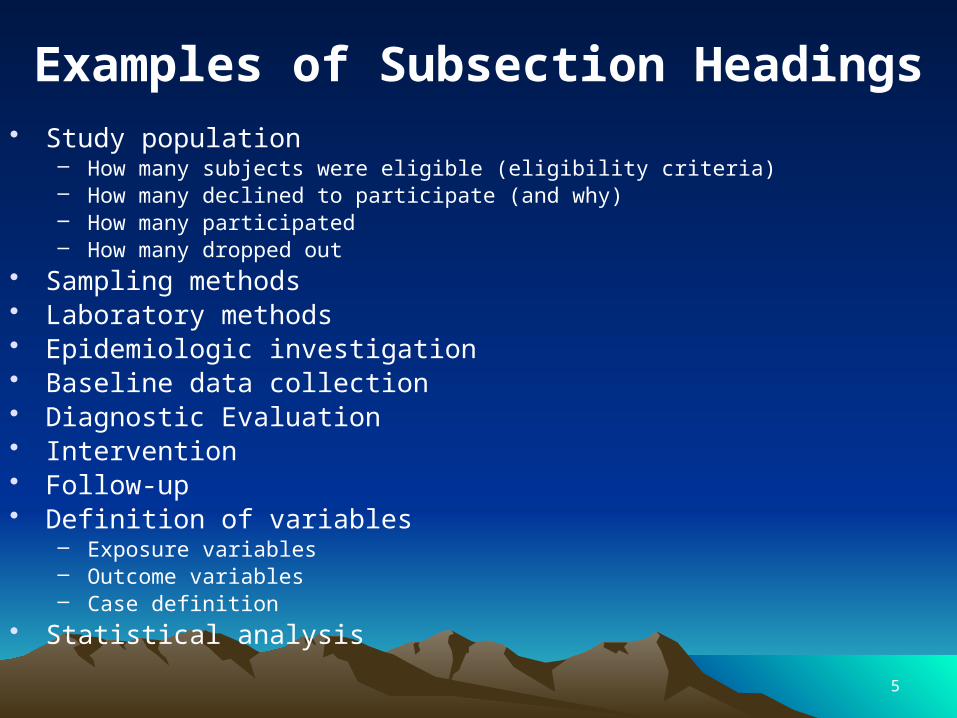
Examples of Subsection Headings• Study population
– How many subjects were eligible (eligibility criteria)– How many declined to participate (and why)– How many participated– How many dropped out
• Sampling methods• Laboratory methods• Epidemiologic investigation• Baseline data collection• Diagnostic Evaluation• Intervention• Follow-up• Definition of variables
– Exposure variables– Outcome variables– Case definition
• Statistical analysis
5

Overview of What Should be Included
• Study setting and design
• Study sample and methods of data collection
• Outcome and independent measures
• Materials and equipment (if used)
• Statistical methods

The Methods:Study Setting and Design
Provide details about the data or data base :
– Source of data, dates of the study, number of sites and their location
– Description of data base
• Example: Data were obtained through special
analyses of birth certificate data from Canada,
England and Wales, and the US from 1981 to 1997.
In France, data were obtained both from birth
registration and national surveys.
The Methods:Study Setting and Design
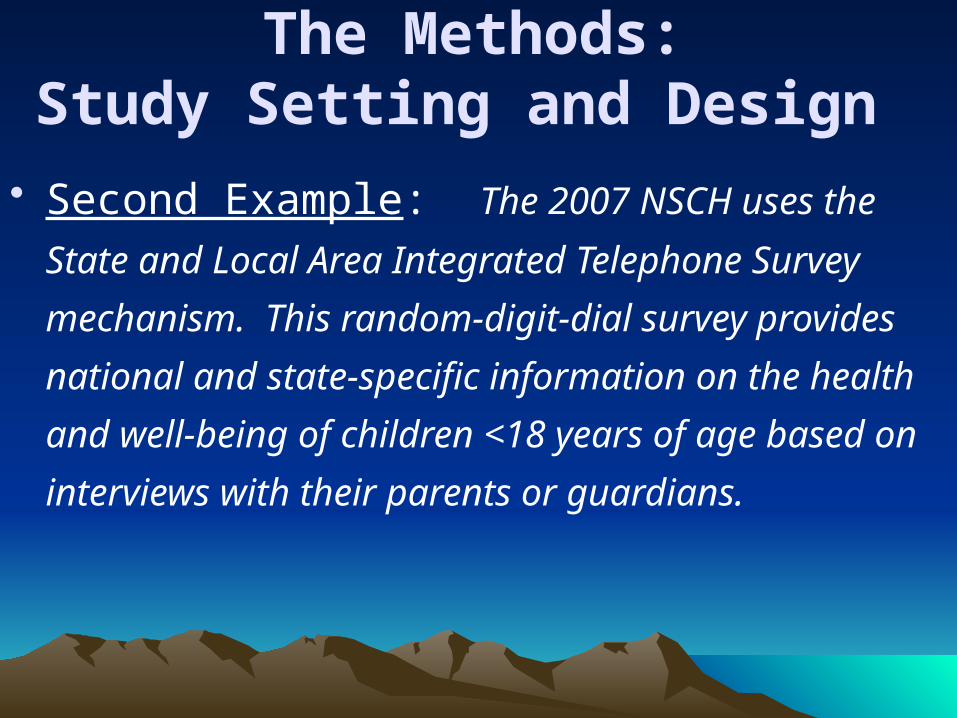
• Second Example: The 2007 NSCH uses the State
and Local Area Integrated Telephone Survey
mechanism. This random-digit-dial survey provides
national and state-specific information on the health
and well-being of children <18 years of age based on
interviews with their parents or guardians.
The Methods: Data Collection and Study Sample
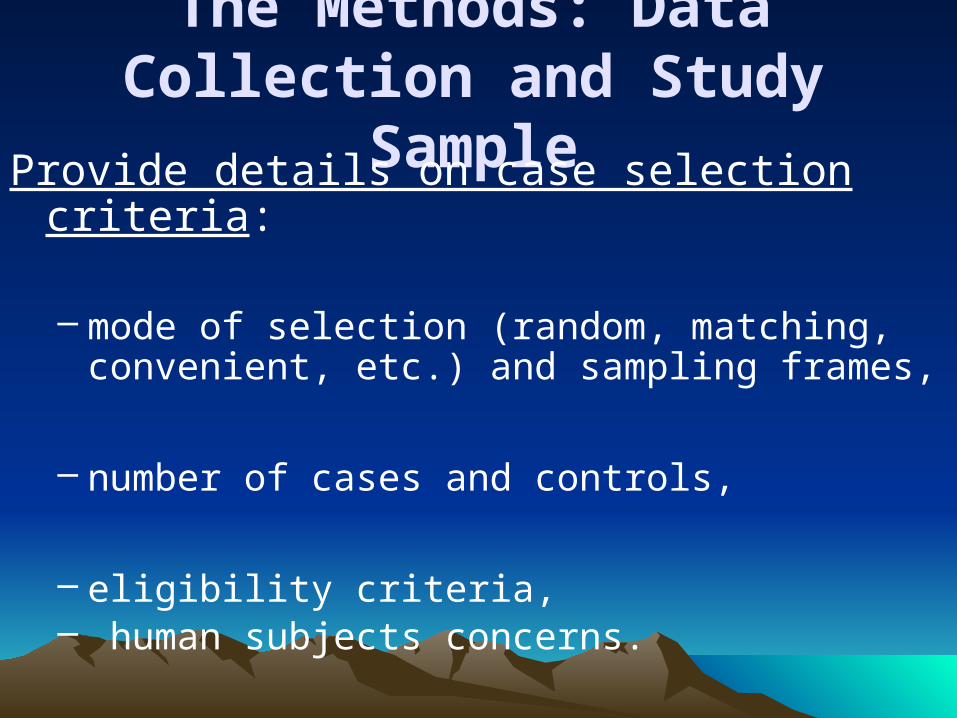
Provide details on case selection criteria:
– mode of selection (random, matching, convenient, etc.) and sampling frames,
– number of cases and controls,
– eligibility criteria,– human subjects concerns.
• Example: The analysis was restricted to live births.
In Canada, we excluded data from Newfoundland and
Ontario because of documented problems in the
quality of the data.
The Methods: Data Collection
and Study Sample (cont)
Provide further details on the study sample:
–drop-out rate,
–missing cases and data,
– representativeness of sample.

The Methods: Outcome Measures
Outcome measures– Definitions of primary outcome and its
measurement– Definitions of secondary outcomes and their
measurement– Operation definitions and instrumentation (validity
and reliability) of major variables, scales and tests.
Means for data collection methods (e.g., lab tests, questionnaires, measurement scales,
time points for data collection)

The Methods: Outcome Measures
Example: Insurance adequacy was based on parents’ judgments of whether their children’s insurance covers needed services and providers, and reasonably covers costs. Specifically, adequacy was derived from parents’ responses to three questions: 1) ”Does the child’s health insurance offer benefits or cover services that meet his/her needs?” 2) “Does the child’s health insurance allow him/her to see the health care providers he/she needs?” 3) “Not including health insurance premiums or costs that are covered by insurance, do you pay any money for the child’s health care?” and, if yes, “How often are these costs reasonable?”
• A summary measure of adequacy was created by combining these variables. If a parent answered “always” or “usually” to all three dimensions of adequacy, then the child was considered to have adequate insurance coverage. (No out-of-pocket costs were considered to be “always” reasonable.) If a parent answered “sometimes” or “never” to any of the three dimensions, the child was considered to be underinsured. Insurance adequacy was examined only for continuously insured children, defined as those children whose parents reported that they currently had “any kind of health care coverage, including health insurance, prepaid plans such as HMOs, or government plans such as Medicaid” and that, during the past 12 months, there was not “any time when he/she was not covered by any health insurance.” Parents of children without current health care coverage were also asked whether, during the past 12 months, there was “any time when he/she had health care coverage.”
• These adequacy and health care coverage variables were combined to create a four-level variable: children who were never insured during the past year; children who had periods without insurance in the last year; children who had continuous but inadequate coverage (the underinsured); and children who had continuous and adequate coverage.

The Methods: Defining Independent Variables
Example of Good versus Not So Good:
Poverty status, measured by the poverty-to-income ratio (PIR), was derived from the established federal poverty level (FPL), which is revised annually to reflect changes in the cost of living as measured by the Consumer Price Index.
Poverty status was defined by using the poverty income ratio (PIR), an index calculated by dividing family income by a poverty threshold specific to family size. The PIR is reported in three levels: below the poverty level, one to less than two times the poverty level, and two or more times the poverty level.
http://www.cdc.gov/nchs/data/nhsr/nhsr015.pdf
The Methods:
Statistical Methods Provide details on the study analysis:
• Statistical tests and procedures used for each phase of the analysis.
– Example: We first analyzed the temporal trends in rates of twins and triplets in each country. Relative risks and population attributable risks for preterm and LBW, together with their confidence intervals, were then calculated for twins and triplets with singletons as the reference group.
Second example: The data presentation is composed of five parts. Part one shows the distribution of uninsured, underinsured, and fully insured US children by demographic and health characteristics. Part two uses four logistic regression models to examine factors associated with the overall underinsurance measure, and each of its three components among continuously insured children. In these models underinsured children with continuous coverage were compared to children with continuous and adequate coverage. Maternal education and poverty were not included due to high correlation with insurance type.
• Part three examines the association between the measures of access and quality and the four-level insurance variable. Part four uses adjusted logistic regression models to examine the association between level of health insurance and the five access and quality measures plus the five components of medical home. Part 5 examines the three components of underinsurance in relation to measures of access and quality among continuously insured children.
The Methods: Statistical Methods (cont)
• Sample size and power
– Consult statistician early on
– Justification in terms of power or precision for the primary endpoint
– Method used to calculate the sample size

The Methods: Statistical Methods (cont’d)
• Data processing methods for quality assurance• Data analysis software used and for what
purpose

The Methods: Extra Tips
At no extra charge to you.

Value of flow diagrams in reports of randomized controlled trials
JAMA 2001;285: 1996–1999
22

23

Improving Clarity of Methods Section
• Present methods logically– Chronologically– Group related methods together
• Use subheadings• Cite references if necessary• Use tables if necessary
Common Problems in Writing Methods Sections
• Insufficient detail:– Novel procedures– Subject selection– Randomization methods– Allocation concealment– Blinding– Statistical methods

Methods Exercise (if time)
26

Does all of this information belong in the Methods section?
All NICU nurses in an upper Midwestern state were invited
to participate in this study (N=167); 59 nurses responded,
yielding a 35% response rate. The study sample consisted of
58 females; 46 (78%) were married and 12 (20%) were single.
The mean age was 34.74 years (SD=5.97). Thirty-four (58%)
nurses were baccalaureate prepared, compared to 18 (30%)
who were diploma nurses and 4 (7%) who held associate
degrees. The mean for years practiced in NICU was 9.2
(SD=5.39). This compares to a mean of 12.02 (SD=5.76) for
years practiced as a RN.
27
Methods
Excerpt from: Neonatal Intensive Care Nurse Stressors: An American Study
All NICU nurses in an upper Midwestern state were invited to
participate in this study (N=167); 59 nurses responded, yielding a
35% response rate.
28

All NICU nurses in an upper Midwestern state were invited to participate in this study (N=167).
Participants in this study were randomly chosen from health care units located in the upper Midwest of the United States.
Is the description of how study subjects were identified adequate?
29

All NICU nurses in an upper Midwestern state were invited to participate in this study (N=167).
Participants in this study were randomly chosen from health care units located in the upper Midwest of the United States.
30

All NICU nurses in an upper Midwestern state were invited to participate in this study (N=167).
Participants in this study were randomly chosen from health care units located in the upper Midwest of the United States.
31
Health Perceptions and Survival: Do Global Evaluations of Health Status Really Predict Mortality?
Methods (excerpt)
. . . . A total of 624 deaths occurred in the four years, 334 among
the 1,166 men (28.6%) and 290 among the 1,646 women
(17.6%). Because these mortality rates were quite different, all
analyses were performed separately by sex.
Because sex-specific death rates were unequal (male = 28.6%,
female = 17.6%), all analyses were performed separately by sex.
Idler EL, Kasl S. J Gerontol 991;46(2):S55-65
32


