We report a high-resolution paleomag-netic investigation constrained by new qualitative and semiquantitative analyses of planktic and benthic foraminifera, nan-nofossil assemblages, integrated with oxy-gen and carbon isotope measurements, for the middle Eocene Scaglia limestones of the Contessa Highway section, central Italy. Calcareous plankton assemblages enable recognition of several biostratigraphic events from planktic foraminiferal zone P11 to the lower part of zone P15 and from cal-careous nannofossil zone NP15 to the upper part of zone NP17, which results in refi ne-ment of the magnetobiostratigraphy of the Contessa Highway section. Correlation of the paleomagnetic polarity pattern with the geomagnetic polarity time scale provides a
direct age interpretation for strata around the middle Eocene Scaglia limestones of the Contessa Highway section, from chrons C21n (47 Ma) through to subchron C18n.1n (38.5 Ma). Bulk carbon isotope values indi-cate a distinct carbon isotopic shift at 40 Ma that is interpreted to represent the fi rst evi-dence in the Northern Hemisphere of the middle Eocene climatic optimum, which has recently been observed as a stable iso-tope anomaly in multiple records from the Indian-Atlantic sector of the Southern Ocean. This demonstrates a global response of the carbon cycle to the proposed transient increased pCO2 levels during the late middle Eocene and consequent global CO2-driven climate change.
Deep-sea stable isotope records indicate a general high-latitude cooling trend over the past 50 m.y. (from the early Eocene climatic optimum or EECO), which is thought to have resulted from a combination of factors that altered the amount and distribution of solar radi-ation over Earth’s surface (e.g., Shackleton and Kennett, 1975; Miller et al., 1991; Zachos et al., 2001; Lear et al., 2004). The ~4‰ increasing trend in δ18O is not monotonic. It is complex and is composed of a series of signifi cant short-term cooling and warming phases, ranging in tempo-ral extent from 103 to 105 yr (e.g., the Oi-1 event in the earliest Oligocene at 34 Ma and the Mi-1 event in the earliest Miocene at 23 Ma; Miller et al., 1991). These signals are superimposed on a long-term trend toward progressively cooler conditions since 50 Ma.
Recently, a distinct negative shift in δ18O values at 41.5 Ma (designated as the middle
The middle Eocene climatic optimum event in the Contessa Highway section, Umbrian Apennines, Italy
Luigi JovaneIstituto Nazionale di Geofi sica e Vulcanologia, Via di Vigna Murata 605, 00143 Rome, Italy, and Dipartimento di Fisica, Università di Bologna, Via Berti Pichat 8, 40127, Bologna, Italy
Fabio Florindo†
Istituto Nazionale di Geofi sica e Vulcanologia, Via di Vigna Murata 605, 00143 Rome, Italy
Rodolfo CoccioniIstituto di Geologia e Centro di Geobiologia, Università degli Studi di Urbino “Carlo Bo,” Campus Scientifi co, Località Crocicchia, 61029 Urbino, Italy
Jaume Dinarès-TurellIstituto Nazionale di Geofi sica e Vulcanologia, Via di Vigna Murata 605, 00143 Rome, Italy
Andrea MarsiliIstituto di Geologia e Centro di Geobiologia, Università degli Studi di Urbino “Carlo Bo,” Campus Scientifi co, Località Crocicchia, 61029 Urbino, Italy
Simonetta MonechiDipartimento di Scienze della Terra, Università degli Studi di Firenze, Via La Pira 4, 50121 Florence, Italy
Andrew P. RobertsNational Oceanography Centre, University of Southampton, European Way, Southampton SO14 3ZH, UK
Mario SprovieriIstituto Ambiente Marino Costiero, Consiglio Nazionale delle Ricerche (CNR), Calata Porta di Massa (Interno Porto di Napoli), 80133 Naples, Italy
GSA Bulletin; March/April 2007; v. 119; no. 3/4; p. 413–427; doi: 10.1130/B25917.1; 10 fi gures.
Jovane et al.
414 Geological Society of America Bulletin, March/April 2007
Eocene climatic optimum) has been observed in cores from the Indian and Atlantic sectors of the Southern Ocean, and it has been interpreted pri-marily as a temperature signal that affected both surface waters and middle bathyal deep waters (Bohaty and Zachos, 2003). This peak warming is not mirrored by a signifi cant negative δ13C excursion, as observed during the Paleocene-Eocene thermal maximum, which suggests that the middle Eocene climatic optimum event was not triggered by methane-hydrate dissociation but by a transient rise in pCO
2 levels.
The middle Eocene time interval is well rep-resented in pelagic carbonates of the Italian Sca-glia Rossa and Scaglia Variegata Formations. The Contessa sections (Gubbio, central Italy) contain a thick and continuous Scaglia sequence that extends from the Lower Cretaceous through to the Upper Miocene (e.g., Lowrie et al., 1982; Cresta et al., 1989; Montanari et al., 1997). The Middle and Upper Eocene Scaglia limestones that crop out along the Contessa Highway (CH) section have been paleomagnetically investigated by Lowrie et al. (1982). In the same stratigraphic interval that we describe in this paper, Lowrie et al. (1982) collected samples with an average stratigraphic spacing of ~80 cm. They stated that: “the chosen sample spacing was too wide to describe the shorter magnetozones completely” (see also Figure 3 of Lowrie et al., 1982). A higher-resolution paleomagnetic reinvestigation was implicitly suggested by this statement. In order to: (1) improve the magnetostratigraphic resolution of the late middle Eocene interval, (2) provide a calibration of biostratigraphic datums in the same interval, and (3) test whether a signature associated with the middle Eocene climatic optimum event is present in this North-ern Hemisphere sequence, which might suggest a global extent for the middle Eocene climatic optimum event, we have developed a new mag-netobiostratigraphy, which we integrate with new oxygen and carbon isotope measurements, for the middle Eocene Scaglia limestones of the Contessa Highway section.
LOCATION AND GEOLOGICAL SETTING
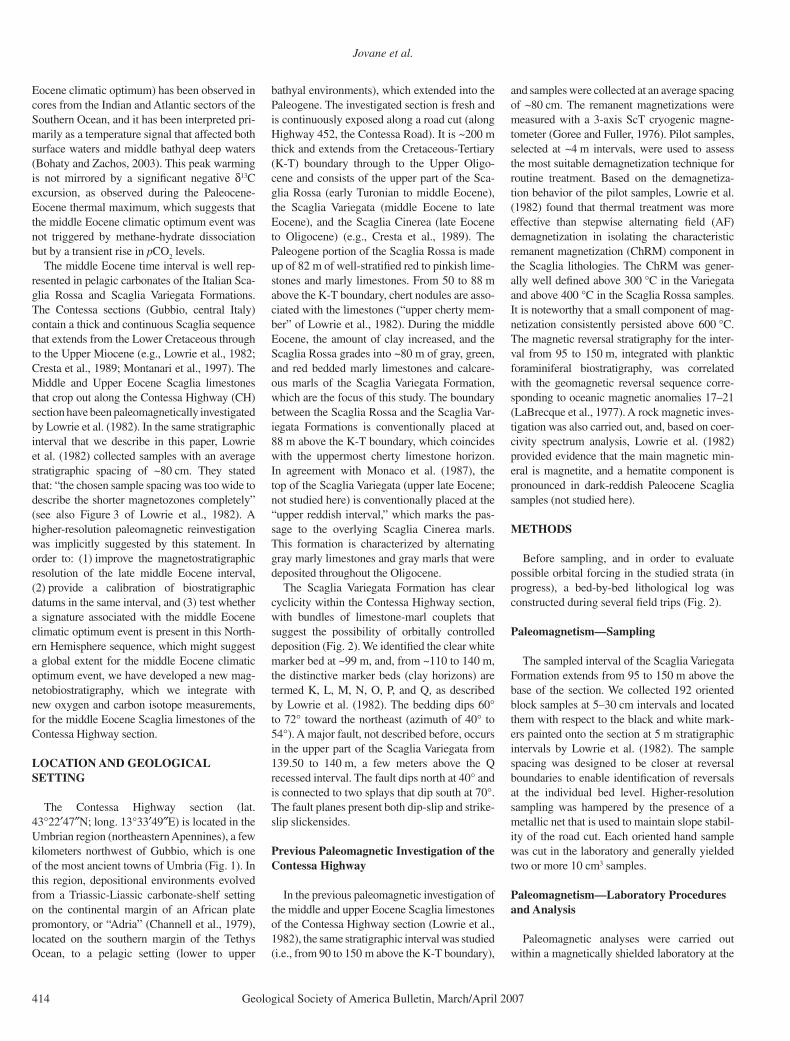
The Contessa Highway section (lat. 43°22′47″N; long. 13°33′49″E) is located in the Umbrian region (northeastern Apennines), a few kilometers northwest of Gubbio, which is one of the most ancient towns of Umbria (Fig. 1). In this region, depositional environments evolved from a Triassic-Liassic carbonate-shelf setting on the continental margin of an African plate promontory, or “Adria” (Channell et al., 1979), located on the southern margin of the Tethys Ocean, to a pelagic setting (lower to upper
bathyal environments), which extended into the Paleogene. The investigated section is fresh and is continuously exposed along a road cut (along Highway 452, the Contessa Road). It is ~200 m thick and extends from the Cretaceous-Tertiary (K-T) boundary through to the Upper Oligo-cene and consists of the upper part of the Sca-glia Rossa (early Turonian to middle Eocene), the Scaglia Variegata (middle Eocene to late Eocene), and the Scaglia Cinerea (late Eocene to Oligocene) (e.g., Cresta et al., 1989). The Paleogene portion of the Scaglia Rossa is made up of 82 m of well-stratifi ed red to pinkish lime-stones and marly limestones. From 50 to 88 m above the K-T boundary, chert nodules are asso-ciated with the limestones (“upper cherty mem-ber” of Lowrie et al., 1982). During the middle Eocene, the amount of clay increased, and the Scaglia Rossa grades into ~80 m of gray, green, and red bedded marly limestones and calcare-ous marls of the Scaglia Variegata Formation, which are the focus of this study. The boundary between the Scaglia Rossa and the Scaglia Var-iegata Formations is conventionally placed at 88 m above the K-T boundary, which coincides with the uppermost cherty limestone horizon. In agreement with Monaco et al. (1987), the top of the Scag lia Variegata (upper late Eocene; not studied here) is conventionally placed at the “upper reddish interval,” which marks the pas-sage to the overlying Scaglia Cinerea marls. This formation is characterized by alternating gray marly limestones and gray marls that were deposited throughout the Oligocene.
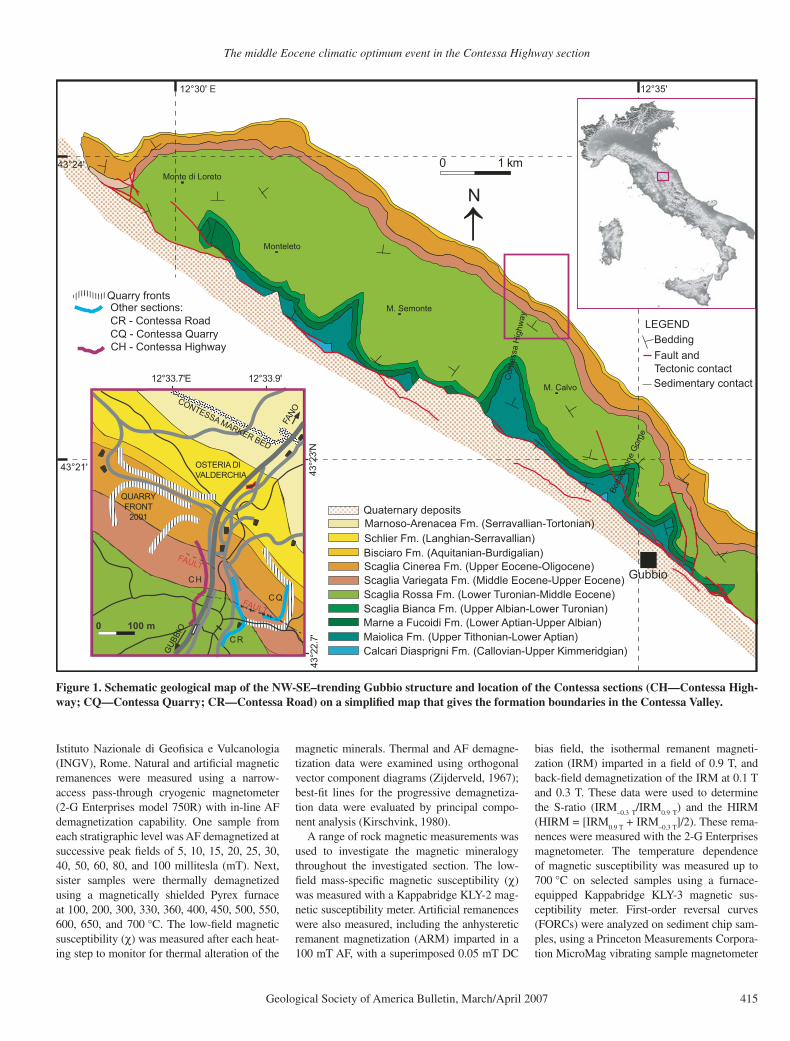
The Scaglia Variegata Formation has clear cyclicity within the Contessa Highway section, with bundles of limestone-marl couplets that suggest the possibility of orbitally controlled deposition (Fig. 2). We identifi ed the clear white marker bed at ~99 m, and, from ~110 to 140 m, the distinctive marker beds (clay horizons) are termed K, L, M, N, O, P, and Q, as described by Lowrie et al. (1982). The bedding dips 60° to 72° toward the northeast (azimuth of 40° to 54°). A major fault, not described before, occurs in the upper part of the Scaglia Variegata from 139.50 to 140 m, a few meters above the Q recessed interval. The fault dips north at 40° and is connected to two splays that dip south at 70°. The fault planes present both dip-slip and strike-slip slickensides.
Previous Paleomagnetic Investigation of the Contessa Highway
In the previous paleomagnetic investigation of the middle and upper Eocene Scaglia limestones of the Contessa Highway section (Lowrie et al., 1982), the same stratigraphic interval was studied (i.e., from 90 to 150 m above the K-T boundary),
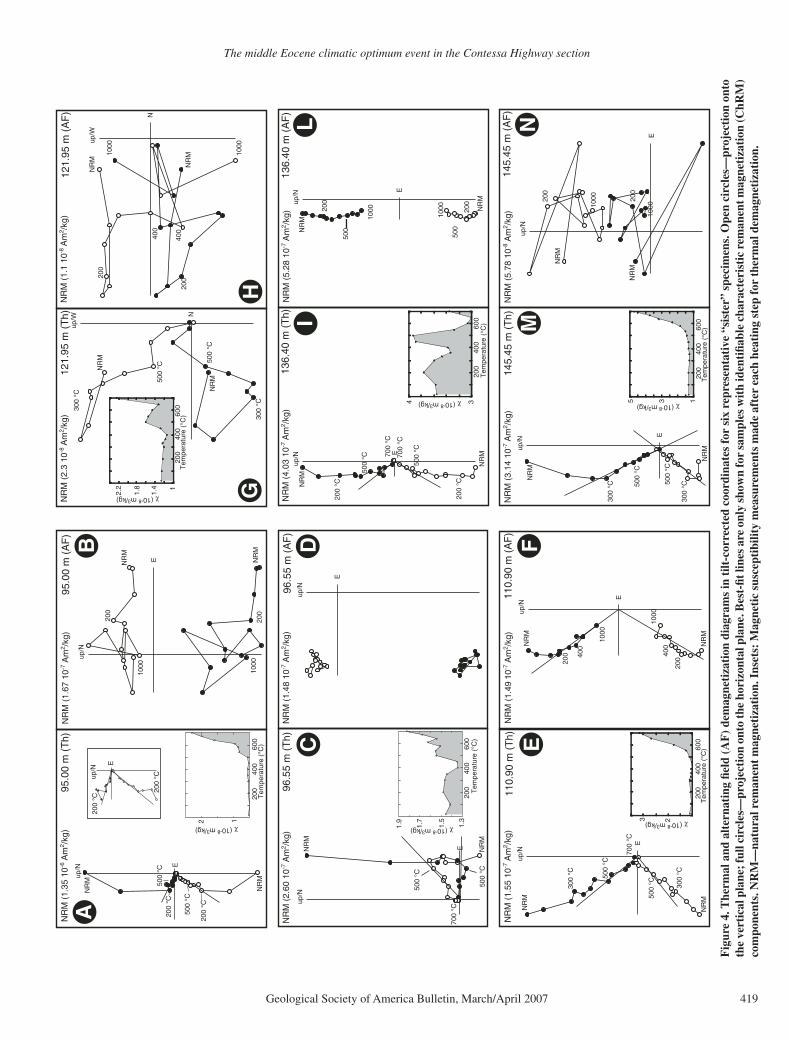
and samples were collected at an average spacing of ~80 cm. The remanent magnetizations were measured with a 3-axis ScT cryogenic magne-tometer (Goree and Fuller, 1976). Pilot samples, selected at ~4 m intervals, were used to assess the most suitable demagnetization technique for routine treatment. Based on the demagnetiza-tion behavior of the pilot samples, Lowrie et al. (1982) found that thermal treatment was more effective than stepwise alternating fi eld (AF) demagnetization in isolating the characteristic remanent magnetization (ChRM) component in the Scaglia lithologies. The ChRM was gener-ally well defi ned above 300 °C in the Variegata and above 400 °C in the Scaglia Rossa samples. It is noteworthy that a small component of mag-netization consistently persisted above 600 °C. The magnetic reversal stratigraphy for the inter-val from 95 to 150 m, integrated with planktic foraminiferal biostratigraphy, was correlated with the geomagnetic reversal sequence corre-sponding to oceanic magnetic anomalies 17–21 (LaBrecque et al., 1977). A rock magnetic inves-tigation was also carried out, and, based on coer-civity spectrum analysis, Lowrie et al. (1982) provided evidence that the main magnetic min-eral is magnetite, and a hematite component is pronounced in dark-reddish Paleocene Scaglia samples (not studied here).
METHODS
Before sampling, and in order to evaluate possible orbital forcing in the studied strata (in progress), a bed-by-bed lithological log was constructed during several fi eld trips (Fig. 2).
Paleomagnetism—Sampling
The sampled interval of the Scaglia Variegata Formation extends from 95 to 150 m above the base of the section. We collected 192 oriented block samples at 5–30 cm intervals and located them with respect to the black and white mark-ers painted onto the section at 5 m stratigraphic intervals by Lowrie et al. (1982). The sample spacing was designed to be closer at reversal boundaries to enable identifi cation of reversals at the individual bed level. Higher-resolution sampling was hampered by the presence of a metallic net that is used to maintain slope stabil-ity of the road cut. Each oriented hand sample was cut in the laboratory and generally yielded two or more 10 cm3 samples.
Paleomagnetism—Laboratory Procedures and Analysis
Paleomagnetic analyses were carried out within a magnetically shielded laboratory at the
The middle Eocene climatic optimum event in the Contessa Highway section
Geological Society of America Bulletin, March/April 2007 415
Istituto Nazionale di Geofi sica e Vulcanologia (INGV), Rome. Natural and artifi cial magnetic remanences were measured using a narrow-access pass-through cryogenic magnetometer (2-G Enterprises model 750R) with in-line AF demagnetization capability. One sample from each stratigraphic level was AF demagnetized at successive peak fi elds of 5, 10, 15, 20, 25, 30, 40, 50, 60, 80, and 100 millitesla (mT). Next, sister samples were thermally demagnetized using a magnetically shielded Pyrex furnace at 100, 200, 300, 330, 360, 400, 450, 500, 550, 600, 650, and 700 °C. The low-fi eld magnetic susceptibility (χ) was measured after each heat-ing step to monitor for thermal alteration of the
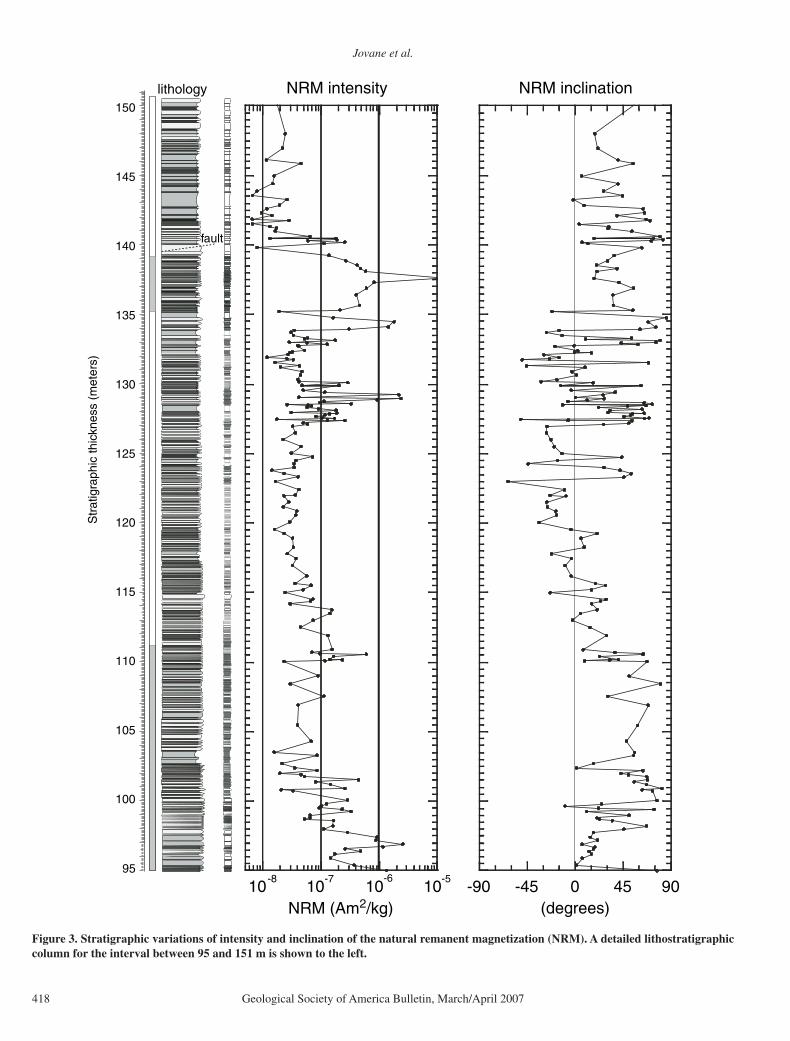
magnetic minerals. Thermal and AF demagne-tization data were examined using orthogonal vector component diagrams (Zijderveld, 1967); best-fi t lines for the progressive demagnetiza-tion data were evaluated by principal compo-nent analysis (Kirschvink, 1980).
A range of rock magnetic measurements was used to investigate the magnetic mineralogy throughout the investigated section. The low-fi eld mass-specifi c magnetic susceptibility (χ) was measured with a Kappabridge KLY-2 mag-netic susceptibility meter. Artifi cial remanences were also measured, including the anhysteretic remanent magnetization (ARM) imparted in a 100 mT AF, with a superimposed 0.05 mT DC
bias fi eld, the isothermal remanent magneti-zation (IRM) imparted in a fi eld of 0.9 T, and back-fi eld demagnetization of the IRM at 0.1 T and 0.3 T. These data were used to determine the S-ratio (IRM
–0.3 T/IRM
0.9 T) and the HIRM
(HIRM = [IRM0.9 T
+ IRM–0.3 T
]/2). These rema-nences were measured with the 2-G Enterprises magnetometer. The temperature dependence of magnetic susceptibility was measured up to 700 °C on selected samples using a furnace-equipped Kappabridge KLY-3 magnetic sus-ceptibility meter. First-order reversal curves (FORCs) were analyzed on sediment chip sam-ples, using a Princeton Measurements Corpora-tion MicroMag vibrating sample magnetometer
Figure 1. Schematic geological map of the NW-SE–trending Gubbio structure and location of the Contessa sections (CH—Contessa High-way; CQ—Contessa Quarry; CR—Contessa Road) on a simplifi ed map that gives the formation boundaries in the Contessa Valley.
Jovane et al.
416 Geological Society of America Bulletin, March/April 2007
129
130
131
132
134
135
136
137
138
139
140
141
142
143
144
145
146
117
118
119
120
121
122
123
124
125
126
127
128
100
101
102
103
104
105
106
107
108
109
110
111
112
113
147
148
149
150
151
K L
M
N
O
Q
fault
99
98
97
96
95 132
133
P113
114
115
116
whitemarker
lithology
markers
sampling
level color
color
Str
atig
raph
ic th
ickn
ess
(met
ers)
Legend
marlscalcareous marl
lithology:
marly limestone
magnetostratigraphy and rock magnetismthermomagnetic cycle and hysteresis loop
samples:
Figure 2. Detailed lithostratigraphic column for the interval between 95 and 151 m for the Contessa Highway section. Samples collected for this study and colors of the lithologies are also indicated. The white marker bed and the distinctive marker beds (clay horizons) are termed K, L, M, N, O, P, and Q, as described by Lowrie et al. (1982).
The middle Eocene climatic optimum event in the Contessa Highway section
Geological Society of America Bulletin, March/April 2007 417
at the National Oceanography Centre South-ampton (NOCS), University of Southampton, UK. Samples were selected for FORC analysis (Roberts et al., 2000) from the intervals with strongest magnetizations.
Foraminiferal Assemblages
One hundred and sixty samples were col-lected (at 30 cm average intervals) for biostrati-graphic and stable isotope analyses. The fora-miniferal content was analyzed for all samples. Foraminifera were studied in washed residues from soft and hard lithologies. Preparation from soft lithologies included gentle crushing, soak-ing in a hydrogen peroxide solution (10%), siev-ing through a 63 μm mesh, and drying at 60 °C. Preparation from hard lithologies included gentle crushing, cold acetolysis with acetic acid (80%) following the method of Lirer (2000), sieving through a 63 μm mesh, 1 to 2 h clean-ing in an ultrasonic cleaner, and drying at 60 °C. The cold acetolysis method enabled extraction of generally easily identifi able foraminifera even from indurated limestones. This offered the pos-sibility of accurate taxonomic determination and detailed analysis of foraminiferal assemblages.
Nannofossil Assemblages
Samples for calcareous nannofossil analysis were prepared as smear slides using standard techniques (Bown and Young, 1998). Nannofos-sils were examined with a light microscope at a magnifi cation of 1000× and were identifi ed fol-lowing the taxonomic schemes of Perch-Nielsen (1985) and Varol (1998). Assemblages were studied semiquantitatively, and at least three tra-verses were investigated for each smear-slide.
Oxygen and Carbon Isotope Measurements
One hundred thirty-four stable isotope analy-ses were made on bulk samples. They were made using an automated continuous-fl ow car-bonate preparation GasBenchII device (Spötl and Vennemann, 2003) and a ThermoElectron Delta Plus XP mass spectrometer at the Istituto Ambiente Marino Costiero, Consiglio Nazio-nale delle Ricerche (IAMC-CNR, Naples) iso-tope geochemistry laboratory. Acidifi cation of samples was performed at 50 °C. An internal standard (Carrara Marble with δ18O = −2.43 versus Vienna Peedee belemnite [VPDB] and δ13C = 2.43 versus VPDB) was run for every 6 samples, and, for every 30 samples, the NBS19 international standard was measured. Stan-dard deviations of carbon and oxygen isotope measurements were estimated at 0.1‰ and 0.08‰, respectively, on the basis of replicate
measurements of ~70 samples. The entire cali-bration was based directly on standard materi-als that were part of each run (in our case, the homogeneous and certifi ed Carrara Marble car-bonate with isotopic composition determined by conventional offl ine dual-inlet techniques), rather than from solving fractionation equations for the acid-based reaction. In other words, there was no need to know the stable isotopic com-position of the CO
2 reference gas a priori, nor
the acid fractionation factor at the given tem-perature of the reaction (Spötl and Vennemann, 2003). All of the stable isotope data are reported in per mil (‰) relative to the VPDB standard.
RESULTS
Paleomagnetic Behavior and Polarity Zonation
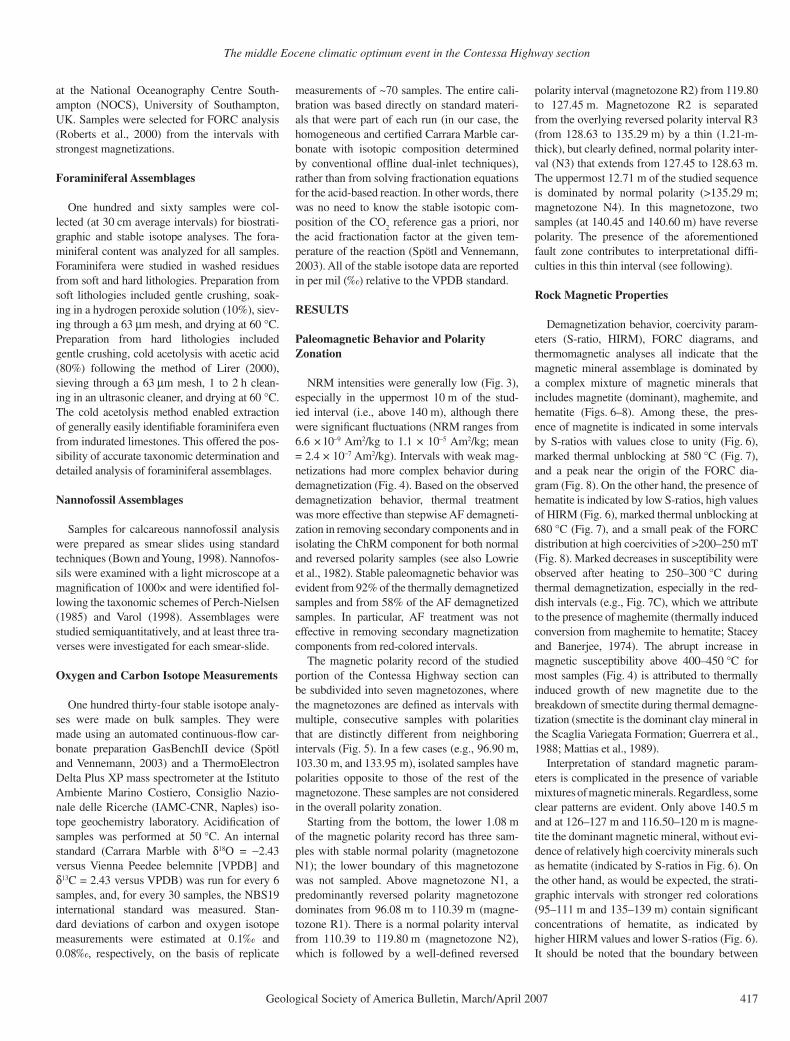
NRM intensities were generally low (Fig. 3), especially in the uppermost 10 m of the stud-ied interval (i.e., above 140 m), although there were signifi cant fl uctuations (NRM ranges from 6.6 × 10⁻⁹ Am2/kg to 1.1 × 10⁻⁵ Am2/kg; mean = 2.4 × 10⁻⁷ Am2/kg). Intervals with weak mag-netizations had more complex behavior during demagnetization (Fig. 4). Based on the observed demagnetization behavior, thermal treatment was more effective than stepwise AF demagneti-zation in removing secondary components and in isolating the ChRM component for both normal and reversed polarity samples (see also Lowrie et al., 1982). Stable paleomagnetic behavior was evident from 92% of the thermally demagnetized samples and from 58% of the AF demagnetized samples. In particular, AF treatment was not effective in removing secondary magnetization components from red-colored intervals.
The magnetic polarity record of the studied portion of the Contessa Highway section can be subdivided into seven magnetozones, where the magnetozones are defi ned as intervals with multiple, consecutive samples with polarities that are distinctly different from neighboring intervals (Fig. 5). In a few cases (e.g., 96.90 m, 103.30 m, and 133.95 m), isolated samples have polarities opposite to those of the rest of the magnetozone. These samples are not considered in the overall polarity zonation.
Starting from the bottom, the lower 1.08 m of the magnetic polarity record has three sam-ples with stable normal polarity (magnetozone N1); the lower boundary of this magnetozone was not sampled. Above magnetozone N1, a predominantly reversed polarity magnetozone dominates from 96.08 m to 110.39 m (magne-tozone R1). There is a normal polarity interval from 110.39 to 119.80 m (magnetozone N2), which is followed by a well-defi ned reversed
polarity interval (magnetozone R2) from 119.80 to 127.45 m. Magnetozone R2 is separated from the overlying reversed polarity interval R3 (from 128.63 to 135.29 m) by a thin (1.21-m-thick), but clearly defi ned, normal polarity inter-val (N3) that extends from 127.45 to 128.63 m. The uppermost 12.71 m of the studied sequence is dominated by normal polarity (>135.29 m; magnetozone N4). In this magnetozone, two samples (at 140.45 and 140.60 m) have reverse polarity. The presence of the aforementioned fault zone contributes to interpretational diffi -culties in this thin interval (see following).
Rock Magnetic Properties
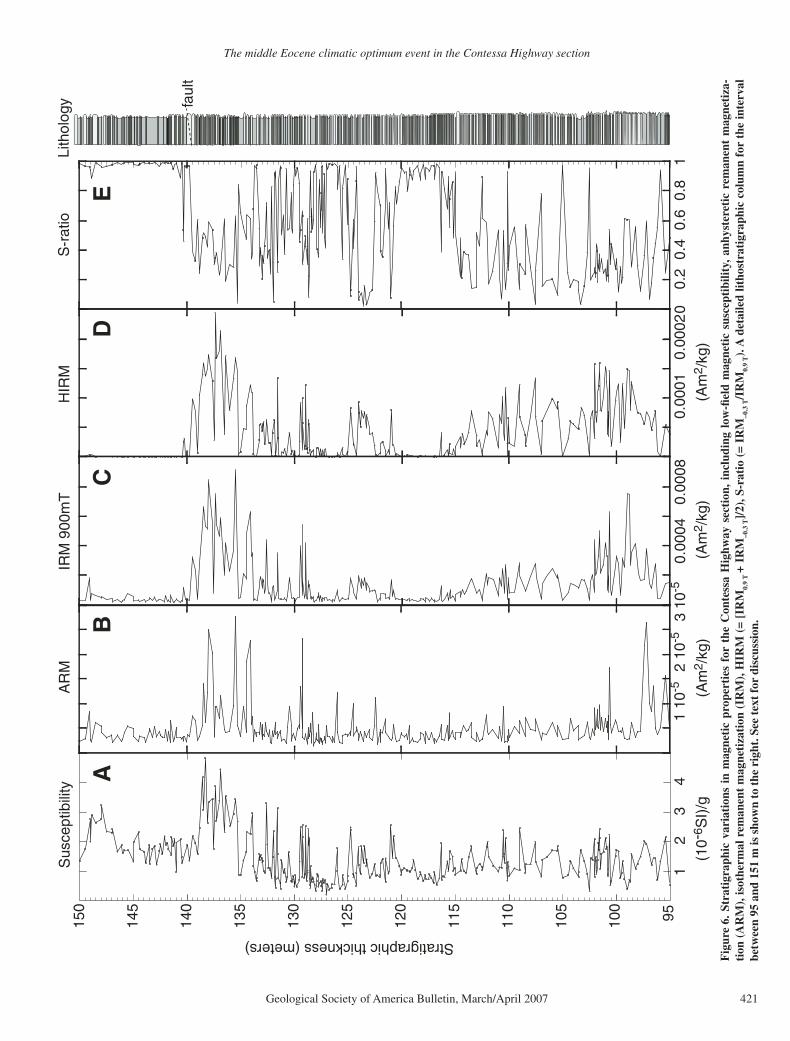
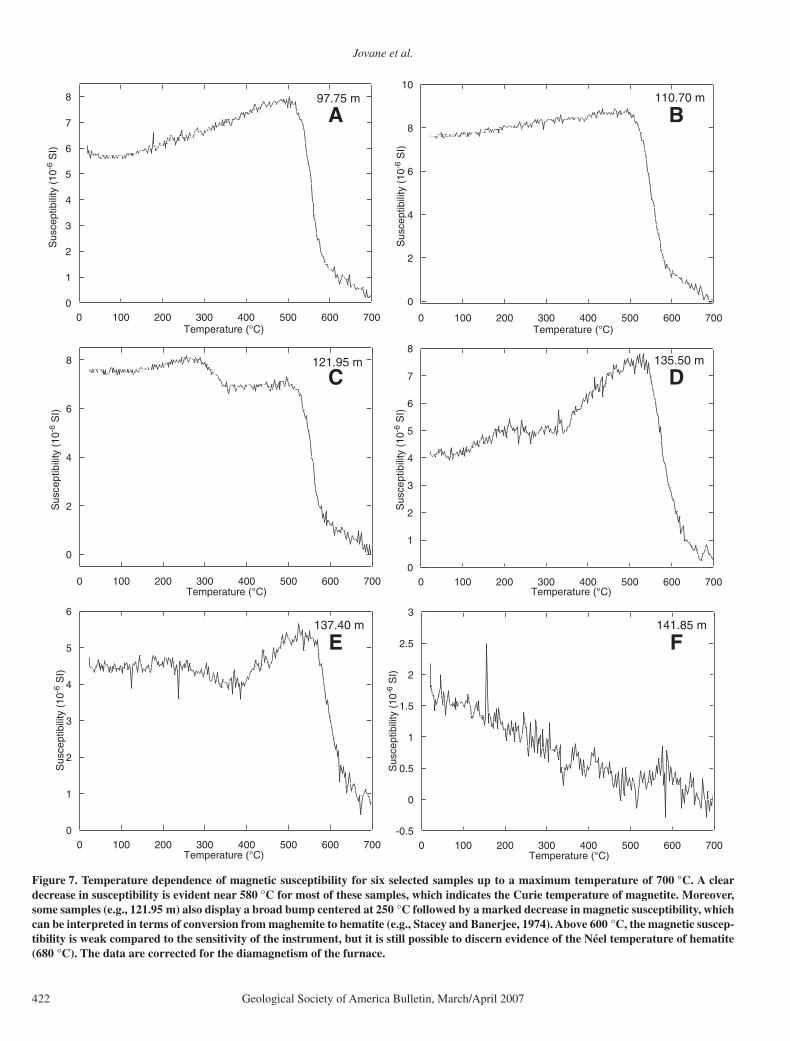
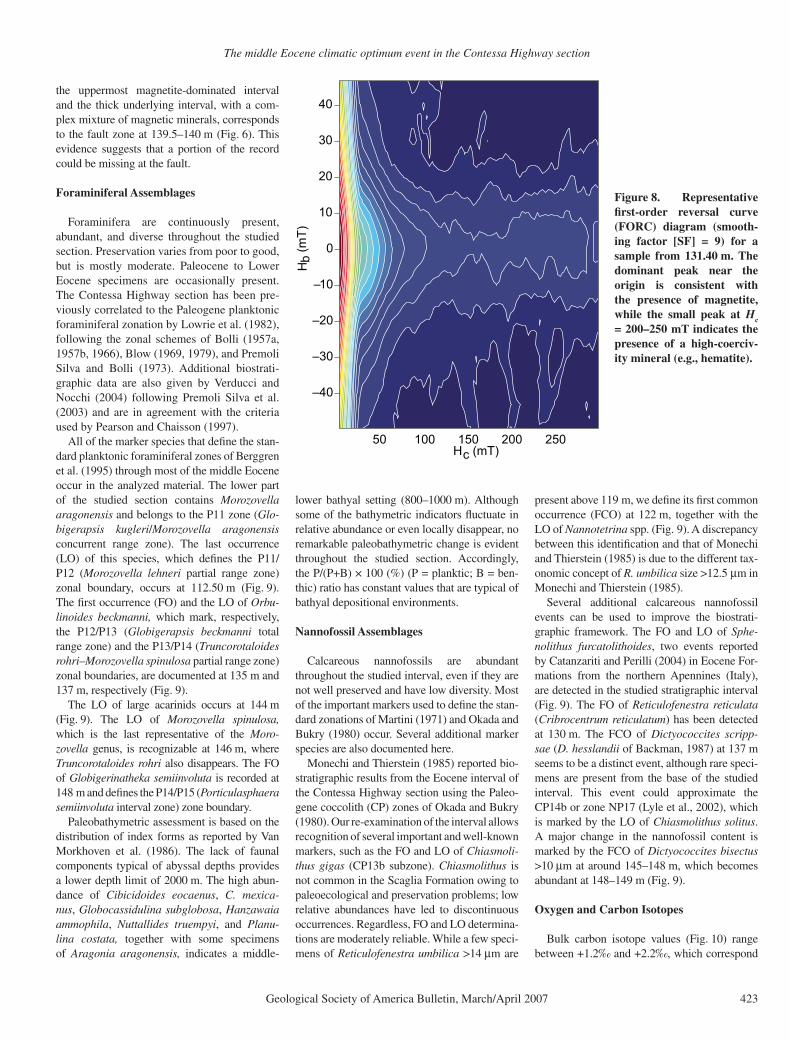
Demagnetization behavior, coercivity param-eters (S-ratio, HIRM), FORC diagrams, and thermomagnetic analyses all indicate that the magnetic mineral assemblage is dominated by a complex mixture of magnetic minerals that includes magnetite (dominant), maghemite, and hematite (Figs. 6–8). Among these, the pres-ence of magnetite is indicated in some intervals by S-ratios with values close to unity (Fig. 6), marked thermal unblocking at 580 °C (Fig. 7), and a peak near the origin of the FORC dia-gram (Fig. 8). On the other hand, the presence of hematite is indicated by low S-ratios, high values of HIRM (Fig. 6), marked thermal unblocking at 680 °C (Fig. 7), and a small peak of the FORC distribution at high coercivities of >200–250 mT (Fig. 8). Marked decreases in susceptibility were observed after heating to 250–300 °C during thermal demagnetization, especially in the red-dish intervals (e.g., Fig. 7C), which we attribute to the presence of maghemite (thermally induced conversion from maghemite to hematite; Stacey and Banerjee, 1974). The abrupt increase in magnetic susceptibility above 400–450 °C for most samples (Fig. 4) is attributed to thermally induced growth of new magnetite due to the breakdown of smectite during thermal demagne-tization (smectite is the dominant clay mineral in the Scaglia Variegata Formation; Guerrera et al., 1988; Mattias et al., 1989).
Interpretation of standard magnetic param-eters is complicated in the presence of variable mixtures of magnetic minerals. Regardless, some clear patterns are evident. Only above 140.5 m and at 126–127 m and 116.50–120 m is magne-tite the dominant magnetic mineral, without evi-dence of relatively high coercivity minerals such as hematite (indicated by S-ratios in Fig. 6). On the other hand, as would be expected, the strati-graphic intervals with stronger red colorations (95–111 m and 135–139 m) contain signifi cant concentrations of hematite, as indicated by higher HIRM values and lower S-ratios (Fig. 6). It should be noted that the boundary between
Jovane et al.
418 Geological Society of America Bulletin, March/April 2007
fault
95
100
105
110
115
120
125
130
135
140
145
150S
trat
igra
phic
thic
knes
s (m
eter
s)
10-8
10-7
10-6
10-5
NRM (Am2/kg)-90 -45 0 45 90
(degrees)
NRM inclinationNRM intensitylithology
Figure 3. Stratigraphic variations of intensity and inclination of the natural remanent magnetization (NRM). A detailed lithostratigraphic column for the interval between 95 and 151 m is shown to the left.
The middle Eocene climatic optimum event in the Contessa Highway section
Geological Society of America Bulletin, March/April 2007 419
136.
40 m
(T
h)
E
up/N
500
°C
NR
M (
4.03
10-7
Am
2 /kg)
500
°C
E
up/N
200
1000 20
0
1000
NR
M (
5.28
10-7
Am
2 /kg)
34
200
400
600
200
°C
200
°C
700
°C
700
°C
500
500
136.
40 m
(A
F)
Tem
pera
ture
(°C
)
χ (10-8 m3/kg)
95.0
0 m
(T
h)
E
up/N
500
°C
500
°C
NR
M (
1.35
10-6
Am
2 /kg)
E
up/N
200
200
1000
1000
NR
M (
1.67
10-7
Am
2 /kg)
E
up/N
200
°C
200
°C
12
200
400
600
χ (10-8 m3/kg)
Tem
pera
ture
(°C
)
200
°C
200
°C
95.0
0 m
(A
F)
96.5
5 m
(T
h)
E
up/N
500
°C
500
°C
NR
M (
2.60
10-7
Am
2 /kg)
E
up/N
NR
M (
1.48
10-7
Am
2 /kg)
1.3
1.5
1.7
1.9
700
°C
200
400
600
96.5
5 m
(A
F)
Tem
pera
ture
(°C
)
χ (10-8 m3/kg)
145.
45 m
(T
h)N
RM
(3.
14 1
0-7 A
m2 /k
g)
E
up/N
200
100020
0
1000
NR
M (
5.78
10-8
Am
2 /kg)
E
up/N
NR
M
500
°C
500
°C
300
°C
300
°C135
200
400
600
145.
45 m
(A
F)
Tem
pera
ture
(°C
)
χ (10-8 m3/kg)E
up/N
500
°C
NR
M (
1.55
10-7
Am
2 /kg)
500
°C
E
up/N
200
200
1000
1000
NR
M (
1.49
10-7
Am
2 /kg)
23
200
400
600
110.
90 m
(T
h)
300
°C
300
°C
700
°C
400
400
110.
90 m
(A
F)
Tem
pera
ture
(°C
)
χ (10-8 m3/kg)
121.
95 m
(T
h) N
up/W
500
°C
NR
M (
2.3
10-8
Am
2 /kg)
500
°C
N
up/W
200
1000
200
1000
NR
M (
1.1
10-8
Am
2 /kg)
1
1.4
1.8
2.2
200
400
600
300
°C
300
°C
400
400
121.
95 m
(A
F)
Tem
pera
ture
(°C
)
χ (10-8 m3/kg)
NR
MN
RM
NR
M
NR
M
NR
M
NR
M
NR
M
NR
M
NR
M
NR
M
NR
M
NR
M
NR
M
NR
M
NR
M
NR
M
NR
M
NR
M
NR
M
NR
M
NR
M
AB
GH
LI
CD
MN
EF
Fig
ure
4. T
herm
al a
nd a
lter
nati
ng fi
eld
(AF
) de
mag
neti
zati
on d
iagr
ams
in t
ilt-c
orre
cted
coo
rdin
ates
for
six
rep
rese
ntat
ive
“sis
ter”
spe
cim
ens.
Ope
n ci
rcle
s—pr
ojec
tion
ont
o th
e ve
rtic
al p
lane
; ful
l cir
cles
—pr
ojec
tion
ont
o th
e ho
rizo
ntal
pla
ne. B
est-
fi t li
nes
are
only
sho
wn
for
sam
ples
wit
h id
enti
fi abl
e ch
arac
teri
stic
rem
anen
t mag
neti
zati
on (C
hRM
) co
mpo
nent
s. N
RM
—na
tura
l rem
anen
t m
agne
tiza
tion
. Ins
ets:
Mag
neti
c su
scep
tibi
lity
mea
sure
men
ts m
ade
afte
r ea
ch h
eati
ng s
tep
for
ther
mal
dem
agne
tiza
tion
.
Jovane et al.
420 Geological Society of America Bulletin, March/April 2007
The middle Eocene climatic optimum event in the Contessa Highway section
Geological Society of America Bulletin, March/April 2007 421
Stratigraphic thickness (meters)
Sus
cept
ibili
ty
95100
105
110
115
120
125
130
135
140
145
150
A
1 10
-5
(A
m2 /
kg)
AR
M
B
0.00
040.
0008
(A
m2 /
kg)
IRM
900
mT
C
0.00
010.
0002
HIR
M
D
00.
20.
40.
60.
81
S-r
atio
E
Lith
olog
y
12
34
2 10
-53
10-5
(10
-6S
I)/g
(A
m2 /
kg)
faul
t
Fig
ure
6. S
trat
igra
phic
var
iati
ons
in m
agne
tic
prop
erti
es f
or t
he C
onte
ssa
Hig
hway
sec
tion
, in
clud
ing
low
-fi e
ld m
agne
tic
susc
epti
bilit
y, a
nhys
tere
tic
rem
anen
t m
agne
tiza
-ti
on (
AR
M),
isot
herm
al r
eman
ent
mag
neti
zati
on (
IRM
), H
IRM
(=
[IR
M0.
9 T
+ I
RM
–0.3
T]/
2), S
-rat
io (
= IR
M–0
.3 T
/IR
M0.
9 T).
A d
etai
led
litho
stra
tigr
aphi
c co
lum
n fo
r th
e in
terv
al
betw
een
95 a
nd 1
51 m
is s
how
n to
the
rig
ht. S
ee t
ext
for
disc
ussi
on.
Jovane et al.
422 Geological Society of America Bulletin, March/April 2007
0
2
4
6
8
10
0 100 200 300 400 500 600 700
110.70 m
0
1
2
3
4
5
6
7
8
0 100 200 300 400 500 600 700
97.75 m
Sus
cept
ibili
ty (
10-6
SI)
Temperature (°C)
0
2
4
6
8
0 100 200 300 400 500 600 700
121.95 m
0
1
2
3
4
5
6
0 100 200 300 400 500 600 700
137.40 m
-0.5
0
0.5
1
1.5
2
2.5
3
0 100 200 300 400 500 600 700
141.85 m
Sus
cept
ibili
ty (
10-6
SI)
Sus
cept
ibili
ty (
10-6
SI)
Temperature (°C)
Sus
cept
ibili
ty (
10-6
SI)
Temperature (°C)
Sus
cept
ibili
ty (
10-6
SI)
Temperature (°C)
A B
C
E
0
1
2
3
4
5
6
7
8
0 100 200 300 400 500 600 700
135.50 m
Temperature (°C)
Sus
cept
ibili
ty (
10-6
SI)
Temperature (°C)
D
F
Figure 7. Temperature dependence of magnetic susceptibility for six selected samples up to a maximum temperature of 700 °C. A clear decrease in susceptibility is evident near 580 °C for most of these samples, which indicates the Curie temperature of magnetite. Moreover, some samples (e.g., 121.95 m) also display a broad bump centered at 250 °C followed by a marked decrease in magnetic susceptibility, which can be interpreted in terms of conversion from maghemite to hematite (e.g., Stacey and Banerjee, 1974). Above 600 °C, the magnetic suscep-tibility is weak compared to the sensitivity of the instrument, but it is still possible to discern evidence of the Néel temperature of hematite (680 °C). The data are corrected for the diamagnetism of the furnace.
The middle Eocene climatic optimum event in the Contessa Highway section
Geological Society of America Bulletin, March/April 2007 423
the uppermost magnetite-dominated interval and the thick underlying interval, with a com-plex mixture of magnetic minerals, corresponds to the fault zone at 139.5–140 m (Fig. 6). This evidence suggests that a portion of the record could be missing at the fault.
Foraminiferal Assemblages
Foraminifera are continuously present, abundant, and diverse throughout the studied section. Preservation varies from poor to good, but is mostly moderate. Paleocene to Lower Eocene specimens are occasionally present. The Contessa Highway section has been pre-viously correlated to the Paleogene planktonic foraminiferal zonation by Lowrie et al. (1982), following the zonal schemes of Bolli (1957a, 1957b, 1966), Blow (1969, 1979), and Premoli Silva and Bolli (1973). Additional biostrati-graphic data are also given by Verducci and Nocchi (2004) following Premoli Silva et al. (2003) and are in agreement with the criteria used by Pearson and Chaisson (1997).
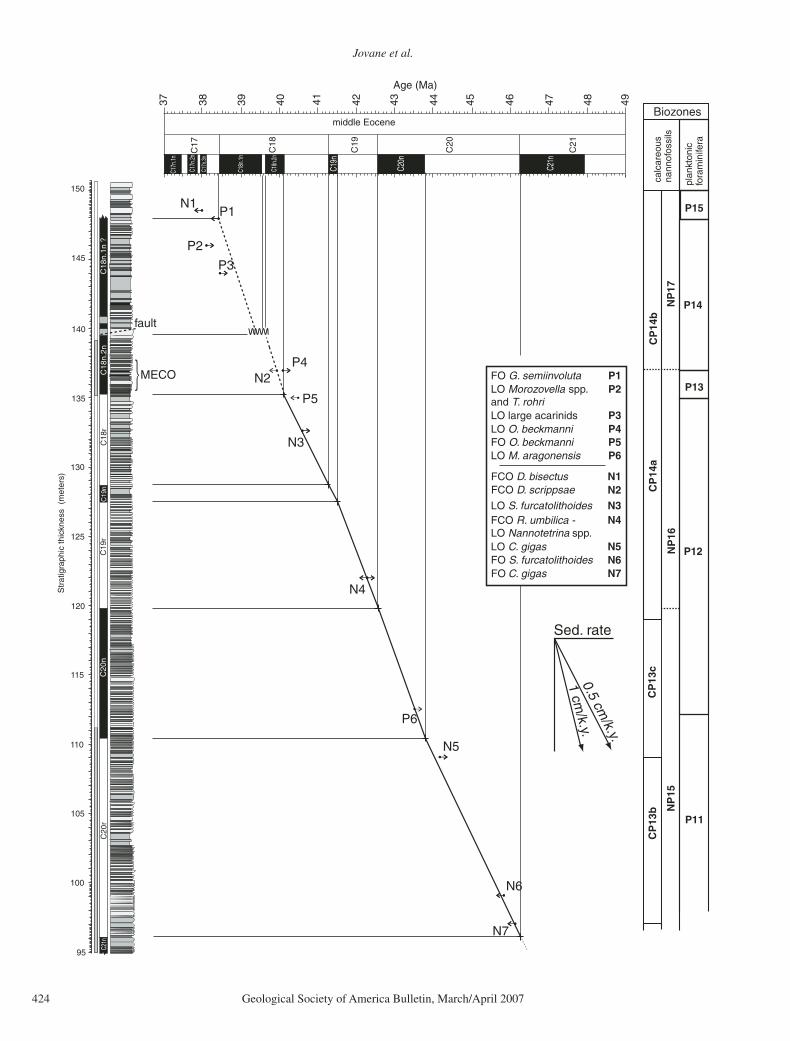
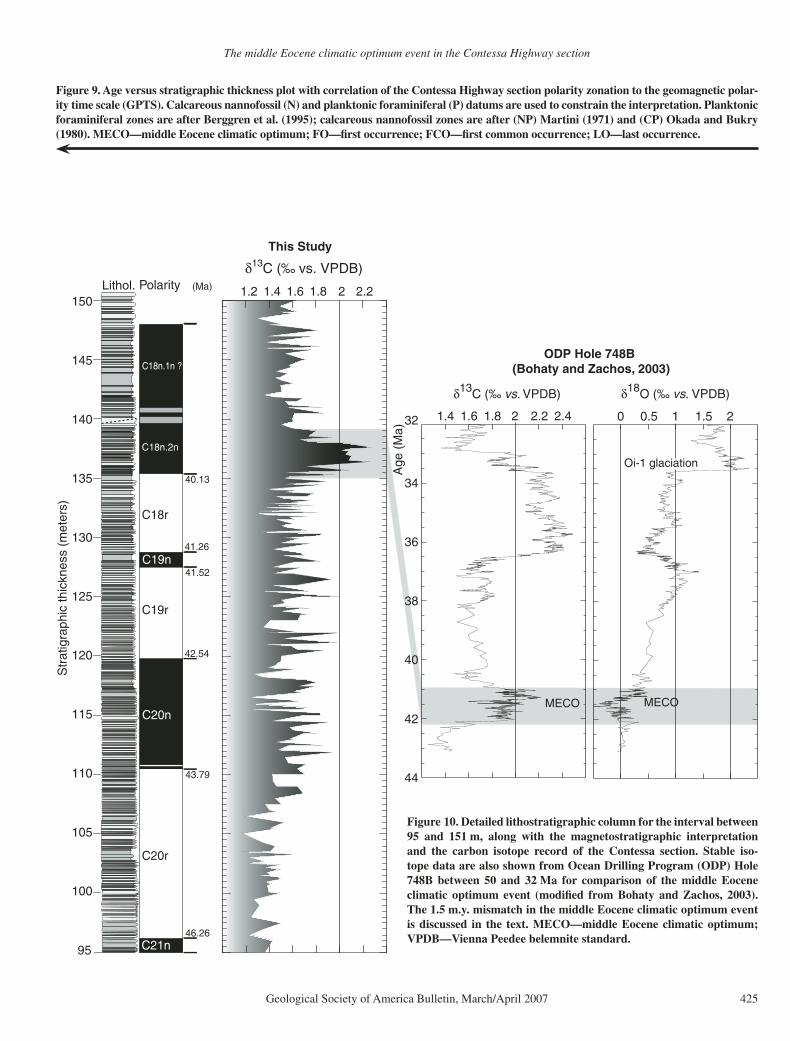
All of the marker species that defi ne the stan-dard planktonic foraminiferal zones of Berggren et al. (1995) through most of the middle Eocene occur in the analyzed material. The lower part of the studied section contains Morozovella aragonensis and belongs to the P11 zone (Glo-bigerapsis kugleri/Morozovella aragonensis concurrent range zone). The last occurrence (LO) of this species, which defi nes the P11/P12 (Morozovella lehneri partial range zone) zonal boundary, occurs at 112.50 m (Fig. 9). The fi rst occurrence (FO) and the LO of Orbu-linoides beckmanni, which mark, respectively, the P12/P13 (Globigerapsis beckmanni total range zone) and the P13/P14 (Truncorotaloides rohri–Morozovella spinulosa partial range zone) zonal boundaries, are documented at 135 m and 137 m, respectively (Fig. 9).
The LO of large acarinids occurs at 144 m (Fig. 9). The LO of Morozovella spinulosa, which is the last representative of the Moro-zovella genus, is recognizable at 146 m, where Truncorotaloides rohri also disappears. The FO of Globigerinatheka semiinvoluta is recorded at 148 m and defi nes the P14/P15 (Porticulasphaera semiinvoluta interval zone) zone boundary.
Paleobathymetric assessment is based on the distribution of index forms as reported by Van Morkhoven et al. (1986). The lack of faunal components typical of abyssal depths provides a lower depth limit of 2000 m. The high abun-dance of Cibicidoides eocaenus, C. mexica-nus, Globocassidulina subglobosa, Hanzawaia ammophila, Nuttallides truempyi, and Planu-lina costata, together with some specimens of Aragonia aragonensis, indicates a middle-
lower bathyal setting (800–1000 m). Although some of the bathymetric indicators fl uctuate in relative abundance or even locally disappear, no remarkable paleobathymetric change is evident throughout the studied section. Accordingly, the P/(P+B) × 100 (%) (P = planktic; B = ben-thic) ratio has constant values that are typical of bathyal depositional environments.
Nannofossil Assemblages
Calcareous nannofossils are abundant throughout the studied interval, even if they are not well preserved and have low diversity. Most of the important markers used to defi ne the stan-dard zonations of Martini (1971) and Okada and Bukry (1980) occur. Several additional marker species are also documented here.
Monechi and Thierstein (1985) reported bio-stratigraphic results from the Eocene interval of the Contessa Highway section using the Paleo-gene coccolith (CP) zones of Okada and Bukry (1980). Our re-examination of the interval allows recognition of several important and well-known markers, such as the FO and LO of Chiasmoli-thus gigas (CP13b subzone). Chiasmolithus is not common in the Scaglia Formation owing to paleoecological and preservation problems; low relative abundances have led to discontinuous occurrences. Regardless, FO and LO determina-tions are moderately reliable. While a few speci-mens of Reticulofenestra umbilica >14 μm are
present above 119 m, we defi ne its fi rst common occurrence (FCO) at 122 m, together with the LO of Nannotetrina spp. (Fig. 9). A discrepancy between this identifi cation and that of Monechi and Thierstein (1985) is due to the different tax-onomic concept of R. umbilica size >12.5 μm in Monechi and Thierstein (1985).
Several additional calcareous nannofossil events can be used to improve the biostrati-graphic framework. The FO and LO of Sphe-nolithus furcatolithoides, two events reported by Catanzariti and Perilli (2004) in Eocene For-mations from the northern Apennines (Italy), are detected in the studied stratigraphic interval (Fig. 9). The FO of Reticulofenestra reticulata (Cribrocentrum reticulatum) has been detected at 130 m. The FCO of Dictyococcites scripp-sae (D. hesslandii of Backman, 1987) at 137 m seems to be a distinct event, although rare speci-mens are present from the base of the studied interval. This event could approximate the CP14b or zone NP17 (Lyle et al., 2002), which is marked by the LO of Chiasmolithus solitus. A major change in the nannofossil content is marked by the FCO of Dictyococcites bisectus >10 μm at around 145–148 m, which becomes abundant at 148–149 m (Fig. 9).
Oxygen and Carbon Isotopes
Bulk carbon isotope values (Fig. 10) range between +1.2‰ and +2.2‰, which correspond
Hc (mT)
Hb (
mT
)
50 100 150 200 250
–40
–30
–20
–10
0
10
20
30
40
Figure 8. Representative fi rst-order reversal curve (FORC) diagram (smooth-ing factor [SF] = 9) for a sample from 131.40 m. The dominant peak near the origin is consistent with the presence of magnetite, while the small peak at Hc = 200–250 mT indicates the presence of a high-coerciv-ity mineral (e.g., hematite).
Jovane et al.
424 Geological Society of America Bulletin, March/April 2007
C17n
.1n
C17n
.2n
C17n
.3n
C18n
.1n
C18n
.2n
C19n
C20n
C21n
C17
C18
C19
C20
C21
middle Eocene
37 38 39 40 41 42 43 44 45 46 47 48 49
Age (Ma)
C20
nC
20r
C21n
130
120
125
C19
nC
19r
100
105
110
95
115
C18
rC
18n.
1n ?
C18
n.2n
135
140
145
150
0.5 cm/k.y.
1 cm/k.y.
Sed. rate
FO G. semiinvolutaLO Morozovella spp. and T. rohri LO large acarinidsLO O. beckmanni
N4
N1
P5
P3
P2
P4
FCO D. bisectus FCO D. scrippsae N2
N1
P4P3
P2P1
LO S. furcatolithoidesFCO R. umbilica -LO Nannotetrina spp.
N4N3
LO C. gigasFO S. furcatolithoides N6
N5
FO O. beckmanniLO M. aragonensis P6
P5
N5
N2
P1
N3
N6
P6
NP
15N
P16
P12
P13
P14
P15
Biozones
calc
areo
usna
nnof
ossi
ls
plan
kton
ic
fora
min
ifera
Str
atig
raph
ic th
ickn
ess
(m
eter
s)
fault
}MECO
FO C. gigas N7
N7
NP
17
CP
14b
CP
14a
CP
13c
CP
13b
P11
The middle Eocene climatic optimum event in the Contessa Highway section
Geological Society of America Bulletin, March/April 2007 425
1.4 1.6 1.8 2 2.2 2.432
34
36
38
40
42
44
ODP Hole 748B (Bohaty and Zachos, 2003)
Age
(M
a)
0 0.5 1 1.5 2
Oi-1 glaciation
MECOMECO
δ13C (‰ vs. VPDB) δ18O (‰ vs. VPDB)
Lithol.
C20r
Polarity
C21n
C20n
C19r
C19n
C18r
C18n.2n
C18n.1n ?
95
100
105
110
115
120
125
130
135
140
145
150
Str
atig
raph
ic th
ickn
ess
(met
ers)
δ13C (‰ vs. VPDB)
1.2 1.4 1.6 1.8 2 2.2
This Study
40.13
(Ma)
41.26
41.52
42.54
43.79
46.26
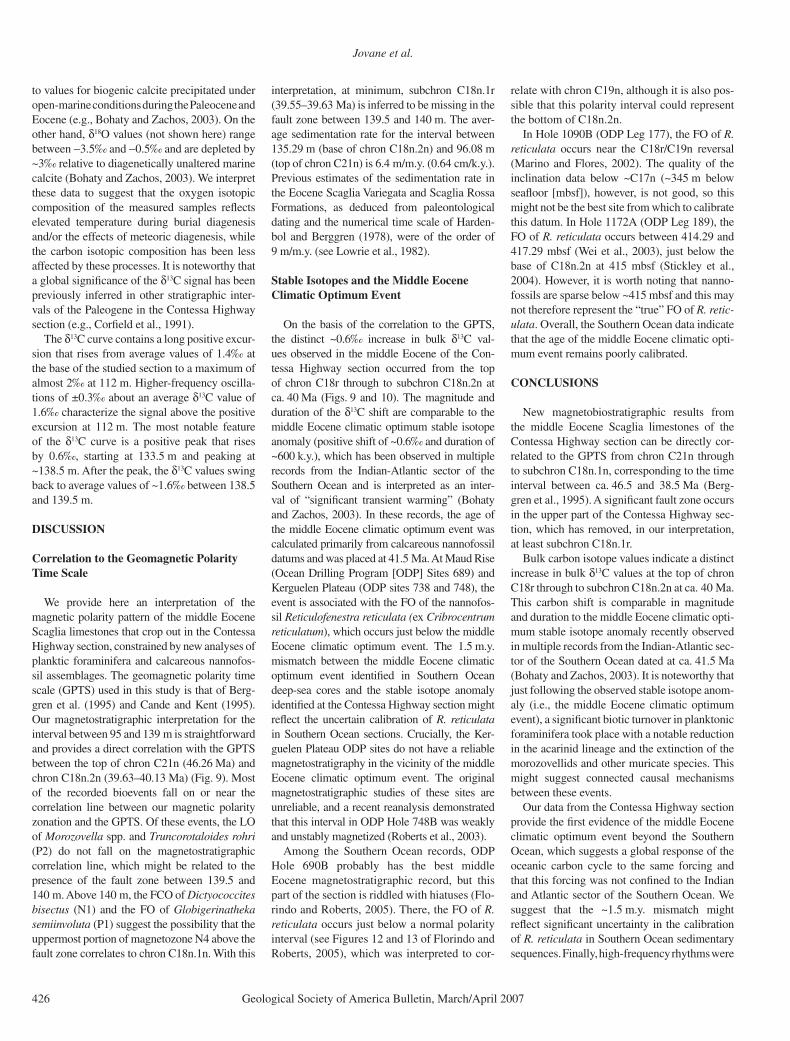
Figure 10. Detailed lithostratigraphic column for the interval between 95 and 151 m, along with the magnetostratigraphic interpretation and the carbon isotope record of the Contessa section. Stable iso-tope data are also shown from Ocean Drilling Program (ODP) Hole 748B between 50 and 32 Ma for comparison of the middle Eocene climatic optimum event (modifi ed from Bohaty and Zachos, 2003). The 1.5 m.y. mismatch in the middle Eocene climatic optimum event is discussed in the text. MECO—middle Eocene climatic optimum; VPDB—Vienna Peedee belemnite standard.
Figure 9. Age versus stratigraphic thickness plot with correlation of the Contessa Highway section polarity zonation to the geomagnetic polar-ity time scale (GPTS). Calcareous nannofossil (N) and planktonic foraminiferal (P) datums are used to constrain the interpretation. Planktonic foraminiferal zones are after Berggren et al. (1995); calcareous nannofossil zones are after (NP) Martini (1971) and (CP) Okada and Bukry (1980). MECO—middle Eocene climatic optimum; FO—fi rst occurrence; FCO—fi rst common occurrence; LO—last occurrence.
Jovane et al.
426 Geological Society of America Bulletin, March/April 2007
to values for biogenic calcite precipitated under open-marine conditions during the Paleocene and Eocene (e.g., Bohaty and Zachos, 2003). On the other hand, δ18O values (not shown here) range between −3.5‰ and −0.5‰ and are depleted by ~3‰ relative to diagenetically unaltered marine calcite (Bohaty and Zachos, 2003). We interpret these data to suggest that the oxygen isotopic composition of the measured samples refl ects elevated temperature during burial diagenesis and/or the effects of meteoric diagenesis, while the carbon isotopic composition has been less affected by these processes. It is noteworthy that a global signifi cance of the δ13C signal has been previously inferred in other stratigraphic inter-vals of the Paleogene in the Contessa Highway section (e.g., Corfi eld et al., 1991).
The δ13C curve contains a long positive excur-sion that rises from average values of 1.4‰ at the base of the studied section to a maximum of almost 2‰ at 112 m. Higher-frequency oscilla-tions of ±0.3‰ about an average δ13C value of 1.6‰ characterize the signal above the positive excursion at 112 m. The most notable feature of the δ13C curve is a positive peak that rises by 0.6‰, starting at 133.5 m and peaking at ~138.5 m. After the peak, the δ13C values swing back to average values of ~1.6‰ between 138.5 and 139.5 m.
DISCUSSION
Correlation to the Geomagnetic Polarity Time Scale
We provide here an interpretation of the magnetic polarity pattern of the middle Eocene Scaglia limestones that crop out in the Contessa Highway section, constrained by new analyses of planktic foraminifera and calcareous nannofos-sil assemblages. The geomagnetic polarity time scale (GPTS) used in this study is that of Berg-gren et al. (1995) and Cande and Kent (1995). Our magnetostratigraphic interpretation for the interval between 95 and 139 m is straightforward and provides a direct correlation with the GPTS between the top of chron C21n (46.26 Ma) and chron C18n.2n (39.63–40.13 Ma) (Fig. 9). Most of the recorded bioevents fall on or near the correlation line between our magnetic polarity zonation and the GPTS. Of these events, the LO of Morozovella spp. and Truncorotaloides rohri (P2) do not fall on the magnetostratigraphic correlation line, which might be related to the presence of the fault zone between 139.5 and 140 m. Above 140 m, the FCO of Dictyococcites bisectus (N1) and the FO of Globigerinatheka semiinvoluta (P1) suggest the possibility that the uppermost portion of magnetozone N4 above the fault zone correlates to chron C18n.1n. With this
interpretation, at minimum, subchron C18n.1r (39.55–39.63 Ma) is inferred to be missing in the fault zone between 139.5 and 140 m. The aver-age sedimentation rate for the interval between 135.29 m (base of chron C18n.2n) and 96.08 m (top of chron C21n) is 6.4 m/m.y. (0.64 cm/k.y.). Previous estimates of the sedimentation rate in the Eocene Scaglia Variegata and Scaglia Rossa Formations, as deduced from paleontological dating and the numerical time scale of Harden-bol and Berggren (1978), were of the order of 9 m/m.y. (see Lowrie et al., 1982).
Stable Isotopes and the Middle Eocene Climatic Optimum Event
On the basis of the correlation to the GPTS, the distinct ~0.6‰ increase in bulk δ13C val-ues observed in the middle Eocene of the Con-tessa Highway section occurred from the top of chron C18r through to subchron C18n.2n at ca. 40 Ma (Figs. 9 and 10). The magnitude and duration of the δ13C shift are comparable to the middle Eocene climatic optimum stable isotope anomaly (positive shift of ~0.6‰ and duration of ~600 k.y.), which has been observed in multiple records from the Indian-Atlantic sector of the Southern Ocean and is interpreted as an inter-val of “signifi cant transient warming” (Bohaty and Zachos, 2003). In these records, the age of the middle Eocene climatic optimum event was calculated primarily from calcareous nannofossil datums and was placed at 41.5 Ma. At Maud Rise (Ocean Drilling Program [ODP] Sites 689) and Kerguelen Plateau (ODP sites 738 and 748), the event is associated with the FO of the nannofos-sil Reticulofenestra reticulata (ex Cribrocentrum reticulatum), which occurs just below the middle Eocene climatic optimum event. The 1.5 m.y. mismatch between the middle Eocene climatic optimum event identifi ed in Southern Ocean deep-sea cores and the stable isotope anomaly identifi ed at the Contessa Highway section might refl ect the uncertain calibration of R. reticulata in Southern Ocean sections. Crucially, the Ker-guelen Plateau ODP sites do not have a reliable magnetostratigraphy in the vicinity of the middle Eocene climatic optimum event. The original magnetostratigraphic studies of these sites are unreliable, and a recent reanalysis demonstrated that this interval in ODP Hole 748B was weakly and unstably magnetized (Roberts et al., 2003).
Among the Southern Ocean records, ODP Hole 690B probably has the best middle Eocene magnetostratigraphic record, but this part of the section is riddled with hiatuses (Flo-rindo and Roberts, 2005). There, the FO of R. reticulata occurs just below a normal polarity interval (see Figures 12 and 13 of Florindo and Roberts, 2005), which was interpreted to cor-
relate with chron C19n, although it is also pos-sible that this polarity interval could represent the bottom of C18n.2n.
In Hole 1090B (ODP Leg 177), the FO of R. reticulata occurs near the C18r/C19n reversal (Marino and Flores, 2002). The quality of the inclination data below ~C17n (~345 m below seafl oor [mbsf]), however, is not good, so this might not be the best site from which to calibrate this datum. In Hole 1172A (ODP Leg 189), the FO of R. reticulata occurs between 414.29 and 417.29 mbsf (Wei et al., 2003), just below the base of C18n.2n at 415 mbsf (Stickley et al., 2004). However, it is worth noting that nanno-fossils are sparse below ~415 mbsf and this may not therefore represent the “true” FO of R. retic-ulata. Overall, the Southern Ocean data indicate that the age of the middle Eocene climatic opti-mum event remains poorly calibrated.
CONCLUSIONS
New magnetobiostratigraphic results from the middle Eocene Scaglia limestones of the Contessa Highway section can be directly cor-related to the GPTS from chron C21n through to subchron C18n.1n, corresponding to the time interval between ca. 46.5 and 38.5 Ma (Berg-gren et al., 1995). A signifi cant fault zone occurs in the upper part of the Contessa Highway sec-tion, which has removed, in our interpretation, at least subchron C18n.1r.
Bulk carbon isotope values indicate a distinct increase in bulk δ13C values at the top of chron C18r through to subchron C18n.2n at ca. 40 Ma. This carbon shift is comparable in magnitude and duration to the middle Eocene climatic opti-mum stable isotope anomaly recently observed in multiple records from the Indian-Atlantic sec-tor of the Southern Ocean dated at ca. 41.5 Ma (Bohaty and Zachos, 2003). It is noteworthy that just following the observed stable isotope anom-aly (i.e., the middle Eocene climatic optimum event), a signifi cant biotic turnover in planktonic foraminifera took place with a notable reduction in the acarinid lineage and the extinction of the morozovellids and other muricate species. This might suggest connected causal mechanisms between these events.
Our data from the Contessa Highway section provide the fi rst evidence of the middle Eocene climatic optimum event beyond the Southern Ocean, which suggests a global response of the oceanic carbon cycle to the same forcing and that this forcing was not confi ned to the Indian and Atlantic sector of the Southern Ocean. We suggest that the ~1.5 m.y. mismatch might refl ect signifi cant uncertainty in the calibration of R. reticulata in Southern Ocean sedimentary sequences. Finally, high-frequency rhythms were
The middle Eocene climatic optimum event in the Contessa Highway section
Geological Society of America Bulletin, March/April 2007 427
recognized in our new bed-by-bed lithological profi le of the Scaglia Variegata Formation (with variable bundling of marly limestone–marl cou-plets). The next step is to conduct a detailed investigation to determine whether these cycles were orbitally controlled.
ACKNOWLEDGMENTS
The biostratigraphic study was carried out within the framework of the “Paleogene Integrated Stratig-raphy” (PALIS) project established and sponsored by the Centro di Geobiologia of the University of Urbino. We are grateful to Cristano Collettini for his help on earlier versions of Figure 1 and to Michael Winklhofer for providing software for plotting FORC diagrams. We appreciate the insightful review comments by Wil-liam Lowrie and Associate Editor Don McNeill.
REFERENCES CITED
Backman, J., 1987, Quantitative calcareous nannofossil bio-chronology of middle Eocene through early Oligocene sediments from DSDP Site 522 and 523: Abhandlun-gen der Geologische Bundesanstalt, v. 39, p. 21–31.
Berggren, W.A., Kent, D.V., Swisher, C.C., III, and Aubry, M.-P., 1995, A revised Cenozoic geochronology and chronostratigraphy, in Berggren, W.A., Kent, D.V., Aubry, M.P., and Hardenbol, J., eds., Geochronology, Time Scales and Global Stratigraphic Correlation: A Unifi ed Temporal Framework for a Historical Geol-ogy: Society of Economic Paleontologists and Min-eralogists (SEPM) Special Publication 54, p. 129–212.
Blow, W.H., 1969, Late middle Eocene to Recent plank-tonic foraminiferal biostratigraphy, in Brönniman, P., and Renz, H.H., eds., Proceedings of the 1st Interna-tional Conference on Planktonic Microfossils (Geneva, 1967): Leiden, E.J. Brill, v. 1, p. 199–421.
Blow, W.H., 1979, The Cenozoic Globigerinida: A Study of the Morphology, Taxonomy, Evolutionary Relation-ships and the Stratigraphical Distribution of some Glo-bigerinida (mainly Globigerinacea): Leiden, E.J. Brill, v. 3, p. 1413.
Bohaty, S.M., and Zachos, J.C., 2003, Signifi cant Southern Ocean warming event in the late middle Eocene: Geol-ogy, v. 31, p. 1017–1020, doi: 10.1130/G19800.1.
Bolli, H.M., 1957a, The genera Globigerina and Globoro-talia in the Paleocene–Lower Eocene Lizard Springs Formation of Trinidad: B.W.I: U.S. National Museum Bulletin, v. 215, p. 51–81.
Bolli, H.M., 1957b, Planktonic foraminifera from the Eocene Navet and San Fernando Formations of Trini-dad: B.W.I: U.S. National Museum Bulletin, v. 215, p. 155–172.
Bolli, H.M., 1966, Zonation of Cretaceous to Pliocene marine sediments based on planktonic foraminifera: Boletino Informativo Associacion Venezolana de Geo-logia, Mineria y Petrolio, v. 9, p. 3–32.
Bown, P.R., and Young, J., 1998, Techniques, in Bown, P.R., ed., Calcareous Nannofossil Biostratigraphy: London, Chapman & Hall, p. 16–28.
Cande, S.C., and Kent, D.V., 1995, Revised calibration of the geomagnetic polarity time scale for the late Creta-ceous and Cenozoic: Journal of Geophysical Research, v. 100, p. 6093–6095, doi: 10.1029/94JB03098.
Catanzariti, R., and Perilli, N., 2004, Nannobiohorizons recognised in Eocene Formations from the northern Apennines (Italy): Ina10 Abstracts, Lisbon: Journal of Nannoplankton Research, v. 26, p. 16–17.
Channell, J.E.T., D’Argenio, B., and Horwath, F., 1979, Adria, the African Promontory, in Mesozoic Mediter-ranean Palaeogeography: Earth-Science Review, v. 15, p. 213–292.
Corfi eld, R.M., Cartlidge, J.E., Premoli-Silva, I., and Hous-ley, R.A., 1991, Oxygen and carbon isotope stratigra-phy of the Palaeogene and Cretaceous limestones in the Bottaccione Gorge and the Contessa Highway sections, Umbria, Italy: Terra Nova, v. 3, p. 414–422.
Cresta, S., Monechi, S., and Parisi, G., 1989, Stratigra-fi a del Mesozoico al Cenozoico nell’area Umbro-
Marchigiana: Memorie Descrittive della Carta Geo-logica d’Italia, v. 34, p. 185.
Florindo, F., and Roberts, A.P., 2005, Eocene-Oligocene magnetobiochronology of ODP Sites 689 and 690, Maud Rise, Weddell Sea, Antarctica: Geological Soci-ety of America Bulletin, v. 117, p. 46–66, doi: 10.1130/B25541.1.
Goree, W.S., and Fuller, M., 1976, Magnetometers using RF-driven squids and their applications in rock magne-tism and paleomagnetism: Reviews of Geophysics and Space Physics, v. 1, p. 591–608.
Guerrera, F., Monaco, P., Nocchi, M., Parisi, G., Franchi, R., Vannucci, S., and Giovannini, G., 1988, La Scaglia Variegata Eocenica nella sezione di Monte Cagnero (bacino marchigiano interno): Studio litostratigrafi co, petrografi co e biostratigrafi co: Bollettino Società Geo-logica Italiana, v. 107, p. 81–99.
Hardenbol, J., and Berggren, W.A., 1978, A new Paleogene numerical time scale, in Cohee, G.V., Glaessner, M.F., and Hedberg, H.D., eds., Contributions to the Geologic Time Scale; Studies in Geology: Tulsa, Oklahoma, American Association of Petroleum Geologists, v. 6, p. 213–234.
Kirschvink, J.L., 1980, The least-squares line and plane and the analysis of palaeomagnetic data: Geophysi-cal Journal of the Royal Astronomical Society, v. 62, p. 699–718.
LaBrecque, J.L., Kent, D.V., and Cande, S.C., 1977, Revised magnetic polarity time scale for Late Cretaceous and Cenozoic time: Geology, v. 5, p. 330–335, doi: 10.1130/0091-7613(1977)5<330:RMPTSF>2.0.CO;2.
Lear, C.H., Rosenthal, Y., Coxall, H.K., and Wilson, P.A., 2004, Late Eocene to early Miocene ice sheet dynam-ics and the global carbon cycle: Paleoceanography, v. 19, PA4015, doi: 10.1029/2004PA001039.
Lirer, F., 2000, A new technique for retrieving calcareous microfossils from lithifi ed lime deposits: Micropaleon-tology, v. 46, p. 365–369.
Lowrie, W., Alvarez, W., Napoleone, G., Perch-Nielsen, K., Premoli Silva, I., and Toumarkine, M., 1982, Paleo-gene magnetic stratigraphy in Umbrian pelagic carbon-ate rocks: The Contessa sections, Gubbio: Geological Society of America Bulletin, v. 93, p. 414–432, doi: 10.1130/0016-7606(1982)93<414:PMSIUP>2.0.CO;2.
Lyle, M., Wilson, P.A., Janecek, T.R., et al., 2002, Proceed-ings of the Ocean Drilling Program Initial reports, Volume 199: College Station, Texas, Ocean Drilling Program, http://www-odp.tamu.edu/publications/199_IR/199ir.htm.
Marino, M., and Flores, J.A., 2002, Middle Eocene to early Oligocene calcareous nannofossil stratigraphy at Leg 177 Site 1090: Marine Micropaleontology, v. 45, p. 383–398, doi: 10.1016/S0377-8398(02)00036-1.
Martini, E., 1971, Standard Tertiary and Quaternary calcar-eous nannoplankton zonation, in Farinacci, A., eds., Proceedings of the Second Planktonic Conference, Rome 1970: Rome, Tecnoscienza, v. 2, p. 739–785.
Mattias, P., Farabollini, P., and Montanari, A., 1989, Aspetti minero-petrografi ci della Scaglia Variegata nella serie pelagica della valle della Contessa, presso Gubbio, Umbria orientale: Studi Geologici Camerti, v. 11, p. 7–14.
Miller, K.G., Wright, J.D., and Fairbanks, R.G., 1991, Unlocking the ice house: Oligocene-Miocene oxygen isotopes, eustasy and margin erosion: Journal of Geo-physical Research, v. 96, p. 6829–6848.
Monaco, P., Nocchi, M., and Parisi, G., 1987, Analisi strati-grafi ca e sedimentologica di alcune sequenze pela-giche dell’Umbria sud-orientale dall’Eocene inferiore all’Oligocene inferiore: Bollettino Società Geologica Italiana, v. 106, p. 71–91.
Monechi, S., and Thierstein, H.R., 1985, Late Cretaceous–Eocene nannofossil and magnetostratigraphic correla-tions near Gubbio, Italy: Marine Micropaleontology, v. 9, p. 419–440, doi: 10.1016/0377-8398(85)90009-X.
Montanari, A., Bice, D.M., Capo, R., Coccioni, R., Deino, A., De Paolo, D.J., Emmanuel, L., Monechi, S., Renard, M., and Zevenboom, D., 1997, Integrated stratigraphy of the Chattian to mid-Burdigalian pelagic sequence of the Contessa valley (Gubbio, Italy), in Montanari, A., Odin, G.S., and Coccioni, R., eds., Miocene Stratig-raphy: An Integrated Approach: Amsterdam, Elsevier Sciences, p. 249–277.
Okada, H., and Bukry, D., 1980, Supplementary modifi ca-tion and introduction of code numbers to the low-lati-tude coccolith biostratigraphic zonation (Bukry, 1973, 1975): Marine Micropaleontology, v. 5, p. 321–325, doi: 10.1016/0377-8398(80)90016-X.
Pearson, P.N., and Chaisson, W.P., 1997, Late Paleocene to middle Miocene planktonic foraminifer biostratigra-phy, in Miller, C.M., and Riegel, R.N., et al., Proceed-ings of the Ocean Drilling Program, Scientifi c results, Volume 154: College Station, Texas, Ocean Drilling Program, p. 33–68.
Perch-Nielsen, K., 1985, Mesozoic calcareous nannofossils, in Bolli, H.M., Saunders, J.B., and Perch-Nielsen, K., eds., Plankton Stratigraphy: Cambridge, Cambridge University Press, p. 329–426.
Premoli Silva, I., and Bolli, H.M., 1973, Late Cretaceous to Eocene planktonic foraminifera and stratigraphy of Leg 15 sites in the Caribbean Sea, in Edgar, N.T., Saun-ders, J.B. et al., Initial Reports of the Deep Sea Drilling Project, Volume 15: Washington, D.C., Government Printing Offi ce, p. 449–547.
Premoli Silva, I., Rettori, R., and Verga, D., 2003, Practical Manual of Paleocene and Eocene Planktonic Foramin-ifera: Perugia (Italy), Tipografi a Pontefelcino, 152 p.
Roberts, A.P., Pike, C.R., and Verosub, K.L., 2000, FORC diagrams: A new tool for characterizing the mag-netic properties of natural samples: Journal of Geo-physical Research, v. 105, p. 28,461–28,475, doi: 10.1029/2000JB900326.
Roberts, A.P., Bicknell, S.J., Byatt, J., Bohaty, S.M., Flo-rindo, F., and Harwood, D.M., 2003, Magnetostrati-graphic calibration of Southern Ocean diatom datums from the Eocene–Oligocene of Kerguelen Plateau (Ocean Drilling Program Sites 744 and 748): Palaeo-geography, Palaeoclimatology, Palaeoecology, v. 198, p. 145–168, doi: 10.1016/S0031-0182(03)00397-3.
Shackleton, N.J., and Kennett, J.P., 1975, Paleotemperature history of the Cenozoic and the initiation of Antarc-tic glaciation: Oxygen and carbon isotope analyses in DSDP Sites 277, 279, and 281: Initial Reports of the Deep Sea Drilling Project, Volume 29: Washington, D.C., Government Printing Offi ce, p. 743–755.
Spötl, C., and Vennemann, T.W., 2003, Continuous-fl ow isotope ratio mass spectrometric analysis of carbonate minerals: Rapid Communications in Mass Spectrom-etry, v. 17, p. 1004–1006, doi: 10.1002/rcm.1010.
Stacey, F.D., and Banerjee, S.K., 1974, The Physical Prin-ciples of Rock Magnetism: New York, Elsevier, 195 p.
Stickley, C.E., Brinkhuis, H., McGonigal, K.L., Chaproniere, G.C.H., Fuller, M., Kelly, D.C., Nürnberg, D., Pfuhl, H.A., Schellenberg, S.A., Schoenfeld, J., Suzuki, N., Touchard, Y., Wei, W., Williams, G.L., Lara, J., and Stant, S.A., 2004, Late Cretaceous–Quaternary bio-magnetostratigraphy of ODP Sites 1168, 1170, 1171, and 1172, Tasmanian Gateway, in Exon, N.F., Kennett, J.P., and Malone, M.J., et al., Proceedings of the Ocean Drilling Program, Scientifi c results, Volume 189: http://www-odp.tamu.edu/publications/189_SR/111/111.htm (August 2004).
Van Morkhoven, F.P.C.M., Berggren, W.A., and Edwards, A.S., 1986, Cenozoic cosmopolitan deep-water benthic foraminifera: Bulletin des Centres Recherche Explora-tion—Production Elf-Aquitane Memoir 11, 421 p.
Varol, O., 1998, Paleogene, in Bown, P.R., ed., Calcareous Nannofossil Biostratigraphy: Dordrecht, Kluwer Aca-demic Publishing, p. 201–224.
Verducci, M., and Nocchi, M., 2004, Middle to late Eocene main planktonic foraminiferal events in the Central Mediterranean area (Umbria-Marche basin) related to paleoclimatic changes: Neues Jahrbuch für Geologie und Paläontologie Abhandlungen, v. 234, p. 361–413.
Wei, W., McGonigal, K.L., and Zhong, S., 2003, Data report: Paleogene calcareous nannofossil biostratig-raphy of ODP Leg 189 (Australia-Antarctica Gate-way), in Exon, N.F., Kennett, J.P., Malone, M.J., et al., Proceedings of the Ocean Drilling Program, Sci-entifi c results, Volume 189: http://www-odp.tamu.edu/publications/189_SR/103/103.htm (July 2003).
Zachos, J.C., Pagani, M., Sloan, L., Thomas, E., and Billups, K., 2001, Trends, rhythms, and aberrations in global climate 65 Ma to present: Science, v. 292, p. 686–693, doi: 10.1126/science.1059412.
Zijderveld, J.D.A., 1967, AC demagnetization of rocks: Analysis of results, in Collinson, D.W., ed., Methods in Paleomagnetism: New York, Elsevier Sciences, p. 254–286.
MANUSCRIPT RECEIVED 18 OCTOBER 2005REVISED MANUSCRIPT RECEIVED 30 OCTOBER 2006MANUSCRIPT ACCEPTED 28 NOVEMBER 2006