12
The mineral products industry key facts at a glance

The mineral products industry key facts at a glance

An essential sectorThe mineral products industry’s contribution to the UK
UK Mineral Sales from domestic production
Essential to other industries
Production by productsGB Aggregates Supply Mix 2012
GB Aggregates Market Sources of Supply
Aggregates and Cementitious Sales GB
Ready-mixed concrete and Asphalt Sales GB
Sales of other mineral products
RecyclingPrimary Aggregates and Recycled Materials (GB)
GGBS and Fly Ash in the Cementitious Market
Geographical SupplyGeological distribution and inter-regional movement of aggregates
Aggregates Production (including marine landings) 2011
Access to AggregatesPermitted reserves - England 1993-2009
Permitted reserves - England 1993-2009 - sand and gravel
Replenishment rates
European ComparisonsAggregates Sales per Capita
Cement Consumption per Capita
Responsibly SourcedSuccess on sustainability
1 The mineral products industry’s contribution to the UK
annual production
annual industry turnover
turnover of industries we supply
the value of construction, our main customer
people employed by the industry
people directly employed by those we supply
Contents
2
3
4
5
6
8
7
7
3
The Mineral Products Association is the trade association for the aggregates, asphalt, cement, concrete, dimension stone, lime, mortar and silica sand industries.

The mineral products sector is a key enabling sector of the UK economy which has a broad impact on overall economic activity. As the largest element of the construction supply chain, a supplier of key materials to many other industries, and the largest material flow in the UK economy, a healthy indigenous mineral products industry is essential for the UK.
UK use of mineral products is based very largely on UK supply. Aggregates imports account for no more than three per cent of the UK markets and the average delivery distance is around 30 miles. 90 per cent of the cement market is supplied from UK sources.
90 per cent of industry output is used in the UK construction industry - improving our housing stock, transport networks, commercial and industrial buildings, utilities, schools and hospitals - and non construction markets include iron and steel manufacture, glass making, agriculture, cleaning power station emissions and pharmaceuticals.
An essential sector
Aggregates Minerals 225m tonnes
Natural Gas 55m tonnes
Crude Oil 58m tonnes
Coal 19m tonnes
Other Minerals 23m tonnes
UK Mineral Sales from domestic productionSource: BGS, UK Minerals Yearbook 2011.
Essential to other industriesMinerals such as sand and limestone are essential for activities as varied as glass manufacture, iron and steel making, agriculture, emissions cleaning and making washing powder and toothpaste.
Resources Products Uses
1
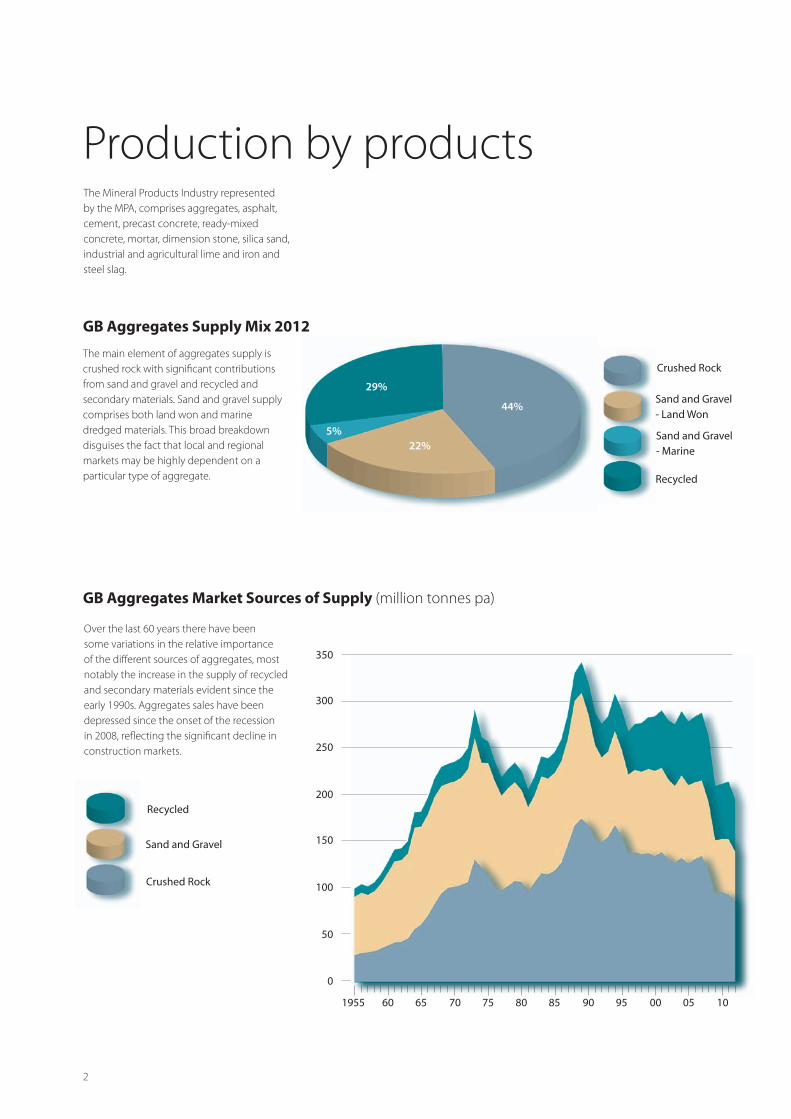
The Mineral Products Industry represented by the MPA, comprises aggregates, asphalt, cement, precast concrete, ready-mixed concrete, mortar, dimension stone, silica sand, industrial and agricultural lime and iron and steel slag.
The main element of aggregates supply is crushed rock with significant contributions from sand and gravel and recycled and secondary materials. Sand and gravel supply comprises both land won and marine dredged materials. This broad breakdown disguises the fact that local and regional markets may be highly dependent on a particular type of aggregate.
Production by products
Over the last 60 years there have been some variations in the relative importance of the different sources of aggregates, most notably the increase in the supply of recycled and secondary materials evident since the early 1990s. Aggregates sales have been depressed since the onset of the recession in 2008, reflecting the significant decline in construction markets.
GB Aggregates Supply Mix 2012
44%
22%
29%
5%
GB Aggregates Market Sources of Supply (million tonnes pa)
Crushed Rock
Sand and Gravel- Land Won
Sand and Gravel - Marine
Recycled
0
50
100
150
200
250
300
350
1955 60 65 70 75 80 85 90 95 00 05 10
Recycled
Sand and Gravel
Crushed Rock
2

The following chart also indicates the reduction in sales of cementitious materials in recent years following stable markets in the early and mid 2000s.
Aggregates and Cementitious Sales GB (million tonnes pa)
Aggregates (left hand axis)
Cementitious (right hand axis)
0
50
100
150
200
250
300
2002 2003 2004 2005 2006 2007 2008 2009 2010 2011 20120.0
2.0
4.0
6.0
8.0
10.0
14.0
12.0
16.0
18.0
Ready-mixed concrete (million cu metres) and Asphalt (million tonnes) Sales GB
2002 2003 2004 2005 2006 2007 2008 2009 2010 2011 2012
30.0
0.0
25.0
20.0
15.0
10.0
5.0
Ready-mixed Concrete
Asphalt
3
Sales of other mineral products
Mortar
Precast Concrete
Dimension stone
Agricultural lime
Industrial lime
Silica sand
Cement and cementitiousmaterials
2.5 million tonnes
25 million tonnes
2 million tonnes
2 million tonnes
2 million tonnes
4 million tonnes
10.5 million tonnes
The markets for two of the principal value added sector products, ready-mixed concrete and asphalt, follow the same pattern in recent years. Ready-mixed concrete is used throughout the construction industry and therefore is an indicator of general construction activity. Asphalt is used largely for road maintenance and construction and these markets declined very steeply in 2012.

Recycled and secondary materials now account for 29 per cent of the GB aggregates market. They include construction and demolition waste, asphalt planings, used railway ballast, iron and steel slag, waste glass, incinerator and furnace bottom ash and waste from extractive activities such as china clay and slate. Sales have increased significantly both in absolute terms and as a proportion of the overall aggregates market since the early 1990s. The share of recycled and secondary materials in GB is the highest in Europe - 29 per cent compared with the European average of 10 per cent.
The share of ground granulated blast furnace slag (ggbs) and fly ash in the total cementitious market has increased in recent years. These materials are supplied either as components of blended cements or directly to concrete manufacturing facilities.
RecyclingPrimary Aggregates and Recycled Materials (GB)
350
50
300
250
200
150
100
01980 1985 1990 1995 2000 2005 2010
GGBS and Fly Ash in the Cementitious Market
2009 2010 20112005 2006 2007 2008
Tonn
esm
illio
n to
nnes
Primary aggregatesRecycled materials
Total cementitious
GGBS and Fly Ash contribution
4
16,000,000
2,000,000
12,000,000
10,000,000
8,000,000
6,000,000
4,000,000
0
14,000,000
18,000,000
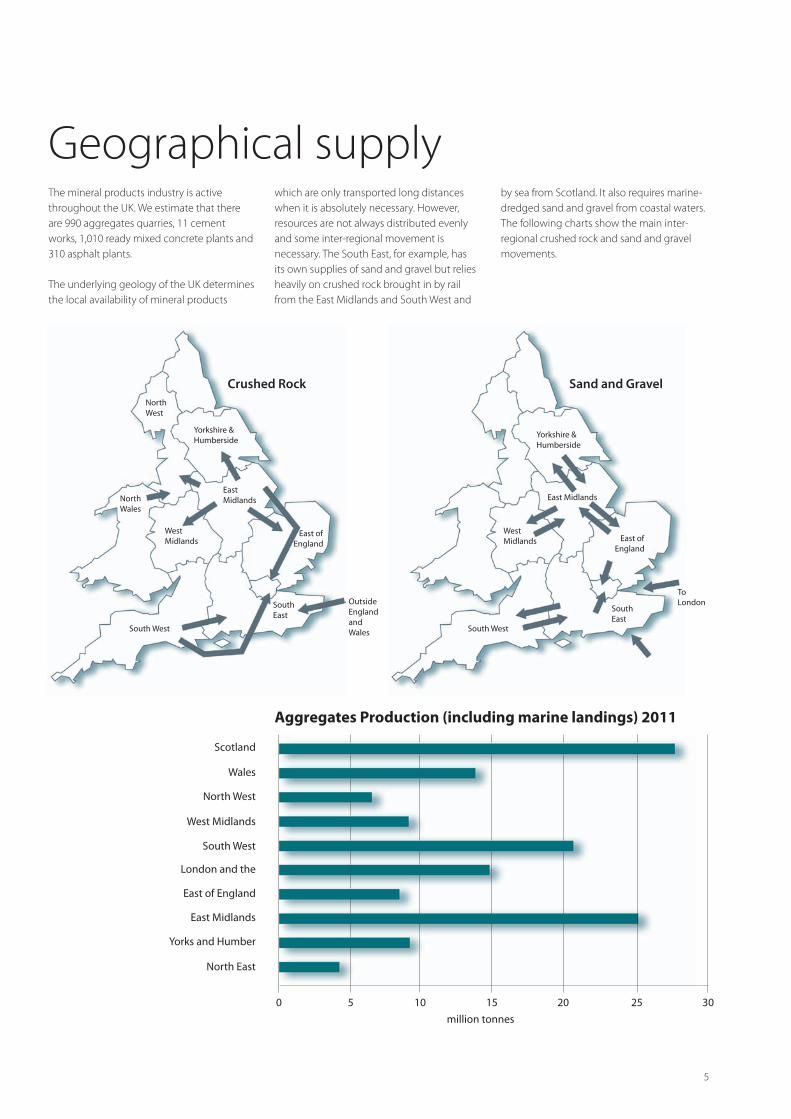
The mineral products industry is active throughout the UK. We estimate that there are 990 aggregates quarries, 11 cement works, 1,010 ready mixed concrete plants and 310 asphalt plants.
The underlying geology of the UK determines the local availability of mineral products
Geographical supply
Aggregates Production (including marine landings) 2011
Scotland
Wales
North West
West Midlands
South West
London and the
East of England
East Midlands
Yorks and Humber
North East
0 5 10 15 20 25 30million tonnes
5
Yorkshire & Humberside
East Midlands
West Midlands
South West
SouthEast
East of England
To London
NorthWales
NorthWest
Yorkshire & Humberside
East Midlands
West Midlands
South West
SouthEast
East of England
Outside England and Wales
which are only transported long distances when it is absolutely necessary. However, resources are not always distributed evenly and some inter-regional movement is necessary. The South East, for example, has its own supplies of sand and gravel but relies heavily on crushed rock brought in by rail from the East Midlands and South West and
by sea from Scotland. It also requires marine-dredged sand and gravel from coastal waters. The following charts show the main inter-regional crushed rock and sand and gravel movements.
Crushed Rock Sand and Gravel

Subject to the geological conditions, a key factor influencing the supply of aggregates is the operation of the mineral planning system. In England, the managed aggregates supply system is designed to ensure a steady and adequate supply of aggregates. The chart below indicates nominal reserves of aggregates since the early 1990s.
A particular feature has been the significant decline in permitted reserves of sand and gravel over the last 15 years.
Access to aggregates the mineral planning system
mill
ion
tonn
es
1997 1998 1999 2000 2001 2002 20031993 1994 1995 1996 2004 2005 2006 2007 2008 2009
mill
ion
tonn
es
0
100
200
300
400
500
600
700
800
900
1000Lost 40% since 1995
Permitted reserves - England 1993-2009 - sand and gravel - BGS
Permitted reserves - England 1993-2009 - BGS
1997 1998 1999 2000 2001 2002 20031993 1994 1995 1996 2004 2005 2006 2007 2008 2009
Total
Hard rock for aggregates use
Land-won Sand and Gravel
1000
2000
3000
4000
5000
0
6000
6
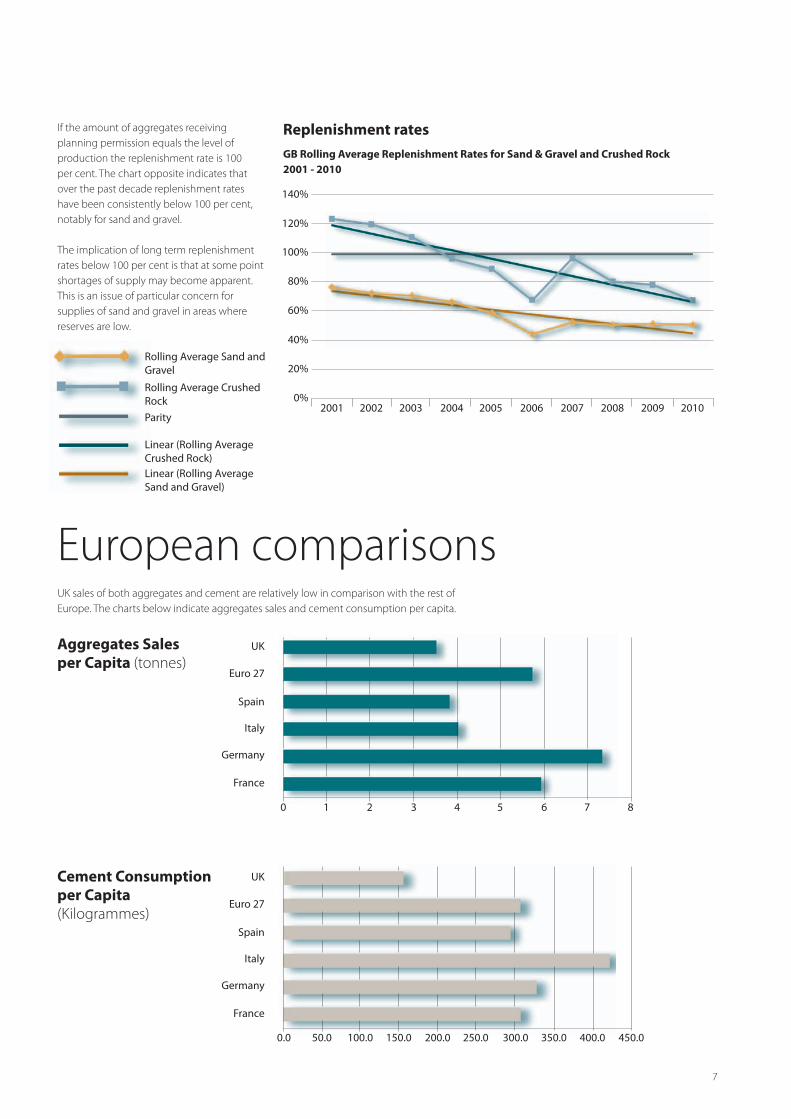
If the amount of aggregates receiving planning permission equals the level of production the replenishment rate is 100 per cent. The chart opposite indicates that over the past decade replenishment rates have been consistently below 100 per cent, notably for sand and gravel.
The implication of long term replenishment rates below 100 per cent is that at some point shortages of supply may become apparent. This is an issue of particular concern for supplies of sand and gravel in areas where reserves are low.
European comparisons
Replenishment rates
2001 2002 2003 2004 2005 2006 2010200920082007
140%
120%
100%
80%
60%
40%
20%
0%
GB Rolling Average Replenishment Rates for Sand & Gravel and Crushed Rock 2001 - 2010
Rolling Average Sand and Gravel
Rolling Average Crushed RockParity
Linear (Rolling Average Sand and Gravel)
Linear (Rolling Average Crushed Rock)
UK sales of both aggregates and cement are relatively low in comparison with the rest of Europe. The charts below indicate aggregates sales and cement consumption per capita.
UK
Euro 27
Spain
Italy
Germany
France
Cement Consumption per Capita (Kilogrammes)
UK
Euro 27
Spain
Italy
Germany
France
Aggregates Sales per Capita (tonnes)
0 1 2 3 4 5 6 7 8
0.0 50.0 100.0 150.0 200.0
7
250.0 300.0 350.0 400.0 450.0

Success on sustainability
MPA members’ latest health and safety objective - to halve lost time injuries in the five years to 2014 - has been achieved nearly two years ahead of target
The European leader at 29 per cent of the market
Use of aggregates and cement: per capita 35 per cent and 60 per cent respectively below the European average
40 per cent of fuel (thermal requirement) used by the cement industry and 29 per cent of fuel used by the (dolomitic) lime industry is derived from waste materials
The cement industry recorded a 55 per cent reduction in absolute CO
2 emissions
between 1990 and 2011 and is the first cement industry in the world to publish a greenhouse gas reduction strategy to 2050
Structural use of mineral products can significantly reduce emissions over the life of buildings
Making a significant contribution to UK targets and uniquely placed to do more
Over 700 have their origins in mineral extraction
One million planted over the past five years
Links to Sustainability Development Reports
Responsibly Sourced
1 Standard purity stated for lime (94.5%) is sourced
from the EU Commission Decision of 27 April 2011
“determining transitional Union-wide rules for
harmonised free allocation of emission allowances
pursuant to Article 10a of Directive 2003/87/EC of
the European Parliament and of the Council”, Page
37 Available: http://eur-lex.europa.eu/LexUriServ/
LexUriServ.do?uri=OJ:L:2011:130:0001:0045:EN:PDF
2 Environment Agency’s Compliance Classification
Scheme (CCS):
Category 1 incident defined as “a non-compliance
which would have the potential to have a major
environmental impact”.
Category 2 incident defined as “a non-compliance
which would have the potential to have a
significant environmental impact”.
Category 3 incident defined as “a non-compliance
which would have the potential to have a minor
environmental impact”.
Category 4 incident defined as “a non-compliance
which has no potential to have an environmental
impact”.
Available: http://www.environment-agency.gov.uk/
business/regulation/31825.aspx
3 Dolomite includes the three products: Ultra Low
Carbon Dolime, Dolime and Sintered Dolime
NOtES
bla british lime association Mineral Products Association
British Lime Association
Sustainable Development Report 2011
LiME PLANtSBLA members
Buxton Lime and Cement
Buxton
Melton Ross
Batts Combe
Thrislington
Whitwell
Tunstead
Hindlow
Factory/Site Owner Location
4
4
1
1
2
2
3
3
5
5
6
6
7
7
Birmingham
Shapfell
Norwich
Norfolk
Notts
Suffolk
Factory/Site Owner Location
11
118 8
9
9
10
10
12
12
13
13
Lime can be used to:
Waste minimisation
Environmental management
Community engagementBLA MembersLhoist UKSingleton Birch LtdSteetley Dolomite LtdTarmac Buxton Lime and Cement
BLA Associate MembersBritish Sugar plcSpecialty MineralsTata Steel
Total production 1.6 million tonnes
Production Sites 13
Total direct employees and full-time contractors 638
KEy FACtS AND FigURES FOR 2011
Waste sent to landfill has decreased by 94% since 2005. this dramatic and very positive result is a consequence of the lime industry’s commitment to the reuse of waste or recycling of waste material for alternative uses. Mineral waste may be used as a backfill material as part of a quarry restoration programme, put back into the process or utilised to manufacture specific products.
BLA members welcomed 360 visitors to their production sites in 2011. there were also 16 community liaison meetings attended by both operators and the Environment Agency. Site operators benefit from this opportunity to engage with local stakeholders, residents and regulators and therefore sustain their positive relationship with local communities.
0
200
400
600
800
1000
1200
kgC
O2/t
on
ne
hig
h c
alci
um
lim
e
2005
Combustion of CO2 per
tonne of high calcium lime manufactured at standard purity
Process CO2 per tonne
of high calcium limemanufactured at standard purity
2011
Year
kgC
O2/t
on
ne
hig
h c
alci
um
lim
e
2005 2011
Year
kgC
O2/t
on
ne
hig
h c
alci
um
lim
e
2005 2011
Year
kgC
O2/t
on
ne
hig
h c
alci
um
lim
e
2005 2011
Year
kgC
O2/t
on
ne
do
lom
ite
2005 2011
Year
kgC
O2/t
on
ne
do
lom
ite
2005 2011
Year
kgC
O2/t
on
ne
do
lom
ite
2005 2011
Year
kgC
O2/t
on
ne
do
lom
ite
2005 2011
Year
0
300
600
900
1200
1500
0.0
0.1
0.2
0.3
0.4
0.5
0.6
0.7
0.8
0.00
0.05
0.10
0.15
0.20
0.25
0.30
0.00
0.02
0.04
0.06
0.08
0.10
0
3
6
9
12
15
0
1
2
3
4
5
6
7
8
0.0
0.5
1.0
1.5
2.0
2.5
0
3
6
9
12
15
0
5
10
15
20
Combustion CO2
Process CO2
Category 4
Category 311%
8%8%
78%
39%20%
77% kgC
O2/t
on
ne
do
lom
ite
2005 2011
Year
Nu
mb
er
2005 2011Year
94%
60%
0
200
400
600
800
1000
1200
kgC
O2/t
on
ne
hig
h c
alci
um
lim
e
2005
Combustion of CO2 per
tonne of high calcium lime manufactured at standard purity
Process CO2 per tonne
of high calcium limemanufactured at standard purity
2011
Year
kgC
O2/t
on
ne
hig
h c
alci
um
lim
e
2005 2011
Year
kgC
O2/t
on
ne
hig
h c
alci
um
lim
e
2005 2011
Year
kgC
O2/t
on
ne
hig
h c
alci
um
lim
e
2005 2011
Year
kgC
O2/t
on
ne
do
lom
ite
2005 2011
Year
kgC
O2/t
on
ne
do
lom
ite
2005 2011
Year
kgC
O2/t
on
ne
do
lom
ite
2005 2011
Year
kgC
O2/t
on
ne
do
lom
ite
2005 2011
Year
0
300
600
900
1200
1500
0.0
0.1
0.2
0.3
0.4
0.5
0.6
0.7
0.8
0.00
0.05
0.10
0.15
0.20
0.25
0.30
0.00
0.02
0.04
0.06
0.08
0.10
0
3
6
9
12
15
0
1
2
3
4
5
6
7
8
0.0
0.5
1.0
1.5
2.0
2.5
0
3
6
9
12
15
0
5
10
15
20
Combustion CO2
Process CO2
Category 4
Category 311%
8%8%
78%
39%20%
77% kgC
O2/t
on
ne
do
lom
ite
2005 2011
Year
Nu
mb
er
2005 2011Year
94%
60%
Total waste disposed to landfill per tonne lime manufactured
Number of Category 3 and 4 Environmental Incidents
All of the BLA member’s production sites operate to an iSO 14001 certified Environmental Management System (EMS). the industry is also regulated by the Environment Agency, who issue permits for each lime producer. the permits ensure any environmental impacts from lime production are minimised, in accordance with the Environment Agency’s Compliance Classification Scheme2. this scheme provides classifications for any environmental incidents that occur and result in records of non-compliance with a permit. in 2011, there were no category 1 and 2 incidents, two category 32 and six category 42 incidents. this resulted in a 60% decrease in environmental incidents since 2005. Notably, there were no formal cautions, enforcement notices or environmental prosecutions in 2011.
ENViRONMENtAL iMPROVEMENtS
Purify sugar
Produce toothpaste
Make an additive for engine oil
Control water pH in fish farming
Produce chicken feed
Make tap water safe to drink
Keep fruit fresh
Clean gasses produced by Energy from Waste plants
British Lime Associationgillingham House 38 - 44 gillingham StreetLondon SW1V 1HUtel +44 (0)20 7963 8000 Fax +44 (0)20 7963 [email protected] www.britishlime.org
© Mineral Products Association 2012
BLA is part of the Mineral Products Association, the trade association for the aggregates, asphalt, cement, concrete, dimension stone, lime, mortar and silica sand industries.
Associate members
DiD yOU KNOW?
Strength from the depths
bmapa british marine aggregate producers association Mineral Products Association
Sixth sustainable development report for the British marine aggregate industry
December 2012
Mineral Products Associationmpa cement
MPA CementSustainable Development Report 2011
Mineral Products Association
Progress and challenges . . . continuing to deliver Summary Sustainable Development Report 2012
Concrete IndustrySustainability Performance
Report5th report: 2011 performance data
8
http://www.mineralproducts.org/sustainability/reports.html

Mineral Products AssociationGillingham House38 - 44 Gillingham StreetLondon SW1V 1HUTel +44 (0)20 7963 8000Fax +44 (0)20 7963 8001email [email protected]
© Mineral Products Association 2013
The Mineral Products Association is the trade association for the aggregates, asphalt, cement, concrete, dimension stone, lime, mortar and silica sand industries.


