Kitt Carpenter (Vanderbilt and NBER) Carlos Dobkin (UC Santa Cruz and NBER) McGill 10-21-2015 We thank NIH/NIAAA for financial support R01-AA017302-01. The Minimum Legal Drinking Age and Morbidity in the US
Transcript
Kitt Carpenter (Vanderbilt and NBER)Carlos Dobkin (UC Santa Cruz and NBER)
McGill 10-21-2015
We thank NIH/NIAAA for financial support R01-AA017302-01.
The Minimum Legal Drinking Age and Morbidity in the US
The Underage Drinking Problem
• Huge public health concern about underage drinking: it is estimated to “cost” society $53 billion annually.– Mortality, morbidity, crime, risky sex, etc.
• Unique to drinking (vs. tobacco or drug use) b/c:– Pharmacological profile– Trends
Alcohol pharmacology• 1-2 drinks for 180lb male, no time in between <0.05
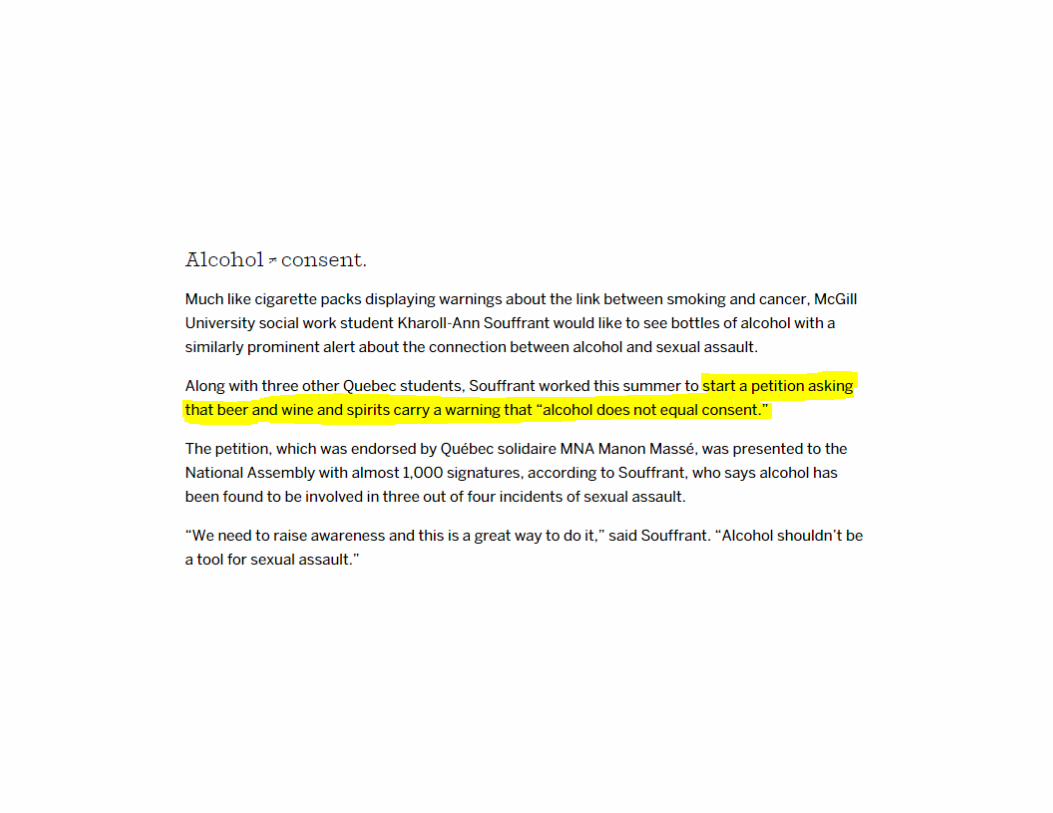
Huge concern on college campuses; universities responding:
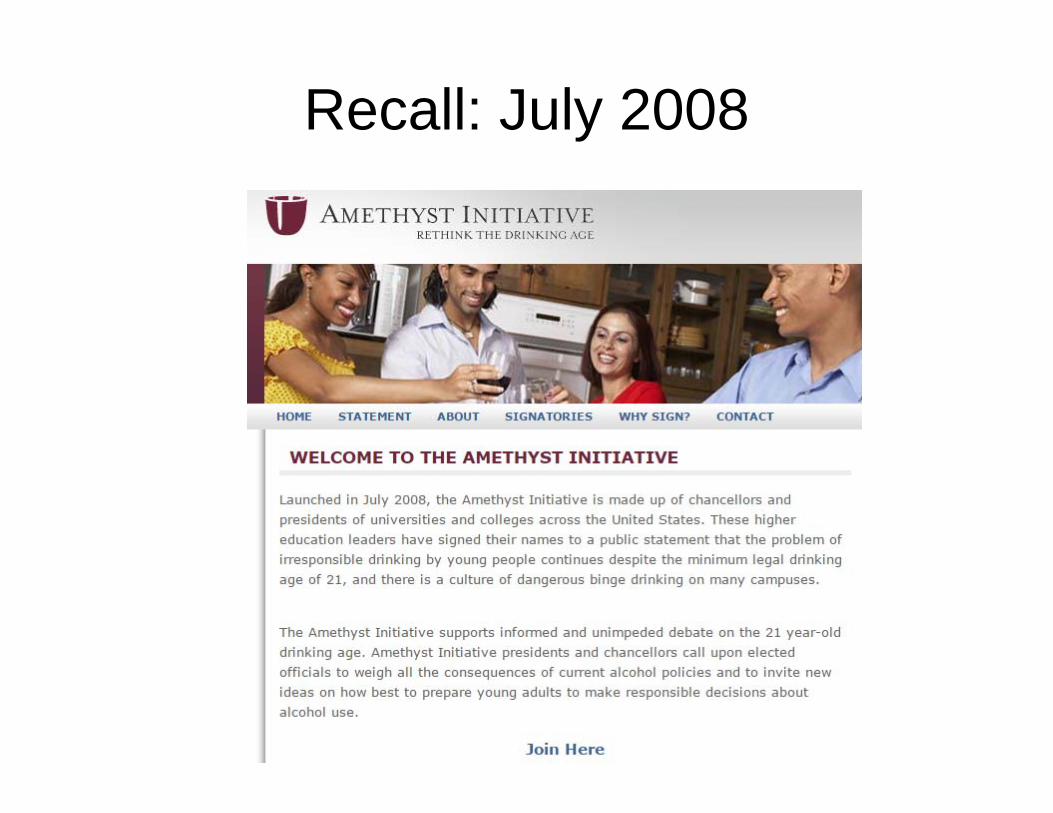
Recall: July 2008
Challenges of public health view
• People like drinking (‘pleasure cost’)– But: brain maturation, paternalism, etc.
• It’s unclear how much of the ‘costs’ (e.g., mortality, morbidity, crime, etc.) are truly causedby alcohol use.
• What if it’s just correlated unobserved factors?– (Unobserved) discount rates?– (Unobserved) taste for deviance?
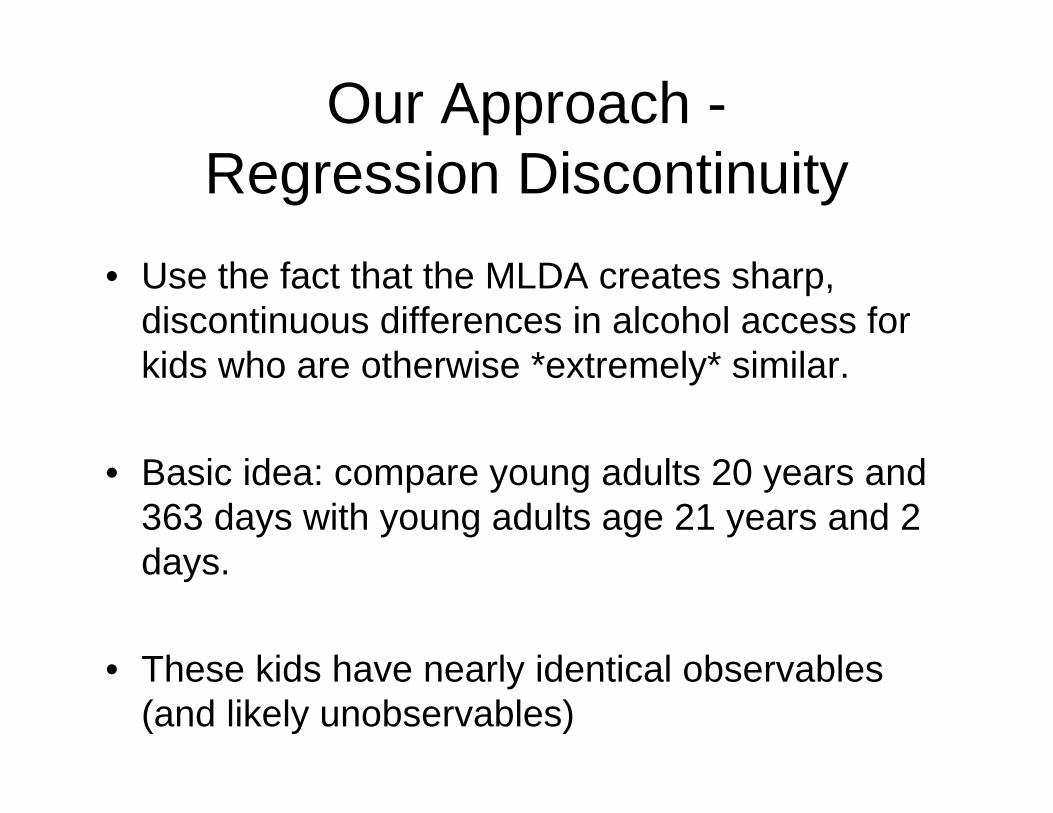
Our Approach -Regression Discontinuity
• Use the fact that the MLDA creates sharp, discontinuous differences in alcohol access for kids who are otherwise *extremely* similar.
• Basic idea: compare young adults 20 years and 363 days with young adults age 21 years and 2 days.
• These kids have nearly identical observables (and likely unobservables)
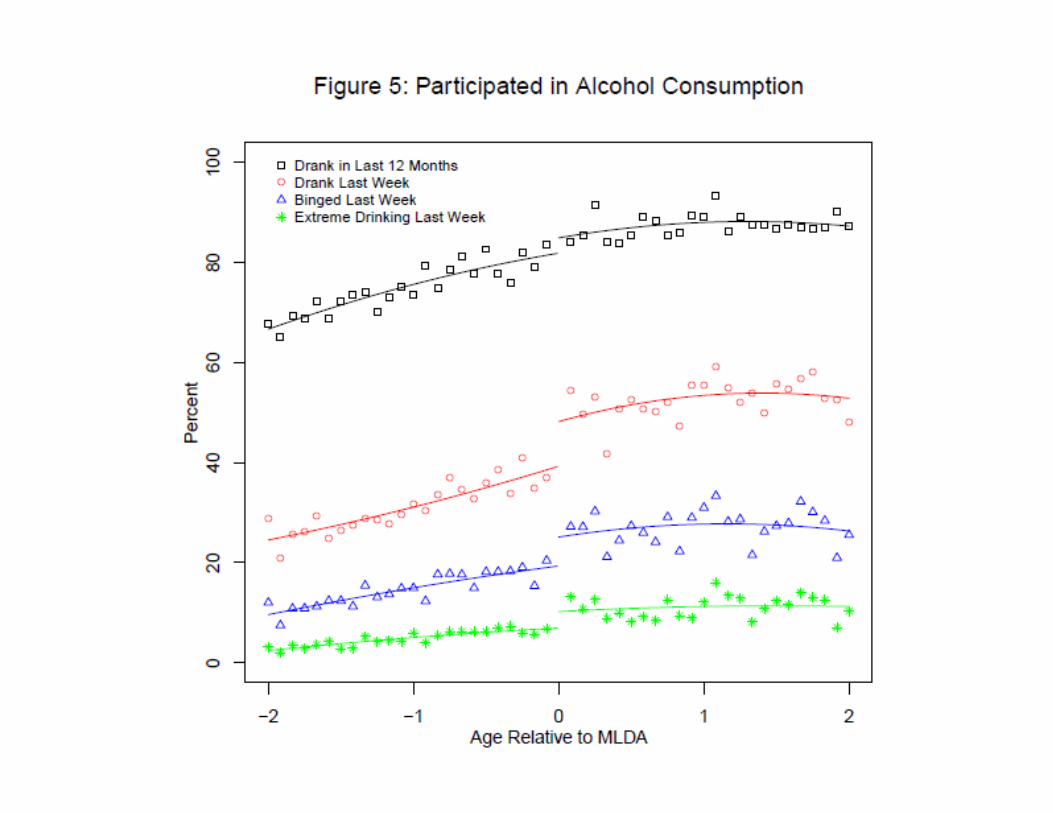
Alcohol Consumption(from surveys)
Mortality(from death certificate records)
Age Profile of Mortality Rates: Death Certificates 1997-2004
0
20
40
60
80
100
120
19 19.5 20 20.5 21 21.5 22 22.5 23
Age
Dea
ths
per 1
00,0
00 P
erso
n-Y
ears
All All FittedInternal Internal FittedExternal External Fitted
Age Profile of Mortality Rates by External Cause Death Certificates 1997-2004
0
5
10
15
20
25
30
35
40
19 19.5 20 20.5 21 21.5 22 22.5 23
Age
Dea
th R
ate
per 1
00,0
00 Alcohol Alcohol FittedHomicide Homicide FittedSuicide Suicide FittedMVA MVA FittedDrugs Drugs FittedExternal Other External Other Fitted
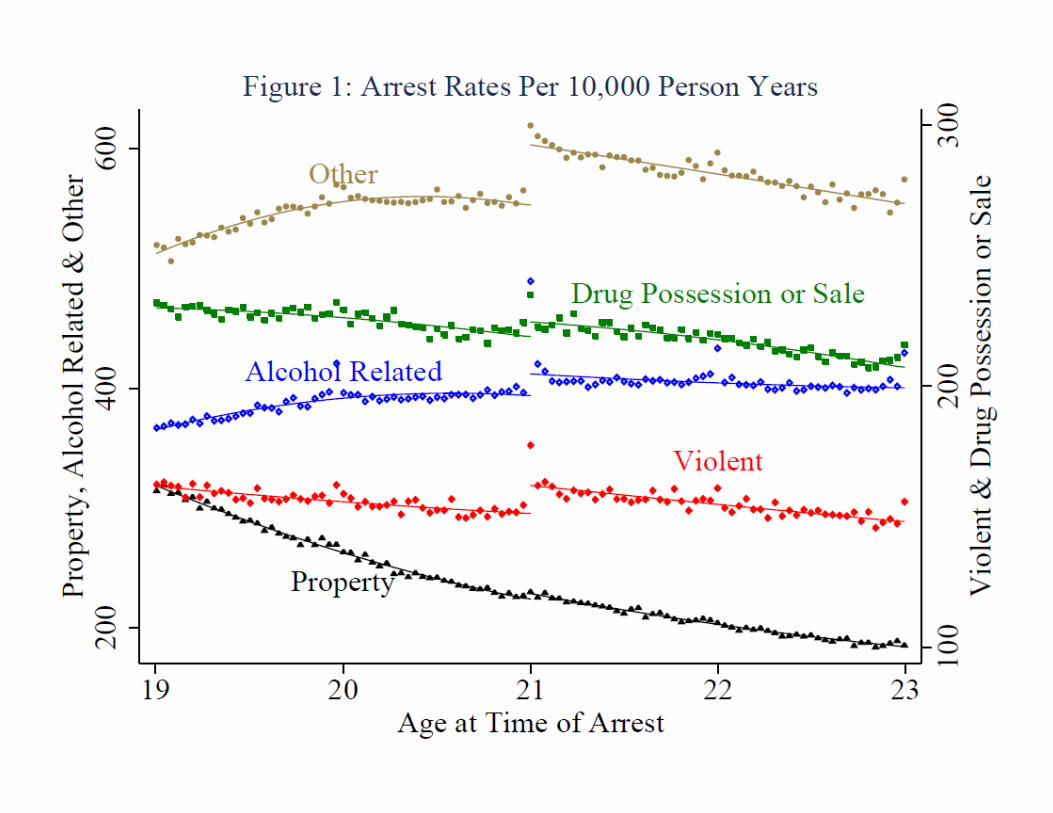
Crime(from arrest records)
Morbidity(from hospital records)
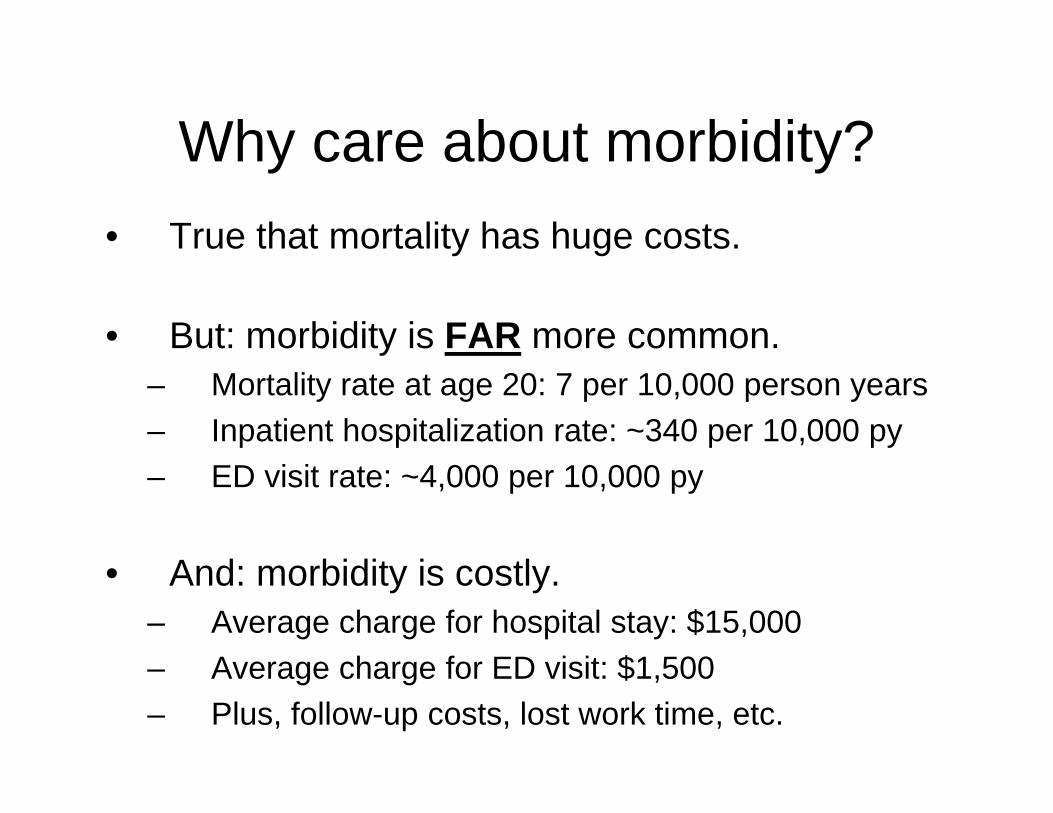
Why care about morbidity?• True that mortality has huge costs.
• But: morbidity is FAR more common.– Mortality rate at age 20: 7 per 10,000 person years– Inpatient hospitalization rate: ~340 per 10,000 py– ED visit rate: ~4,000 per 10,000 py
• And: morbidity is costly.– Average charge for hospital stay: $15,000– Average charge for ED visit: $1,500– Plus, follow-up costs, lost work time, etc.
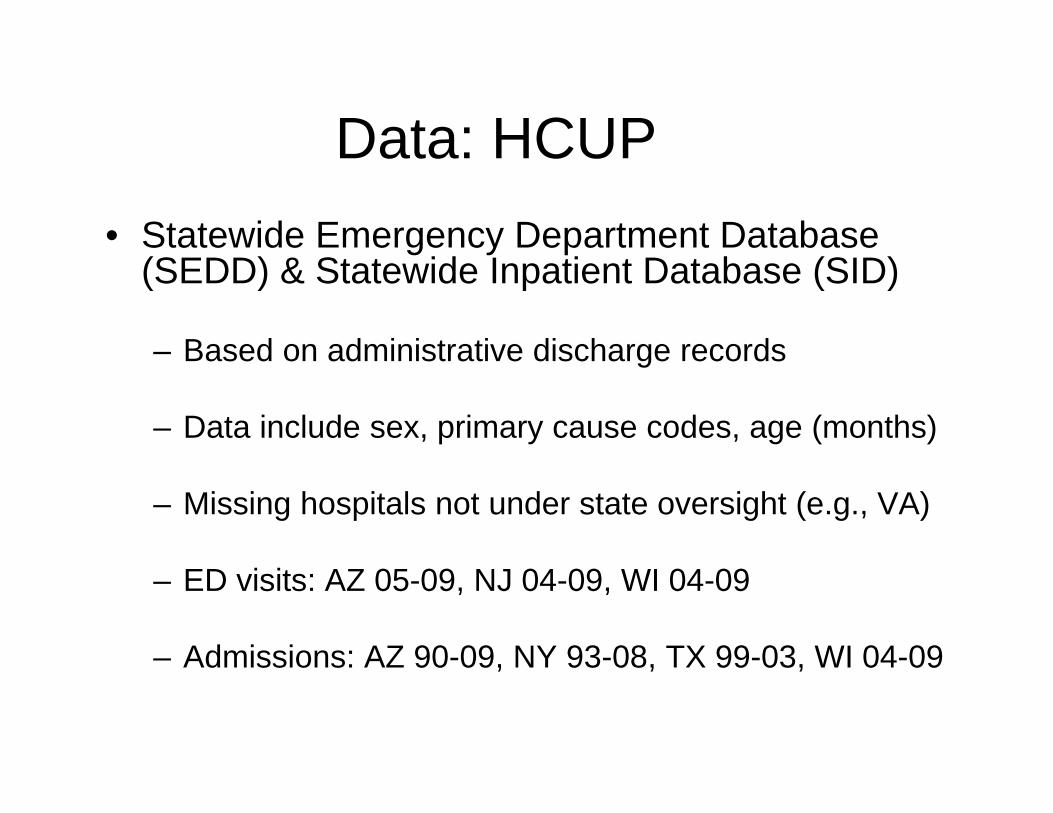
Data: HCUP• Statewide Emergency Department Database
(SEDD) & Statewide Inpatient Database (SID)
– Based on administrative discharge records
– Data include sex, primary cause codes, age (months)
– Missing hospitals not under state oversight (e.g., VA)
– ED visits: AZ 05-09, NJ 04-09, WI 04-09
– Admissions: AZ 90-09, NY 93-08, TX 99-03, WI 04-09
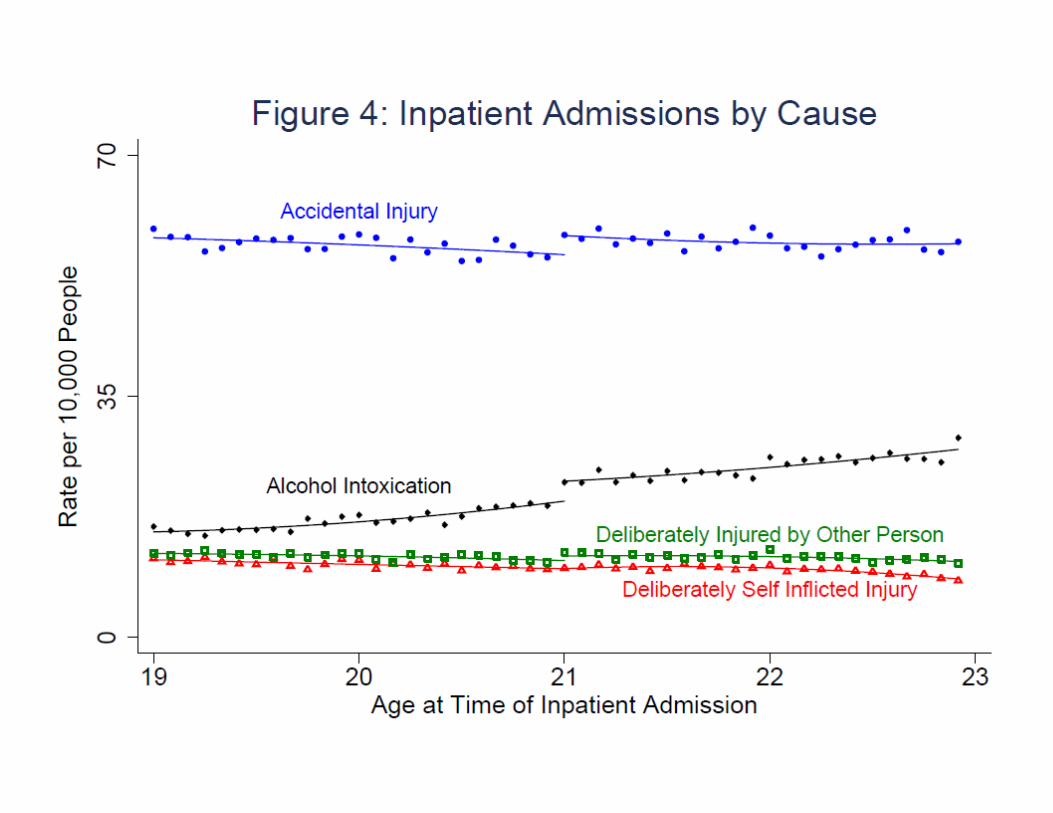
How we code causes
• Primary cause code, precedence:– Alcohol intoxication– Injuries [self-inflicted, inflicted by others,
accidental]– Residual: ‘illness’
• We exclude pregnancy-related visits (over half of admissions in this age range)
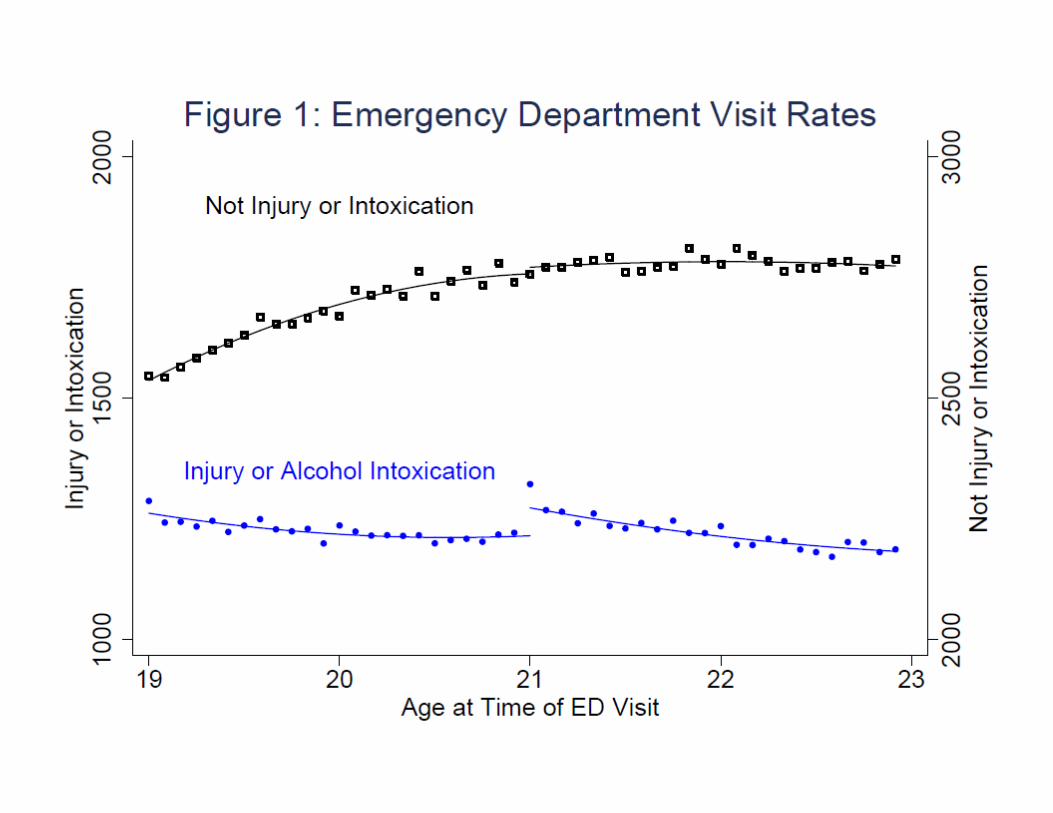
ED visit results
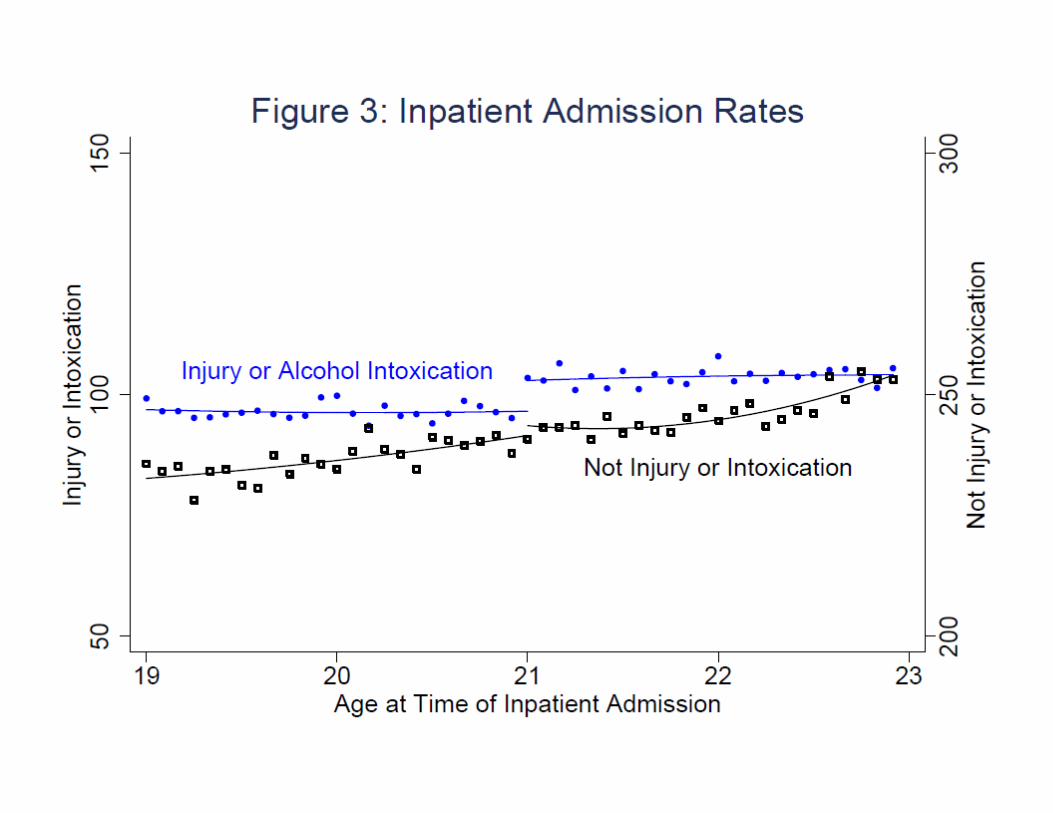
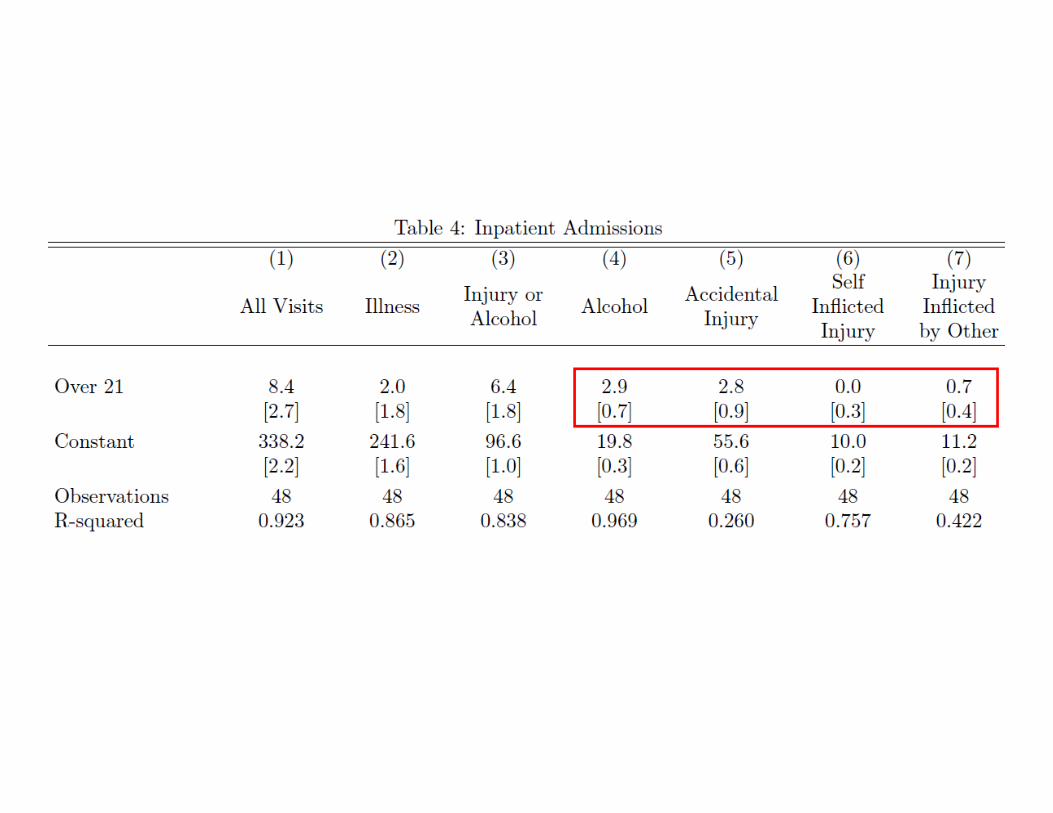
Inpatient stays results
Interpreting Magnitudes• RD effects on mortality, hospitalization, and ED visits
measured as increases at age 21 per 10,000 person-years: 0.8, 8.4, and 71.3.
• RD effects on mortality, hospitalization, and ED visits measured as a proportion of the age-20 rate for each outcome: 10%, 2.5%, 1.8%.
• People are making disproportionately extreme errors at the MLDA (i.e., deaths)
• Effects of MLDA-induced drinking on adverse health events are highly nonlinear
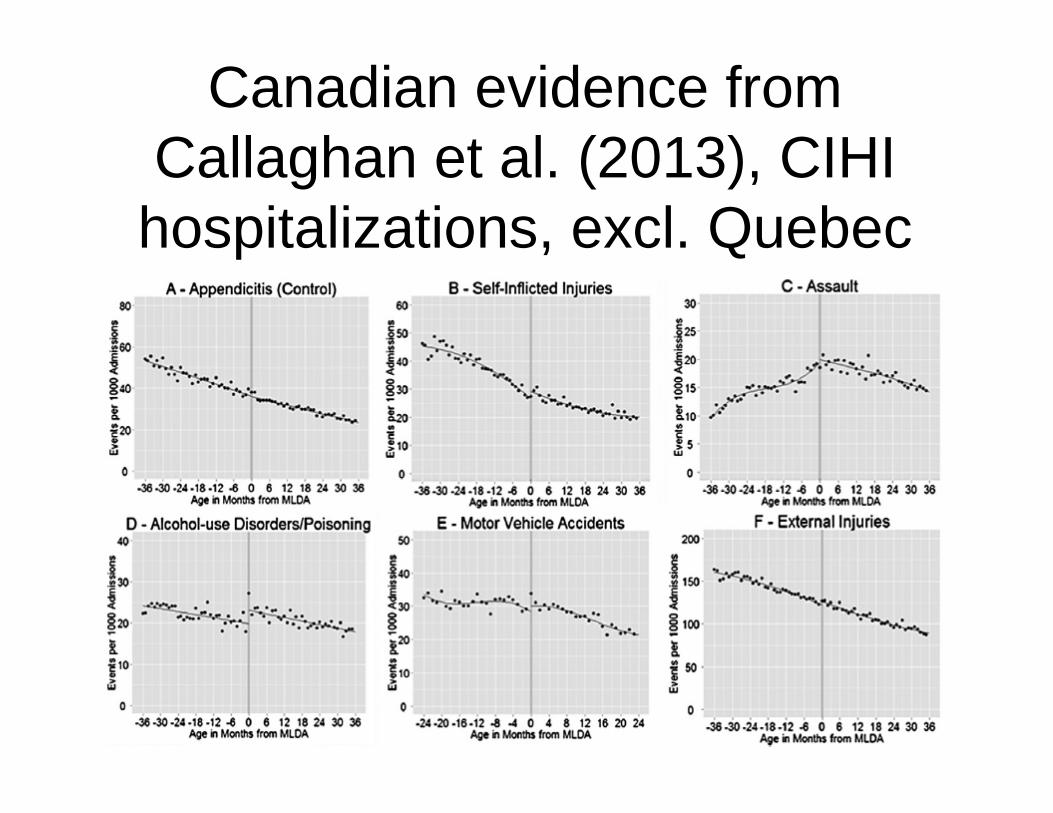
Canadian evidence from Callaghan et al. (2013), CIHI
hospitalizations, excl. Quebec
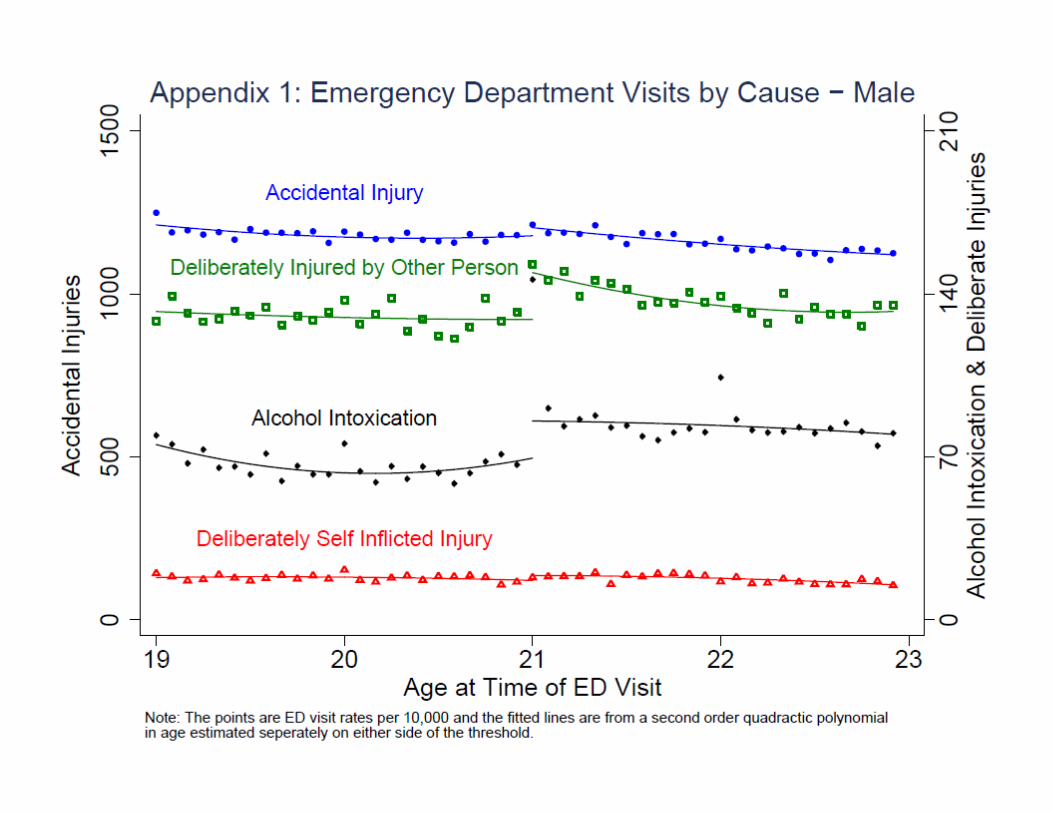
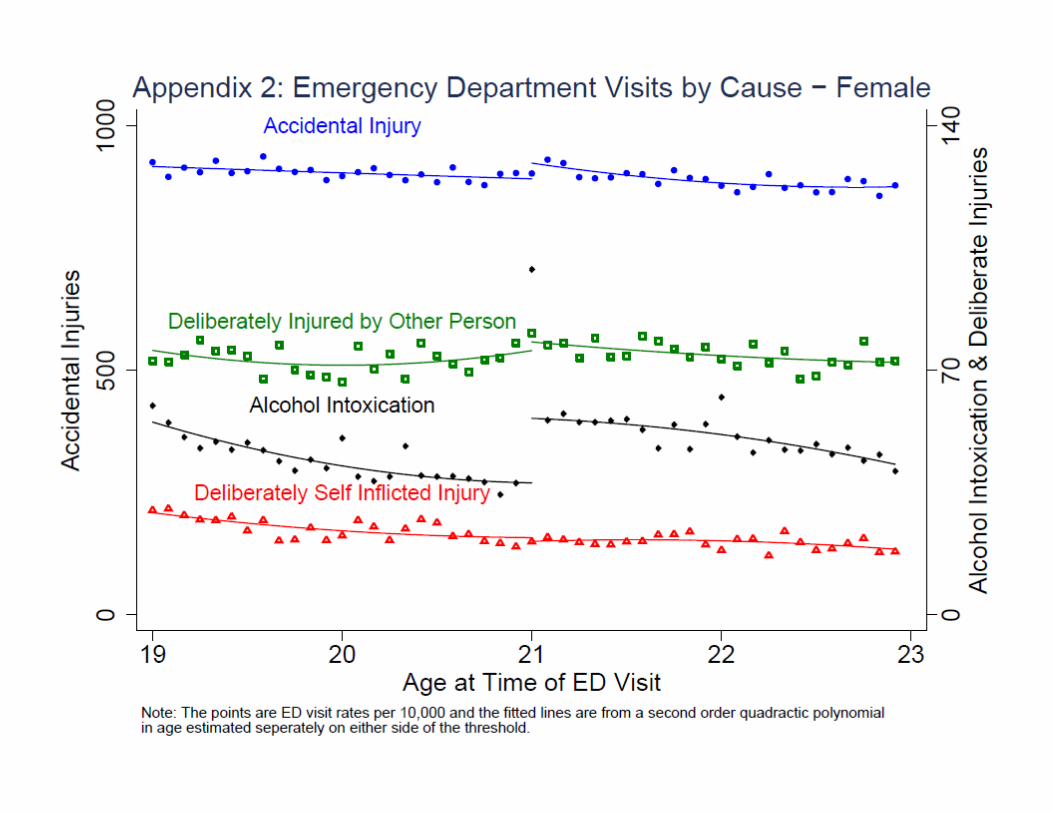
ED Results, by gender
Conclusion• MLDA-induced increases in drinking cause significant
increases in hospitalizations and ED visits
• These effects are larger for males (similar to mortality, crime, and extreme drinking) and are driven by increases in alcohol overdoses, accidental injuries, and injuries inflicted by others (violent victimization)
• The social costs of youth drinking are larger than previously thought