The moderating role of perceived risk in loyalty intentions: an investigation in a service context Jackie Lai-Ming Tam Management and Marketing Department, The Hong Kong Polytechnic University, Hong Kong, Abstract Purpose – The objectives of this study are twofold: to investigate the impact of service encounter quality dimensions on perceived value, customer satisfaction, and loyalty, and to examine the moderating effect of perceived risk on the relationship of loyalty with perceived value and customer satisfaction in high contact services. Design/methodology/approach – A questionnaire survey was adopted. Data were collected from customers who had used either hairdressing services or health care services in the past three months. Confirmatory factor analysis was used to evaluate the validity of the measures and structural equation modeling was used to assess the hypothesized relationships. Findings – Technical quality and empathy were found to display a positive effect on satisfaction in both hairstylist and physician samples. Physical environment was found to display a positive effect on satisfaction in the physician sample, but not in the hairstylist sample, and its effect on perceived value was non-significant in both samples. The results also showed that there was a significant difference between low and high perceived risk groups in both samples with respect to the relationship between satisfaction and loyalty, and the relationship between perceived value and loyalty. Research limitations/implications – The study was conducted in a professional and relational service context, thus the scope for generalization of the results to other contexts may be limited. Moreover, this study focused on performance risk. Originality/value – This study provides empirical support for the moderating role of perceived risk in the relationship between satisfaction and loyalty, and the relationship between perceived value and loyalty. Keywords Perceived risk, Service encounter quality, Customer satisfaction, Perceived value, Customer loyalty Paper type Research paper Introduction In the face of intensified competition and sophisticated consumers, service firms are increasingly interested in improving customer relationships and building customer loyalty. Service quality, perceived value and customer satisfaction are considered effective means to generate customer loyalty (Oliver, 1999; Woodruff, 1997; Zeithaml et al., 1996). Service firms not only need to provide better service quality than those of competitors, but also to deliver superior value to improve customer satisfaction and gain loyalty. Although research has been conducted to examine the interrelationships between service quality, perceived value and customer satisfaction, most have treated The current issue and full text archive of this journal is available at www.emeraldinsight.com/0263-4503.htm This research is supported by a grant from Department of Management and Marketing, The Hong Kong Polytechnic University, Hong Kong. The role of perceived risk in loyalty 33 Received 16 September 2010 Revised 27 April 2011 Accepted 8 August 2011 Marketing Intelligence & Planning Vol. 30 No. 1, 2012 pp. 33-52 q Emerald Group Publishing Limited 0263-4503 DOI 10.1108/02634501211193903
Transcript
The moderating role of perceivedrisk in loyalty intentions: an
investigation in a service contextJackie Lai-Ming Tam
Management and Marketing Department,The Hong Kong Polytechnic University, Hong Kong,
Abstract
Purpose – The objectives of this study are twofold: to investigate the impact of service encounterquality dimensions on perceived value, customer satisfaction, and loyalty, and to examine themoderating effect of perceived risk on the relationship of loyalty with perceived value and customersatisfaction in high contact services.
Design/methodology/approach – A questionnaire survey was adopted. Data were collected fromcustomers who had used either hairdressing services or health care services in the past three months.Confirmatory factor analysis was used to evaluate the validity of the measures and structural equationmodeling was used to assess the hypothesized relationships.
Findings – Technical quality and empathy were found to display a positive effect on satisfaction inboth hairstylist and physician samples. Physical environment was found to display a positive effect onsatisfaction in the physician sample, but not in the hairstylist sample, and its effect on perceived valuewas non-significant in both samples. The results also showed that there was a significant differencebetween low and high perceived risk groups in both samples with respect to the relationship betweensatisfaction and loyalty, and the relationship between perceived value and loyalty.
Research limitations/implications – The study was conducted in a professional and relationalservice context, thus the scope for generalization of the results to other contexts may be limited.Moreover, this study focused on performance risk.
Originality/value – This study provides empirical support for the moderating role of perceived riskin the relationship between satisfaction and loyalty, and the relationship between perceived value andloyalty.
IntroductionIn the face of intensified competition and sophisticated consumers, service firms areincreasingly interested in improving customer relationships and building customerloyalty. Service quality, perceived value and customer satisfaction are consideredeffective means to generate customer loyalty (Oliver, 1999; Woodruff, 1997; Zeithamlet al., 1996). Service firms not only need to provide better service quality than those ofcompetitors, but also to deliver superior value to improve customer satisfaction andgain loyalty. Although research has been conducted to examine the interrelationshipsbetween service quality, perceived value and customer satisfaction, most have treated
The current issue and full text archive of this journal is available at
www.emeraldinsight.com/0263-4503.htm
This research is supported by a grant from Department of Management and Marketing, TheHong Kong Polytechnic University, Hong Kong.
service quality as a global construct reflecting an overall perception about a firm’sservice quality (Brady et al., 2005; Hsin et al., 2008; Lai et al., 2009). This studyinvestigates the impact of service encounter quality dimensions on perceived value andcustomer satisfaction, and in turn, loyalty. Analysis of the impact of service encounterquality dimensions on perceived value and satisfaction offers more diagnostic value formanagement to identify areas for service improvement and resource allocation(Bloemer et al., 1999; Jamal and Anastasiadou, 2009; Sachdev and Verma, 2004; Zhou,2004). Both perceived value and satisfaction have shown to positively influencecustomer loyalty (Lai et al., 2009; Tam, 2004). By identifying those service areas thatcontribute to perceived value and customer satisfaction, decisions designed to enhancecustomer loyalty would be more effective.
Services are characterized by intangibility, heterogeneity, simultaneous of productionand consumption, experiential and credence properties. Hence, consumers may perceivegreater risk in the purchasing of services than in the purchasing of physical goods(Zeithaml, 1981). While research has shown that perceived risk influences consumers’information acquisition and use (Bettman, 1973; Guo, 2001; Mitra et al., 1999; Mitchelland Greatorex, 1993), little research has explored the role of perceived risk inpost-purchase evaluations and behaviors. Researchers have suggested that consumershave greater intentions to revisit the same provider and form a relationship when aservice is perceived to be high risk (Bendapudi and Berry, 1997; Sheth and Parvatiyar,1995; Zeithaml, 1981). Customers would be more assured of the service that they wouldreceive when visiting the same service provider who they feel satisfied. Despite thatperceived risk may play a role in customers’ post-purchase behaviors, there is virtuallyno empirical study to date has explored the role of perceived risk in post-purchaseevaluations and behaviors, in particular the relationship between perceived value andloyalty, and between customer satisfaction and loyalty. The second objective of thisstudy is to examine the moderating effect of perceived risk on the relationship of loyaltywith perceived value and customer satisfaction in high contact services: hairdressingand health care. The outcome of these services is uncertain and the negative consequencecould be high, thus perceived risk is likely to be present.
The article is organized as follows. Following this introduction, the conceptualbackground, conceptual framework and hypotheses development are provided. Thenext section presents the research methods, followed by a discussion of the analysisand results. The implications of the findings are then presented. Finally, the articlediscusses the limitations inherent in the study and makes suggestions for futureresearch.
Conceptual backgroundDefinitions of the constructsPerceived service quality. Perceived service quality is derived from customers’ cognitiveevaluations of a service (Chiou et al., 2002). It can be viewed at a transaction-specificlevel or a global level (Oliver, 1993; Parasuraman et al., 1994; Teas, 1993). Globalquality is an overall perception of a firm’s service quality based on customers’cumulative transaction-specific experiences (Oliver, 1997). Transaction-specific qualityis customers’ evaluations of various aspects of a service during a service encounter. Itcan provide specific diagnostic information about the service encounter. In this study,we focus on transaction-specific service quality.
MIP30,1
34
Customer satisfaction. Customer satisfaction is defined as an affective responsereflecting the extent to which a service is providing a pleasurable level of fulfillment ofcustomers’ needs and goals (Oliver, 1997). Pleasurable implies that fulfillment increasespleasure or reduces pain or anxiety. Fulfillment is determined with reference tocustomers’ expectations. Drawing on the expectancy-disconfirmation paradigm,customer expectations provide a frame of reference for satisfaction judgment. If theperceived service performance exceeds expectations, the likely outcome is satisfaction.On the other hand, if the perceived service performance falls short of expectations, thelikely outcome is dissatisfaction (Churchill and Surprenant, 1982; Oliver, 1980; Yi, 1990).
Customer perceived value. Customer perceived value has often been conceptualized as atrade-off between what customers receive and what they have to sacrifice to acquire aservice (Monroe, 1991; Zeithaml, 1988). To enhance customer perceived value, companiescan either add benefits to the service or reduce the costs associated with the purchase anduse of the service (Lovelock and Wirtz, 2007). Price is often viewed as the key measure torepresent customer perceived sacrifices (Brady and Cronin, 2001; Lam et al., 2004;Sweeney et al., 1999; Varki and Colgate, 2001; Wang et al., 2004). Other non-monetarysacrifices include time, and physical and mental effort (Zeithaml et al., 2009). Theimportance of the types of sacrifice may vary across individual consumers and usagesituations (Tam, 2004). In this study, perceived value is a result of customers’ evaluationof the service received against their perceptions of the monetary costs of obtaining theservice. Price is a major determinant of consumer choice (Kotler et al., 2009). It also playsan important role in customers’ post-purchase evaluations and behavior (Tam, 2004).
Perceived risk. Perceived risk is defined as consumers’ perceptions of uncertaintyand adverse consequence of buying a service (Dowling and Staelin, 1994). Bettman(1973) distinguishes two types of risks; inherent risk and handled risk. Inherent risk isthe latent risk a product class holds for a consumer, while handled risk is the amount ofconflict the product class is able to arouse when the consumer chooses a brand from aproduct class in his/her usual buying situation. Handled risk represents the end resultsof the action of information and risk reduction processes on inherent risk. Dowling andStaelin (1994) referred to this distinction as product category and product specific risk.The former reflects the consumers’ perceptions of risk inherent in purchasing anyparticular product in a specific product category. Consumers’ perceived risk may varydepending on their knowledge, past experiences and acceptable risk level (Dowling andStaelin, 1994). In this study, we are interested in inherent risk as it reflects the riskinherent in a product category rather than a particular brand.
Customer loyalty. Oliver (1997) defines loyalty as a deeply held commitment torebuy or repatronize a preferred product or service consistently in the future. Thisdefinition focuses on both behavioral and attitudinal components of customer loyalty.The extent to which customers are loyal is expressed not only in terms of repeatpurchases of the same brand over time, but also in terms of their preference for thebrand and recommendation of the brand to others. Customers may exhibit repurchasebehavior due to limited choice available or inertia (Bloemer and Kasper, 1995). Truecustomer loyalty extends beyond behavior and includes preference and liking(Lovelock and Wirtz, 2007). Recent studies have conceptualized customer loyalty on thebasis of both behavior and attitude (Evanschitzky and Wunderlich, 2006; Fitzgibbonand White, 2005; Olsen et al., 2005; Yi and La, 2004). Thus, the behavioral andattitudinal components of loyalty are used in this study.
The role ofperceived risk in
loyalty
35
Conceptual framework and hypothesis developmentThe conceptual framework (Figure 1) presents an overview of the relationshipshypothesized and examined in this study. Based on the literature review, elevenhypotheses were developed. These hypotheses focus on the interrelationships betweenperceived service quality, satisfaction, perceived value and loyalty. In addition, wehypothesize that perceived risk moderates the relationship of loyalty with satisfactionand perceived value.
The relationships between perceived service quality, value and satisfactionPerceived service quality and value are both considered cognitive constructs whereascustomer satisfaction is an affective response to the appraisal of a service. The causalrelationships proposed between perceived service quality, value and satisfaction arebased on Bagozzi’s (1992) model which suggests that appraisal would lead to anemotional reaction, and this in turn drives behavior. Thus, perceived service quality andcustomer value are specified as antecedents to customer satisfaction. Perceived servicequality is viewed as a “gain” component in the value integration process, hence it isspecified as an antecedent to value (Brady et al., 2005; Cronin et al., 2000; Zeithaml, 1988).
Customers judge the quality of services based on their perceptions of the technicalquality provided, the interaction between the service provider and the customer, andthe quality of the physical surroundings where the service is delivered (Brady andCronin, 2001; Rust and Oliver, 1994; Zeithaml et al. 2009). In high contact services suchas hairdressing and health care, customers are present in the service delivery siteswhile consuming the service, hence effective management of front office is crucial. Allvisible elements in the front office including service personnel, physical facilities andsurroundings will have an effect on customers’ evaluations of the service andimpression towards the service firm (Lovelock and Wirtz, 2007).
Figure 1.Conceptual model
MIP30,1
36
Technical quality refers to the performance of core services, which reflects the serviceprovider’s expertise, professionalism, and competency in delivery of a service (Daggeret al., 2007). Although customers may lack the knowledge to judge the adequacy of thedelivery of technical components, they may use the provider’s perceived knowledge,credentials and experience as a surrogate for technical quality (Hausman, 2003). If theperformance of the core services is unfavorable, customers are very likely to bedissatisfied. Technical quality was found to be the most significant factor ininfluencing customer satisfaction in hairdressing and dental services (McDougall andLevesque, 2000). Research has also shown that a salesperson’s competency enhancesthe relationship quality between the salesperson and the customer (Crosby et al., 1990).
In personal services like hairdressing and health care services, the delivery of a serviceoccurs during the interaction between a service provider and a customer, hence theattitudes and behaviors of the service provider are vital in shaping customer satisfaction.Hausman (2003) considers that these social aspects of services may be even more relevantto influence customer satisfaction. Empathy has long been considered essential increating a successful interaction between the service provider and the customer(Homburg et al., 2009; McBane, 1995). It is defined as the caring, individualized attentionservice given to customers (Zeithaml et al., 2009). Service providers with empathy canbetter understand customers’ needs and adjust their pace and presentation to satisfy thoseneeds (Aggarwal et al., 2005). Hence, customers who find their service providers areshowing empathetic concern and caring are more likely to feel satisfied with the service.
Physical environment refers to the style and appearance of the physicalsurroundings and other tangible elements encountered by customers at servicedelivery sites (Bitner, 1992). Because services are intangible and involve customersduring the process, physical environment offers tangible cues for customers to drawinferences about the quality of the service provider (Baker et al., 1994; Berry andBendapudi, 2003; Bitner, 1992, Brady and Cronin, 2001; Dagger et al., 2007; Grewalet al., 2007). Prior studies on the effect of physical environment on customersatisfaction have reported mixed results. While studies have shown that the physicalenvironment has a positive impact on customer satisfaction (Bitner, 1992; Chang, 2000),Choi et al. (2005) and Baumann et al. (2007) found that environment did not display aneffect on satisfaction. Lee et al. (2000) and Pollack (2009) suggest that the relativeimportance of various service quality dimensions may differ depending on the type ofservice. Physical environment is especially relevant for people-based services such ashealth care and hairdressing in which customers are highly involved in the service.Stimulus-organism-response theory predicts that a favorable environment will triggerpositive emotions, which in turn may enhance customer’s feeling towards the serviceprovider (Mehrabian and Russell, 1974). In light of the preceding discussion, it isproposed that:
H1. Technical quality has a positive effect on satisfaction.
H2. Empathy has a positive effect on satisfaction.
H3. Physical environment has a positive effect on satisfaction.
Perceived customer value is considered the result of a trade-off between whatcustomers receive and what they give up to acquire a service. Value increases withquality of a service and decreases with increases in the costs of obtaining it. There is
The role ofperceived risk in
loyalty
37
empirical evidence to support the proposition that perceived quality is positivelyrelated to value (Brady et al., 2005; Hume and Mort, 2010; Teas and Agarwal, 2000).The higher the customers perceive the quality of a service to be, the more likely it isthat they will feel the service is value for money. Physical environment andatmospheric elements can be used to create value for customers (Babin and Attaway,2000). Employing the right combination of colors, textures, sounds, scents and spatialdesign can enhance customers desired service experience and heighten their appetitefor the service experience (Lovelock and Wirtz, 2007). Thus, the following hypothesesare proposed:
H4. Technical quality has a positive effect on customer perceived value.
H5. Empathy has a positive effect on customer perceived value.
H6. Physical environment has a positive effect on customer perceived value.
The relationships between value, satisfaction and loyaltyBased on Bagozzi’s (1992) model which suggests a cognition-affect causal relationship,perceived value is posited to be a determinant of satisfaction. According to Heskettet al.’s (1997) model, satisfied and loyal employees create value for customers and thisdrives customer satisfaction, which in turn influences loyalty. The higher thecustomers perceive the value of a service to be, the more likely it is that they will feelsatisfied with the service. Prior studies have shown that perceived value has a positiveinfluence on satisfaction (Hu et al., 2009; Lam et al., 2004; Tam, 2004).
Creating and delivering superior customer value is regarded as an underlyingsource for gaining competitive advantage (Ravald and GrOnroos, 1996; Sweeney andSoutar, 2001; Woodruff, 1997). Not only does perceived value directly influencecustomer satisfaction, it will also strongly affect customer loyalty (Brady et al., 2005;Szeinbach et al., 1999; Wang et al., 2004). Previous studies have provided evidence forthe positive influence of perceived value on customers’ repurchase intentions or loyalty(Chen and Dubinsky, 2003; Sweeney et al., 1999; Yang and Peterson, 2004). Lai et al.(2009) have shown that perceived value has a greater effect on customer loyalty thanany other evaluation constructs (quality, satisfaction and corporate image) examinedin their study. Therefore, it is expected that perceived value has a positive effect onloyalty.
Customer satisfaction is a cornerstone of all marketing activity. The importance ofcustomer satisfaction lies in its ability to influence post-purchase behavior. Satisfiedcustomers are more likely to make more repeat purchases and to share their positiveexperiences with others. On the other hand, dissatisfied customers may boycott thefirm, engage in negative word-of-mouth communication or even make a complaint tothe press or a consumer organization. There is evidence to support a positiverelationship between customer satisfaction and repurchase intentions or loyalty (Liet al., 2008; Ndubisi et al., 2009; Yi and Gong, 2009). Hence, the preceding discussionleads to the following hypotheses:
H7. Customer perceived value has a positive effect on satisfaction.
H8. Customer perceived value has a positive effect on loyalty.
H9. Satisfaction has a positive effect on loyalty.
MIP30,1
38
The moderating effects of perceived riskPerceived risk involves uncertainty and adverse consequence of buying a service(Dowling and Staelin, 1994). There are various types of risks including performance,financial, time, psychological and social risks. Performance risk refers to the lossincurred when a service does not perform as expected (Horton, 1976). Mitchell (1998)considers that performance risk can be seen as a surrogate for overall risk, whichincludes a combination of all other losses. This study is interested in performance riskas consumers are often concerned with the performance of a service, which ischaracterized by intangibility and heterogeneity.
Prior studies have examined perceived risk in mediating the relationship betweenperceived quality and perceived value (Chen and Dubinsky, 2003; Sweeney et al., 1999),however there is virtually no empirical study to date examining the role of perceivedrisk in moderating the relationship of loyalty with customer satisfaction and customerperceived value. Sheth and Parvatiyar (1995) suggest that the greater the perceivedrisk, the greater the consumers’ propensity to engage in relational behavior. Brandloyalty was found to be the most useful risk-reducing strategy for restaurant andhairdressing services (Mitchell and Greatorex, 1993). Meeting and satisfyingconsumers’ needs are a precondition for consumers to be loyal to a service provider(Danaher et al., 2008). But even highly satisfied customers nowadays may also expresstheir tendency to switch. Mittal and Lasser (1998) reported that 58 percent of therespondents who rated health care services a 4 on a five-point satisfaction scale hadexpressed their predisposition to switch service providers.
Perceived risk may play a role in moderating the relationship between satisfactionand loyalty. If perceived risk is high, customers are more likely to revisit the sameservice provider when they are satisfied. But if perceived risk is low, customersatisfaction may not necessarily lead to loyalty. Customers may switch to analternative service provider for convenience or time saving if they perceive the risk inacquiring a service from the alternative service provider is low. We hypothesize thatthe effect of customer satisfaction on loyalty is stronger under high perceived riskconditions than under low perceived risk conditions. We also hypothesize thatperceived risk may impose a similar impact on the relationship between perceivedvalue and loyalty. When perceived risk is high, customers are more concerned aboutwhether a service will perform as expected and the loss it may incur. In this case,customers may want to minimize the perceived risk by revisiting the same serviceprovider when the service is value for money. But when perceived risk is low,customers may switch if they perceive an alternative service provider offers a betterservice or lower price. Thus, the following hypotheses are proposed:
H10. Perceived risk moderates the effect of satisfaction on loyalty.
H11. Perceived risk moderates the effect of perceived value on loyalty.
MethodSample and data collectionHairdressing and health care services were chosen in this study. These two serviceswere chosen because they require a high degree of contact with a service provider. Bothservices offer opportunities for customization, and involve intimate interactions andcooperative actions between customer and service provider. The quality of service
The role ofperceived risk in
loyalty
39
delivery as well as prices of services can vary significantly among service providers inboth industries. Private sector health care service in Hong Kong is similar to otherindustries such as hairdressing in so far as a health care consumer can choose amongmany physicians who offer different prices and services. This study focuses on healthcare service in the private sector in view of the fact that health care consumers have achoice of providers in this sector.
This was an exploratory study and a questionnaire survey was adopted. Twoquestionnaires were developed, one for hairstylists and one for physicians. Both wereidentical with the exception of a wording adjustment to reflect the service setting. Priorto the field survey, the hairstylist and physician questionnaires were pretested with 30people respectively to ensure clarity and potential difficulties in answering thequestions. No major problems were encountered at this stage.
Four trained assistants collected the data in high traffic districts in Hong Kongwhere people from all walks of life were likely to pass by. The survey was conductedbetween 11:00am-1:00pm, and 5:00pm-7:00pm over a three month period. In order toensure that the two samples contained a good cross-section of the population withrespect to gender and age, assistants were provided instructions to select potentialrespondents such that no more than 60 percent of the sample could be of one genderand no more than 50 percent of the sample were aged 30 or younger. In addition,respondents were asked to complete only one survey. They were required to havevisited either a hairstylist or a physician in the past three months to be included in thesample. If they had visited either more than one hairstylist or more than one physicianin the past three months, they were instructed to respond to the questions withreference to their most recent visit. A fast food coupon worth HK$30 (US$1 ¼ HK$7.8)was given to respondents as a token of thanks for their participation. About three outof ten people approached agreed to participate in the study.
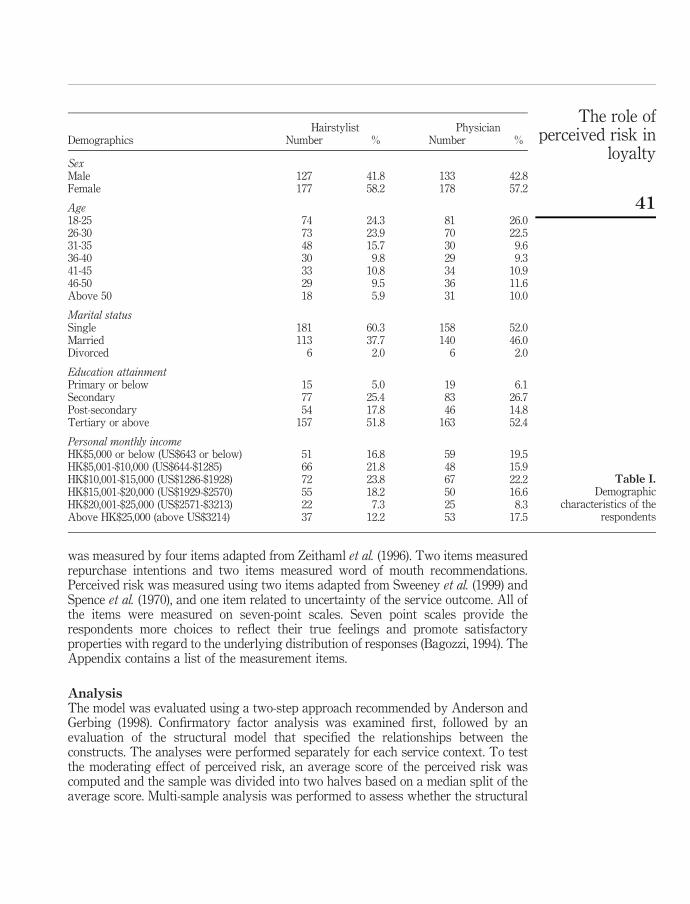
The resultant samples for hairstylist was 306 and for physician was 312 aftereliminating those responses with missing and invalid data. Anderson and Gerbing(1998) suggest that a sample size of at least 150 is required to obtain parameterestimates that have standard errors small enough to be of practical use. Both resultantsamples met this requirement. In the hairstylist sample, females accounted for 57.2percent, median age was between 31-35 and median personal monthly income wasbetween HK$10001-15000. In the physician sample, females accounted for 58.2 percent,median age was between 31-35 and median personal monthly income was betweenHK$10001-15000. The demographic profiles of the two samples are comparable. Table Idisplays the demographic characteristics of the respondents.
MeasuresThe constructs in the study were measured using multi-item scales mostly adaptedfrom the existing literature. Technical quality was measured using three items relatedto service provider’s technical knowledge and skills (Dagger et al., 2007). Empathy wasmeasured by a three-item scale adapted from Parasuraman et al. (1991). Physicalenvironment was measured using three items describing how comfortable andpleasant the environment was (Voorhees et al., 2009). Customer satisfaction wasmeasured using scales adapted from Dagger et al. (2007). Two items reflected overallsatisfaction and one item related to customers’ expectations. A three-item scale wasused to measure customer perceived value (Teas and Agarwal, 2000). Customer loyalty
MIP30,1
40
was measured by four items adapted from Zeithaml et al. (1996). Two items measuredrepurchase intentions and two items measured word of mouth recommendations.Perceived risk was measured using two items adapted from Sweeney et al. (1999) andSpence et al. (1970), and one item related to uncertainty of the service outcome. All ofthe items were measured on seven-point scales. Seven point scales provide therespondents more choices to reflect their true feelings and promote satisfactoryproperties with regard to the underlying distribution of responses (Bagozzi, 1994). TheAppendix contains a list of the measurement items.
AnalysisThe model was evaluated using a two-step approach recommended by Anderson andGerbing (1998). Confirmatory factor analysis was examined first, followed by anevaluation of the structural model that specified the relationships between theconstructs. The analyses were performed separately for each service context. To testthe moderating effect of perceived risk, an average score of the perceived risk wascomputed and the sample was divided into two halves based on a median split of theaverage score. Multi-sample analysis was performed to assess whether the structural
Hairstylist PhysicianDemographics Number % Number %
coefficients were equal across low versus high-perceived risk groups (JOreskog andSOrbom, 1993). The initial model was estimated by constraining all structural paths tobe equal across the two groups. Then, the structural estimate of the path betweensatisfaction and loyalty was relaxed across the two groups, and the Chi-square statisticof this nested model was compared with the one of the constrained model. A significantdecrease in Chi-square statistics suggests that perceived risk has an influence on thestructural relationship between satisfaction and loyalty. The procedure was repeatedfor the structural estimate of the path between perceived value and loyalty.
Reliability and validity of measuresCronbach alpha values ranged from 0.88 to 0.93 for hairstylist sample and 0.73 to 0.91for physician sample, well exceeding the thresholds of 0.70 (Churchill, 1979; Nunnallyand Bernstein, 1994). The measurement model showed a satisfactory fit to the data(hairstylist: x 2 ¼ 478.12, d.f. ¼ 188, CFI ¼ 0.98, NNFI ¼ 0.97; RMSEA ¼ 0.071;physician: x 2 ¼ 560.25, d.f. ¼ 188, CFI ¼ 0.96, NNFI ¼ 0.95; RMSEA ¼ 0.080). Thefit indices were all in the acceptable range (Bentler and Bonett, 1980; Hu and Bentler,1999). All factor loadings were statistically significant, suggesting convergent validity(Anderson and Gerbing, 1998). The reliability of the construct was examined bycomputing the composite reliability (Fornell and Larcker, 1981). All met therecommended criterion of 0.60 or above (Bagozzi and Yi, 1988). Discriminant validitywas assessed by using Fornell and Larcker’s (1981) criterion that the average varianceextracted (AVE) for each construct should be greater than the squared correlationbetween that construct and any other construct in the model. For each construct, theAVE was greater than its squared correlation with other constructs, thus providingsupport for discriminant validity. In summary, the measures of the constructsdemonstrate reliability and validity. Table II presents standardized factor loadings,composite reliabilities and average variances extracted for both measurement models.
Hypotheses tests and resultsLISREL 8.54 was used to assess the research hypotheses. The overall fit of thestructural models was adequate and r 2 for the structural equations ranged from 0.13 to0.64 (hairstylist: x 2 ¼ 447.0, d.f. ¼ 140, CFI ¼ 0.98, NNFI ¼ 0.97; RMSEA ¼ 0.085;physician: x 2 ¼ 518.40, d.f. ¼ 140, CFI ¼ 0.96, NNFI ¼ 0.95; RMSEA ¼ 0.093).Table III presents the parameter estimates of the structural equations and theresults of hypotheses testing for both samples.
Technical quality was found to display a positive effect on satisfaction (hairstylist:g ¼ 0.40, t-value ¼ 6.44; physician: g ¼ 0.43, t-value ¼ 6.85) and perceived value(hairstylist: g ¼ 0.29, t-value ¼ 3.35; physician: g ¼ 0.28, t-value ¼ 3.23) in bothsamples, thus supporting H1 and H4. This shows that the higher the customers’perceptions of the technical quality of the service provider, the greater their satisfactionand their perceptions of the value of the service. Empathy had a positive effect onsatisfaction in both samples (hairstylist: g ¼ 0.37, t-value ¼ 5.63; physician: g ¼ 0.29,t-value ¼ 5.03), but its effect on perceived value was only observed in the hairstylistsample (hairstylist: g ¼ 0.31, t-value ¼ 3.40) and not in the physician sample(physician: g ¼ 0.13, t-value ¼ 1.63), hence H2 was supported and H5 was partiallysupported. Empathy would enhance satisfaction in both samples but it would onlyenhance customers’ perceptions of value in the hairstylist sample. Physical
Notes: SE ¼ standardized estimate; regarding the results, supported refers to relationships that weresupported in both samples, partially supported refers to relationships that were supported in one of thesamples, and not supported refers to relationships that were not supported in both samples; *
significant at 5 percent levelTable III.
Structural model results
The role ofperceived risk in
loyalty
43
environment was found to display a positive effect on satisfaction in the physiciansample (physician: g ¼ 0.18, t-value ¼ 3.77), but not in the hairstylist sample(hairstylist: g ¼ 20.001, t-value ¼ 20.068), and its effect on perceived value wasnon-significant in both samples (hairstylist: g ¼ 20.08, t-value ¼ 21.17; physician:g ¼ 20.09, t-value ¼ 21.31), hence H3 was partially supported and H6 was notsupported. This suggests that better physical environment would lead to greatersatisfaction for physicians but not for hairstylists, and it would not influencecustomers’ perceptions of value for both physicians and hairstylists.
Hypotheses H7 and H8 state that perceived value has a positive effect onsatisfaction and loyalty respectively. The results support these hypotheses: perceivedvalue on satisfaction (hairstylist: b ¼ 0.15, t-value ¼ 3.20; physician: b ¼ 0.14,t-value ¼ 3.07), and perceived value on loyalty (hairstylist: b ¼ 0.0.23, t-value ¼ 4.11;physician: b ¼ 0.22, t-value ¼ 4.19). This shows that the higher the perceptions ofvalue, the greater the satisfaction and the stronger the loyalty for both physicians andhairstylists. The effect of satisfaction on loyalty was significant in both samples(hairstylist: b ¼ 0.53, t-value ¼ 9.10; physician: b ¼ 0.61, t-value ¼ 10.53), thussupporting H9. Higher satisfaction would enhance loyal behavior for both physiciansand hairstylists.
The moderating effect of perceived risk on the relationship between satisfaction andloyalty and the relationship between perceived value and loyalty was assessed usingmulti-sample analysis via LISREL (JOreskog and SOrbom, 1993). The samples weredivided into low and high-perceived risk groups based on a median split. Respondentsabove the median score were classified as high-perceived risk and those below themedian score as low perceived risk. Respondents at the median score were excluded.Separate covariance matrix, means and standard deviations for the low andhigh-perceived risk groups were used as input for each sample. The structuralestimates were constrained to be equal across both low and high perceived risk groupsand the x 2 statistic was compared with the x 2 statistic of the model in which thestructural estimates were relaxed. A significant Chi-square difference suggested thatthe structural estimate for the two groups is different. The results showed that therewas a significant difference between low and high perceived risk groups in bothsamples with respect to the relationship between satisfaction and loyalty (hairstylist:x 2 ¼ 7.50, df ¼ 1, p, 0.05; physician: x 2 ¼ 15.60, df ¼ 1, p , 0.05), thus supportingH10. This shows that under high perceived risk conditions, customers who feelsatisfied with the service provider are more likely to revisit and recommend the serviceprovider to others compared to low perceived risk conditions. Perceived risk alsodisplayed a significant moderating effect on the relationship between perceived valueand loyalty in the physician sample (physician: x 2 ¼ 6.70, df ¼ 1, p, 0.05), and in thehairstylist sample (hairstylist: x 2 ¼ 3.50, df ¼ 1, p , 0.10), thus H11 was supported.This shows that under high perceived risk conditions, customers who perceive theservice is valuable are more likely to revisit and recommend the service provider toothers compared to low perceived risk conditions.
Discussion and implicationsThe first objective of this study was to examine the impact of encounter quality oncustomer satisfaction and perceived value. The results show that technical quality hadthe most significant influence on customer satisfaction and perceived value. Technical
MIP30,1
44
quality relates to how well the core service is delivered to customers. Both hairdressingand health care are professional services and the performance of the core service isvital to customer satisfaction and perceived value. Customers seek the professionaljudgments and skills of the service providers to resolve their problems or to fulfill theirunmet needs. Although customers may not possess the knowledge to assess theadequacy of the delivery of technical components, they may use available cues such ascredentials, experience and quality of the interaction with the service provider to formtheir perceptions. Service providers can influence customers’ perceptions bynon-personal communications and interactive communications. Non-personalcommunications include displaying their qualifications, experience, and accolades inareas that customers can easily notice. This can shape customer expectations towardsthe technical competency of the service provider. In an ambiguous service experiencesuch as healthcare where there is a lack of clear evidence on the basis to judgeperformance, consumers may use top-down assimilative processing to judge theperformance (Hoch and Deighton, 1989). Hence, expectations may influence customers’evaluation of a service performance. Interactive communications refer to the directcommunications between service provider and customer. Interactive communicationsoffer opportunities for customers to express their needs, concerns and worries whichenable service providers to better understand customers’ conditions, and provideprofessional advice and treatment. Due to lack of knowledge, customers demand moreunderstanding and they would feel more satisfied with the service and perceive thatthe money spent is worthwhile when a service provider listens to them, analyzes theirconditions, explains the treatment and offers professional advice.
Empathy was found to have the second most significant influence on customersatisfaction and perceived value. In personal services like hairdressing and healthcare,customers closely interact with a service provider, hence the manner, attitudes andbehaviors of the service provider will have a strong influence on customer feelings.Service providers should treat customers with respect, show empathetic concern andbe responsive to customers’ needs and feelings. Humans tend to form emotional bondswith people who seem especially responsive to their needs (Vlachos et al., 2010).Emotional bonds/attachments have been found to be a strong predictor of loyalty( Jawahar and Maheswari, 2009)
Physical environment was found to have a significant influence on customersatisfaction in the physician sample but not in the hairstylist sample. This suggeststhat the effect of physical environment on customer satisfaction differs depending onthe service context. Although hairdressing and health care services share somecommon characteristics, there are some dissimilarities between them (Berry andBendapudi, 2007). Health care consumers usually suffer physical discomfort as well asemotional stress induced by their health problems, therefore a comfortable andpleasant environment may ease their feelings of anxiety, and improve their physicaland psychological comfort and consequently satisfaction. In contrast, consumersvisiting hairstylist aim to enhance their personal grooming or appearance. They seemto be more concerned about the technical quality and empathy displayed by thehairstylists than the physical surroundings.
Loyalty was found to be positively influenced by customer satisfaction andperceived value. This suggests that the higher the perceptions of value, the greater thesatisfaction and the stronger the loyalty. In order to effectively influence loyalty, it is
The role ofperceived risk in
loyalty
45
important that service providers understand which aspects of service contribute mostto customer satisfaction and perceived value. This study shows that quality of theservice provider plays a pivotal role in personal services such as hairdressing andhealthcare. Physical environment is only relevant for health care services but not forhairdressing services. Health care providers can make use of the ambient elementssuch as slow tempo music and soft lighting to create an environment that can have asoothing effect. While physical environment does not seem to directly influencesatisfaction for hairdressing services, hairstylists can use the physical environment toproject a professional and modern image.
The second objective of this study was to explore the role of perceived risk in therelationships of loyalty with perceived value and customer satisfaction. The resultsindicate a moderating influence of perceived risk; especially the relationships of loyaltywith perceived value and customer satisfaction are stronger when perceived risk ishigh than when it is low. Customers who are satisfied with the service provider, andwho perceive the service is valuable, are more likely to revisit and recommend theservice provider to others under high perceived risk conditions compared to lowperceived risk conditions. Although high-perceived risk may act as a switching barrierto retain customer loyalty, service providers wishing to capture customers ofcompetitors would need to consider lowering customers’ risk perceptions. This may beachieved by displaying their credentials, offering guarantees or developing strategiesto facilitate customers envisaging the service process and outcome so as to minimizetheir uncertainty pertaining to the consumption. For example, hairstylists can helpcustomers to visualize their image of a new hairstyle with the aid of a computer.Similarly, health care providers can help patients better understand the medicaltreatment or operation by explaining with visual aids such as pictures/videos.
Under low perceived risk conditions, providing a satisfactory and valuable serviceis essential but this may not be sufficient to generate repeat purchases and positiveword of mouth. Satisfied customers may switch to an alternative service provider ifthey perceive the risk in acquiring a service from the alternative service provider islow. Service providers can influence customers’ perceptions of risks involved whenswitching to an alternative service provider. For example, a service provider can depictnegative consequences of using other service providers while emphasizing its qualityof service in its promotions. In the long run, service providers should devote efforts andresources in developing interpersonal relationships with customers in an attempt tobuild customer loyalty.
Limitations and suggestions for future researchThis study has several potential limitations. First, the study was conducted in aprofessional and relational service context, thus the scope for generalization of theresults to other contexts may be limited. Replications in other service contexts such asfast food restaurants are highly desirable. Second, this study focused on performancerisk, yet there are different types of risk such as social risk, financial risk, time risk andpsychological risk (Sweeney et al., 1999). Research is needed to explore the influence ofvarious risks in customer post-purchase evaluations and behaviors. Lastly, the use ofself-report data may be subject to recall bias; however, the fact that the respondentswere asked to evaluate the most recent service encounter during the last three monthsshould lessen recall bias.
MIP30,1
46
References
Aggarwal, P., Castleberry, S., Ridnour, R. and Shepherd, C.D. (2005), “Salesperson empathy andlistening: impact on relationship outcomes”, Journal of Marketing Theory and Practice,Vol. 13 No. 3, pp. 16-31.
Anderson, J.C. and Gerbing, D.W. (1998), “Structural equation modeling in practice: a review andrecommended two-step approach”, Psychological Bulletin, Vol. 103 No. 3, pp. 411-23.
Babin, B. and Attaway, J.S. (2000), “Atmospheric affect as a tool for creating value and gainingshare of customer”, Journal of Business Research, Vol. 49 No. 2, pp. 91-9.
Bagozzi, R.P. (1992), “The self regulation of attitudes, intentions, and behavior”, Social PsychologyQuarterly, Vol. 55 No. 2, pp. 178-204.
Bagozzi, R.P. and Yi, Y. (1988), “On the evaluation of structural equation models”, Journal ofAcademy of Marketing Science, Vol. 16 No. 1, pp. 74-94.
Baker, J., Grewal, S. and Parasuraman, A. (1994), “The influence of store environment on qualityinferences and store image”, Journal of the Academy of Marketing Science, Vol. 22, Fall,pp. 328-39.
Baumann, C., Burton, S., Elliott, G. and Kehr, H. (2007), “Prediction of attitude and behavioralintentions in retail banking”, International Journal of BankMarketing, Vol. 25 No. 2, pp. 102-16.
Bendapudi, N. and Berry, L. (1997), “Customers’ motivations for maintaining relationships withservice providers”, Journal of Retailing, Vol. 73 No. 1, pp. 15-37.
Bentler, P.M. and Bonett, D.G. (1980), “Significance tests and goodness of fit in the analysis ofcovariance structures”, Psychological Bulletin, Vol. 88 No. 3, pp. 588-606.
Berry, L. and Bendapudi, N. (2003), “Clueing in customers”, Harvard Business Review, Vol. 81No. 2, pp. 100-6.
Berry, L. and Bendapudi, N. (2007), “Health care – a fertile field for service research”, Journal ofService Research, Vol. 10 No. 2, pp. 111-22.
Bettman, J.R. (1973), “Perceived risk and its components: a model and empirical test”, Journal ofMarketing Research, Vol. X, May, pp. 184-90.
Bitner, M. (1992), “Servicescapes: the impact of physical surroundings on customers andemployees”, Journal of Marketing, Vol. 56, April, pp. 57-71.
Bloemer, J. and Kasper, H. (1995), “The complex relationship between consumer satisfaction andbrand loyalty”, Journal of Economic Psychology, Vol. 16 No. 2, pp. 311-29.
Bloemer, J., de Ruyter, K. and Wetzels, M. (1999), “Linking perceived service quality and serviceloyalty: a multi-dimensional perspective”, European Journal of Marketing, Vol. 33Nos 11/12, pp. 1082-95.
Brady, M.K. and Cronin, J. (2001), “Some new thoughts on conceptualizing perceived servicequality: a hierarchical approach”, Journal of Marketing, Vol. 65, July, pp. 34-49.
Brady, M.K., Knight, G., Cronin, J., Tomas, G., Hult, M. and Keillor, B.D. (2005), “Removing thecontextual lens: a multinational, multi-setting comparison of service evaluation models”,Journal of Retailing, Vol. 81 No. 3, pp. 215-30.
Chang, K. (2000), “The impact of perceived physical environments on customers’ satisfaction andreturn intentions”, Journal of Professional Services Marketing, Vol. 21 No. 2, pp. 75-85.
Chen, Z. and Dubinsky, A. (2003), “A conceptual model of perceived customer value in e-commerce:a preliminary investigation”, Psychology & Marketing, Vol. 20, April, pp. 323-47.
Chiou, J.-S., Droge, C. and Hanvanich, S. (2002), “Does customer knowledge affect how loyalty isformed?”, Journal of Service Research, Vol. 5 No. 2, pp. 113-24.
The role ofperceived risk in
loyalty
47
Choi, K.S., Lee, H., Kim, C. and Lee, S. (2005), “The service quality dimensions and patientsatisfaction relationships in South Korea: comparisons across gender, age and types ofservices”, Journal of Services Marketing, Vol. 19 No. 3, pp. 104-49.
Churchill, G.A. (1979), “A paradigm for developing better measures of marketing constructs”,Journal of Marketing Research, Vol. 16, February, pp. 64-73.
Churchill, G.A. and Surprenant, C. (1982), “An investigation into the determinants of customersatisfaction”, Journal of Marketing Research., Vol. XIX, November, pp. 491-504.
Cronin, J., Brady, M. and Hult, G. (2000), “Assessing the effects of quality, value, and customersatisfaction on consumer behavioral intentions in service environments”, Journal ofRetailing, Vol. 76 No. 2, pp. 193-218.
Crosby, L., Evans, K. and Cowles, D. (1990), “Relationship quality in services selling:an interpersonal influence perspective”, Journal of Marketing, Vol. 54, July, pp. 68-81.
Dagger, T., Sweeney, J. and Johnson, L. (2007), “A hierarchical model of health servicequality-scale development and investigation of an integrated model”, Journal of ServiceResearch, Vol. 10 No. 2, pp. 123-42.
Danaher, P.J., Conroy, D.M. and McColl-Kennedy, J.R. (2008), “Who wants a relationship anyway?Conditions when consumers expect a relationship with their service provider”, Journal ofService Research, Vol. 11 No. 1, pp. 43-62.
Dowling, G.R. and Staelin, R. (1994), “A model of perceived risk and intended risk-handlingactivity”, Journal of Consumer Research, Vol. 21, June, pp. 119-34.
Evanschitzky, H. and Wunderlich, M. (2006), “An examination of moderator effects in thefour-stage loyalty model”, Journal of Service Research, Vol. 8 No. 4, pp. 330-45.
Fitzgibbon, C. and White, L. (2005), “The role of attitudinal loyalty in the development ofcustomer relationship management strategy within service firms”, Journal of FinancialServices Marketing, Vol. 9 No. 3, pp. 214-30.
Fornell, C. and Larcker, D. (1981), “Evaluating structural equation models with unobservablevariables and measurement error”, Journal of Marketing Research, Vol. XVIII, February,pp. 39-50.
Grewal, D., Iyer, G., Gotlieb, J. and Levy, M. (2007), “Developing a deeper understanding ofpost-purchase perceived risk and behavioral intentions in a service setting”, Journal of theAcademy of Marketing Science, Vol. 35 No. 2, pp. 250-8.
Guo, C. (2001), “A review on consumer external search: amount and determinants”, Journal ofBusiness and Psychology, Vol. 15 No. 3, pp. 505-19.
Hausman, A.V. (2003), “Professional service relationships: a multi-context study of factorsimpacting satisfaction, re-patronization, and recommendations”, Journal of ServicesMarketing, Vol. 17 No. 3, pp. 226-42.
Heskett, J., Sasser, E. and Schlesinger, L. (1997), The Service Profit Chain: How LeadingCompanies Link Profit and Growth to Loyalty, Satisfaction and Value, The Free Press,New York, NY.
Hoch, S.J. and Deighton, J. (1989), “Managing what consumers learn from experience”, Journal ofMarketing, Vol. 53, April, pp. 1-20.
Homburg, C., Wieseke, J. and Bornemann, T. (2009), “Implementing the marketing concept at theemployee-customer interface: the role of customer need knowledge”, Journal of Marketing,Vol. 73, July, pp. 64-81.
Horton, R.L. (1976), “The structure of perceived risk”, Journal of the Academy of MarketingScience, Vol. 4 No. 4, pp. 694-706.
MIP30,1
48
Hsin, K.C., Huery, R.Y. and Bi, F.J. (2008), “The effects of service quality, customer perceivedvalue, customer satisfaction on behavioral intentions: a study of mobile value-addedservices in Taiwan”, The Business Review, Vol. 10 No. 1, pp. 129-35.
Hu, H., Kandampully, J. and Juwaheer, T.D. (2009), “Relationships and impacts of service quality,perceived value, customer satisfaction, and image: an empirical study”, The ServiceIndustries Journal, Vol. 29 No. 2, pp. 111-25.
Hu, L. and Bentler, P.M. (1999), “Cutoff criteria for fit indexes in covariance structure analysis:conventional criteria versus new alternatives”, Structural Equation Modeling, Vol. 6 No. 1,pp. 1-55.
Hume, M. and Mort, G.S. (2010), “The consequence of appraisal emotion, service quality,perceived value and customer satisfaction on repurchase intent in the performing arts”,The Journal of Services Marketing, Vol. 24 No. 2, pp. 170-82.
Jamal, A. and Anastasiadou, K. (2009), “Investigating the effects of service quality dimensionsand expertise on loyalty”, European Journal of Marketing, Vol. 43 Nos 3/4, pp. 398-420.
Jawahar, P.D. and Maheswari, R. (2009), “Service perception: emotional attachment as a mediatorof the relationship between service performance and emotional brand”, The IUP Journal ofMarketing Management, Vol. VIII No. 2, pp. 7-22.
Joreskog, K. and Sorbom, D. (1993), LISREL 8: Structural Equation Modeling with the SIMPLISCommand Language, Scientific Software International, Lincolnwood, IL.
Lai, F., Griffin, M. and Babin, B. (2009), “How quality, value, image, and satisfaction createloyalty at a Chinese telecom”, Journal of Business Research, Vol. 62 No. 10, pp. 980-6.
Lam, S.Y., Shankar, V., Erramilli, M.K. and Murthy, B. (2004), “Customer value, satisfaction,loyalty, and switching costs: an illustration from a business-to-business service context”,Journal of the Academy of Marketing Science, Vol. 32 No. 3, pp. 293-311.
Lee, H., Lee, Y. and Yoo, D. (2000), “The determinants of perceived service quality and itsrelationship with satisfaction”, The Journal of Services Marketing, Vol. 14 No. 3, pp. 217-31.
Li, D., An, S. and Yang, K. (2008), “Exploring Chinese consumer repurchasing intention forservices: an empirical investigation’”, Journal of consumer Behaviour, Vol. 7 No. 6,pp. 448-60.
Lovelock, C. and Wirtz, J. (2007), Services Marketing – People, Technology, Strategy, PearsonPrentice Hall, London.
McBane, D.A. (1995), “Empathy and the salesperson: a multidimensional perspective”,Psychology and Marketing, Vol. 12 No. 4, pp. 349-70.
McDougall, G.H.G. and Levesque, T. (2000), “Customer satisfaction with services: puttingperceived value into the equation”, The Journal of Services Marketing, Vol. 14 No. 5,pp. 392-410.
Mehrabian, A. and Russell, J. (1974), An Approach to Environmental Psychology, MIT Press,Cambridge, MA.
Mitchell, V.M. (1998), “A role of consumer risk perceptions in grocery retailing”, British FoodJournal, Vol. 100 No. 4, pp. 171-83.
Mitchell, V.M. and Greatorex, M. (1993), “Risk perception and reduction in the purchase ofconsumer services”, The Service Industries Journal, Vol. 13 No. 4, pp. 179-200.
Mitra, K., Reiss, M. and Capella, L. (1999), “An examination of perceived risk, information searchand behavioural intentions in search, experience and credence services”, The Journal ofServices Marketing, Vol. 13 No. 3, pp. 208-28.
The role ofperceived risk in
loyalty
49
Mittal, B. and Lasser, W.M. (1998), “Why do customers switch? The dynamics of satisfactionversus loyalty”, The Journal of Services Marketing, Vol. 12 No. 3, pp. 177-94.
Monroe, K. (1991), Pricing – Making Profitable Decisions, McGraw-Hill, Maidenhead.
Ndubisi, N.O., Malhotra, N.K. and Wah, C.K. (2009), “Relationship marketing, customersatisfaction and loyalty: a theoretical and empirical analysis from an Asian perspective”,Journal of International Consumer Marketing, Vol. 21 No. 1, pp. 5-16.
Nunnally, J. and Bernstein, I. (1994), Psychometric Theory, McGraw-Hill, Maidenhead.
Oliver, R. (1980), “A cognitive model of the antecedents and consequences of satisfactiondecisions”, Journal of Marketing Research, Vol. XVII, November, pp. 460-9.
Oliver, R. (1993), “A conceptual model of service quality and service satisfaction: compatiblegoals, different concepts”, in Swartz, T., Bowen, D. and Brown, S. (Eds), Advances inServices Marketing and Management, Vol. 2, JAI Press, Greenwich, CT, pp. 65-86.
Oliver, R. (1997), Satisfaction: A Behavioral Perspective on the Consumer, McGraw-Hill,Maidenhead.
Oliver, R. (1999), “Whence customer loyalty?”, Journal of Marketing, Vol. 63, special issue,pp. 33-44.
Parasuraman, A., Zeithaml, V. and Berry, L. (1991), “Refinement and reassessment of theSERVQUAL scale”, Journal of Retailing, Vol. 67 No. 4, pp. 420-50.
Parasuraman, A., Zeithaml, V. and Berry, L. (1994), “Reassessment of expectations as acomparison standard in measuring service quality: implications for future research”,Journal of Marketing, Vol. 58, April, pp. 111-24.
Olsen, S., Wilcox, J. and Olsson, U. (2005), “Consequences of ambivalence on satisfaction andloyalty”, Psychology & Marketing, Vol. 22, March, pp. 247-69.
Pollack, B.L. (2009), “Linking the hierarchical service quality model to customer satisfaction andloyalty”, The Journal of Services Marketing, Vol. 23 No. 1, pp. 42-50.
Ravald, A. and Gronroos, C. (1996), “The value concept and relationship marketing”, EuropeanJournal of Marketing, Vol. 30 No. 2, pp. 19-30.
Rust, R.T. and Oliver, R.L. (1994), “Service quality insights and managerial implications from thefrontier”, in Rust, R.T. and Oliver, R.L. (Eds), Service Quality: New Directions in Theoryand Practice, Sage, Thousand Oaks, CA, pp. 1-19.
Sachdev, S.B. and Verma, H.V. (2004), “Relative importance of service quality dimensions:a multisectoral study”, Journal of Services Research, Vol. 4 No. 1, pp. 93-117.
Sheth, J.N. and Parvatiyar, A. (1995), “Relationship marketing in consumer markets: antecedentsand consequences”, Journal of the Academy of Marketing Science, Vol. 23 No. 4, pp. 255-71.
Spence, H.E., Engel, J.F. and Blackwell, R.D. (1970), “Perceived risk in mail-order and retail storebuying”, Journal of Marketing Research, Vol. 7, August, pp. 364-9.
Sweeney, J. and Soutar, G.N. (2001), “Consumer perceived value: the development of a multipleitem scale”, Journal of Retailing, Vol. 77 No. 2, pp. 203-20.
Sweeney, J., Soutar, G. and Johnson, L. (1999), “The role of perceived risk in the quality-valuerelationship: a study in a retail environment”, Journal of Retailing, Vol. 75 No. 1, pp. 77-105.
Szeinbach, S.L., Barnes, J.H., Blackwell, S.A., Horine, J.E. and Vandewalle, J. (1999), “The questfor value”, Pharmaceutical Executive, pp. 94-100, January.
Tam, J.L.M. (2004), “Customer satisfaction, service quality and perceived value: an integrativemodel”, Journal of Marketing Management, Vol. 20 Nos 7-8, pp. 897-917.
Teas, K. (1993), “Expectations, performance evaluation, and consumers’ perceptions of quality”,Journal of Marketing, Vol. 58, January, pp. 132-9.
MIP30,1
50
Teas, K. and Agarwal, S. (2000), “The effects of extrinsic product cues on consumers’ perceptionsof quality, sacrifice, and value”, Journal of the Academy of Marketing Science, Vol. 28 No. 2,pp. 280-92.
Varki, S. and Colgate, M. (2001), “The role of price perceptions in an integrated model ofbehavioral intentions”, Journal of Service Research, Vol. 3 No. 3, pp. 232-40.
Vlachos, P.A., Theotokis, A., Pramatari, K. and Vrechopoulos, A. (2010), “Consumer-retaileremotional attachment: some antecedents and the moderating role of attachment anxiety”,European Journal of Marketing, Vol. 44 Nos 9/10, pp. 1478-99.
Voorhees, C.M., Baker, J., Bourdeau, B.L., Brocato, E.D. and Cronin, J.J. (2009), “It depends:moderating the relationships among perceived waiting time, anger, and regret”, Journal ofService Research, Vol. 12 No. 2, pp. 138-55.
Wang, Y., Lo, H.P., Chi, R. and Yang, Y. (2004), “An integrated framework for customer valueand customer-relationship-management performance: a customer-based perspective fromChina”, Managing Service Quality, Vol. 14 Nos 2/3, pp. 169-82.
Woodruff, R. (1997), “Customer value: the next source for competitive advantage”, Journal of theAcademy of Marketing Science, Vol. 25 No. 2, pp. 139-53.
Yang, Z. and Peterson, R.T. (2004), “Customer perceived value, satisfaction, and loyalty: the roleof switching costs”, Psychology & Marketing, Vol. 21, October, pp. 799-822.
Yi, Y. (1990), “A critical review of consumer satisfaction”, in Zeithaml, V. (Ed.), Review ofMarketing, Vol. 4, American Marketing Association, Chicago, IL, pp. 68-123.
Yi, Y. and Gong, T. (2009), “An integrated model of customer social exchange relationship: themoderating role of customer experience”, The Service Industries Journal, Vol. 29 No. 11,pp. 1513-28.
Yi, Y. and La, S. (2004), “What influences the relationship between customer satisfaction andrepurchase intention? Investigating the effects of adjusted expectations and customerloyalty”, Psychology & Marketing, Vol. 21, May, pp. 351-73.
Zeithaml, V. (1981), “How consumer evaluations processes differ between goods and services”, inDonnelly, J.H. and George, W.R. (Eds), Marketing of Services, American MarketingAssociation, Chicago, IL, pp. 39-47.
Zeithaml, V. (1988), “Consumer perceptions of price, quality and value: a means-end model andsynthesis of evidence”, Journal of Marketing, Vol. 52, July, pp. 2-22.
Zeithaml, V., Berry, L. and Parasuraman, A. (1996), “The behavioral consequences of servicequality”, Journal of Marketing, Vol. 60, April, pp. 31-46.
Zeithaml, V., Bitner, M. and Gremler, D. (2009), Services Marketing – Integrating Customer FocusAcross The Firms, McGraw-Hill, Maidenhead.
Zhou, L. (2004), “A dimension-specific analysis of performance-only measurement of servicequality and satisfaction in China’s retail banking”, The Journal of Services Marketing,Vol. 18 No. 7, pp. 534-46.
Appendix. List of the measurement itemsTechnical quality(1 ¼ “strongly disagree” to 7 ¼ “strongly agree”).
. The hairstylist demonstrated good knowledge about hair care and treatment.
. The hairstylist had high technical competence.
. The hairstylist provided appropriate hair care and treatment.
The role ofperceived risk in
loyalty
51
Empathy. The hairstylist had my best interests at heart.. The hairstylist was sensitive to my feelings.. The hairstylist treated me with respect.
Physical environment. The physical environment at the hair salon was comfortable.. The atmosphere at the hair salon was pleasant.. The hair salon was clean and hygienic.
Satisfaction. I am satisfied with the hairstylist and the service he/she provided.. My feelings towards the hairstylist are positive.. The performance of the hairstylist met my expectations.
Perceived risk. The service was risky in terms of how it would be performed.. There was a chance that there would be something wrong in the service process and
outcome.. The service outcome and effect were difficult to predict.
Perceived value. Based on the service you received, how did you perceive the price you paid?. (Seven-point semantic differential scale, value for money/not value for money,
Loyalty intentions(1 ¼ “definitely will not” to 7 ¼ “definitely will”).
. I will strongly recommend the hairstylist to my family and friends if they need hair careand treatment.
. I will say positive things about the hairstylist to my family and friends.
. I will continue seeing the hairstylist for hair care and treatment if there is a need.
. I will consider the hairstylist my first choice if I need to choose again.
About the authorJackie Lai-Ming Tam (PhD) is an Assistant Professor in the Department of Management andMarketing of The Hong Kong Polytechnic University. Dr Tam’s research interests include servicesmarketing and consumer behavior. Her research work has been published in Journal of ServiceResearch, Journal of Services Marketing, Journal of Marketing Management, Psychology andMarketing, Journal of Business Research, Marketing Intelligence & Planning and InternationalMarketing Review. Jackie Lai-Ming Tam can be contacted at: [email protected]
MIP30,1
52
To purchase reprints of this article please e-mail: [email protected] visit our web site for further details: www.emeraldinsight.com/reprints