Page 1
ORIGINAL PAPER
The Modified Glasgow Outcome Score for the predictionof outcome in patients after cardiac arrest: a prospective clinicalproof of concept study
Obaida R. Rana • Jorg W. Schroder • Julia S. Kuhnen • Esra Saygili •
Christopher Gemein • Matthias D. H. Zink • Patrick Schauerte • Johannes Schiefer •
Robert H. G. Schwinger • Joachim Weis • Nikolaus Marx • Malte Kelm •
Christian Meyer • Erol Saygili
Received: 17 August 2011 / Accepted: 26 January 2012 / Published online: 10 February 2012
� Springer-Verlag 2012
Abstract The Glasgow–Pittsburgh cerebral performance
categories (GP-CPC) and the Glasgow Outcome Score
(GOS) have been used to categorize patients according to
their neurological outcome for prognostic predictors in
patients after cardiac arrest (CA). We postulated that
inclusion of deaths without knowing the cerebral status into
the group of patients with poor outcome after CA using the
GP-CPC and GOS will lead to dilution of the prognostic
power of the investigated biochemical marker. The present
study was conducted to verify this issue by employing a
modified outcome score, which we termed as Modified
Glasgow Outcome Score (MGOS). In the present study, 97
patients were enrolled in a prospective manner. Serum NSE
and S100B levels were measured daily for 7 days after
admission to the intensive care unit. Neurological outcome
was assessed by employing the GOS and MGOS after
6 months. By employing the GOS, 46 patients were cate-
gorized into the group of patients with poor outcome and
51 patients survived with good neurological outcome.
Patients who died without certified brain damage or with
unknown cerebral status after CA (n = 20) were separated
from patients with poor outcome in the MGOS. The
magnitude of NSE (S100B) elevation in patients with poor
outcome categorized by the MGOS was approximately
1.7-fold (1.5) higher as compared with patients divided by
the GOS. The mean calculated sensitivities and area under
the curve values of NSE and S100B predicting poor out-
come classified by the MGOS were significantly higher as
compared with the GOS. Conclusively, inclusion of deaths
without certified brain damage or with unknown cerebral
status into the group of patients with poor outcome will
lead to underestimation of the prognostic power of inves-
tigated biochemical markers such as NSE and S100B. The
MGOS will help to avoid this bias.
Keywords Cardiac arrest � Cardiopulmonary
resuscitation � Glasgow–Pittsburgh cerebral performance
categories (GP-CPC) � Glasgow Outcome Score (GOS) �Modified Glasgow Outcome Score (MGOS) � NSE � S100B
Introduction
Cardiac arrest (CA) is the leading cause of death in Europe
and the USA [1]. The consecution of an improved rate of
restoration of spontaneous circulation (ROSC) after car-
diopulmonary resuscitation (CPR) may be an increasing
number of patients suffering from various degrees of brain
damage after successful resuscitation [2]. Several clinical
O. R. Rana and J. W. Schroder contributed equally to this work.
O. R. Rana (&) � M. Kelm � C. Meyer � E. Saygili
Division of Cardiology, Pulmonology and Vascular Medicine,
University Hospital Dusseldorf, Moorenstrasse 5,
40225 Dusseldorf, Germany
e-mail: [email protected]
J. W. Schroder � J. S. Kuhnen � E. Saygili � C. Gemein �M. D. H. Zink � P. Schauerte � N. Marx
Department of Cardiology, RWTH Aachen University,
Aachen, Germany
J. Schiefer
Department of Neurology, RWTH Aachen University,
Aachen, Germany
R. H. G. Schwinger
Medical Clinic II, Klinikum Weiden, Weiden, Germany
J. Weis
Institute of Neuropathology, RWTH Aachen University,
Aachen, Germany
123
Clin Res Cardiol (2012) 101:533–543
DOI 10.1007/s00392-012-0423-7
Page 2
outcome scores, electrophysiological techniques, and
imaging methods have attempted to predict the presence,
degree, and course of neurological outcome after CA [3].
This has recently been complemented by neural tissue-
derived biomarkers such as neuron-specific enolase (NSE)
and S100B [4].
The Utstein Consensus Conference participants rec-
ommend the use of the Glasgow–Pittsburgh cerebral
performance categories (GP-CPC) to document the out-
come of patients after CA and ROSC [5]. However, we
recently have demonstrated that several studies evaluating
biochemical markers and electrophysiological techniques
for the prediction of outcome after CA are based on the
Glasgow Outcome Score (GOS) [6]. Although both scores
provide comparative categories, a significant number of
outcome studies using the GOS do not include patients
with severe cerebral disability (GOS 3) to the category of
poor outcome [6]. In contrast, studies applying the GP-
CPC included patients with severe cerebral disability
(GP-CPC 3) to the group of patients with poor outcome.
Furthermore, while the GP-CPC defines death, certified
brain death, or death by traditional criteria as worst cat-
egory (GP-CPC 5), the GOS is less specific and defines
the worst outcome level (GOS 1) simply as death irre-
spective of whether this was due to brain damage or other
causes or a combination of both [5, 7]. Unfortunately,
many clinical studies using the GP-CPC did not restrict
GP-CPC category five only to certified brain death, which
may have diluted sensitivity of this score and its param-
eters to predict the individual neurologic outcome [6]. We
have recently postulated that inclusion of deaths without
certified brain damage to the group of patients with poor
outcome will lead to underestimation of sensitivity and
cut-off values of NSE for the prediction of poor outcome
[6]. We speculated that a modified GOS or GP-CPC score
might help to avoid this bias. Therefore, a prospective
observational study was conducted to evaluate a modified
outcome score, which we termed as Modified Glasgow
Outcome Score (MGOS), by the use of which the well-
established biochemical markers NSE and S100B were
investigated for the prediction of neurological outcome in
patients after CA.
Methods
Patients
The study was performed between March 2009 and July
2010 at the intensive care unit (ICU) of the RWTH Aachen
University, Germany. A total of 97 consecutive adult
patients with documented out-of-hospital CA with primary
successful ROSC were prospectively enrolled. The
following patients were eligible: witnessed out-of-hospital
CA of presumed cardiac origin; absence of previous neu-
rological disease, and pregnancy. Patients were included as
soon as possible, but revascularizing procedures and sta-
bilization took precedence.
Standard care
All patients were admitted to the ICU, monitored and
treated according to international standards. All patients
were intubated and mechanically ventilated [8]. Patients
were sedated using midazolam and/or propofol and
received adequate analgesia with fentanyl. The procedure
of mild hypothermia was performed according to interna-
tional standards with the Cool Gard 3000 (Zoll�, USA) and
Hilotherm clinic (Hilotherm� GmbH, Germany) cooling
systems [9–12]. Vasoactive or inotropic support, usually
norepinephrine or dobutamine was administered if
necessary.
Study design
Approval for the study was obtained from the relevant
ethics committee at the RWTH Aachen University, Ger-
many. This study has been performed in accordance with
the ethical standards laid down in the 1964 Declaration of
Helsinki. Because all procedures described below were
within the normal daily intensive care routine with no risk
to the patients, the institutional review board therefore
waived the need for informed patient consent. After arrival
and stabilization of patients in the ICU and approval of
inclusion criteria, serum samples for the determination of
NSE and S100B levels were taken on admission and then
every 24 h over a time period of 7 days from the super-
natant of blood collected for routine laboratory analyses.
Blood samples during CPR and after ROSC were taken by
an independent physician who was not responsible for the
patient’s care. Arterial blood gas analysis of partial pres-
sure of oxygen (PO2), partial pressure of carbon dioxide
(PCO2), lactate, pH, and blood glucose were analyzed on
admission. Furthermore, serum creatine kinase was asses-
sed on admission. Neurological outcome was assessed
6 months after CPR by use of the outcome scores as
described below.
Neurological outcome
Cerebral function was evaluated 6 months after CA by
employing the GOS as described by Janett and Bond [7]
(Table 1) and a modified six-point outcome score, which
we termed as MGOS (Table 2).
For statistical purposes, outcome categories of both
scores were split into 2–3 groups:
534 Clin Res Cardiol (2012) 101:533–543
123
Page 3
GOS
Poor: consisted of patients who died of any cause or
remained in a persistent vegetative state (GOS 1–2).
Good: consisted of patients who regained consciousness
(GOS 3–5).
MGOS
Unclear: consisted of patients who died without certified
brain damage (MGOS 0).
Poor: consisted of patients who died with certified brain
damage or remained in a persistent vegetative state
(MGOS 1–2).
Good: consisted of patients who regained consciousness
(MGOS 3–5).
Assessment of brain damage
The diagnosis of global hypoxic brain damage was certified
by a study independent senior neurologist from the
Department of Neurology, RWTH Aachen University,
Germany, after extensive clinical examination and on
behalf of the results of cranial CT and/or transcranial
doppler (TCD) ultrasonography and/or somatosensory
evoked potentials (SSEP) and/or EEG. Only patients who
died with documented brain damage were included in
MGOS 1. Patients who died without certified brain dam-
age, either because of a lack of diagnostic evaluation, e.g.,
because of hemodynamic instability of the patient, or
without signs of global hypoxic brain damage after
extensive clinical and diagnostic evaluations as described
above were classified as MGOS 0. During application of
the GOS classification, both categories (MGOS 0 and
MGOS 1) were summarized as GOS 1. Patients with or
without documented brain damage who remained in the
persistent vegetative state were classified as MGOS 2 or
GOS 2.
NSE and S100B measurements
Blood samples were taken from patients with an arterial line
and collected in a standard serum tube. Samples were
immediately centrifuged for 10 min at 1,500g. Subsequently,
NSE and S100B concentrations were both measured by an
electrochemiluminescence immunoassay (ECLIA). A bio-
tinylated monoclonal NSE/S100B-specific antibody and a
monoclonal NSE/S100B-specific antibody labeled with a
ruthenium complex (Tris{2,2-bipyridyl}ruthenium(II)) form
a sandwich complex. Voltage-induced chemiluminescent
emissions were measured by a photomultiplier. Results are
determined via a calibration curve which is instrument-spe-
cifically generated by two-point calibration and a master
curve provided via the reagent barcode (COBAS�, Roche
Diagnostics GmbH, Germany).
Statistical analysis
All data are expressed as mean ± 1 SEM unless otherwise
stated. A one-way analysis of variance (ANOVA) with post-
hoc bonferroni’s test for multiple comparisons of means was
used for repeated measures. The Student’s t test was applied
for quantitative variables. A P value\0.05 was considered as
significant. Receiver operating characteristic (ROC) curve
analysis and the derived area under the curve (AUC) statistic
provide a global and standardized appreciation of the accu-
racy of a biochemical marker for predicting an event. ROC
curves were generated by plotting the sensitivity against one-
specificity. Statistical analysis was performed with the IBM
SPSS Statistics 19 software for windows.
Results
Baseline characteristics
Of the 97 patients evaluated, the neurological outcome
assessed by employing the GOS after 6 months was as
follows: 39 died of any reason (GOS 1, 40.2%), seven
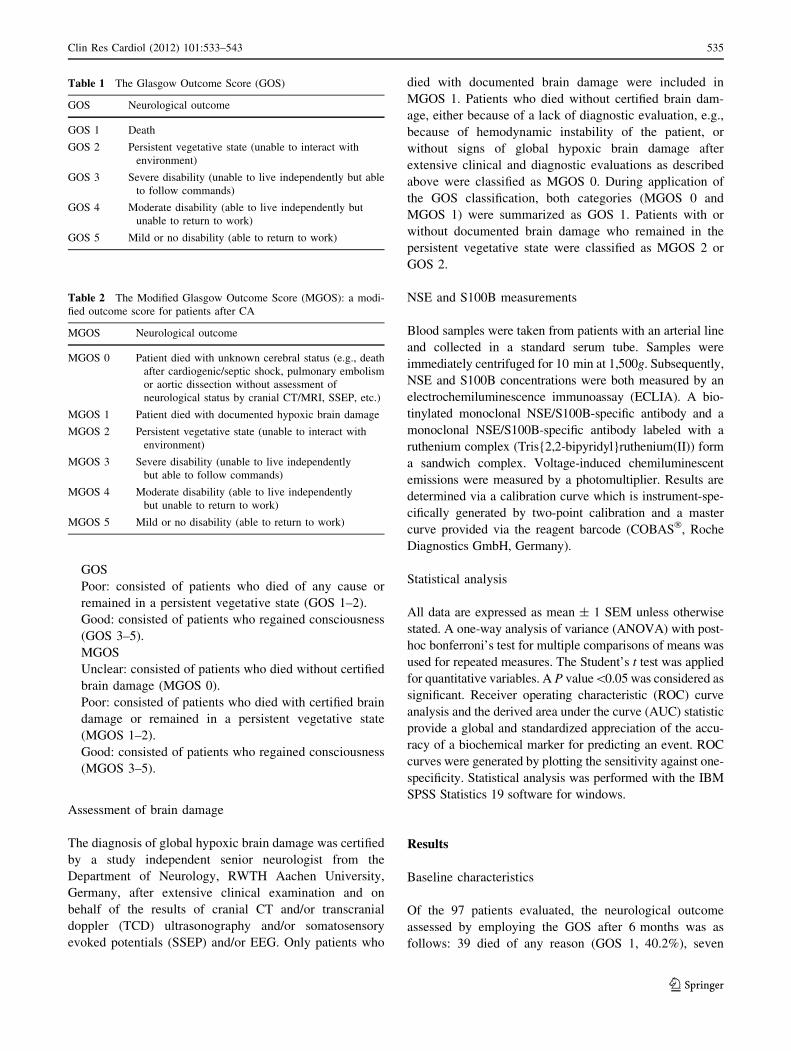
Table 1 The Glasgow Outcome Score (GOS)
GOS Neurological outcome
GOS 1 Death
GOS 2 Persistent vegetative state (unable to interact with
environment)
GOS 3 Severe disability (unable to live independently but able
to follow commands)
GOS 4 Moderate disability (able to live independently but
unable to return to work)
GOS 5 Mild or no disability (able to return to work)
Table 2 The Modified Glasgow Outcome Score (MGOS): a modi-
fied outcome score for patients after CA
MGOS Neurological outcome
MGOS 0 Patient died with unknown cerebral status (e.g., death
after cardiogenic/septic shock, pulmonary embolism
or aortic dissection without assessment of
neurological status by cranial CT/MRI, SSEP, etc.)
MGOS 1 Patient died with documented hypoxic brain damage
MGOS 2 Persistent vegetative state (unable to interact with
environment)
MGOS 3 Severe disability (unable to live independently
but able to follow commands)
MGOS 4 Moderate disability (able to live independently
but unable to return to work)
MGOS 5 Mild or no disability (able to return to work)
Clin Res Cardiol (2012) 101:533–543 535
123
Page 4
developed a persistent vegetative state (GOS 2, 7.2%), 12
survived with severe disability (GOS 3, 12.4%), 22 sur-
vived with moderate disability (GOS 4, 22.7%), and 17
survived with mild or no disability (GOS 5, 17.5%). For
statistical purposes, outcome categories were split into the
group of patients with poor (GOS 1 ? 2, n = 46) and good
outcome (GOS 3 ? 4 ? 5, n = 51). The clinical and
demographic characteristics of patients categorized by the
GOS are shown in Table 3. Briefly, patients with poor
outcome were significantly older compared with patients
with good neurological outcome. Furthermore, patients
with poor outcome demonstrated significantly higher arte-
rial CO2 partial pressure levels, serum lactate and blood
glucose levels, APACHE II scores, time of hypoxia, mean
duration of CPR, and required epinephrine doses before
ROSC compared with patients with good outcome, while
serum pH, numbers of defibrillation before ROSC, and
days of mechanical ventilation were significantly lower in
the poor outcome group. No significant differences were
found between patients of poor and good outcome
receiving mild hypothermia. In the poor outcome group 34
of 46 patients were treated by mild hypothermia. Of note,
from the 12 patients precluded from mild hypothermia, 9
patients died shortly after CPR and 3 patients were omitted
from mild hypothermia because of short time of hypoxia
and CPR. Consistently, due to short time of hypoxia and
CPR, 11 of 51 patients from the good outcome group were
precluded from mild hypothermia. Regarding the past
medical history, patients in the poor outcome group
showed a significantly higher prevalence of diabetes and
peripheral artery disease compared with patients with good
outcome. The number of asystoles as initial rhythm in first
ECG was significantly higher in the poor outcome group
compared with patients with good outcome, whereas in the
good outcome group ventricular fibrillation as initial
rhythm was recorded in a significantly higher quantity.
In the same 97 patients mentioned above, the neuro-
logical outcome was assessed by employing the MGOS
6 months after CPR. Because the categorization of patients
with good outcome in the MGOS is similar to the GOS, no
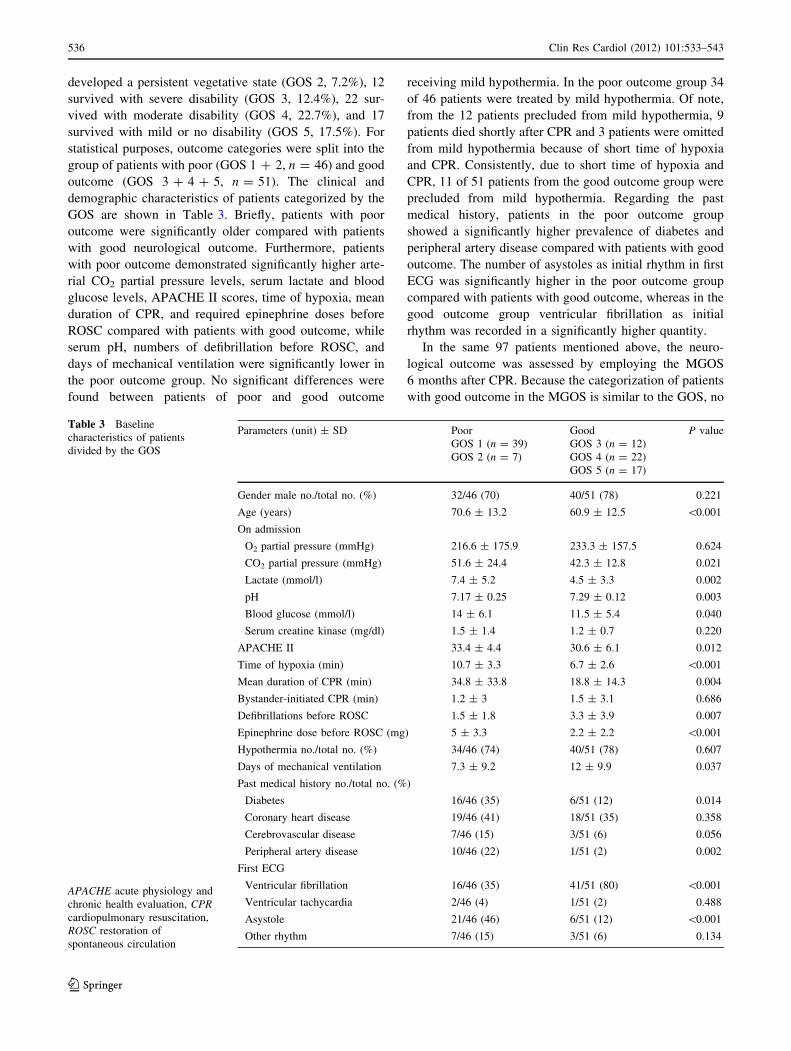
Table 3 Baseline
characteristics of patients
divided by the GOS
APACHE acute physiology and
chronic health evaluation, CPRcardiopulmonary resuscitation,
ROSC restoration of
spontaneous circulation
Parameters (unit) ± SD Poor
GOS 1 (n = 39)
GOS 2 (n = 7)
Good
GOS 3 (n = 12)
GOS 4 (n = 22)
GOS 5 (n = 17)
P value
Gender male no./total no. (%) 32/46 (70) 40/51 (78) 0.221
Age (years) 70.6 ± 13.2 60.9 ± 12.5 \0.001
On admission
O2 partial pressure (mmHg) 216.6 ± 175.9 233.3 ± 157.5 0.624
CO2 partial pressure (mmHg) 51.6 ± 24.4 42.3 ± 12.8 0.021
Lactate (mmol/l) 7.4 ± 5.2 4.5 ± 3.3 0.002
pH 7.17 ± 0.25 7.29 ± 0.12 0.003
Blood glucose (mmol/l) 14 ± 6.1 11.5 ± 5.4 0.040
Serum creatine kinase (mg/dl) 1.5 ± 1.4 1.2 ± 0.7 0.220
APACHE II 33.4 ± 4.4 30.6 ± 6.1 0.012
Time of hypoxia (min) 10.7 ± 3.3 6.7 ± 2.6 \0.001
Mean duration of CPR (min) 34.8 ± 33.8 18.8 ± 14.3 0.004
Bystander-initiated CPR (min) 1.2 ± 3 1.5 ± 3.1 0.686
Defibrillations before ROSC 1.5 ± 1.8 3.3 ± 3.9 0.007
Epinephrine dose before ROSC (mg) 5 ± 3.3 2.2 ± 2.2 \0.001
Hypothermia no./total no. (%) 34/46 (74) 40/51 (78) 0.607
Days of mechanical ventilation 7.3 ± 9.2 12 ± 9.9 0.037
Past medical history no./total no. (%)
Diabetes 16/46 (35) 6/51 (12) 0.014
Coronary heart disease 19/46 (41) 18/51 (35) 0.358
Cerebrovascular disease 7/46 (15) 3/51 (6) 0.056
Peripheral artery disease 10/46 (22) 1/51 (2) 0.002
First ECG
Ventricular fibrillation 16/46 (35) 41/51 (80) \0.001
Ventricular tachycardia 2/46 (4) 1/51 (2) 0.488
Asystole 21/46 (46) 6/51 (12) \0.001
Other rhythm 7/46 (15) 3/51 (6) 0.134
536 Clin Res Cardiol (2012) 101:533–543
123
Page 5
differences were found in the baseline characteristics of
these patients. However, all patients who died with
uncertified brain damage (MGOS 0, n = 26) were exclu-
ded from the group of poor outcome. Of these 26 patients
(26.8%) categorized as MGOS 0, 17 patients (17.5%) died
as a consequence of a cardiogenic shock, 7 patients (7.2%)
died by a combination of cardiogenic and septic shock and
2 patients (2.1%) died after septic shock. The poor outcome
group consisted of 13 patients who died with certified
hypoxic brain damage (MGOS 1, 13.4%) and of 7 patients
who developed and remained in a persistent vegetative
state (MGOS 2, 7.2%). According to the GOS classifica-
tion, outcome categories were split into the group of
patients with unclear (MGOS 0, n = 26), poor (MGOS
1 ? 2, n = 20) and good neurological outcome (MGOS
3 ? 4 ? 5, n = 51). The clinical and demographic char-
acteristics of patients categorized by the MGOS are shown
in Table 4. Patients with good outcome were significantly
younger compared with patients with unclear outcome,
while no significance concerning age could be observed
among the other outcome groups. Likewise, patients with
good outcome had significantly lower arterial CO2 partial
pressure levels, serum lactate levels, APACHE II scores,
time of hypoxia, mean durations of CPR and, required
epinephrine doses before ROSC, but significantly higher
days of mechanical ventilation compared with patients in
the unclear outcome group. Furthermore, patients with
good outcome had significantly higher pH levels and
numbers of defibrillation before ROSC, but a significantly
lower mean duration of CPR and less required epinephrine
doses before ROSC compared with patients with poor and
unclear outcome. Comparison of patients with unclear and
poor outcome resulted in significantly higher time of
hypoxia and significantly lower days of mechanical
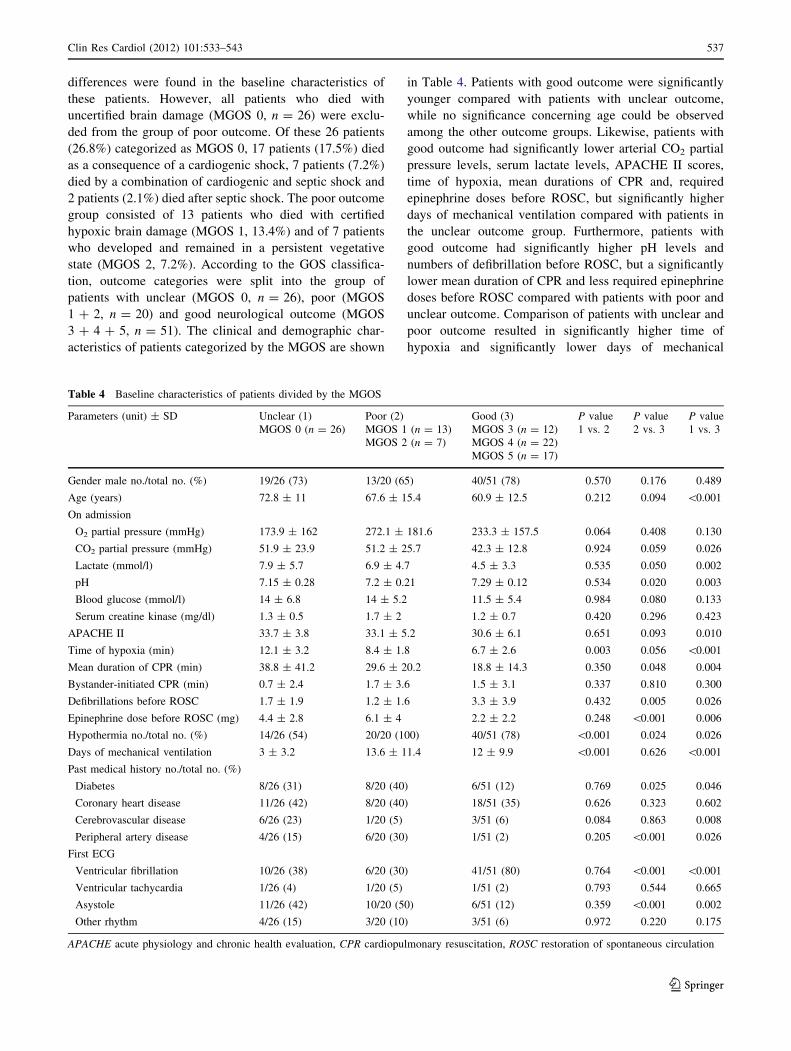
Table 4 Baseline characteristics of patients divided by the MGOS
Parameters (unit) ± SD Unclear (1)
MGOS 0 (n = 26)
Poor (2)
MGOS 1 (n = 13)
MGOS 2 (n = 7)
Good (3)
MGOS 3 (n = 12)
MGOS 4 (n = 22)
MGOS 5 (n = 17)
P value
1 vs. 2
P value
2 vs. 3
P value
1 vs. 3
Gender male no./total no. (%) 19/26 (73) 13/20 (65) 40/51 (78) 0.570 0.176 0.489
Age (years) 72.8 ± 11 67.6 ± 15.4 60.9 ± 12.5 0.212 0.094 \0.001
On admission
O2 partial pressure (mmHg) 173.9 ± 162 272.1 ± 181.6 233.3 ± 157.5 0.064 0.408 0.130
CO2 partial pressure (mmHg) 51.9 ± 23.9 51.2 ± 25.7 42.3 ± 12.8 0.924 0.059 0.026
Lactate (mmol/l) 7.9 ± 5.7 6.9 ± 4.7 4.5 ± 3.3 0.535 0.050 0.002
pH 7.15 ± 0.28 7.2 ± 0.21 7.29 ± 0.12 0.534 0.020 0.003
Blood glucose (mmol/l) 14 ± 6.8 14 ± 5.2 11.5 ± 5.4 0.984 0.080 0.133
Serum creatine kinase (mg/dl) 1.3 ± 0.5 1.7 ± 2 1.2 ± 0.7 0.420 0.296 0.423
APACHE II 33.7 ± 3.8 33.1 ± 5.2 30.6 ± 6.1 0.651 0.093 0.010
Time of hypoxia (min) 12.1 ± 3.2 8.4 ± 1.8 6.7 ± 2.6 0.003 0.056 \0.001
Mean duration of CPR (min) 38.8 ± 41.2 29.6 ± 20.2 18.8 ± 14.3 0.350 0.048 0.004
Bystander-initiated CPR (min) 0.7 ± 2.4 1.7 ± 3.6 1.5 ± 3.1 0.337 0.810 0.300
Defibrillations before ROSC 1.7 ± 1.9 1.2 ± 1.6 3.3 ± 3.9 0.432 0.005 0.026
Epinephrine dose before ROSC (mg) 4.4 ± 2.8 6.1 ± 4 2.2 ± 2.2 0.248 \0.001 0.006
Hypothermia no./total no. (%) 14/26 (54) 20/20 (100) 40/51 (78) \0.001 0.024 0.026
Days of mechanical ventilation 3 ± 3.2 13.6 ± 11.4 12 ± 9.9 \0.001 0.626 \0.001
Past medical history no./total no. (%)
Diabetes 8/26 (31) 8/20 (40) 6/51 (12) 0.769 0.025 0.046
Coronary heart disease 11/26 (42) 8/20 (40) 18/51 (35) 0.626 0.323 0.602
Cerebrovascular disease 6/26 (23) 1/20 (5) 3/51 (6) 0.084 0.863 0.008
Peripheral artery disease 4/26 (15) 6/20 (30) 1/51 (2) 0.205 \0.001 0.026
First ECG
Ventricular fibrillation 10/26 (38) 6/20 (30) 41/51 (80) 0.764 \0.001 \0.001
Ventricular tachycardia 1/26 (4) 1/20 (5) 1/51 (2) 0.793 0.544 0.665
Asystole 11/26 (42) 10/20 (50) 6/51 (12) 0.359 \0.001 0.002
Other rhythm 4/26 (15) 3/20 (10) 3/51 (6) 0.972 0.220 0.175
APACHE acute physiology and chronic health evaluation, CPR cardiopulmonary resuscitation, ROSC restoration of spontaneous circulation
Clin Res Cardiol (2012) 101:533–543 537
123
Page 6
ventilation in patients with unclear outcome. All patients in
the poor outcome group, while 14 of 26 patients in the
unclear outcome group received mild hypothermia. In the
unclear outcome group, nine patients died shortly after
CPR and three patients did not receive mild hypothermia
because of short time of hypoxia and CPR. The past
medical history and first recorded ECG data were similar to
the GOS group, when comparing patients with poor and
good outcome. In addition, the same observation was found
when comparing patients with unclear and good outcome
with the sole distinction that patients with unclear outcome
showed a significantly greater number of cerebrovascular
diseases compared to patients with good outcome.
NSE levels in patients divided by GOS and MGOS
NSE levels were investigated in patients categorized by the
GOS and MGOS (Fig. 1). Because patients who died with
unknown cerebral outcome were excluded from the group
of patients with poor outcome in the MGOS, the magnitude
of NSE elevation in patients with poor outcome in the
MGOS was higher throughout all days, especially on days
2–6, compared with patients categorized by the GOS. The
maximum of mean NSE levels of patients with poor
outcome occurred on day 3 in both outcome scores. Fur-
thermore, the mean peak NSE values of patients with poor
outcome were approximately 1.7-fold higher in the MGOS
(200 ± 45 lg/l) compared with the GOS classification
(118 ± 25 lg/l).
Prediction power of serum NSE for poor outcome
in patients divided by GOS and MGOS
Next, we measured cut-off values, sensitivity, and the area
under the curve (AUC) by use of ROC analysis. The
specificity was set 100% for the prediction of poor outcome
for NSE in each group, respectively. The cut-off values,
sensitivity, and the AUC of NSE for MGOS and GOS are
depicted in Table 5. Best prediction of NSE for poor out-
come was found on days 3 and 7 in both outcome scores
(Fig. 2). Mean cut-off values calculated from days 1 to 7 in
the MGOS group were not statistically significant as com-
pared with the GOS classification (MGOS: 60.3 ± 33.2 lg/l,
GOS: 59.6 ± 42.4 lg/l, P = 0.9). However, the mean
calculated sensitivity from days 1 to 7 of NSE predicting
poor outcome in the MGOS was significantly higher com-
pared with the GOS (MGOS: 60 ± 29.3%, GOS:
48.4 ± 22.8%, P \ 0.01). The same observation was found
0
30
60
90
120
150
180
210
240
270
peak
NS
E in
µg/
l (G
OS
)
p<0.001
goodpoor-
118
33
n=46 n=511 2 3 4 5 6 7
30
60
90
120
150
180
210
240
NS
E in
µg/
l (G
OS
)
*
***
*
days
poor (GOS 1+2)
good (GOS 3+4+5)
*
*p<0.05 vs. good
0
30
60
90
120
150
180
210
240
270
peak
NS
E in
µg/
l (M
GO
S)
p<0.001
goodpoorunclear
p<0.001
45
200
33
n=26n=20 n=511 2 3 4 5 6 7
30
60
90
120
150
180
210
240
*
*
**
*
NS
E in
µg/
l (M
GO
S)
days
unclear (MGOS 0)
poor (MGOS 1+2)
good(MGOS 3+4+5)
*
*p<0.05 vs. unclear and vs. good
A B
C D
Fig. 1 The magnitude of NSE
elevation in patients with poor
outcome was higher with the
MGOS compared with the GOS.
a NSE serum levels at different
time points after CPR and
ROSC in patients with unclear
(n = 20), poor (n = 26) and
good (n = 51) outcome
assessed by the MGOS. b NSE
peak serum levels in patients
with unclear, poor, and good
outcome assessed by the
MGOS. c NSE serum levels at
different time points in patients
with poor (n = 46) and good
(n = 51) outcome assessed by
the GOS. d NSE peak serum
levels in patients with poor and
good outcome assessed by the
GOS
538 Clin Res Cardiol (2012) 101:533–543
123
Page 7
for the mean calculated AUC value (MGOS: 0.89 ± 0.1,
GOS: 0.8 ± 0.1, P \ 0.001).
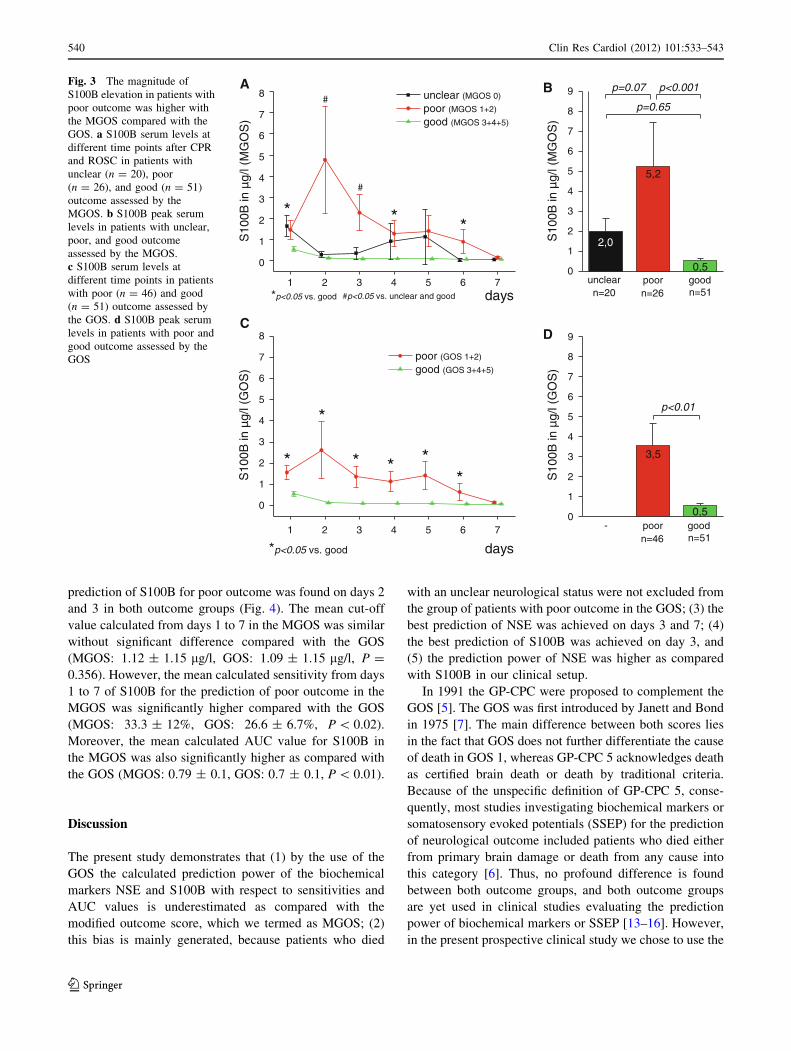
S100B levels in patients divided by GOS and MGOS
In analogy to NSE measurements, S100B levels were
investigated in patients categorized by the GOS and the
MGOS (Fig. 3). We found higher serum S100B levels in
patients with poor outcome on days 2–6 and especially on
days 2 and 3 while using the classification by the MGOS
compared with the GOS. In addition, the mean peak S100B
values in patients with poor outcome were 1.5-fold higher
in the MGOS compared with the GOS (MGOS: 5.2 ±
1.2 lg/l, GOS: 3.5 ± 1.2 lg/l). The maximum of mean
S100B levels of patients with poor outcome was achieved
on day 2 in both outcome scores.
Prediction power of serum S100B for poor outcome
in patients divided by GOS and MGOS
The cut-off values, sensitivities, and the AUC values of
S100B for MGOS and GOS are depicted in Table 6. Best
Table 5 Cut-off points,
sensitivities, specificities and
AUC values of NSE predicting
poor outcome in patients
divided by the GOS and MGOS
AUC area under the curve,
CI confidence interval
Cut-off value Specificity Sensitivity AUC 95% CI of AUC P value
GOS
NSE day 1 151.5 100 2 0.599 0.481–0.718 0.11
NSE day 2 65 100 35 0.743 0.636–0.851 \0.001
NSE day 3 57.5 100 61.5 0.807 0.704–0.909 \0.001
NSE day 4 34.5 100 59 0.834 0.740–0.927 \0.001
NSE day 5 39 100 58 0.878 0.788–0.967 \0.001
NSE day 6 39 100 56 0.855 0.763–0.947 \0.001
NSE day 7 31 100 67 0.899 0.812–0.985 \0.001
NSE peak value 137 100 36 0.766 0.668–0.864 \0.001
MGOS
NSE day 1 129 100 0 0.703 0.530–0.875 0.171
NSE day 2 70 100 43 0.825 0.696–0.953 \0.001
NSE day 3 57.5 100 80 0.922 0.828–1.000 \0.001
NSE day 4 56.5 100 73 0.938 0.873–1.000 \0.001
NSE day 5 39 100 75 0.952 0.888–1.000 \0.001
NSE day 6 39 100 69 0.936 0.863–1.000 \0.001
NSE day 7 31 100 80 0.932 0.816–1.000 \0.001
NSE peak value 137 100 53 0.878 0.759–0.997 \0.001
0,0 0,2 0,4 0,6 0,8 1,0
0,0
0,2
0,4
0,6
0,8
1,0
31
MGOS: AUC 0.932 GOS: AUC 0.899
NSE day 7
Sen
sitiv
ity (
%)
1-Specificity (%)
31
0,0 0,2 0,4 0,6 0,8 1,0
0,0
0,2
0,4
0,6
0,8
1,0
57.5
MGOS: AUC 0.922 GOS: AUC 0.807
NSE day 3
Sen
sitiv
ity (
%)
1-Specificity (%)
57.5
Fig. 2 ROC analysis of serum NSE predicting unfavorable outcome in patients divided by the MGOS and GOS. Solid circles mark NSE cut-off
points with 100% specificity. NSE cut-off values are given in lg/l. AUC denotes area under the curve
Clin Res Cardiol (2012) 101:533–543 539
123
Page 8
prediction of S100B for poor outcome was found on days 2
and 3 in both outcome groups (Fig. 4). The mean cut-off
value calculated from days 1 to 7 in the MGOS was similar
without significant difference compared with the GOS
(MGOS: 1.12 ± 1.15 lg/l, GOS: 1.09 ± 1.15 lg/l, P =
0.356). However, the mean calculated sensitivity from days
1 to 7 of S100B for the prediction of poor outcome in the
MGOS was significantly higher compared with the GOS
(MGOS: 33.3 ± 12%, GOS: 26.6 ± 6.7%, P \ 0.02).
Moreover, the mean calculated AUC value for S100B in
the MGOS was also significantly higher as compared with
the GOS (MGOS: 0.79 ± 0.1, GOS: 0.7 ± 0.1, P \ 0.01).
Discussion
The present study demonstrates that (1) by the use of the
GOS the calculated prediction power of the biochemical
markers NSE and S100B with respect to sensitivities and
AUC values is underestimated as compared with the
modified outcome score, which we termed as MGOS; (2)
this bias is mainly generated, because patients who died
with an unclear neurological status were not excluded from
the group of patients with poor outcome in the GOS; (3) the
best prediction of NSE was achieved on days 3 and 7; (4)
the best prediction of S100B was achieved on day 3, and
(5) the prediction power of NSE was higher as compared
with S100B in our clinical setup.
In 1991 the GP-CPC were proposed to complement the
GOS [5]. The GOS was first introduced by Janett and Bond
in 1975 [7]. The main difference between both scores lies
in the fact that GOS does not further differentiate the cause
of death in GOS 1, whereas GP-CPC 5 acknowledges death
as certified brain death or death by traditional criteria.
Because of the unspecific definition of GP-CPC 5, conse-
quently, most studies investigating biochemical markers or
somatosensory evoked potentials (SSEP) for the prediction
of neurological outcome included patients who died either
from primary brain damage or death from any cause into
this category [6]. Thus, no profound difference is found
between both outcome groups, and both outcome groups
are yet used in clinical studies evaluating the prediction
power of biochemical markers or SSEP [13–16]. However,
in the present prospective clinical study we chose to use the
DC
BA
0
1
2
3
4
5
6
7
8
9
S10
0B in
µg/
l (G
OS
)
goodpoor-
3,5
0,5
p<0.01
n=46 n=511 2 3 4 5 6 7
0
1
2
3
4
5
6
7
8
****
*
S10
0B in
µg/
l (G
OS
)
poor (GOS 1+2)
good (GOS 3+4+5)
days*p<0.05 vs. good
*
1 2 3 4 5 6 7
0
1
2
3
4
5
6
7
8
*S
100B
in µ
g/l (
MG
OS
)
unclear (MGOS 0)
poor (MGOS 1+2)
good (MGOS 3+4+5)
*
#
#p<0.05 vs. unclear and good days*p<0.05 vs. good
*
#
0
1
2
3
4
5
6
7
8
9
p=0.65
S10
0B in
µg/
l (M
GO
S)
p<0.001
goodpoorunclear
p=0.07
2,0
5,2
0,5
n=26n=20 n=51
Fig. 3 The magnitude of
S100B elevation in patients with
poor outcome was higher with
the MGOS compared with the
GOS. a S100B serum levels at
different time points after CPR
and ROSC in patients with
unclear (n = 20), poor
(n = 26), and good (n = 51)
outcome assessed by the
MGOS. b S100B peak serum
levels in patients with unclear,
poor, and good outcome
assessed by the MGOS.
c S100B serum levels at
different time points in patients
with poor (n = 46) and good
(n = 51) outcome assessed by
the GOS. d S100B peak serum
levels in patients with poor and
good outcome assessed by the
GOS
540 Clin Res Cardiol (2012) 101:533–543
123
Page 9
GOS to evaluate the calculated prediction power in com-
parison with the MGOS.
Daily clinical experience shows that many patients,
studies vary between 16 and 21% [17–19], die after pri-
mary successful CPR in consequence of a cardiogenic
shock. This is in line with our study with 17.5% deaths
after cardiogenic shock. In these patients further neuro-
logical diagnostic investigations are often not possible. In
addition, further patients may die during the intensive care
interval due to a septic shock (1–2%) or other complica-
tions [17, 18], before an evaluation of their neurological
state was feasible. Because the neurological state of the
patients in both the aforementioned groups is unclear and
the number of patients may not rather be small in the
unclear outcome group (MGOS 0), the calculated course of
the here investigated biomarkers in the GOS 1 group would
be decreased if patients with unknown cerebral outcome
are not excluded from the group of poor outcome. This
would result in a dilution of the calculated AUC and sen-
sitivity for both NSE and S100B. Additionally, the MGOS
0 group with unclear neurological state may have a very
heterogeneous constellation with only few differences in
baseline characteristics compared with the group with poor
outcome (MGOS 1 ? 2). Because of its inhomogeneous
Table 6 Cut-off points,
sensitivities, specificities and
AUC values of S100B
predicting poor outcome in
patients divided by the GOS and
MGOS
AUC area under the curve,
CI confidence interval
Cut-off value Specificity Sensitivity AUC 95% CI of AUC P value
GOS
S100B day 1 3.59 100 16 0.647 0.561–0.786 \0.01
S100B day 2 0.9 100 31 0.705 0.591–0.819 \0.01
S100B day 3 1.2 100 36 0.792 0.675–0.909 \0.001
S100B day 4 0.72 100 27 0.722 0.606–0.837 \0.01
S100B day 5 0.63 100 30 0.725 0.605–0.844 \0.01
S100B day 6 0.3 100 25 0.635 0.502–0.768 0.05
S100B day 7 0.26 100 21 0.673 0.530–0.817 \0.03
S100B peak value 3.59 100 31 0.727 0.626–0.829 \0.001
MGOS
S100B day 1 3.59 100 12.5 0.734 0.583–0.886 \0.01
S100B day 2 1.17 100 40 0.819 0.676–0.961 \0.001
S100B day 3 1.2 100 50 0.953 0.900–1.000 \0.001
S100B day 4 0.72 100 36 0.841 0.736–0.947 \0.001
S100B day 5 0.63 100 38.5 0.771 0.619–0.923 \0.01
S100B day 6 0.3 100 31 0.717 0.545–0.890 \0.02
S100B day 7 0.26 100 25 0.683 0.503–0.864 0.07
S100B peak value 3.59 100 35 0.773 0.627–0.920 \0.01
0,0 0,2 0,4 0,6 0,8 1,0
0,0
0,2
0,4
0,6
0,8
1,0
1.17
MGOS: AUC 0.819 GOS: AUC 0.705
S100B day 2
Sen
sitiv
ity (
%)
1-Specificity (%)
0.9
0,0 0,2 0,4 0,6 0,8 1,0
0,0
0,2
0,4
0,6
0,8
1,0
1.2
MGOS: AUC 0.953 GOS: AUC 0.792
S100B day 3
Sen
sitiv
ity (
%)
1-Specificity (%)
1.2
Fig. 4 ROC analysis of serum S100B predicting unfavorable outcome in patients divided by the MGOS and GOS. Solid circles mark S100B
cut-off points with 100% specificity. S100B cut-off values are given in lg/l. AUC denotes area under the curve
Clin Res Cardiol (2012) 101:533–543 541
123
Page 10
constellation and the unclear neurological state of its
patients, the time course of the biomarkers NSE and S100B
in the MGOS 0 group, which resembles the one in the good
outcome group (MGOS 3–5), may not be reliable for fur-
ther interpretations and conclusions.
We recently demonstrated that on average, mean NSE
cut-off values and sensitivities were higher (56 ± 35 ng/
ml, 56 ± 18%) in studies excluding patients with unknown
cerebral outcome compared with studies which included all
patients who died into the category of poor outcome
(41 ± 17 ng/ml, 44 ± 25%) [6]. This is partly in line with
the results of the present study. While the cut-off values of
both classifications were not significantly different, mean
sensitivities calculated from days 1 to 7 by the MGOS
(60 ± 29.3%) were significantly higher compared with the
GOS (48.4 ± 22.8%). In addition, the AUC was also found
to be significantly higher in the MGOS (0.89 ± 0.1)
compared with the GOS (0.8 ± 0.1). In analogy, these
findings could be complemented for S100B in a similar
manner.
Based on the aforementioned findings, we propose the
use of the MGOS to allow a more stringent distinction: in
studies evaluating neurological outcome by biochemical
or clinical markers it is of utmost importance to differ-
entiate between death with certified brain damage and
death without certified brain damage (e.g., cardiogenic
and/or septic shock, pulmonary embolism, aortic dis-
section). Hypoxic brain damage should be documented
by neurological investigations, cranial CT/MRI, elec-
trophysiological evaluations, and/or TCD ultrasonogra-
phy. Only those patients who die with certified brain
damage should be included in MGOS 1. Likewise, GOS
1 may be specified into subgroup 1a (death from any
cause) and 1b (death with certified brain damage), and
the GP-CPC score category 5 should be divided into 5a
(death from any cause) and 5b (death with certified brain
death).
While some studies focusing on the GP-CPC allocated
GP-CPC 3 to GP-CPC 4–5 into the group of poor outcome,
all studies using the GOS classification included patients
with GOS 3 (*GP-CPC 3) to those with GOS 4–5 in the
group with good outcome [6]. In future studies, a consensus
may be established to align the complementary categories
of the two scores to make comparison between studies
easier.
Several other studies aimed to investigate the prediction
power for long-term neurologic outcome either of NSE or
S100B in patients with CA after primary successful CPR.
But as different as the particular study design, which varies
from applied neurological outcome tests to the defined
times for blood samples, so dissimilar are the results:
Shinozaki et al. measured NSE and S100B on admission to
hospital and at 6 and 24 h after CA [20]. They report
S100B as more reliable as an early predictor of poor neu-
rological outcome measured by GP-CPC within 24 h after
CA than NSE and recommend already a clinical applica-
tion. Tiainen et al. found in a comparison of patients with
CA followed by therapeutic hypothermia versus those
followed by normothermia a decrease in levels of serum
NSE but not S100B, which were assessed 24, 36, and 48 h
after CA [21]. After neurologic assessment by using the
GP-CPC, they concluded that the decreased NSE levels
may indicate selective attenuation of delayed neuronal
death by therapeutic hypothermia in those patients. Grubb
et al. finally reported that both NSE and S100B concen-
trations measured 24–48 h after CA provided useful
information to identify patients at risk of significant cog-
nitive impairment [22]. In our clinical study, we also found
that both NSE and S100B are capable prediction parame-
ters for long-term neurologic outcome of patients with CA
and initially successful CPR. But similar to Tiainen et al.
the prediction power of NSE was higher as compared with
S100B in our setup. The reason for the obvious differences
in all these studies with regard to our results may be
attributed not only to the different classification of patient’s
neurological state by MGOS, but also to the various time
points of blood sample assessment. Whether there is such a
strong dependency of NSE and S100B prediction power
from the point of their assessment, e.g., a better prediction
power of S100B in the first 24 h after CA or a higher
prediction power of NSE in the following period as sup-
posed by the studies mentioned above may be topic of
further investigations.
Study limitations
The assessment of neurological status of patients who died
as a consequence of cardiogenic shock (17.5%), a combi-
nation of cardiogenic and septic shock (7.2%) and septic
shock (2.1%), was not possible. These patients were clas-
sified as patients with unclear neurological outcome
(MGOS 0). Only if the diagnosis of hypoxic brain damage
could be documented prior to death, e.g., by cranial CT or
MRI, these patients could be included in the MGOS 1
group. However, because stabilization procedures took
precedence, cranial imaging was not eligible in every
patient.
Conclusions
Inclusion of deaths without certified brain damage into the
group of patients with poor outcome in neurological out-
come studies will lead to underestimation of the prognostic
power of the investigated biochemical marker. The MGOS
will help to avoid this bias.
542 Clin Res Cardiol (2012) 101:533–543
123
Page 11
Acknowledgments We would like to thank the medical and nursing
staff of the ICU of the Medical Clinic I, Department of Cardiology,
RWTH Aachen University, Germany, for supporting this study. This
work contains data from the doctoral thesis of Julia S. Kuhnen,
RWTH Aachen University, Germany.
Conflict of interest The authors declare that they have no conflict
of interest.
References
1. (2005) American Heart Association guidelines for cardiopulmo-
nary resuscitation and emergency cardiovascular care part 3:
overview of CPR. Circulation 112:1–203
2. Puttgen HA, Pantle H, Geocadin RG (2009) Management of
cardiac arrest patients to maximize neurologic outcome. Curr
Opin Crit Care 15:118–124
3. Wijdicks EF, Hijdra A, Young GB, Bassetti CL, Wiebe S (2006)
Quality Standards Subcommittee of the American Academy of
Neurology. Practice parameter: prediction of outcome in coma-
tose survivors after cardiopulmonary resuscitation (an evidence-
based review): report of the Quality Standards Subcommittee of
the American Academy of Neurology. Neurology 67:203–210
4. Shinozaki K, Oda S, Sadahiro T, Nakamura M, Hirayama Y, Abe
R, Tateishi Y, Hattori N, Shimada T, Hirasawa H (2009) S-100B
and neuron-specific enolase as predictors of neurological out-
come in patients after cardiac arrest and return of spontaneous
circulation: a systematic review. Crit Care 13:121
5. Cummins RO, Chamberlain DA, Abramson NS, Allen M, Baskett
PJ, Becker L, Bossaert L, Delooz HH, Dick WF, Eisenberg MS
(1991) Recommended guidelines for uniform reporting of data
from out-of-hospital cardiac arrest: the utstein style. A statement
for health professionals from a task force of the American Heart
Association, the European Resuscitation Council, the Heart and
Stroke Foundation of Canada, and the Australian Resuscitation
Council. Circulation 84:960–975
6. Rana OR, Saygili E, Schiefer J, Marx N, Schauerte P (2011)
Biochemical markers and somatosensory evoked potentials in
patients after cardiac arrest: the role of neurological outcome
scores. J Neurol Sci 305:80–84
7. Jennett B, Bond M (1975) Assessment of outcome after severe
brain damage. Lancet 1:480–484
8. Abanador-Kamper N, Kamper L, Wolfertz J, Dinh W, Thurmann
P, Seyfarth M (2011) Influence of algorithm-based analgesia and
sedation in patients after sudden cardiac arrest. Clin Res Cardiol.
doi:10.1007/s00392-011-0378-0
9. Rana M, W Schroder J, Saygili E, Hameed U, Benke D, Hoff-
mann R, Schauerte P, Marx N, Rana OR (2011) Comparative
evaluation of the usability of 2 different methods to perform mild
hypothermia in patients with out-of-hospital cardiac arrest. Int J
Cardiol 152:321–326
10. Jacobshagen C, Pelster T, Pax A, Horn W, Schmidt-Schweda S,
Unsold BW, Seidler T, Wagner S, Hasenfuss G, Maier LS (2010)
Effects of mild hypothermia on hemodynamics in cardiac arrest
survivors and isolated failing human myocardium. Clin Res
Cardiol 99:267–276
11. Pfeifer R, Hopfe J, Ehrhardt C, Goernig M, Figulla HR, Voss A
(2011) Autonomic regulation during mild therapeutic hypother-
mia in cardiopulmonary resuscitated patients. Clin Res Cardiol
100:797–805
12. Koester R, Kaehler J, Barmeyer A, Mullerleile K, Priefler M,
Soeffker G, Braune S, Nierhaus A, Meinertz T, Kluge S (2011)
Coronary angiography and intervention during hypothermia can
be performed safely without cardiac arrhythmia or vasospasm.
Clin Res Cardiol 100:1013–1019
13. Damian MS, Ellenberg D, Gildemeister R, Lauermann J, Simonis
G, Sauter W, Georgi C (2004) Coenzyme Q10 combined with
mild hypothermia after cardiac arrest: a preliminary study. Cir-
culation 110:3011–3016
14. Turedi S, Gunduz A, Mentese A, Dasdibi B, Karahan SC, Sahin
A, Tuten G, Kopuz M, Alver A (2009) Investigation of the
possibility of using ischemia-modified albumin as a novel and
early prognostic marker in cardiac arrest patients after cardio-
pulmonary resuscitation. Resuscitation 80:994–999
15. Zandbergen EG, Hijdra A, Koelman JH, Hart AA, Vos PE,
PROPAC Study Group et al (2006) Prediction of poor outcome
within the first 3 days of postanoxic coma. Neurology 66:62–68
16. Reisinger J, Hollinger K, Lang W, Steiner C, Winter T, Ze-
indlhofer E, Mori M, Schiller A, Lindorfer A, Wiesinger K,
Siostrzonek P (2007) Prediction of neurological outcome after
cardiopulmonary resuscitation by serial determination of serum
neuron-specific enolase. Eur Heart J 28:52–58
17. Lettieri C, Savonitto S, De Servi S, Guagliumi G, LombardIMA
Study Group et al (2009) Emergency percutaneous coronary
intervention in patients with ST-elevation myocardial infarction
complicated by out-of-hospital cardiac arrest: early and medium-
term outcome. Am Heart J 157:569–575
18. Garot P, Lefevre T, Eltchaninoff H, Morice MC, Tamion F, Abry
B, Lesault PF, Le Tarnec JY, Pouges C, Margenet A, Monchi M,
Laurent I, Dumas P, Garot J, Louvard Y (2007) Six-month out-
come of emergency percutaneous coronary intervention in
resuscitated patients after cardiac arrest complicating ST-eleva-
tion myocardial infarction. Circulation 115:1354–1362
19. Kouraki K, Schneider S, Uebis R, Tebbe U, Klein HH, Janssens
U, Zahn R, Senges J, Zeymer U (2011) Characteristics and
clinical outcome of 458 patients with acute myocardial infarction
requiring mechanical ventilation. Results of the BEAT registry of
the ALKK-study group. Clin Res Cardiol 100:235–239
20. Shinozaki K, Oda S, Sadahiro T, Nakamura M, Abe R, Nakada
TA, Nomura F, Nakanishi K, Kitamura N, Hirasawa H (2009)
Serum S-100B is superior to neuron-specific enolase as an early
prognostic biomarker for neurological outcome following car-
diopulmonary resuscitation. Resuscitation 80:870–875
21. Tiainen M, Roine RO, Pettila V, Takkunen O (2003) Serum
neuron-specific enolase and S-100B protein in cardiac arrest
patients treated with hypothermia. Stroke 34:2881–2886
22. Grubb NR, Simpson C, Sherwood RA, Abraha HD, Cobbe SM,
O’Carroll RE, Deary I, Fox KA (2007) Prediction of cognitive
dysfunction after resuscitation from out-of-hospital cardiac arrest
using serum neuron-specific enolase and protein S-100. Heart
93:1268–1273
Clin Res Cardiol (2012) 101:533–543 543
123