THE MOON MINERALOGY MAPPER MINERALOGY (M) IMAGING SPECTROMETER: EARLY ASSESSMENT OF THE SPECTRAL, RADIOMETRIC, SPATIAL AND UNIFORMITY PROPERTIES. R. O. Green, C. M. Pieters 2 , J. Boardman 3 , D. Barr, C. Bruce, J. Bousman, A. Chatterjee, M. Eastwood, V. Essandoh. S. Geier, T. Glavich, R. Green, V. Haemmerle, S, Hyman, L. Hovland, T. Koch, K. Lee, S. Lundeen, E. Motts, P. Mouroulis, S. Paulson, K. Plourde, C. Racho, D. Robinson, J. Rodriguez, H. Sobel. P. Rothman, G. Sellar, C. Smith', J. Stamp, H. Tseng, P. Varanasi, D. Wilson, M. L. White, Jet Propulsion Laboratory, California Institute of Technology, 4800 Oak Grove Drive, Pasadena, CA 91109 ([email protected]), 2 Brown University, 'A1G.°ATK Introduction: The Moon Mineralogy Mapper s (M3 ) is a high uniformity and high signal-to-noise ration 456 NASA imaging spectrometer that is a guest instrument on the Indian Chandrayaan-1 Mission to the Moon. The laboratory measured spectral, radiometric, spatial, and uniformity characteristics of the M 3 instrument are given in table 1. The M 3 imaging spectrometer takes advantage of a suite of critical enabling capabilities to achieve its measurement requirement with a mass of 8 kg, power usage of 15 W, and volume of 25X18X12 cm. The M3 detector and spectrometer are cooled by a multi-stage passive cooler. This abstract presents early M3 performance assessment results. Early M 3 science results are present in the Pieters et.al . 2009 LPSC abstract. Table 1. M 3 Tareet Mode Laboratory Characteristics Spectral Range 406 to 2991 not Sampling 9.98 nm Response 12.5 nm FWHM Radiometric Range 0 to specified saturation Sampling 12 bits measured, Response Linear to I % (I to 99%) Accuracy <10% absolute uncertainty Precision (SNR) >400 @equatorial reference X100 @polar reference Spatial Range 24 degree field-of-view Sampling 0.7 milliradian Response 1.0 milliradian FWHM Uniformity Spectral-cross-track 10% variation of spectral position across the field-of-view Spectral-IFOV 10% IFOV variation over the spectral range Early Measurements: Chandrayaan-1 was launched on the 22nd of October 2008. The first M 3 imaging spectrometer data sets were acquired on the 18th and 19th of November 2008. Both M 3 Target and Global imaging modes were exercised. Global mode is a 2X2 spatial average with selected 2X and 4X spectral averaging of Target mode sampling. Figure I shows a M3 Target mode data set measured on the 191h of November rendered as an image cube. Additional commissioning data were acquired on the 22nd and 24th of November in Global mode with the detector temperature near nominal. These measurements were calibrated to radiance by subtracting the dark signal levels and applying the laboratory radiometric calibration coefficients in the baseline calibration algorithm. Figure 2 show a set of single point M 3 Global mode radiance spectra along with a Global mode image subset and the full global mode strip. Figure 1. M' Target mode image acquired on the 19th of November 2008 at -4174 longitude and +63.08 latitude. The image has 621 cross-track samples, 392 lines and 260 spectral channels measuring from 406 to 2991 nm. The spectral range is depicted in the top and side panels for the edge samples. too 90 so W 60 40 o^^I 4M7oo i= 1300 .1m Iwo 2X0:eao Moo wa^4w^n iRmi Figure 2. (left) A set of M 3 single point spectra from a Global mode acquisition on the 24th of November 2008. (Center) image from Global mode strip. (right-sliver) Full Global mode stripe from 85N over the North pole to 78.7 South latitude passing through -1 1 1.2 longitude at the equator. The following sections of this extended abstract give preliminary assessments of the in-flight spectral, radiometric, spatial, and uniformity characteristics of M3 . These are early assessments based on limited commissioning phase measurements, A comment on future in-flight performance assessment and calibration validation is given at the end of the abstract, https://ntrs.nasa.gov/search.jsp?R=20090025993 2018-06-24T21:31:29+00:00Z
Transcript
THE MOON MINERALOGY MAPPER MINERALOGY (M) IMAGING SPECTROMETER: EARLYASSESSMENT OF THE SPECTRAL, RADIOMETRIC, SPATIAL AND UNIFORMITY PROPERTIES. R.O. Green, C. M. Pieters 2, J. Boardman 3 , D. Barr, C. Bruce, J. Bousman, A. Chatterjee, M. Eastwood, V. Essandoh.S. Geier, T. Glavich, R. Green, V. Haemmerle, S, Hyman, L. Hovland, T. Koch, K. Lee, S. Lundeen, E. Motts, P.Mouroulis, S. Paulson, K. Plourde, C. Racho, D. Robinson, J. Rodriguez, H. Sobel. P. Rothman, G. Sellar, C.Smith', J. Stamp, H. Tseng, P. Varanasi, D. Wilson, M. L. White, Jet Propulsion Laboratory, California Institute ofTechnology, 4800 Oak Grove Drive, Pasadena, CA 91109 ([email protected]), 2Brown University,'A1G.°ATK
Introduction: The Moon Mineralogy Mapper s (M3) isa high uniformity and high signal-to-noise ration 456
NASA imaging spectrometer that is a guest instrumenton the Indian Chandrayaan-1 Mission to the Moon. Thelaboratory measured spectral, radiometric, spatial, anduniformity characteristics of the M 3 instrument are givenin table 1. The M 3 imaging spectrometer takes advantageof a suite of critical enabling capabilities to achieve itsmeasurement requirement with a mass of 8 kg, powerusage of 15 W, and volume of 25X18X12 cm. The M3detector and spectrometer are cooled by a multi-stagepassive cooler.
This abstract presents early M3 performanceassessment results. Early M 3 science results are presentin the Pieters et.al . 2009 LPSC abstract.
Table 1. M 3 Tareet Mode Laboratory CharacteristicsSpectral
Range 406 to 2991 notSampling 9.98 nmResponse 12.5 nm FWHM
Radiometric
Range 0 to specified saturationSampling 12 bits measured,Response Linear to I % (I to 99%)Accuracy <10% absolute uncertaintyPrecision (SNR) >400 @equatorial reference
X100 @polar referenceSpatial
Range 24 degree field-of-viewSampling 0.7 milliradianResponse 1.0 milliradian FWHM
UniformitySpectral-cross-track 10% variation of spectral position
across the field-of-viewSpectral-IFOV 10% IFOV variation over the
spectral range
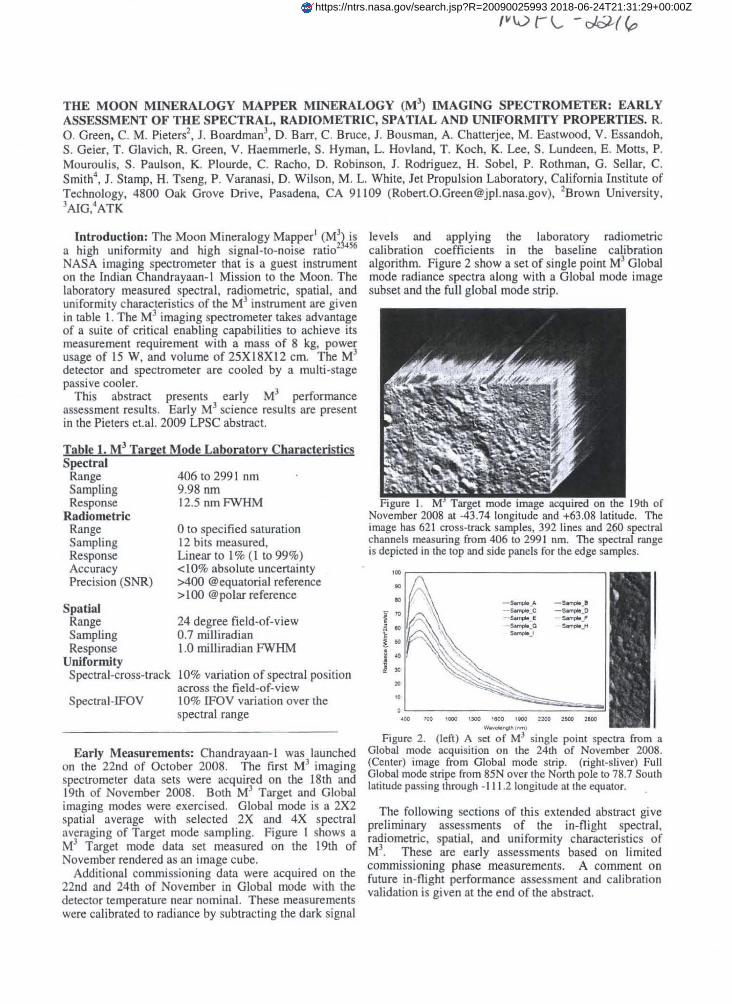
Early Measurements: Chandrayaan-1 was launchedon the 22nd of October 2008. The first M 3 imagingspectrometer data sets were acquired on the 18th and19th of November 2008. Both M 3 Target and Globalimaging modes were exercised. Global mode is a 2X2spatial average with selected 2X and 4X spectralaveraging of Target mode sampling. Figure I shows aM3 Target mode data set measured on the 191h ofNovember rendered as an image cube.
Additional commissioning data were acquired on the22nd and 24th of November in Global mode with thedetector temperature near nominal. These measurementswere calibrated to radiance by subtracting the dark signal
levels and applying the laboratory radiometriccalibration coefficients in the baseline calibrationalgorithm. Figure 2 show a set of single point M 3 Globalmode radiance spectra along with a Global mode imagesubset and the full global mode strip.
Figure 1. M' Target mode image acquired on the 19th ofNovember 2008 at -4174 longitude and +63.08 latitude. Theimage has 621 cross-track samples, 392 lines and 260 spectralchannels measuring from 406 to 2991 nm. The spectral rangeis depicted in the top and side panels for the edge samples.
too
90
so
W60
40
o^^I4M7oo i= 1300 .1m Iwo 2X0:eao Moo
wa^4w^n iRmi
Figure 2. (left) A set of M 3 single point spectra from aGlobal mode acquisition on the 24th of November 2008.(Center) image from Global mode strip. (right-sliver) FullGlobal mode stripe from 85N over the North pole to 78.7 Southlatitude passing through -1 1 1.2 longitude at the equator.
The following sections of this extended abstract givepreliminary assessments of the in-flight spectral,radiometric, spatial, and uniformity characteristics ofM3 . These are early assessments based on limitedcommissioning phase measurements, A comment onfuture in-flight performance assessment and calibrationvalidation is given at the end of the abstract,
Spectral: Early assessment of the in-flight spectralproperties of M3 is based on comparing modeled spectrawith measured M3 spectra. Figure 3 shows acomparison of the M3 radiance measured from an areaestimated to have soil properties similar that that of theApollo 16 landing site and the radiance modeled for thesite based on the Apollo 16 soil reflectance, solar zenithangle and irradiance spectrum. The location of the solarpeak and the correspondence in shape indicates the in-
flight spectral range and spectral channel position isconsistent with the laboratory measured values.Differences between the measured and modeled spectraare related to the use of an approximate Apollo 16analog site and absence of correction for photometry.The first opportunity to measure data over the Apollo 16landing site is the 8th of January 2009,
10
.h
- M] m1NUrW .10[K[ FGmIpprt.mMAGG .a ^[ WKa W
SD
-- AoerG .e .a. ^^re .W i NU awr..oaa.q •x rM.eR
^ p
i
.00 'M .000 1000 I.. .900 E.'00 :SOC 2M_7'Figure 3. Comparison of an M 3 measured and modeled
spectrum for a site estimated to he similar to the Apollo 16 soil.
Radiometric: At this time, the quality of theradiometric calibration of M 3 may only be qualitativelyassessed based on the correspondence of the measured
and modeled spectral shown in Figure 3. Early in-flightanalysis confirms a known scattered light characteristicof M3 impacting the visible portion of the spectrum.This due to the light weight diamond turned mirrors thatwere required. A correction algorithm based uponlaboratory measurements is being evaluated. Initialassessment of the dark-signal noise-equivalent-delta-radiance (NEdL) for the early commissioning phase datais consistent with the NEdL predicted for thetemperature of the detector.
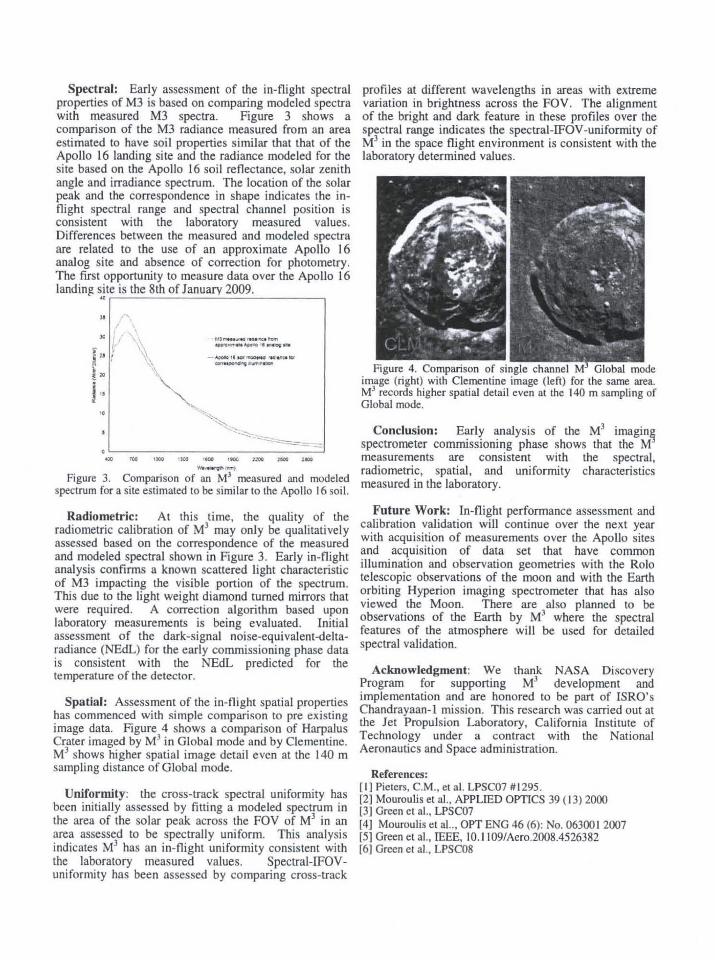
Spatial: Assessment of the in-flight spatial propertieshas commenced with simple comparison to pre existingimage data. Figure 4 shows a comparison of HarpalusCrater imaged by M' in Global mode and by Clementine.M3 shows higher spatial image detail even at the 140 insampling distance of Global mode.
Uniformity: the cross-track spectral uniformity hasbeen initially assessed by fitting a modeled spectrum inthe area of the solar peak across the FOV of M 3 in anarea assessed to be spectrally uniform. This analysisindicates M 3 has an in-flight uniformity consistent withthe laboratory measured values. Spectral-IFOV-uniformity has been assessed by comparing cross-track
profiles at different wavelengths in areas with extremevariation in brightness across the FOV. The alignmentof the bright and dark feature in these profiles over thespectral range indicates the spectral -IFOV-uniformity ofM3 in the space flight environment is consistent with thelaboratory determined values.
Figure 4. Comparison of single channel M' Global modeimage (right) with Clementine image (left) for the same area.M3 records higher spatial detail even at the 140 m sampling ofGlobal mode.
Conclusion: Early analysis of the M3 imaginjspectrometer commissioning phase shows that the Mmeasurements are consistent with the spectral,radiometric, spatial, and uniformity characteristicsmeasured in the laboratory.
Future Work: In-flight performance assessment andcalibration validation will continue over the next yearwith acquisition of measurements over the Apollo sitesand acquisition of data set that have commonillumination and observation geometries with the Rolotelescopic observations of the moon and with the Earthorbiting Hyperion imaging spectrometer that has alsoviewed the Moon. There are also planned to beobservations of the Earth by M11 the spectralfeatures of the atmosphere will be used for detailedspectral validation.
Acknowledgment: We thank NASA DiscoveryProgram for supporting M3 development andimplementation and are honored to be part of ISRO'sChandrayaan-1 mission. This research was carried out atthe Jet Propulsion Laboratory, California Institute ofTechnology under a contract with the NationalAeronautics and Space administration.
References:[ I ] Pieters, C.M., et a]. LPSC07 #1295.[2] Mouroulis et al., APPLIED OP'T'ICS 39 (13) 2000[31 Green et al., LPSC07[41 Mouroulis et al.., OPT ENG 46 (6): No. 063001 2007[51 Green et al., IEEE, 10.1 1091Aero.2008.4526382161 Green et al., LPSC08
![Measurement of Properties of the Lunar - Home | University of ......2012/03/08 · Figure 9: Early results from the Moon Mineralogy Mapper onboard Chandrayaan-1 [Kerr (ed.), 2009].](https://static.documents.pub/doc/80x56/608bba30457a5f5336228da3/measurement-of-properties-of-the-lunar-home-university-of-20120308.jpg)


![Bulk mineralogy of lunar crater central peaks via thermal ...luna1.diviner.ucla.edu/~dap/pubs/064.pdfMineralogy Mapper [Dhingra et al., 2011; Mustard et al., 2011]). The diagnostic](https://static.documents.pub/doc/80x56/5f6af087ce5c6616bf72f9b4/bulk-mineralogy-of-lunar-crater-central-peaks-via-thermal-luna1-dappubs064pdf.jpg)


