+ All Categories
Home > Documents > The Mysteries of Assessing Value For Money in HIV Service Delivery Unlocked: Principles, Group...

The Mysteries of Assessing Value For Money in HIV Service Delivery Unlocked: Principles, Group...

Date post: 31-Dec-2015
Category:
Upload: jeffry-sanders
View: 214 times
Download: 0 times
Share this document with a friend
Popular Tags:
31
The Mysteries of Assessing Value For Money in HIV Service Delivery Unlocked: Principles, Group Exercises and Examples Part 2 Excel exercises: Mead Over Senior Fellow Center for Global Development International AIDS Society Kuala Lumpur, Malaysia July 3, 2013
Transcript

The Mysteries of Assessing Value For Money in HIV Service Delivery Unlocked:

Principles, Group Exercises and Examples

Part 2 Excel exercises:Mead Over

Senior FellowCenter for Global Development

International AIDS SocietyKuala Lumpur, Malaysia

July 3, 2013

Overview of this session

• Using Excel to compute cost-benefit and cost-effectiveness numbers

• The impact of discounting on the breakeven point for Treatment as Prevention

• Revisiting the cost-effectiveness of MC

Please copy a thumb drive onto your computer’s desktop

• Verify that your thumb drive looks like this

• Copy onto your computer• Pass the thumb drive on to someone else

Drummond's check-list for assessing economic evaluations

1. Well-defined question?2. A comprehensive description of the competing alternatives given?3. Was effectiveness established?4. All costs and consequences for each alternative identified?5. Costs and consequences measured accurately?6. Cost and consequences valued credibly?7. Costs and consequences adjusted for differential timing (discounting)?8. Incremental analysis of costs and consequences of alternatives?9. Allowance for uncertainty?10. Did the discussion of study results include all issues of concern to users?

(Source: (Drummond M et al. Methods for the economic evaluation of health care programmes. 2nd ed. Oxford. Oxford University Press. 1997 from http://www.nlm.nih.gov/nichsr/edu/healthecon/drummond_list.html)

USING EXCEL TO COMPUTE COST-BENEFIT AND COST-EFFECTIVENESS NUMBERS

Let’s build a cost-benefit analysis from the ground up

Cost-Benefit Analysis First we need to specify the future streams of costs and benefits.Net Discount Present

Year Costs Benefits Benefits Factor Value0 60 0

1 1 3

2 1 3

3 1 10

4 1 10

5 1.5 12.5

6 1.5 12.5

7 1.5 12.5

8 1.5 15

9 2 15

10 2 15

Discount

Rate =

0

10

20

30

40

50

60

70

0 2 4 6 8 10 12

Costs

Benefits

See: Mead_Over_CBA_CEA_Exercises_KL_2013.xls, Sheet: CB Analysis

In CBA, we can compute net benefits each year

Cost-Benefit Analysis Net benefits are annual benefits minus annual costsNet Discount Present

Year Costs Benefits Benefits Factor Value0 60 0 -60

1 1 3 2

2 1 3 2

3 1 10 9

4 1 10 9

5 1.5 12.5 11

6 1.5 12.5 11

7 1.5 12.5 11

8 1.5 15 13.5

9 2 15 13

10 2 15 13

Discount

Rate =-70

-60

-50

-40

-30

-20

-10

0

10

20

0 2 4 6 8 10 12

Benefits

Net Benefits

See: Mead_Over_CBA_CEA_Exercises_KL_2013.xls, Sheet: CB Analysis (2)

For an introduction to discounting in CEA for health see p.155-157

Source: Over, M., Economics for Health Sector Analysis: Concepts and Cases, World Bank, 1993

Discounting future costs and benefits

Net Discount PresentYear Costs Benefits Benefits Factor Value

0 60 0 -60 1

1 1 3 2 0.91

2 1 3 2 0.83

3 1 10 9 0.75

4 1 10 9 0.68

5 1.5 12.5 11 0.62

6 1.5 12.5 11 0.56

7 1.5 12.5 11 0.51

8 1.5 15 13.5 0.47

9 2 15 13 0.42

10 2 15 13 0.39

Discount

Rate =

0.1 Change the discount rate to .03 or to .2 to see the impact on the discount factors

0

0.2

0.4

0.6

0.8

1

1.2

0 2 4 6 8 10 12

Discount Factor

See: Mead_Over_CBA_CEA_Exercises_KL_2013.xls, Sheet: CB Analysis (3)

Experiment with changing the discount rate

Cost-Benefit Analysis The present value of an amount is that amount multiplied by its discount factorNet Discount Present

Year Costs Benefits Benefits Factor Value0 60 0 -60 1 -60

1 1 3 2 0.91 1.82

2 1 3 2 0.83 1.65

3 1 10 9 0.75 6.76

4 1 10 9 0.68 6.15

5 1.5 12.5 11 0.62 6.83

6 1.5 12.5 11 0.56 6.21

7 1.5 12.5 11 0.51 5.64

8 1.5 15 13.5 0.47 6.30

9 2 15 13 0.42 5.51

10 2 15 13 0.39 5.01

NPV = -8.11

Discount

Rate =

0.1 Change the discount rate to .03 or to .2 to see the impact on the stream of the present value of net benefitsand on the net present value of the project.

-70

-60

-50

-40

-30

-20

-10

0

10

20

0 2 4 6 8 10

Net Benefits(Current values)

Net benefits(Present values)

See: Mead_Over_CBA_CEA_Exercises_KL_2013.xls, Sheet: CB Analysis (4)

An investment “breaks even”when the initial cost is recovered:

“The payback period”

Cost-Benefit Analysis An investment "breaks even" when the initial cost is recovered.Net Discount Present Net present value

Year Costs Benefits Benefits Factor Value of cost stream0 60 0 -60 1 -60 601 1 3 2 0.91 1.82 58.182 1 3 2 0.83 1.65 56.533 1 10 9 0.75 6.76 49.774 1 10 9 0.68 6.15 43.625 1.5 12.5 11 0.62 6.83 36.796 1.5 12.5 11 0.56 6.21 30.587 1.5 12.5 11 0.51 5.64 24.948 1.5 15 13.5 0.47 6.30 18.649 2 15 13 0.42 5.51 13.12

10 2 15 13 0.39 5.01 8.11NPV = -8.11

Discount

Rate =

0.1 Change the discount rate to .03 or to .2 to see the impact on the breakeven dateand on the net present value of the project.

-30

-20

-10

0

10

20

30

40

50

60

70

0 2 4 6 8 10

Breakeven analysis

See: Mead_Over_CBA_CEA_Exercises_KL_2013.xls, Sheet: CB Analysis (5)

How does the discount rate affect the time until an investment breaks even?

Cost-Benefit Analysis Typically breakeven occurs sooner at a lower discount rateNet Discount Present Net present value

Year Costs Benefits Benefits Factor Value of cost stream0 60 0 -60 1 -60 601 1 3 2 0.97 1.94 58.062 1 3 2 0.94 1.89 56.173 1 10 9 0.92 8.24 47.944 1 10 9 0.89 8.00 39.945 1.5 12.5 11 0.86 9.49 30.456 1.5 12.5 11 0.84 9.21 21.247 1.5 12.5 11 0.81 8.94 12.308 1.5 15 13.5 0.79 10.66 1.649 2 15 13 0.77 9.96 -8.33

10 2 15 13 0.74 9.67 -18.00NPV = 18.00

Discount

Rate =

0.03 Change the discount rate to .03 or to .2 to see the impact on the breakeven dateand on the net present value of the project.

-30

-20

-10

0

10

20

30

40

50

60

70

0 2 4 6 8 10

Breakeven analysis

See: Mead_Over_CBA_CEA_Exercises_KL_2013.xls, Sheet: CB Analysis (6)

As a bridge to CEA, note that CBA could be split into two parts…

Cost-Benefit Analysis Analysis can be separated into two parts

DiscountPresent Value Discount

Present Value Net present value

Year Costs Factor of Costs Benefits Factor of Benefits of cost stream0 60 1 60 0 1 0 601 1 0.97 0.97 3 0.97 2.91 58.062 1 0.94 0.94 3 0.94 2.83 56.173 1 0.92 0.92 10 0.92 9.15 47.944 1 0.89 0.89 10 0.89 8.88 39.945 1.5 0.86 1.29 12.5 0.86 10.78 30.456 1.5 0.84 1.26 12.5 0.84 10.47 21.247 1.5 0.81 1.22 12.5 0.81 10.16 12.308 1.5 0.79 1.18 15 0.79 11.84 1.649 2 0.77 1.53 15 0.77 11.50 -8.33

10 2 0.74 1.49 15 0.74 11.16 -18.00PV of C = 71.69 PV of B = 89.69

Discount

Rate =

0.03 NPV= (PV of B) - (PV of C) = 18.00 Same as before

Neither the breakeven date nor the NPV is affected by separately analyzing the costs and benefitsprovided we use the same discount rate and discount factor for both.

-30-20-10

010203040506070

0 5 10

Breakeven analysis

See: Mead_Over_CBA_CEA_Exercises_KL_2013.xls, Sheet: CB Analysis (7)

As an alternative to the NPV,CBA can present a CB ratio

Cost-Benefit Analysis And a Cost-benefit ratio can be computed

DiscountPresent Value Discount

Present Value Net present value

Year Costs Factor of Costs Benefits Factor of Benefits of cost stream0 60 1 60 0 1 0 601 1 0.97 0.97 3 0.97 2.91 58.062 1 0.94 0.94 3 0.94 2.83 56.173 1 0.92 0.92 10 0.92 9.15 47.944 1 0.89 0.89 10 0.89 8.88 39.945 1.5 0.86 1.29 12.5 0.86 10.78 30.456 1.5 0.84 1.26 12.5 0.84 10.47 21.247 1.5 0.81 1.22 12.5 0.81 10.16 12.308 1.5 0.79 1.18 15 0.79 11.84 1.649 2 0.77 1.53 15 0.77 11.50 -8.33

10 2 0.74 1.49 15 0.74 11.16 -18.00PV of C = 71.69 PV of B = 89.69

Discount

Rate =

0.03 NPV= Cost-benefit ratio is defined as CB ratio= (PV of Costs)/(PV of Benefits) = 0.80 Pure number

Desireable for costs to be less than benefits, so the CG ratio is less than one.Alternatively could be computed as the Benefit-Cost ratio: BC ratio= (PV of Benefits)/(PV of Costs) = 1.25 Pure number

-30-20-10

010203040506070

0 5 10

Breakeven analysis

See: Mead_Over_CBA_CEA_Exercises_KL_2013.xls, Sheet: CB Analysis (8)

The cost-benefit ratio changes with the time horizon

Cost-Benefit Analysis The cost-benefit ratio changes with the time horizon

DiscountPresent Value Cumulated Discount

Present Value Cumulated Net present value CB Ratio

Year Costs Factor of Costs PV of C Benefits Factor of Benefits PV of B of cost stream by time t0 60 1 60 60 0 1 0 0 601 1 0.97 0.97 60.97 3 0.97 2.91 2.91 58.06 20.932 1 0.94 0.94 61.91 3 0.94 2.83 5.74 56.17 10.793 1 0.92 0.92 62.83 10 0.92 9.15 14.89 47.94 4.224 1 0.89 0.89 63.72 10 0.89 8.88 23.78 39.94 2.685 1.5 0.86 1.29 65.01 12.5 0.86 10.78 34.56 30.45 1.886 1.5 0.84 1.26 66.27 12.5 0.84 10.47 45.03 21.24 1.477 1.5 0.81 1.22 67.49 12.5 0.81 10.16 55.19 12.30 1.228 1.5 0.79 1.18 68.67 15 0.79 11.84 67.03 1.64 1.029 2 0.77 1.53 70.20 15 0.77 11.50 78.53 -8.33 0.89

10 2 0.74 1.49 71.69 15 0.74 11.16 89.69 -18.00 0.80PV of C = 71.69 PV of B = 89.69

Discount

Rate =

0.03 NPV= Cost-benefit ratio is defined as CB ratio= (PV of Costs)/(PV of Benefits) = 0.80 Pure number

Desireable for costs to be less than benefits, so the CG ratio is less than one.Alternatively could be computed as the Benefit-Cost ratio: BC ratio= (PV of Benefits)/(PV of Costs) = 1.25 Pure number

0

5

10

15

20

25

0

Length of time horizon

With up-future benefits, the cost

benefit ratio improves with longer time horizons

See: Mead_Over_CBA_CEA_Exercises_KL_2013.xls, Sheet: CB Analysis (9)

CEA calculations look a lot like the computation of a cost-benefit ratio

Cost-Effectiveness Analysis Effects might be life-years saved (or years of death averted)

DiscountPresent Value Discount

Present Value

Year Costs Factor of Costs Effects Factor of Effects0 60 1 60 0 1 0

1 1 0.97 0.97 3 0.97 2.91

2 1 0.94 0.94 3 0.94 2.83

3 1 0.92 0.92 10 0.92 9.15

4 1 0.89 0.89 10 0.89 8.88

5 1.5 0.86 1.29 12.5 0.86 10.78

6 1.5 0.84 1.26 12.5 0.84 10.47

7 1.5 0.81 1.22 12.5 0.81 10.16

8 1.5 0.79 1.18 15 0.79 11.84

9 2 0.77 1.53 15 0.77 11.50

10 2 0.74 1.49 15 0.74 11.16

PV of C = 71.69 PV of E = 89.69

Discount

Rate =

0.03 Cost-effectiveness is defined as (PV of Costs)/(PV of Effects) = $0.80 Per unit of effect

With up-front costs and health effects Rate PV of C PV of E CElater on, higher discount rates 0.01 $73.17 101.70 $0.72raise the cost per effect: 0.2 $65.17 36.71 $1.78

See: Mead_Over_CBA_CEA_Exercises_KL_2013.xls, Sheet: CE Analysis

CE ratio also depends on the time horizon

Cost-Effectiveness Analysis Effects might be life-years saved (or years of death averted)

DiscountPresent Value Cumulated Discount

Present Value Cumulated CE Ratio

Year Costs Factor of Costs PV of Costs Effects Factor of Effects PV of Effects by time t0 60 1 60 60 0 1 0 0

1 1 0.97 0.97 60.97 3 0.97 2.91 2.91 20.932 1 0.94 0.94 61.91 3 0.94 2.83 5.74 10.793 1 0.92 0.92 62.83 10 0.92 9.15 14.89 4.224 1 0.89 0.89 63.72 10 0.89 8.88 23.78 2.685 1.5 0.86 1.29 65.01 12.5 0.86 10.78 34.56 1.886 1.5 0.84 1.26 66.27 12.5 0.84 10.47 45.03 1.477 1.5 0.81 1.22 67.49 12.5 0.81 10.16 55.19 1.228 1.5 0.79 1.18 68.67 15 0.79 11.84 67.03 1.029 2 0.77 1.53 70.20 15 0.77 11.50 78.53 0.89

10 2 0.74 1.49 71.69 15 0.74 11.16 89.69 0.80PV of C = 71.69 PV of E = 89.69

Discount

Rate =

0.03 Cost-effectiveness is defined as (PV of Costs)/(PV of Effects) = $0.80 Per unit of effect

With up-front costs and health effects Rate PV of C PV of E CElater on, higher discount rates 0.01 $73.17 101.70 $0.72raise the cost per effect: 0.2 $65.17 36.71 $1.78

$0

$5

$10

$15

$20

$25

0 2

Length of time horizon

With upbenefits, the costimproves with longer time horizons

See: Mead_Over_CBA_CEA_Exercises_KL_2013.xls, Sheet: CE Analysis (2)

THE IMPACT OF DISCOUNTING ON THE BREAKEVEN POINT FOR TREATMENT AS PREVENTION

Granich et al compare the costs of UTT to the 2010 WHO guidelines:

CD4 < 350

2000 2005 2010 2015 2020 2025 2030 2035 2040 2045 2050

-2

-1

0

1

2

3

4Universal Test and Treat

CD4 < 350

Net cost

Billi

ons

of c

onst

ant U

S D

olla

rs

See: Mead_Over_CBA_CEA_Exercises_KL_2013.xls, Sheet: Granich Brkevn

With a zero discount rate, by the year 2055, UTT would be cost-saving

2000 2010 2020 2030 2040 2050 2060 2070 2080 2090 2100

-20

-15

-10

-5

0

5

10

15

20

25

30 Universal Test and TreatCD4 < 350Net costCumulated net cost

Billi

ons

of c

onst

ant U

S D

olla

rs

See: Mead_Over_CBA_CEA_Exercises_KL_2013.xls, Sheet: Granich Brkevn

With a 3% discount rate, by the year 2075, UTT would be cost-saving

2000 2010 2020 2030 2040 2050 2060 2070 2080 2090 2100

-$15

-$10

-$5

$0

$5

$10

$15

$20 Universal Test and TreatCD4 < 350Net costCumulated net cost

Billi

ons

of c

onst

ant U

S D

olla

rs

See: Mead_Over_CBA_CEA_Exercises_KL_2013.xls, Sheet: Granich Brkevn (2)

2000 2010 2020 2030 2040 2050 2060 2070 2080 2090 2100

-$2

$0

$2

$4

$6

$8

$10 Universal Test and TreatCD4 < 350Net costCumulated net cost

Billi

ons

of c

onst

ant U

S D

olla

rs

With a 10% discount rate, UTT would never be cost-saving

See: Mead_Over_CBA_CEA_Exercises_KL_2013.xls, Sheet: Granich Brkevn (3)

REVISITING THE COST-EFFECTIVENESS OF MALE CIRCUMCISION

Inputs on costs and effects

Source: Spreadsheet for Kahn JG, Marseille E, Auvert B. Cost-effectiveness of male circumcision for HIV prevention in a South African setting. PLoS Med 2006

One of these, the infection rate, is a bit tricky

• Define the following variables:– S be the proportion susceptible (i.e. not infected). Here it is

given by cell D15 as:– I be the proportion infected. Here it is 1 - S or:– D is the duration of an individual in the infected status:

Authors assume this equals: • In a stable equilibrium,

I/S = D * Incidence rate• So the cell D16 is making this assumption to derive the

incidence rate from the prevalence rate, I.– 0.256/0.744 = 9 * Infection rate

Based on these inputsthe paper calculates the CE ratio

Cost per infection averted is only $181

But ….

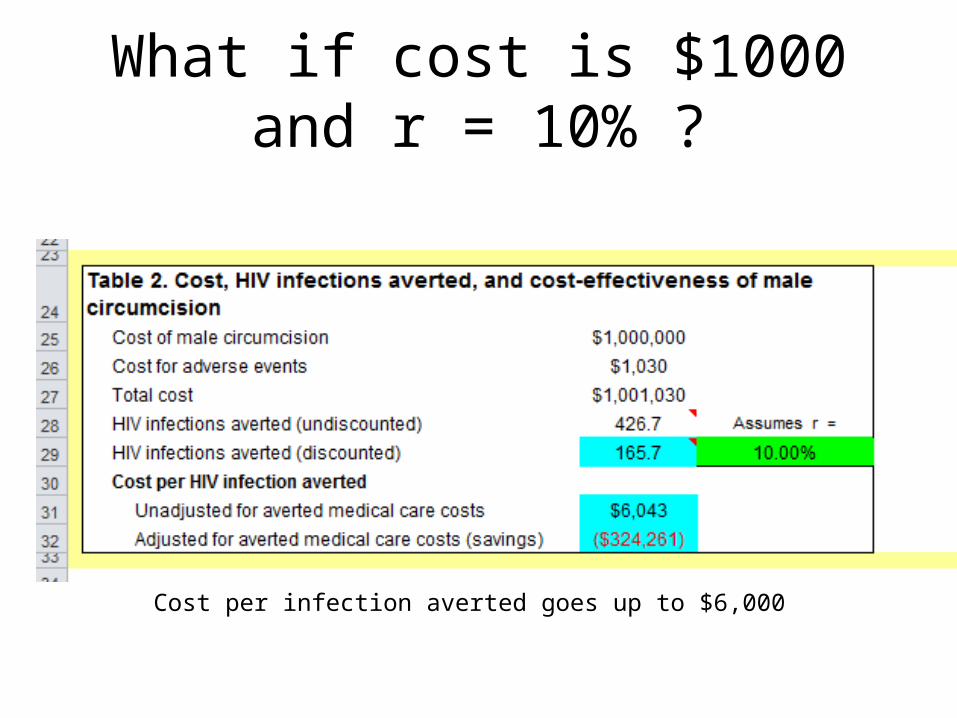
• New evidence on the cost of MC suggests it varies a great deal and in small scale facilities can be as high as $1,000 per circumcision

• And Ministry of Finance decision makers are more likely to use a discount rate as high as 10% or 12% in evaluating projects

MC: Cost per client

28

10 100 1000 10000 1000001

10

100

1000

Cost per MC performed

Kenya n=32 Power (Kenya n=32)Zambia n=17 Power (Zambia n=17)

MC clients

USD

Cost per MC performed Coefficient p-value Adj-R2

Unadjusted -0.4233 0.000 0.3495

cost per MC performed = (test kits+ staff ) )/(MC clients)

What if cost is $1000 and r = 10% ?

Cost per infection averted goes up to $6,000

Check how the discounting was done

Now Michelle we lead a discussion of some other papers

www.CGDev.org


Recommended