email: [email protected]Effective States and Inclusive Development Research Centre (ESID) School of Environment and Development, The University of Manchester, Oxford Road, Manchester M13 9PL, UK www.effective-states.org ESID Working Paper No. 35 The National Rural Employment Guarantee Scheme in Rajasthan: Rationed funds and their allocation across villages Himanshu, 1 Abhiroop Mukhopadhyay 2 and M. R. Sharan 3 January, 2015 1 Centre for the Study of Regional Development, Jawaharlal Nehru University, Delhi Email correspondence: [email protected]2 Economics and Planning Unit, Indian Statistical Institute, Delhi Email correspondence: [email protected]3 J-PAL, Delhi Email correspondence: [email protected]ISBN: 978-1-908749-45-1
Transcript
email: [email protected] Effective States and Inclusive Development Research Centre (ESID) School of Environment and Development, The University of Manchester, Oxford Road, Manchester M13 9PL, UK
www.effective-states.org
ESID Working Paper No. 35
The National Rural Employment Guarantee Scheme in Rajasthan: Rationed funds and their allocation across villages
Himanshu,1 Abhiroop Mukhopadhyay2 and M. R. Sharan3 January, 2015
1Centre for the Study of Regional Development, Jawaharlal Nehru University, Delhi Email correspondence: [email protected] 2Economics and Planning Unit, Indian Statistical Institute, Delhi Email correspondence: [email protected] 3 J-PAL, Delhi Email correspondence: [email protected]
ISBN: 978-1-908749-45-1
The National Rural Employment Guarantee Scheme in Rajasthan: Rationed funds and their allocation across villages
1
Abstract
The performance of the National Rural Employment Guarantee Scheme (NREGS) in Rajasthan has been a matter of debate, both for its stupendous performance in the initial years of the scheme, but also for the relative sharp decline after 2010. Using a large primary survey collected from a representative sample across districts, this paper shows that the decline in performance of NREGS in Rajasthan is not entirely due to the lack of demand. Instead, the supply-driven, top-down nature of the programme has led to a ‘discouraged worker’ syndrome, with workers showing disinterest in demanding work and passively waiting for availability of NREGS work. In this context, we show the role of elected representatives in allocating work to households. We find evidence of the significant influence of Sarpanches in deciding work allocation across villages. Using a sample of 328 villages in 75 multi-village Panchayats, we find evidence of rationing in favour of the village where the Sarpanch resides. Strengthening the demand-based nature of NREGS may reduce the need for rationing. Our results also suggest that a simple temporal tracking of NREGS outcomes at the village level, along with proper recording of demand through the MIS (management information system), may help detect discrimination within Panchayats.
Keywords: NREGS, India, political economy
Acknowledgements
The authors wish to thank Effective States and Inclusive Development Research Centre (University of Manchester), Centre de Sciences Humaines (Delhi) and Planning and Policy Research Unit (Indian Statistical Institute-Delhi) for funding this study. This project has also received funding from the European Union’s Seventh Framework Programme for research, technological development and demonstration under grant agreement no 290754 (NOPOOR). The views expressed in this publication are the sole responsibility of the authors and do not necessarily reflect the views of the European Commission. We wish to thank participants of the ‘MG-NREGS: Understanding the constraints to Implementation’ workshop (Delhi). The usual disclaimers apply. Himanshu, Mukhopadhyay, A. and Sharan, M. R. (2014) The National Rural Employment Guarantee Scheme in Rajasthan: Rationed funds and their allocation across villages. ESID Working Paper No. 35. Manchester, UK: University of Manchester. Available at www.effective-states.org
This document is an output from a project funded by the UK Aid from the UK Department for International Development (DFID) for the benefit of developing countries. However, the views expressed and information contained in it are not necessarily those of, or endorsed by, DFID, which can accept no responsibility for such views or information or for any reliance placed on them
The National Rural Employment Guarantee Scheme in Rajasthan: Rationed funds and their allocation across villages
2
Introduction
As per official statistics released by the Indian Ministry of Rural Development (MoRD) for the period between the launch of the National Rural Employment Guarantee Scheme (NREGS) in February 2006 and March 2014, over 1658.77 crore person days have been provided under the Scheme. While this may be, in isolation, a staggering figure, it hides what observers of the programme have known for a few years now – the Scheme may be losing steam. This is evidenced by the fact that the budget outlay for the NREGS at the centre has been declining since peaking around 2010-11, even though minimum wages under the Scheme have gone up. This has been mirrored by a commensurate reduction in households employed and person days generated. While various explanations have emerged, there is some consensus within the establishment that the demand for NREGS has become satiated (Business Standard, 20114). Given that the years of relative decline in NREGS performance also coincide with years of significant wage increase and sharp reduction in rural poverty, there is some merit in arguments in favour of demand saturation. Nonetheless, there is also ample evidence, based on secondary data as well as primary field studies, to suggest that not all of the decline in person days generated is attributable to increasing prosperity in rural areas. In particular, supply-side factors, such as flow of finances, administrative bottlenecks, minimum wage policy as well as flaws in programme, have also contributed to a relative decline in the functioning of the programme (Imbert and Papp 2011; Ravi and Engler 2009; Afridi et al. 2012; Khera 2011). While this is seen in the case of most states, Rajasthan stands out as a notable case of a state which has seen sharp deterioration, not only in terms of person days generated, but also other indicators of NREGS functioning. In this paper, using a comprehensive dataset from Rajasthan, we argue that while trends in NREGS expenditure in the state have mirrored those in the country, there is little evidence to suggest demand saturation. Instead, we provide tentative evidence that there is active rationing of NREGS work and that this has distributive repercussions. This paper is divided into three broad sections. In Section 1, we discuss the general trends in NREGS implementation in India, with a specific focus on Rajasthan. Here, we point out that work provision under the NREGS has been falling and that Rajasthan follows the national trend, if only more drastically. In the second section, we scrutinise the most prominent explanation for this decline in expenditure, namely, the lack of demand for NREGS work in the recent past. We use data from a survey covering 75 Panchayats, 328 villages and 3,916 households in Rajasthan to test for this hypothesis. First, we establish that NREGS in Rajasthan is not yet demand-constrained. Second, using temporal data on NREGS implementation for the sample, we show that there has been significant rationing in provision of works from the supply side since 2009. In the third section, we use data from our survey to suggest possible instruments for rationing of NREGS works. We focus on the rationing of NREGS works at the Panchayat level. We show that, given paucity of funds, the Sarpanch of the Panchayat tends to favour persons of his own village within the
The National Rural Employment Guarantee Scheme in Rajasthan: Rationed funds and their allocation across villages
3
Panchayat. These imply differing NREGS outcomes, depending on whether a person belongs to a particular village.1 Section 4 concludes.
1. Trends in NREGS: the Rajasthan story
The NREGS started in the financial year 2005-2006 and was rolled out in phases. Initially restricted to 200 ‘poorest’ districts of India (February 2006), it was first extended to 130 more districts in phase II (May 2007) and to all districts by 1 April 2008. Reflecting this expansion of the Scheme, both expenditure on the Scheme and the number of households employed rose steadily between 2006-07 and 2008-09 (Figure 1). The number of households provided with employment continued to rise steadily until the financial year 2010-11 and then fell away. The figure in 2012-13 was about 10 percent lower than the peak achieved in 2010-11. Person days generated fell away even more quickly and in a starker manner: the decline began a year in advance (person days peaked in 2009-10) and the figure for the financial year 2012-13 was nearly 20 percent lower than the peak. Thus, not only were fewer households getting work post 2010-11, households were working fewer days too.
Source: MIS
Simultaneously, the central government reduced expenditures – both planned and actual – on the Scheme (Figure 2). Budget outlay for the NREGS centrally was at Rs.40,100 crore in 2010-11 and stands at Rs.33,000 crores for the current fiscal, even though the notified NREGS wages have been rising in all states.
1 For a survey of the political economy dimensions of NREGS, see Mukhopadhyay (2012).
Employment Provided (in crore households) Persondays (In crores)
The National Rural Employment Guarantee Scheme in Rajasthan: Rationed funds and their allocation across villages
4
Source: MIS
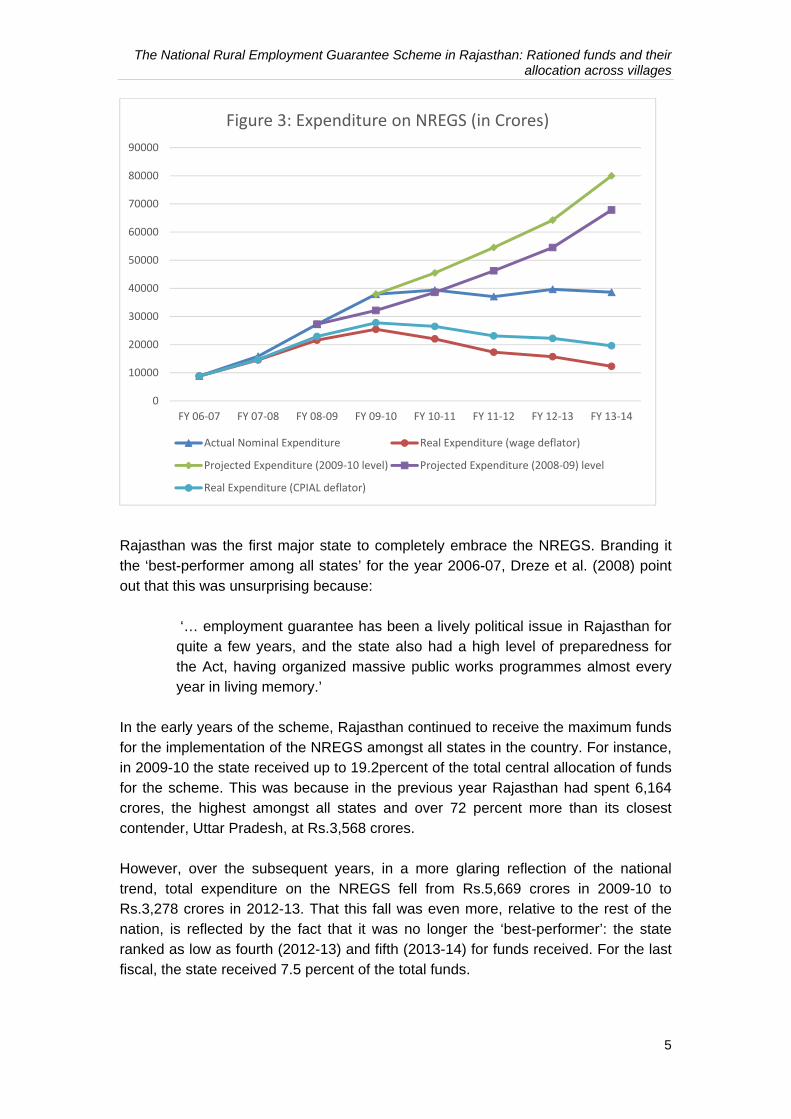
While nominal expenditure shows stagnant expenditure from the peak achieved in 2009-10, the expenditure in real terms shows a sharp decline adjusted for inflation. Figure 3 shows the various estimates of NREGS expenditure in nominal as well as real terms. What is obvious from the chart is that the real expenditure declined after 2009-10, irrespective of the choice of deflator. In real terms, the decline is from a high of 27,771 crores (2006-07 prices) to as low as 19,605 crores in 2013-14, once adjusted for inflation implicit in the CPIAL. However, since this is a wage employment programme, another way of looking at it is to use the nominal growth of wage rates as the deflator.2 That is, the real expenditure accounting for wage rate increase. By this measure, the real expenditure declined from a high of 25,461 crores in 2009-10 to almost half, at 12,295 crores in 2013-14. However, this decline in real expenditure did not lead to proportionate decline in person-days worked. This was achieved by keeping the wage rates under NREGS fixed, in some states lower than the state minimum wages and, in most states, NREGS minimum wages are lower than the comparable private market wages, defeating the very rationale of a public employment programme.3 On the other hand, had the central government indexed the expenditure to the rate of growth of wages in the private labour market to the 2009-10 expenditure, the nominal expenditure would have been 79,976 crores in 2013-14.4
2 The chart shows the actual nominal expenditure deflated by the consumer price index for agricultural labourers (at 2006-07 prices). The wage deflator referred to in the chart refers to the rate of growth of nominal wages as obtained from the Labour Bureau wage data. 3 This was challenged in the High Court of Karnataka, which ruled against keeping NREGS minimum wages lower than state minimum wages. The Ministry of Rural Development, government of India appealed against this order. A final verdict on this is awaited from the Supreme Court. 4 Since 2009-10 was a drought year, the high expenditure on NREGS may be because of the drought. The chart also shows the projected expenditure if the real expenditure of 2008-09 was maintained in subsequent years.
Figure 2: Spending trends in the NREGS (all India)
Budget Outlay (In Rs Crore) Central Release (In Rs Crore) Expenditure (In Rs Crore)
The National Rural Employment Guarantee Scheme in Rajasthan: Rationed funds and their allocation across villages
5
Rajasthan was the first major state to completely embrace the NREGS. Branding it the ‘best-performer among all states’ for the year 2006-07, Dreze et al. (2008) point out that this was unsurprising because:
‘… employment guarantee has been a lively political issue in Rajasthan for quite a few years, and the state also had a high level of preparedness for the Act, having organized massive public works programmes almost every year in living memory.’
In the early years of the scheme, Rajasthan continued to receive the maximum funds for the implementation of the NREGS amongst all states in the country. For instance, in 2009-10 the state received up to 19.2percent of the total central allocation of funds for the scheme. This was because in the previous year Rajasthan had spent 6,164 crores, the highest amongst all states and over 72 percent more than its closest contender, Uttar Pradesh, at Rs.3,568 crores. However, over the subsequent years, in a more glaring reflection of the national trend, total expenditure on the NREGS fell from Rs.5,669 crores in 2009-10 to Rs.3,278 crores in 2012-13. That this fall was even more, relative to the rest of the nation, is reflected by the fact that it was no longer the ‘best-performer’: the state ranked as low as fourth (2012-13) and fifth (2013-14) for funds received. For the last fiscal, the state received 7.5 percent of the total funds.
The National Rural Employment Guarantee Scheme in Rajasthan: Rationed funds and their allocation across villages
6
A fall in spending goes hand-in-hand with a reduction in employment and it was no different in Rajasthan, in terms of households receiving work (Figure 3; person days also shows a similar trend). The fall here has been dramatic: between 2008 and 2013, households employed under the scheme reduced by 34 percent; person days generated more than halved.
Source: MIS.
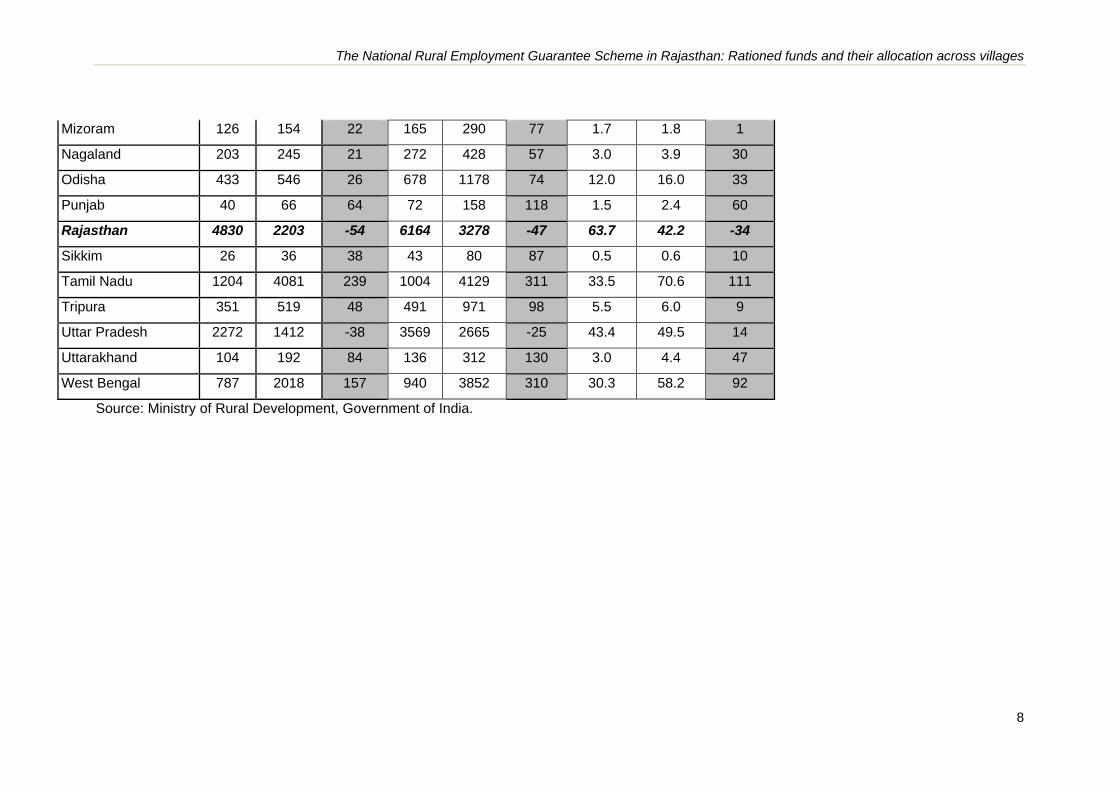
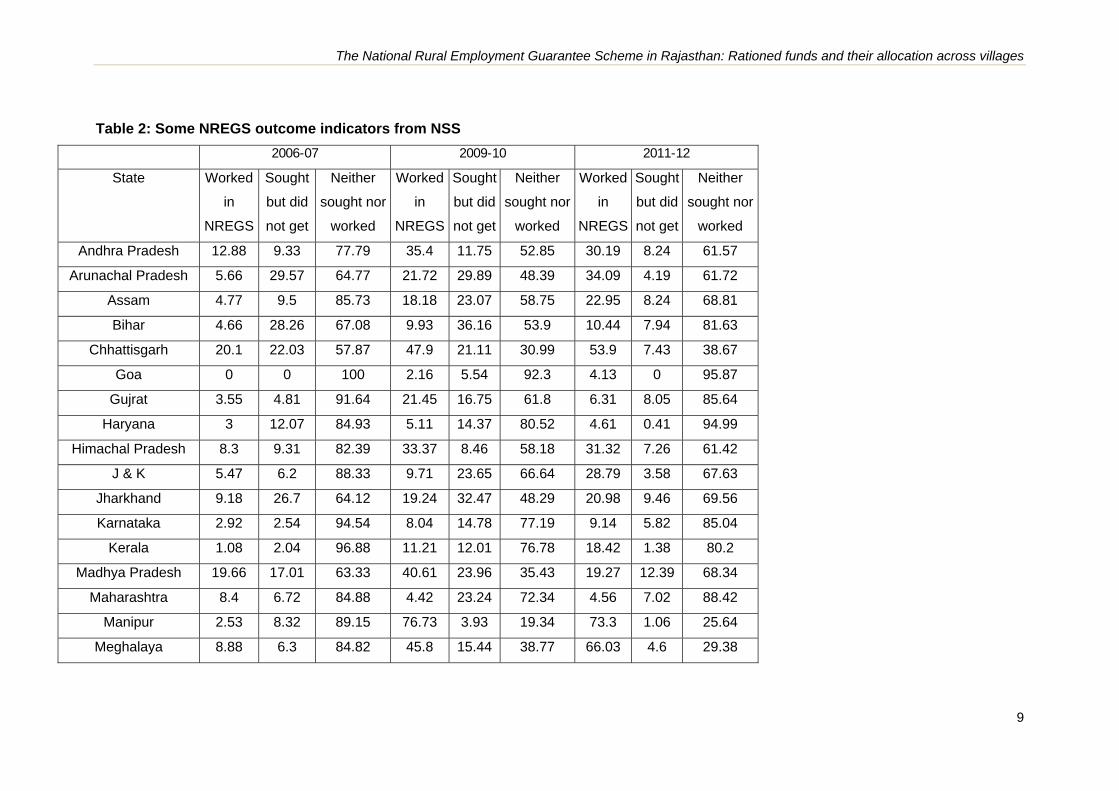
In an absolute sense, Rajasthan’s decline is significant. However, how does it compare with respect to the performance of other states during the same period? Table 1 does a comparison between Rajasthan and other states for three key indicators – households employed, person days generated, and NREGS spending – between 2008 and 2013. Indeed, Rajasthan’s decline has been unprecedented: it has had the steepest decline in spending amongst all states in the interval; its decline of 54.4 percent for person days generated is the largest after Assam; furthermore, only Bihar and Assam do worse when it comes to households employed. On the other end of the spectrum are the southern trio of Karnataka, Kerala and Tamil Nadu, all of whom have shown an increase in person day generation of over 100 percent. Other states, such as West Bengal, Chhattisgarh, Odisha, Jharkhand, Andhra Pradesh and Maharashtra have shown modest to high increases in person days. The decline of Rajasthan is also evident from independent data available in the socio-economic surveys collected by the National Sample Survey (Table 2). The data collected for 2006-07, 2009-10 and 2011-12 categorise respondents into three groups: those who got work in NREGS; those who sought but did not get work; and those who neither sought nor worked in NREGS5. We report results based at the household level. As seen in the official data of the MoRD, the performance of Rajasthan improved between 2006-07 and 2009-10, but declined sharply from then onwards. While the percentage of households in rural areas reporting getting some work in NREGS increased from 11 percent in 2006-07 to 25 percent in 2009-10, following the expansion of the programme, the next two years saw these come dow
5 Data for 2006-07 and 2011-12 have been aggregated at household level to arrive at comparable numbers.
0
2000
4000
6000
8000
0
0.2
0.4
0.6
0.8
FY 08‐09 FY 09‐10 FY 10‐11 FY 11‐12 FY 12‐13
Figure 3: Funds Received and Households employed (Rajasthan)
Number of households (in crores) Funds received (in crores)
The National Rural Employment Guarantee Scheme in Rajasthan: Rationed funds and their allocation across villages
All India 10.54 12.63 76.83 24.85 19.81 55.33 21.9 8.06 70.04
Source: National Sample Survey.
Note: The data for 2006-07 and 2011-12 were collected from individuals (aggregated at the household level) while data for 2009-10 were collected on household basis.
The National Rural Employment Guarantee Scheme in Rajasthan: Rationed funds and their allocation across villages
11
to 22 percent only. The corresponding percentages in Rajasthan were 21 percent in 2006-07 to 62 percent in 2009-10, but declined to 35 percent in 2011-12. During the same period, the percentage of households which sought work but did not get it declined from 22 percent in 2006-07 to 11 percent in 2009-10, but went up again to 16 percent in 2011-12. In terms of percentage of households who sought work, only 15 percent were denied work in 2009-10, but this number went up to 32 percent in 2011-12. Clearly, the decline in person days of employment generated in the case of Rajasthan is not entirely a result of decline in demand. The drastic reduction in person days generated under NREGS is further confirmed from another set of data from the NSS. An analysis of comparable data from the daily status employment estimates show a decline in person days worked in NREGS from 45 lakhs in 2009-10 to just 7 lakhs in 2011-12. In terms of percentage of days worked in NREGS out of total person days in casual work (public plus private), the decline is from 15 percent in 2009-10 to only 2.4 percent in 2011-12. The evidence on unmet need from the NSS surveys is an important indicator of the problems of rationing and governance in the functioning of NREGS. Interestingly, such evidence from the official statistics is hard to come by, since most states report no, or a negligible number of, households whose demand for work has not been met. One of the major reasons for this has been the penal provision of unemployment allowance which is to be paid by the state governments. It is interesting to note that so far there have only been a few cases where unemployment allowance has been paid on account of non-fulfilment of demand. In cases where it has been paid, it has been after a long struggle. However, independent surveys, including the NSS surveys, have consistently shown unmet demand under NREGS. Dutta et al. (2012) have examined the unmet demand using NSS data for 2009-10 and have found that poorer states tend to have higher unmet demand, which is a reflection of the poor administrative capacity in these states. The 2011-12 data further confirms the lower unmet demand.
2. Falling expenditure: lack of demand?
Rajasthan’s relatively poor performance in the recent past has not gone unnoticed. As recently as January 2014, the state’s Panchayati Raj and Rural Development Minister, G. C. Kataria, responding to a question in the state Assembly, declared that villagers were not opting for NREGS work because of the ‘low wages offered under the central scheme, as opposed to the state government’s minimum wages and the availability of permanent works’ (Business Standard 2014). This chain of reasoning, contrasting ‘low’ NREGS wages with higher wages outside, thereby ensuring limited demand for work, is a familiar one, gaining much traction amongst elected representatives and members of the bureaucracy alike. 6 However, independent studies also pointed to bureaucratic delays in flow of funds and other administrative
6 While NREGS continues to pay minimum wages mandated by the NREG Act, the central government put a cap on the maximum wages that can be paid under the wages by the central government. This was a departure from the previous practice, whereby states were allowed to pay the minimum wage prevalent in the state.
The National Rural Employment Guarantee Scheme in Rajasthan: Rationed funds and their allocation across villages
12
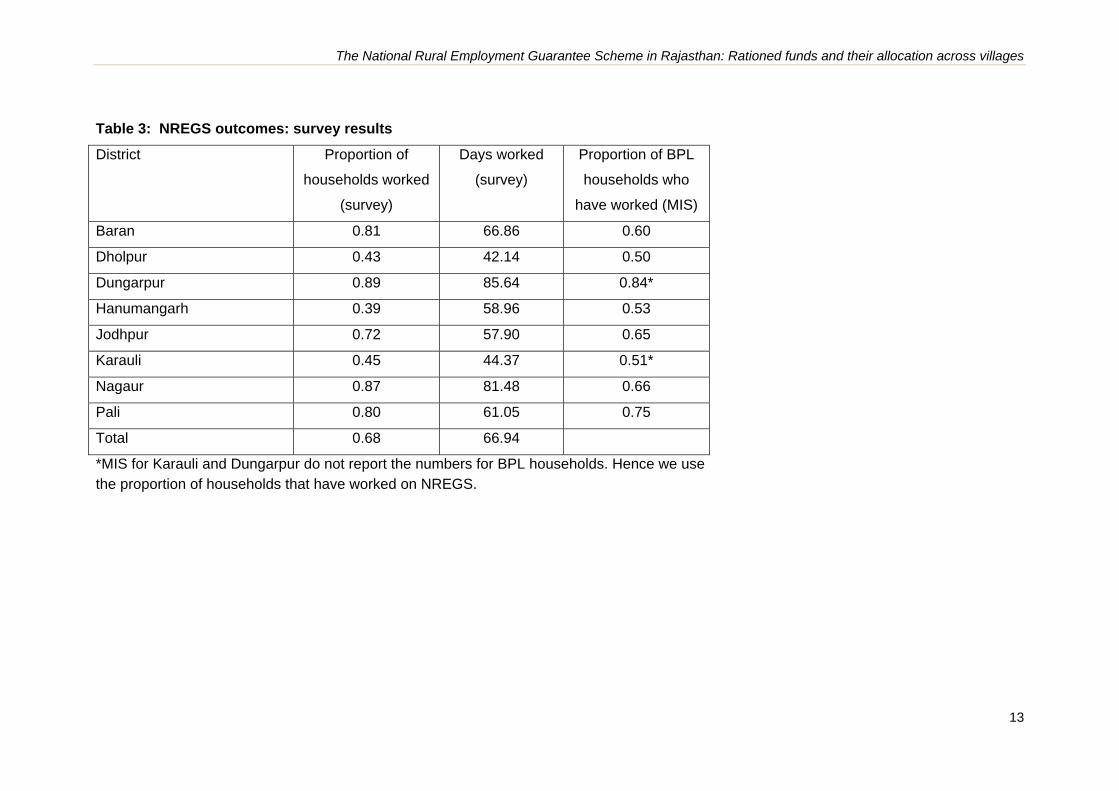
measures which may have contributed to lower employment generation under NREGS.7 To investigate this issue, data was collected to test for the lack of demand for NREGS works. The survey conducted covered 75 Gram Panchayats (GPs), 328 villages and 3,916 households across eight districts. Since the focus of the study was to study intra-GP distribution of NREGS work, the 75 GPs were sampled at random from the list of GPs in Rajasthan that had at least two villages. Around 91 percent of GPs in Rajasthan have more than, or equal to, two villages.8 The survey was carried out in May to August 2013 and covered NREGS participation in the previous 365 days. Three instruments were administered in each of the GPs surveyed: a GP questionnaire, a village questionnaire and a household questionnaire. GP-level data was compiled from interviews conducted at the NREGS administrative offices at the Panchayat; information on the current and past Sarpanch was obtained by conducting direct interviews with them; the ‘village-level data’ was procured from discussions with various knowledgeable participants residing in the village of a GP (efforts were made to include people from each Jati (sub-caste) residing in the village); where possible, village-level data was verified with village-level administrative records. For collecting household-level data, households unlikely to work on NREGS were excluded. A random sample was drawn from the remaining.9 Given the exclusion of large landlords, the study oversamples poorer households which are more likely to work on NREGS. Table 3 provides a district-wise breakdown of NREGS performance, focusing on two basic indicators: proportion of surveyed households having worked on the NREGS in the past year and, conditional on having worked, the amount of days worked on the scheme. On average, about 68 percent of households claim to have done some work on the NREGS in the last 365 days; the mean number of days worked for these households was 67. There is, however, considerable variation between districts. Nagaur, Pali, Dungarpur and Baran provided work for over 80 percent of households, whereas Dholpur and Karauli provided work for a little over 40 percent. 10 Households
7 A good anthology of various studies on NREGS is available in MGNREGS Sameeksha (2013). 8 Moreover, 73 percent of GPs have more than two villages. 9 60 households were surveyed in each GP and their allocation across villages was determined using the relative weight of each village in the GP population. Only one exclusion criterion was followed: households unlikely to work on NREGS (such as big landlords) were not surveyed. 10 Among the districts surveyed, Karauli and Dungarpur were part of the first phase districts. The rest were part of the last phase districts.
The National Rural Employment Guarantee Scheme in Rajasthan: Rationed funds and their allocation across villages
13
Table 3: NREGS outcomes: survey results
District Proportion of
households worked
(survey)
Days worked
(survey)
Proportion of BPL
households who
have worked (MIS)
Baran 0.81 66.86 0.60
Dholpur 0.43 42.14 0.50
Dungarpur 0.89 85.64 0.84*
Hanumangarh 0.39 58.96 0.53
Jodhpur 0.72 57.90 0.65
Karauli 0.45 44.37 0.51*
Nagaur 0.87 81.48 0.66
Pali 0.80 61.05 0.75
Total 0.68 66.94
*MIS for Karauli and Dungarpur do not report the numbers for BPL households. Hence we use the proportion of households that have worked on NREGS.
The National Rural Employment Guarantee Scheme in Rajasthan: Rationed funds and their allocation across villages
14
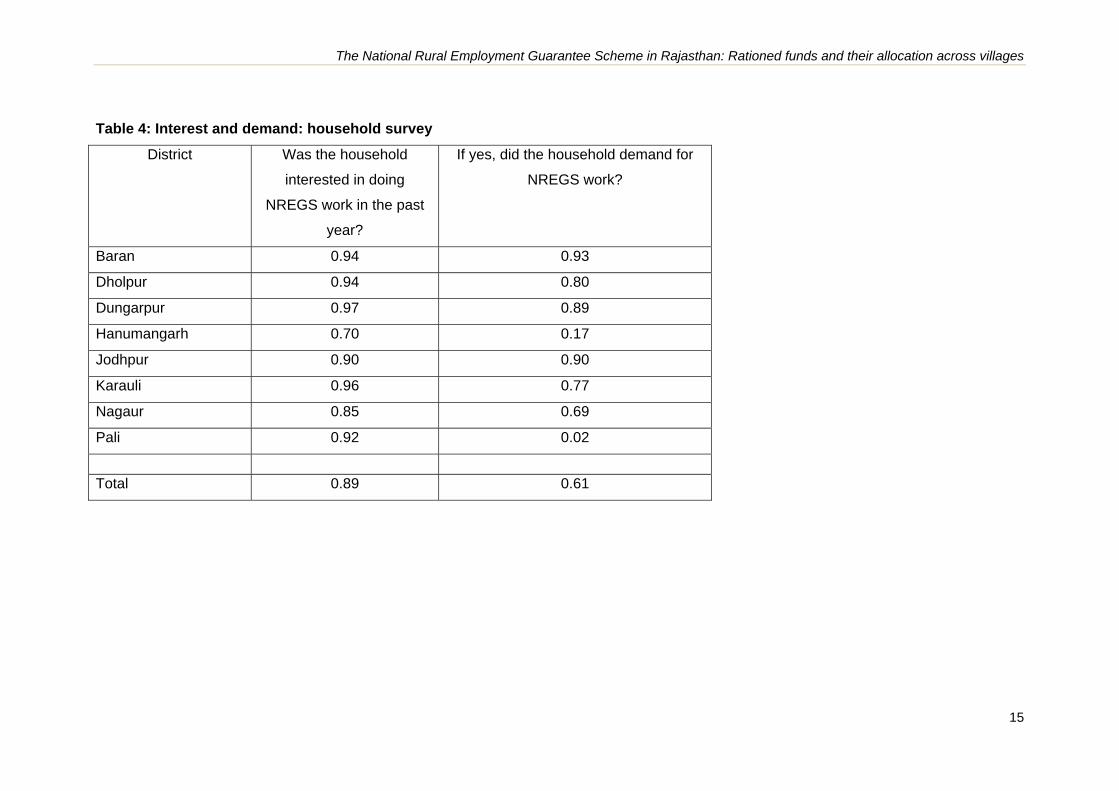
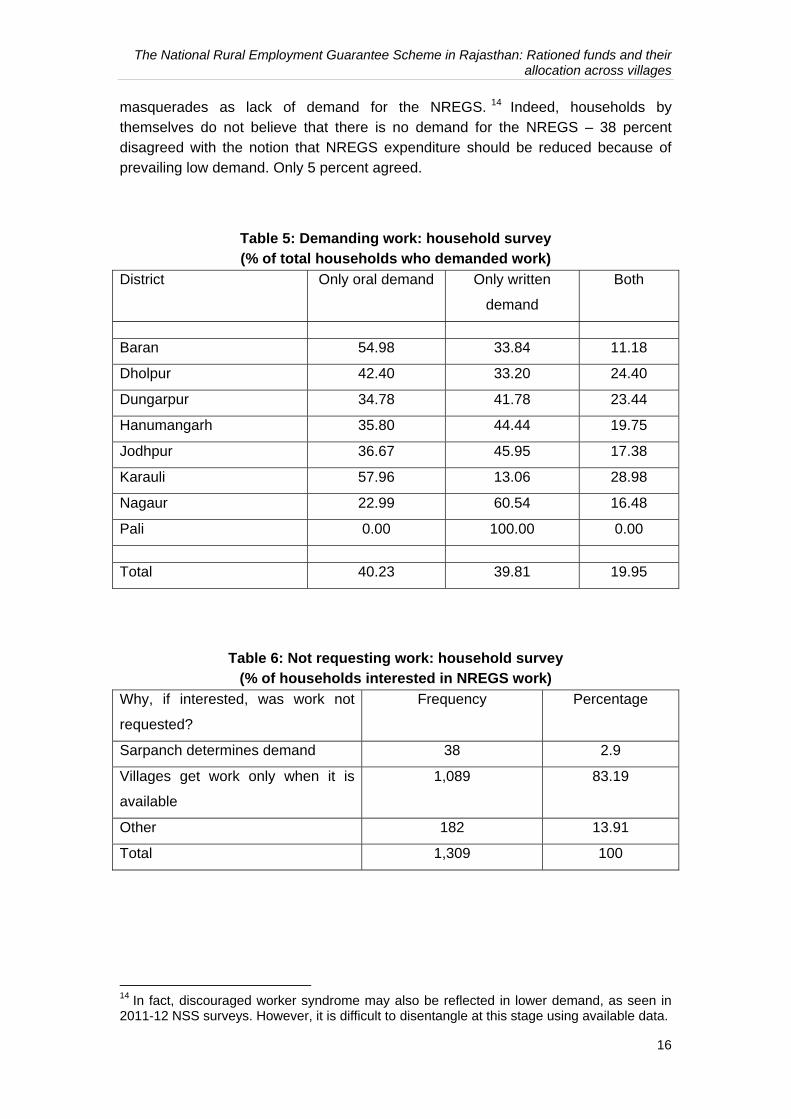
in Hanumangarh report having worked the least, with 38.6 percent. Since our study oversamples the poor, an adjacent column shows proportion of below poverty line (BPL) households who worked based on the data in the MIS.11 Do these numbers match up to the demand in for NREGS in these districts? The household survey was specifically designed to capture the demand for NREGS works in the village. Table 4 shows that a very significant 89 percent of the households were interested in doing NREGS work across the eight districts. There is some inter-district variation, but even the in district with the least proportion of households working (Hanumangarh), 70 percent of households wanted to work. Not everyone who expressed interest actually requested work: this is particularly true in the case of Pali, where an overwhelming majority – 94 percent – expressed interest in the NREGS, but only 2 percent actually demanded work. Overall, despite this, 61 percent of households requested work. The overwhelming number of respondents who were interested in working at NREGS should also put to rest some of the doubts raised on the demand for NREGS. It is also worth mentioning that interest in working in NREGS was fairly similar across districts.12 Also noteworthy is the fact that almost two-thirds of those who expressed disinterest in working for NREGS did so because they perceived the wages in NREGS to be too low.13 Since requesting work is a critical indicator for eliciting demand, we focus on the process of work request and why work in not requested. When we focus on how the work was requested, we find that over 40 percent of the households who demanded work made only an oral request (Table 5). However, what is interesting is that the district-level proportion of oral requests is not correlated to the proportion of households getting work (conditional on interest). It has often been argued that, since demand requests are not written down/documented in the case of oral requests, this leads to an under-reporting of demand. However, clearly NREGS outcomes seem to be invariant to whether requests are oral or written. Significantly, the chief reason for not requesting work is that households genuinely believed their request would not be taken seriously (Table 6). Almost 83 percent of the households interested in NREGS work did not request work because they believed that ‘villages get work only when it is available’. Here, the lack of faith in the system – born, to some extent at least, from previous experience –
11 The numbers reported by MIS and our survey are not strictly comparable. First, we have excluded single village Panchayats. Second, we do not explicitly sample BPL households in our survey. 12 This is also relevant in the context of repeated demands to curtail the NREGS to only 200 districts. As is obvious, interest in working is fairly large, even in those districts which were not part of the first phase 200 districts. 13 This is particularly important, since expression of interest here also means preference of NREGS work over other private work.
The National Rural Employment Guarantee Scheme in Rajasthan: Rationed funds and their allocation across villages
15
Table 4: Interest and demand: household survey
District Was the household
interested in doing
NREGS work in the past
year?
If yes, did the household demand for
NREGS work?
Baran 0.94 0.93
Dholpur 0.94 0.80
Dungarpur 0.97 0.89
Hanumangarh 0.70 0.17
Jodhpur 0.90 0.90
Karauli 0.96 0.77
Nagaur 0.85 0.69
Pali 0.92 0.02
Total 0.89 0.61
The National Rural Employment Guarantee Scheme in Rajasthan: Rationed funds and their allocation across villages
16
masquerades as lack of demand for the NREGS. 14 Indeed, households by themselves do not believe that there is no demand for the NREGS – 38 percent disagreed with the notion that NREGS expenditure should be reduced because of prevailing low demand. Only 5 percent agreed.
Table 5: Demanding work: household survey (% of total households who demanded work)
District Only oral demand Only written
demand
Both
Baran 54.98 33.84 11.18
Dholpur 42.40 33.20 24.40
Dungarpur 34.78 41.78 23.44
Hanumangarh 35.80 44.44 19.75
Jodhpur 36.67 45.95 17.38
Karauli 57.96 13.06 28.98
Nagaur 22.99 60.54 16.48
Pali 0.00 100.00 0.00
Total 40.23 39.81 19.95
Table 6: Not requesting work: household survey (% of households interested in NREGS work)
Why, if interested, was work not
requested?
Frequency Percentage
Sarpanch determines demand 38 2.9
Villages get work only when it is
available
1,089 83.19
Other 182 13.91
Total 1,309 100
14 In fact, discouraged worker syndrome may also be reflected in lower demand, as seen in 2011-12 NSS surveys. However, it is difficult to disentangle at this stage using available data.
The National Rural Employment Guarantee Scheme in Rajasthan: Rationed funds and their allocation across villages
17
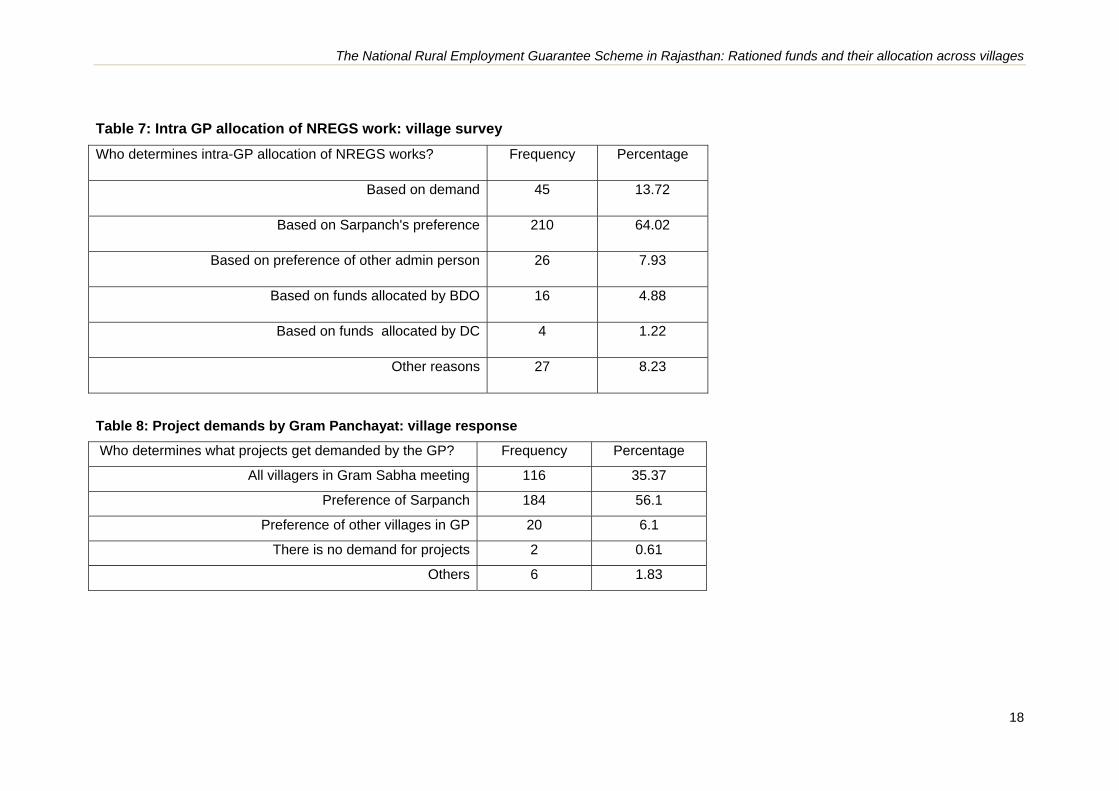
We now extend these results with findings from the village survey.15 The results mirror those in the household survey, essentially representing aggregated versions of responses seen there: of the 328 villages surveyed, over 94 percent of the villages claimed that they were demand constrained. However, only a shade over half the villages (53.42 percent) actually made a request to someone in the administration. Of those that made no request, all but one village implied that the scheme was essentially supply-driven: a bulk of them (88.19 percent) said villagers would get work when it was ‘available’, others said that there was no point asking because the Sarpanch would not listen to them (11 percent). Thus, a mere 4.57 percent felt that households in their villages got work whenever they demanded it. Indeed, what emerged from the village survey was the key role played by the Sarpanch in determining both which villages got work and what work would be given.16 The Sarpanch did not merely represent people’s preferences, he seemed to impose his/her own preferences on the scheme. A mere 14 percent of the villages felt that intra-GP allocation of NREGS work was determined by the demand for work from that village (Table 7). Over four times that figure felt that the Sarpanch determined intra-GP allocation. A similar number pointed out that it was the Sarpanch who determined what projects were demanded and which ones were consequently implemented (Table 8). To get the view of all the local players in the Panchayat, we also interviewed Sarpanches. We asked the Sarpanches in the 75 GPs if they felt that the demand for NREGS was falling. About 55 percent of the Sarpanches disagreed. Furthermore, about 36 percent of the Sarpanches said that there was at least one village in their GP where they could not provide as much work as was demanded. The main reasons cited were either political (‘the villagers are from the opposite party/allege false complaints/are too small in number’), geographical (‘lack of work-sites’) or inefficiency in the bureaucracy (‘Work has not been sanctioned/lack of funds/Block Development Officer doesn’t care’). Therefore, the picture that emerges from our three separate surveys represents a holistic picture of the demand-side question that can be summarised in three points. One, the demand for the NREGS is robust, with very few of the sampled households and villages uninterested in working under the scheme; this fact is further underscored by the findings that a significant majority actually requested work and that the Sarpanches themselves admitted to unmet demand. Two, there is a feeling shared by many that work is provided only when it is ‘available’ and that households or villages demanding work may not actually get any work. Three, the availability of
15 The view of the focus group of the village also reflects that the issues raised through the household survey are not specific to our sample of households. 16 Other studies have also confirmed the role of village elders or influential decision makers in rationing of NREGS work. See Deininger and Liu (2013) for Andhra Pradesh study.
The National Rural Employment Guarantee Scheme in Rajasthan: Rationed funds and their allocation across villages
18
Table 7: Intra GP allocation of NREGS work: village survey
Who determines intra-GP allocation of NREGS works? Frequency Percentage
Based on demand 45 13.72
Based on Sarpanch's preference 210 64.02
Based on preference of other admin person 26 7.93
Based on funds allocated by BDO 16 4.88
Based on funds allocated by DC 4 1.22
Other reasons 27 8.23
Table 8: Project demands by Gram Panchayat: village response
Who determines what projects get demanded by the GP? Frequency Percentage
All villagers in Gram Sabha meeting 116 35.37
Preference of Sarpanch 184 56.1
Preference of other villages in GP 20 6.1
There is no demand for projects 2 0.61
Others 6 1.83
The National Rural Employment Guarantee Scheme in Rajasthan: Rationed funds and their allocation across villages
19
work is partly determined by the Sarpanch, though the Sarpanch claims to be constrained by local political factors and the lack of funds and interest from the tier above.
3. Mechanisms for rationing and allocation to villages
Having established the declining expenditure on the NREGS in Rajasthan, the presence of unmet demand and the supply-driven nature of the scheme, we try and put forward mechanisms for rationing NREGS works. How and why is it that some households get work and others do not, despite wanting to work on the scheme? Any rationing mechanism comprises causes and consequences, and we look for these below. We briefly went over the three broad categories of reasons – geographical, political and bureaucratic – that result in unmet demand in the previous section. In the case of the first and, to some extent, the third, the matter is beyond the control of the Sarpanch. However, using our dataset, we could still characterise – especially with respect to fund-flow issues caused by members of the higher bureaucracy – the problem at hand and arrive at some reasonable estimation of the significance of the same. Therefore, here we identify and describe a potential cause of rationing. Given that limited budgets are a reality, a Sarpanch has to grapple with identifying the ones to whom he/she would want to give work under the scheme. Here, thus, we look at the consequence of rationing. In letter, the NREGS is completely demand driven. This implies that even funds flowing to a Panchayat are determined by the amount of work that has been demanded by its constituent workers. Broadly, demand is registered either in a Gram Sabha or through applications (primarily written) submitted separately, by the Sarpanch and the Field Assistant, and is passed onto the higher officials in the state bureaucratic machinery. Funds are then transferred accordingly to the Panchayat’s account from above, for both material and labour spending, and subsequent payments to workers are made via cheque. Thus, there is not necessarily always a corpus of funds at the Panchayat. It is, therefore, evident that in an environment where funds are scarce – as we have shown for Rajasthan above – favoured Sarpanches are likely to get preference. We asked the Sarpanches who they thought decided the allocation of funds to their GP. The table below summarises their responses on the most important person in the decision-making process. Unsurprisingly, 43.24 percent of the Sarpanches mention that the allocation of funds was demand driven. Indeed, there is reason to believe that these responses may be biased, given Sarpanches would be loath to admit that the scheme is not demand driven. Significantly, a greater number (nearly 44.59 percent) mentioned that officials at the Block level – the Panchayat Samiti or the Block Development Officer (BDO) – had a prominent role to play in allocation of funds to their Panchayat. Clearly, there is potential for the Sarpanches to feel
The National Rural Employment Guarantee Scheme in Rajasthan: Rationed funds and their allocation across villages
20
constrained in some way, being dependent on officials higher up for funds for the NREGS (Table 9). Table 9: Project implemented by Gram Panchayat: Sarpanch response
Who determines shelf of work for
NREGS in GP?
Frequency Percentage
Demand driven 32 43.24
Sarpanch 9 12.16
Panchayat Samiti 24 32.43
Block Development Officer 6 8.11
District Collector 3 4.05
We investigate the issue further. A very significant number – about 43 percent – responded in the affirmative when asked if they actually felt fund-constrained in the past (Table 10). Of those who did, a little over 60 percent stated that officials at the block had the most prominent role to play in the allocation of funds to their GP. However, even amongst primarily demand-driven Panchayats, a not insignificant minority (18.75 percent) reported having insufficient funding in the past, suggesting that persons higher up had some role to play. In this context, it is interesting to note some of the qualitative responses we got when we asked the Sarpanches why they had not received funding. Many blamed the Panchayat Samiti. Some suggested that they belonged to a different political party from the one the Samiti backed. Others said that the Samiti simply asked for bribes that the Sarpanches were unwilling to provide. Some claimed that the Samiti was inefficient and made excuses to hide their paltry rate of working. A common non- bureaucratic reason was that the funds from the previous years were not ‘adjusted’ – implying perhaps that accounts had not been settled – and thus, they were denied Table 10: Determination of funds procured by GP: Sarpanch reponse
Funds procured by Frequency Funds insufficient in what percentage of cases
Demand driven 32 18.75
Panchayat Samiti 9 33.33
BDO 24 70.83
District collector 6 66.67
Others 3 66.67
Total 74 43.24
Note: Data at the GP level. 1 Sarpanch did not answer.
The National Rural Employment Guarantee Scheme in Rajasthan: Rationed funds and their allocation across villages
21
funds. What binds all these explanations is the sense that fund-flow is driven from above and rarely completely in the hands of the Sarpanch. A fund-constrained Sarpanch has to ration works in some manner. In an ideal scenario, the Sarpanch would provide work first to those most direly in need. However, in the current context, this is not the best approach, for at least two reasons: one, identifying a household’s need is always tricky and one can often go wrong; two, even if those most in need were somehow identified, a strategy that gives them first-preference for work may not be politically the most sagacious. If, for instance, the poorest households belong to a particular caste that is opposed to the Sarpanches, then it is unlikely that the households will vote for the Sarpanch in the coming elections, even if they are given a lot of NREGS work. One way rationing can occur is if the Sarpanch favours households from certain constituent villages over others within the GP. Conditional on there being a preference, there are two competing hypotheses on what kinds of villages are favoured: first, work provision may be skewed in favour of households from the Sarpanch’s own village. This may be because, very often, these households are the ones that prop up the Sarpanch in the first place, by voting for him in the Panchayat elections; the Sarpanch ‘repays’ the households by making them beneficiaries of various government schemes, including the NREGS. Another reason for the Sarpanch favouring his own village might simply be ease of access – households closer in distance to the Sarpanch may find it easier to collect information about the scheme and register their demand. A final reason might stem from the fact that many villages are segregated caste-wise. A Sarpanch might want to provide more work to his caste brethren and it is likely that the village in which he resides will comprise a significant number of persons belonging to his own caste – thus, he ends up favouring his own village without setting out explicitly to do so. Conversely, a Sarpanch may prefer giving work to households from other villages because he believes that households in his own village already constitute his vote-bank and do not need to be wooed. By providing more work elsewhere, the incumbent Sarpanch is trying to use government schemes to buy votes there and cement his standing among households there. This is plausible theoretically, especially if voters are flexible in their preferences for candidates and reward good governance. Rationing can also be seen as an instance of negative discrimination against certain households or villages: a calculating Sarpanch may purposely provide less work to households belonging to the opposition Sarpanch’s village in order to ‘punish’ them for their lack of loyalty towards him. A lower-caste Sarpanch may want to reverse-discriminate against upper-caste households and villages by ensuring they do not get work. Of course, a caveat is in order here: such calculations do not get made in a political vacuum and work provision may be a function of several factors. For instance, some villages may simply be unsuitable for certain kinds of work, a few
The National Rural Employment Guarantee Scheme in Rajasthan: Rationed funds and their allocation across villages
22
may have a very visible workers’ union that creates both awareness and an urgency regarding work provision. However, rationing could still occur over and above these considerations and we intend to explore this dimension below. We start off by looking at satisfaction with the NREGS amongst respondents residing in the Sarpanch’s village and those elsewhere. If our former hypothesis is true, then it would be represented by increased satisfaction with the scheme amongst respondents in the Sarpanch’s village. Based on the questions to the households, we find that households’ perception of the Sarpanch with respect to the NREGS is much better in the Sarpanch’s own village – over 64 percent belonging to the Sarpanch-villages think that the Sarpanch has done well, as opposed to 38.85 percent elsewhere. However, this is only tentative evidence of the Sarpanch actually performing better in his own village. These perceptions and responses could be biased: firstly, respondents from the Sarpanch’s own village may be biased in the favour of the Sarpanch because they share the same living space, having a ‘geographical affinity’ of sorts; or, secondly, such households may be less willing to openly criticise the Sarpanch, fearing that word of their apparent disparagement may reach the Sarpanch more easily and there could be potential backlash. However, given that these perception questions may be biased, and could suffer from framing effects, we provide evidence of actual discrimination in favour of the Sarpanch’s village. To do so, we look at administrative data on actual performances in the NREGS in the Sarpanch’s village in two separate periods and contrast it with the performance of non-Sarpanch villages. We look at the period 2008-09 to 2012-13 (excluding 2010-11, as it was an election year). The sample size falls to 279 villages (65 GPs) as administrative information is not available for the other GPs. The variables looked at are the proportion of households with job cards getting NREGS work and the number of person-days per household holding a job card. It is clear to see that Sarpanch’s village seem to do much better, both in terms of the proportion of job card households getting NREGS work and the number of person days per job card household (Table 11). The percentage of job-carded households getting work in Sarpanch villages (24 percent) is around 12 percentage points more compared to non-Sarpanch villages (12.4 percent). Analogously, the number of person days per household was almost double in the Sarpanch village (almost 15 days) as opposed to non-Sarpanch villages (seven days). 17 However such comparisons may be biased, for a couple of reasons. First, for the ‘per household’ normalisation, we have used the number of households with job cards. However, this does not take into account that fact that all households with job cards do not necessarily demand NREGS. Sarpanch villages may have a different demand for NREGS as compared to non-Sarpanch villages. Hence, dividing by the total
17 We do not consider only BPL households because there may be demand from other non- BPL households also. Not surprisingly, the proportions fall, because many holding job cards do not demand NREGS work.
The National Rural Employment Guarantee Scheme in Rajasthan: Rationed funds and their allocation across villages
23
number of households with job cards may underestimate the advantage of Sarpanch villages if a lower proportion of households with job cards actually demand NREGS work in Sarpanch villages relative to non-Sarpanch villages. On the other hand, the observed difference between the two kinds of villages may be reversed if a greater proportion of households demand NREGS work in Sarpanch villages. To alleviate these worries and to show that our results are statistically robust, we exploit the longitudinal nature of our data at the village level. The dependent variable of interest is the total number of households in a village with NREGS work and the total number of person days of NREGS work in a village. To eliminate the impact of village-level unobservable characteristics, we estimate the equation in a change form; that is, we regress the change in the total number of households in a village with NREGS work on a variable that measures whether there is a change in the status of whether the Sarpanch belongs to the village. This estimation in changes (equivalent to a first difference estimator for a panel data model) eliminates the component of the dependent variables that are due to time-invariant characteristics of the village: for example, the average poverty of the village. To further smooth the variables, we consider two periods – 2008-2009 and 2011-12 – and calculate the mean value of our dependent variables within each period. Results are similar if such smoothing is not done. The crux of the identification strategy, however, is the Sarpanch elections in 2010, whereby each village saw a potential change in status of whether the Sarpanch belonged to it. The variable in regression takes the value -1 if the village was a Sarpanch village in the period 2008-09, but not after 2010. Similarly, it takes the value 1 if it became a Sarpanch village and 0 if there is no change in status. Given temporal data, the changing nature of the external environment – for example: wages, droughts – are important covariates of the demand for NREGS work. These are taken care of with the assumption that these will be the same across all villages within the same GP. Since we explicitly consider the change in all villages within a GP, we are better able to control for the change in external environment. We allow changes in the external environment by looking at deviations of each village change from the change at the GP level (by using GP fixed effects). Using our specification, our findings go through here too, with the Sarpanch’s village providing both more households with work and more person days of work (Table 12). Our results show that the impact of the Sarpanch’s village is roughly in the range of 10 percent for both outcomes.
The National Rural Employment Guarantee Scheme in Rajasthan: Rationed funds and their allocation across villages
24
Table 12: Regression: effect of Sarpanch village
(1) (2) Variables ΔPerson days ΔNo. of households ΔSarpanch village 1,317* 17.15**
(749.7) (8.89)
GP Fixed effects Yes Yes Observations 279 279 R-squared 0.643 0.56 Number of villages 279 279 Robust standard errors; clustered by GP ***: 1 % **: 5% and *: 10%
Thus, what emerges from the above tables is that there is significant rationing of work by the Sarpanch via favouring his/her own village. This is manifested both by people’s perceptions and in actual outcomes. It is important to note that this does not immediately imply discrimination, but a distortion in the NREGS mechanism, since proximity seems to play a role. This can be through better awareness of the scheme projects for the villagers living in the Sarpanch’s village.
4. Conclusion
The performance of NREGS in Rajasthan has been the subject of debate, both for its stupendous performance in the initial years of the scheme, but also for the relative sharp decline after 2010. Using a large primary survey collected from a representative sample across districts, we have shown that the decline in performance of NREGS in Rajasthan is not entirely due to the lack of demand. While demand may have declined somewhat over the years, we still report significant demand for NREGS in a survey conducted in 2013. Thus, the lack of demand is only one factor among many which may have contributed to a decline in performance. While administrative issues, such as seasonality, flow of funds, low wages, supply-driven approach, etc., are relevant in explaining the low performance, we also find that, over the years, this may also have resulted in a discouraged worker syndrome, with workers showing disinterest in demanding work. We do not rule out the lack of demand due to improved incomes in rural Rajasthan, but we do report that this may not have had the dampening effect on demand for NREGS. However, this paper does contribute and complement a large set of literature which has looked at the local-level dynamics, particularly the role of elected representatives in channelising demand, as well as meeting demand in NREGS. In particular, we do find evidence of a significant influence Sarpanches have in deciding work allocation across villages. In our sample villages, we do find evidence of rationing in favour of the village where the Sarpanch resides. We show conclusively that this may actually be a problem where there is more than one village in a Panchayat. This contribution
The National Rural Employment Guarantee Scheme in Rajasthan: Rationed funds and their allocation across villages
25
to the growing literature on this issue may also be important in other states where multi-village Panchayats are common. While better data management from the MIS at the village level may help unravel the level of discrimination and extent of capture, the problem of intra-village dynamics within the Panchayat needs further study. In particular, issues of Jati/caste, population composition, and size of village may be relevant in understanding the dynamics of employment generation in Rajasthan. Nonetheless, at a preliminary level, the analysis of survey data does suggest that these tendencies may aggravate as a result of supply-driven rationing of NREGS funds. At the very least, our results point out that a temporal tracking of villages through MIS may readily help detect instances of uneven distribution of work within Gram Panchayats.
The National Rural Employment Guarantee Scheme in Rajasthan: Rationed funds and their allocation across villages
26
References
Afridi, F., Iversen V. and Sharan M.R. (2012). ‘Does female leadership impact on governance and corruption? Evidence from a public poverty alleviation program in Andhra Pradesh, India’, International Growth Centre Working Paper.
Business Standard (2014). ‘Low wages driving labourers away from NREGS: Raj Min’, Business Standard, 24 January. Available online: http://www.business-standard.com/article/pti-stories/low-wages-driving-labourers-away-from-mNREGS-raj-min-114012400812_1.html (accessed 11 December 2014).
Deininger, K. and Liu, Y. (2013). ‘Poverty impacts of India's National Rural Employment Guarantee Scheme: Evidence from Andhra Pradesh’. Mimeo.
Drèze, J., Khera, R. and Siddhartha (2008). ‘Corruption in NREGS: Myth and reality’. The Hindu, 22 January. Available online: http://www.thehindu.com/todays-paper/tp-opinion/corruption-in-nrega-myths-and-reality/article1183540.ece (accessed 11 December 2014).
Dutta, P., Murgai R., Ravallion M. and van de Walle, D. (2012). ‘Does India’s Employment Guarantee Scheme guarantee employment?’ Economic and Political Weekly, 47(16), 55-64.
Imbert, C. and Papp, J. (2011). ‘Impact of a public employment program on private sector wages: Evidence from India’, Working Paper, Princeton University.
Khera, R. (2011). The Battle for Employment Guarantee. New Delhi: Oxford University Press.
MGNREGA Sameeksha (2013). Various issues. Online resource: http://economictimes.indiatimes.com/topic/MGNREGA-Sameeksha.
Mukhopadhyay, A. (2012). ‘The political economy of implementing the National Rural Employment Guarantee Scheme in India’. ESID Working Paper No. 15, September.
Ravi, S. and Engler, M. (2009). ‘Workfare as an effective way to fight poverty: The case of India’s NREGS’, available at SSRN: http://ssrn.com/abstract=1336837.
email: [email protected] Effective States and Inclusive Development Research Centre (ESID) School of Environment and Development, The University of Manchester, Oxford Road,
Manchester M13 9PL, UK www.effective-states.org
The Effective States and Inclusive Development Research Centre The Effective States and Inclusive Development Research Centre (ESID) aims to improve the use of governance research evidence in decision-making. Our key focus is on the role of state effectiveness and elite commitment in achieving inclusive development and social justice.
ESID is a partnership of highly reputed research and policy institutes based in Africa, Asia, Europe and North America. The lead institution is the University of Manchester.
The other institutional partners are:
• BRAC Institute of Governance and Development, BRAC University, Dhaka
• Center for Democratic Development, Accra
• Center for International Development, Harvard University, Boston
• Department of Political and Administrative Studies, University of Malawi, Zomba
• Graduate School of Development, Policy & Practice, Cape Town University
• Institute for Economic Growth, Delhi
In addition to its institutional partners, ESID has established a network of leading research collaborators and policy/uptake experts.