15
Ministry of Land, Infrastructure, Transport and Tourism The National Spatial Strategy Minoru KIMURA Director, General Affairs Division National Spatial Planning and Regional Policy Bureau

Ministry of Land, Infrastructure, Transport and Tourism
The National Spatial Strategy
Minoru KIMURA
Director, General Affairs DivisionNational Spatial Planning and Regional Policy Bureau

National Spatial Planning System
National Spatial Strategies
National Plan
Regional Plans
Plans on infrastructure development
Priority Plan for Infrastructure Dev.
Basic Plan on Transportation Policy
Basic Plans for Housing
Long-term Development plan for land improvement
Forest Improvement and Conservation Works Master Plan
Long-term Development Plan for Fishing Harbors and Fisheries
Waste Disposal Facility Dev. Plan
Metropolitan areas dev. plans
National Capital Region Dev. Plan
Kinki Region Development Plan
Chubu Region Development Plan
National Land Use Planning
National Plan
Municipal Plans
Prefectural Plans
Land Use Master Plans
Areas controlled by individual laws
City area
Agriculture area
Forest area
Natural Park area
Natural conservation area
Promotion/Development Plan for Specific Prefectures
Okinawa Promotion Basic Policy/Plan
Hokkaido Comprehensive Development Plan
Specific areas which have own promotion/development plans
Areas with special soils
Remote islands
Amami Islands
Ogasawara Islands
Snowy areas
Mountain village areas
Peninsular areas
Depopulated areas
Northern Territories adjacent area
Other plansWater Resource Development
Basic Plans
Basic Disaster Management Plan
Basic Environmental Plan
Basic Plan for Food, Agriculture and Rural Areas
Basic Plan for Fisheries
National Spatial Planning System
Planned in an integrated manner
Role of National Spatial PlanningAn engine to promote ideal national development by unifying the directions of wide-spread policies regarding spatial planning, e.g. regional development, industry, culture, tourism, transport, telecommunication, energy,
infrastructure, disaster prevention, environment, land and resources, landscape, mutual assistance community development
1

About the National Spatial Strategy (National Plan)
Based on the “National Spatial Planning Act” (Act No. 205, 1950, former “Comprehensive National Development Act” amended and renamed in 2005)
Coordinator: National Spatial Planning and Regional Policy Bureau, MLIT
Plan duration: approx. 10 years
Procedures needed to finalize the National Plan:
• Asking for and reflecting opinions from the public
• Consultation with the heads of related administrative organs
• Hearing the opinions of the prefectures and designated citiesgovernment ordinance
• Studied and deliberated by the “National Land Development Council” in MLIT
• Cabinet decision
Post-creation:• After a few years later from cabinet decision, MLIT conduct a policy
assessment (policy review) based on the Policy Evaluations Act
A comprehensive and basic plan to promote the use, improvement and conservation of National Land
2

Comprehensive National Development Plan
New Comprehensive National Development
Plan
3rd Comprehensive National Development
Plan
4th Comprehensive National Development
Plan
Grand Design for the 21st Century
Cabinet Decision
Oct. 5, 1962 May 30, 1969 Nov. 4, 1977 June 30, 1987 March 31, 1998
Background
1.Transition to high growth economy
2.Overpopulation and disparity in income
3.National income-doubling plan (Pacific Belt Zone Project)
1.High growth economy2.Concentration of
population and industry in metropolitan areas
3.Advancement of information technology, globalization, and technical renovation
1.Stable economic growth
2.Signs of decentralization of population and industry
3.It became obvious that national resources and energies are limited
1.Concentration of population and various functions in Tokyo
2.Employment issues in non-metropolitan areas are more serious for reasons such as drastic structural changes in industry
3.Advancement of full-scale globalization
1.Global age (Global environmental issues, mega-competition, and exchanges with Asian nations)
2.Decreasing population and the aging society
3.Information-oriented society
Target year 1970 1985About 10 years from
1977Around 2000 2010 - 2015
Basic Objectives
Well-balanceddevelopment between regions
Creation of a richenvironment
Improvement of thegeneral livingenvironment
Formation of a multipolar country
Prepare the basics for a Multi-axial structure
Development method
Development of regional hubs
Decentralization of industry is needed to achieve the objectives of this plan. Efforts must be made to develop regional hubs, by organically relating them to and promoting interaction with the existing production mass in Tokyo and other metropolitan areas, with a new transportation and communication network. Such development shall be performed by maintaining the characteristics of the peripheral areas and achieving a chain reaction that promotes regionally balanced development.
Large-scale projectdevelopment
Promote large-scale projects by developing transportation networks, such as the Shinkansen(bullet train) and expressways, to mitigate the uneven use of land and solve problems such as overpopulation, depopulation, and regionaldisparities.
Stable settlement concept
Promote development of non-metropolitan areas while controlling the concentration of populationand industry in metropolitan areas. Make efforts to achieve a well-balanced use of the national territory while responding to the issues of overpopulation and depopulation, with the aim of creating a better living environment for citizens.
Interactive network concept
Establish a multipolar pattern territory with the following initiatives:1.Promote a
creative/innovative improvement of each area of national territory by maximizing regional characteristics
2.Develop backbone transportation, information, and communication networks nationwide in accordance with the national program or initiatives led by the national government
3.Establish various interaction opportunities through a joint effort between the national government, each regions, and private institutions.
Participation andCooperation
This plan conceives the participation of diverse entities and cooperation between regions as the basis for national and regional development.
[Four Strategies]
1.Build nature-rich residential areas (small cities, agricultural and fishing areas, hilly and mountainous areas)
2.Renovate metropolitan areas (renovation, renewal, and effective use of spheres in large cities)
3.Form regional cooperation corridors (regional partnership taking the form of axis)
4.Form international spheres of interaction on a large scale (which has global interactive functions)
National Spatial Strategy (National Plan)
2nd National Spatial Strategy (National Plan)
July 4, 2008 Aug. 14, 2015
1.Great turning point for socio-economic conditions (population decrease/aging, globalization, and development of information and communication technology)
2.Change/diversification of values of Japanese people
3.Conditions surrounding national land (single-polar single-axial land structure, etc.)
1.The current of the times and issues surrounding the national land (rapid population decrease and declining fertility rates, unprecedented aging, impending catastrophes, aging of infrastructures, etc.)
2.Change in the values of Japanese people (growing sense of “rural regression,” etc.)
3.Change in national space (increase in low-use/unused land, vacant houses, etc.)
About 10 years from 2008
About 10 years from 2015
-Construction of national land where various regional blocks develop autonomously
-Creating national land that is beautiful and comfortable to live in
Promotion of Active Interaction-led Spatial Development
[Five strategic objectives]
1.Exchange and cooperation with East Asia
2.Creation of sustainable regions
3.Creation of disaster-resilient, flexible national land
4.Management and inheritance of beautiful national land
5.Creation of regional areas based on the "new public" as an axis
Multilayered and resilient “Compact City
and Networks”
[Specific direction]1.The national land that shines
locally and acts globally (creating regional areas with diversity, etc.)
2.National land management and infrastructures that support safety and security, and economic growth
3.Participation and cooperation to support creation of national land (fostering actors and creating the society of mutual assistance)
History of the National Spatial Planning
3
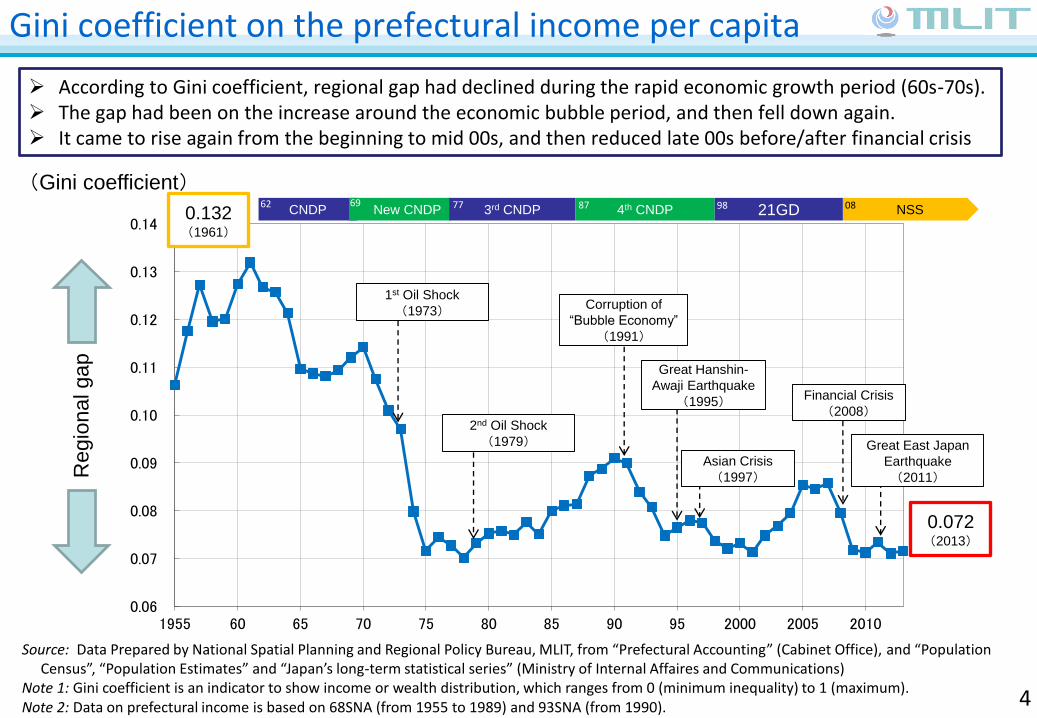
Source: Data Prepared by National Spatial Planning and Regional Policy Bureau, MLIT, from “Prefectural Accounting” (Cabinet Office), and “Population Census”, “Population Estimates” and “Japan’s long-term statistical series” (Ministry of Internal Affaires and Communications)
Note 1: Gini coefficient is an indicator to show income or wealth distribution, which ranges from 0 (minimum inequality) to 1 (maximum). Note 2: Data on prefectural income is based on 68SNA (from 1955 to 1989) and 93SNA (from 1990).
0.06
0.07
0.08
0.09
0.10
0.11
0.12
0.13
0.14
1955 60 65 70 75 80 85 90 95 2000 2005 2010
Great East Japan
Earthquake
(2011)
According to Gini coefficient, regional gap had declined during the rapid economic growth period (60s-70s). The gap had been on the increase around the economic bubble period, and then fell down again. It came to rise again from the beginning to mid 00s, and then reduced late 00s before/after financial crisis
Regio
nal gap
0.132(1961)
1st Oil Shock
(1973)
2nd Oil Shock
(1979)
Corruption of
“Bubble Economy”
(1991)
Great Hanshin-
Awaji Earthquake
(1995) Financial Crisis
(2008)
0.072(2013)
(Gini coefficient)
Asian Crisis
(1997)
CNDP New CNDP 3rd CNDP 4th CNDP 21GD NSS62 7769 87 98 08
Gini coefficient on the prefectural income per capita
4
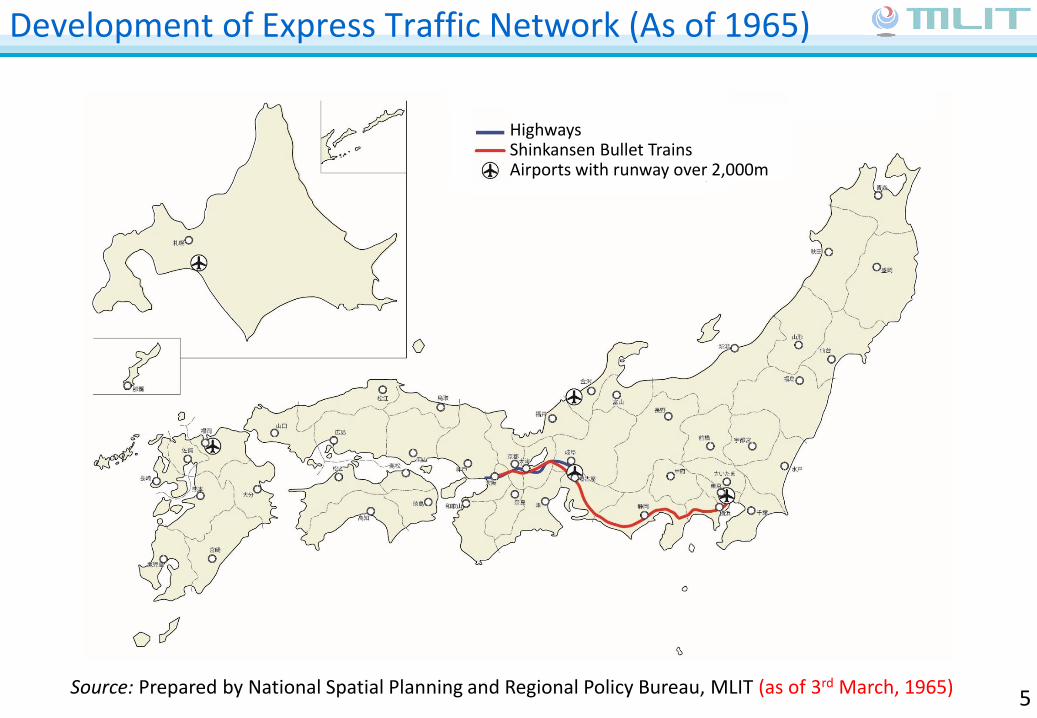
Development of Express Traffic Network (As of 1965)
Source: Prepared by National Spatial Planning and Regional Policy Bureau, MLIT (as of 3rd March, 1965)
HighwaysShinkansen Bullet TrainsAirports with runway over 2,000m
5

Development of Express Traffic Network (As of 2018)
Source: Prepared by National Spatial Planning and Regional Policy Bureau, MLIT (as of 1st June, 2018)
Highways (in service)Highways (under construction)Highways (not yet project commencement)Shinkansen Bullet Trains (in service)Shinkansen Bullet Trains (on work order)Linear Shinkansen (on work order)Hub airportsOther airports with runaway(s) over 2,000m
6

Source: Long-term analysis on population distribution in Japan (National Land Agency, 1974)Note: The data from 1920 and later is based on “Population Census”, “Population Estimates” and “Population interpolation estimated from 2005
and 2010 census results” (Ministry of Internal Affairs and Communications), and “Population Projections for Japan (estimated in 2017)” (IPSS).
Long-Term Population Trends in Japan
(Year)
(2030)119.13 million
Aging rate 31.2%
(2050)101.92 million
Aging rate 37.7%
(median projections)59.72 mil. (2100)Aging rate 38.3%
(high-end projections)72.85 mil. (2100)
(low-end projections)49.06 mil. (2100)
128.06 mil. (2010)
Peak in 2008128.08 million
Aging rate 22.1%
127.09 mil.(2015)
31.28 mil. 33.30 mil.
71.99 mil.
Meiji Restoration
(1868)
Est. of Muromachi
bakufu‘(1338)
KyohoReforms
(1716-45)Est. of
Edo bakufu(1603)
End of War
(1945)
7.5 mil. 8.18 mil.12.27 mil.
Est. of Kamakura
bakufu(1185)
The total population of Japan is likely to return to the level of a century ago (around the year 1850) over the next 100 years.
This change is a very rapid decline that is unparalleled in a thousand years.
7
130
120
110
100
90
80
70
60
50
40
30
20
10
0
(mil.)
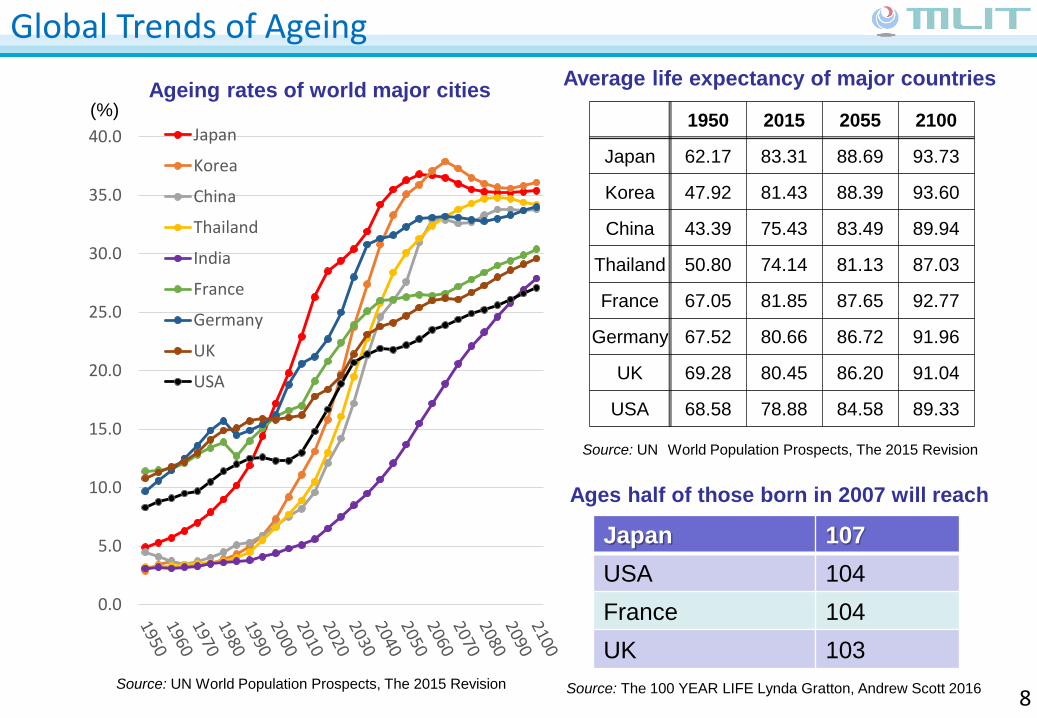
(%)Ageing rates of world major cities
Average life expectancy of major countries
Source: UN World Population Prospects, The 2015 Revision
1950 2015 2055 2100
Japan 62.17 83.31 88.69 93.73
Korea 47.92 81.43 88.39 93.60
China 43.39 75.43 83.49 89.94
Thailand 50.80 74.14 81.13 87.03
France 67.05 81.85 87.65 92.77
Germany 67.52 80.66 86.72 91.96
UK 69.28 80.45 86.20 91.04
USA 68.58 78.88 84.58 89.33
0.0
5.0
10.0
15.0
20.0
25.0
30.0
35.0
40.0 Japan
Korea
China
Thailand
India
France
Germany
UK
USA
Ages half of those born in 2007 will reach
Japan 107
USA 104
France 104
UK 103
Source: The 100 YEAR LIFE Lynda Gratton, Andrew Scott 2016Source: UN World Population Prospects, The 2015 Revision
Global Trends of Ageing
8

Demographic trends in three metropolitan areas and regional areas
9
-80
-60
-40
-20
0
20
40
60
1955 1960 1965 1970 1975 1980 1985 1990 1995 2000 2005 2010 2015
Exce
ss o
f in
com
ing
mig
rati
on
(1
,00
0/p
eop
le)
+120,000 ppl
(Tokyo area)
-5,000 ppl
(Nagoya area)
-9,000 ppl
(Osaka area)
-106,000 ppl
(Regional area)
2017
Osaka area
Nagoya area
- Act on Industry Restriction in the National Capital Region
(1959-2002)
- Act on Restriction of Factories, etc. in Kinki Region
(1964-2002)
- Technopolis Act(1983-1998)
- Key Facilities’ Siting Law(1988-1998)
- Regional Core Cities Act(1992 - )
CNDP New CNDP 3rd CNDP 4th CNDP 21GD62 7769 87 98
Tokyo area
Excess of incoming migration (Tokyo area) was at peak in 1962 (390,000 people)
- New Industrial Cities Act- Act for Industrial Development in Special Areas
(1962-2001)
Regional areas
Excess of outgoing migration (regional area) was at bottom in 1961 (650,000 people)
1st oil crisis(1973)
2nd oil crisis(1979)
Bubble economy burst (1991)
Asian currency
crisis (1997)
Great East Japan Earthquake
(2011)
Great Hanshin-Awaji
earthquake (1995)
Lehman's fall (2008)
2nd NSS15
(year)
600
400
200
0
-200
-400
-600
-800
Source: Data prepared by National Spatial Planning and Regional Policy Bureau, MLIT, based on the “Basic resident register migration report” (Ministry of Internal Affairs and Communications).Note: The above areas are classified as follows:
Tokyo Area: Tokyo Metropolis and Saitama, Chiba and Kanagawa Prefectures Nagoya Area: Gifu, Aichi, and Mie Prefectures Osaka Area: Kyoto, Osaka, Hyogo, and Nara PrefecturesThree Metropolitan Areas: Tokyo, Nagoya, and Osaka Areas Regional Area: regions other than the Three Metropolitan Areas
During the period of high economic growth, the population flowed into the three metropolitan areas. The population inflow settled down around1980, but afterward it flowed into the Tokyo area up to around the economic bubble period. After the burst of the bubble economy, the outgoing migration of the Tokyo area temporality exceeded the incoming migration, but the
inflow increased again in the 2000s.
NSS08

Int’l Comparison of Population Concentration to Capital Areas
The level of population concentration to the capital area in Japan is higher compared with those of other major countries.
0
5
10
15
20
25
30
35
40
45
50
Comparison with Western Countries
日本(東京) 英国(ロンドン)
イタリア(ローマ) フランス(パリ)
ドイツ(ベルリン) アメリカ(ニューヨーク)
Po
pu
lati
on
in C
apit
al A
rea
/ to
tal p
op
ula
tio
n (
%)
(年)
Source: UN World Urbanization Prospects The 2011 RevisionNote 1: Figures of Berlin, Seoul and Incheon are municipal populations, and those of other cities and Gyeonggi Province are regional populations.Note 2: Definition of Tokyo is based on “Kanto Metropolitan Area” of “Population Census 2005” (Ministry of Internal Affairs and Communications) which
consists of Tokyo Special Ward, Saitama, Chiba, Yokohama and Kawasaki Cities, and surrounding municipalities.
0
5
10
15
20
25
30
35
40
45
50
1950195519601965197019751980198519901995200020052010
Comparison within East Asian Countries
日本(東京) 韓国(ソウル)
<参考>韓国(ソウル+インチョン+京畿道) タイ(バンコク)
中国(北京) インドネシア(ジャカルタ)
フィリピン(マニラ)
(年)
Korea (Seoul)
Thailand (Bangkok)
Indonesia (Jakarta)
Tokyo (Japan)
Japan (Tokyo)
Korea (Seoul, Incheon
and Gyeonggi Province)
Korea (Seoul)
Japan (Tokyo)
Italy (Rome)
Germany (Berlin)
UK (London)
France (Paris)
US (New York)
Japan (Tokyo)
Korea*
China (Beijing)
Philippines (Manila) *Seoul, Incheon and Gyeonggi Province
10

Disaster risk areas and the resident population of the areas
Target disasterRisk area size
(% to national land area)Population in risk area (2010, % to total population)
Flood Approx. 20,000 km2 (5.3%) 36.71 mil. (28.6%)
Landslide disaster Approx. 59,200 km2 (15.7 %) 613,000 (4.9%)
Earthquake disaster(damage by seismic intensity) Approx. 44,300 km2 (11.7 %) 58.88 mil. (46.3%)
Earthquake disaster (damage by liquefaction) Approx. 48,700 km2 (12.9 %) 57.43 mil. (44.8%)
Tsunami disaster Approx. 19,000 km2 (5.0 %) 26.10 mil. (20.4%)
Any of the five disasters Approx. 131,400 km2 (34.8 %) 94.42 mil. (73.7%)
Note 1: Definition of the risk area of each disaster is as follows:[Flood]: In the “estimated flooded area data” in National Land Numerical Information, areas indicating a flood
depth > 0.[Landslide disaster]: In the “Landslide hazard points data” in National Land Numerical Information, areas such
as danger areas related to debris flow, landslide, and steep slope failure. The data partially includes point and line data and therefore was converted into area data based on the national average area of each point.
[Earthquake disaster (damage by seismic intensity)]: In the Probabilistic Seismic Hazard Maps published by the Headquarters for Earthquake Research Promotion, areas whose probability of being hit by earthquakes of intensity 6 or over is 25% or over.
[Earthquake disaster (damage by liquefaction)]: areas from which meshes that are academically considered to have high risks of liquefaction are extracted from the detailed topographical classification meshes and the mesh gradients in the Japan Engineering Geomorphologic Classification Map.
[Tsunami disaster]: The tsunami inundation area calculated by simple numerical calculation. Since the “tsunami inundation estimates” based on the Act on Regional Development in Tsunami Disaster are not yet set across the country, simple estimates are used instead.
Note 2: For the population in risk areas, the population in a mesh (1 km) overlapping with risk areas was extracted from the population distribution in the 2010 Census regional mesh statistics (provided by Ministry of Internal Affairs and Communications). If a risk area boundary was present in the mesh, area-proportional distribution was used.
The disaster risk areas spread across the nation, with approx. 35% of the national land corresponding to any type of disaster risk area.
However, the population exposed to the disaster risks (2010) accounts for 70% or more of the total, which indicates a biased distribution of population in the disaster risk areas.
Superimposed map of the five disaster risk areas 11

Towards Revision/Upgrading of Monitoring Methods
Positioning by c.m. from quasi-zenith satellites
- Micro-perspective regional analysis
- Macro-perspective comparative analysis of municipalities and prefectures
- International comparison based on World Geodetic System
- Policy makingDistribution
of goods by
unmanned
aircraft
Self-
driving
Monitoring of Spatial Development
G-Space Information Centre
“Visualization of National Land Information”
Private Sector
Hazard map, etc.
Mesh data on population estimates
Data on Traffic Network
Gathering and Provision of
World Geodetic System Data
etc.
Overlaying of data
Population
mesh data, and
spatial planning
related data,
etc.
Detailed in scale of 500 m2
Local Authorities
12

Examples of the Monitoring Indicators
Focusing on the active two-way flow, convection, of people, goods, money and information arisingbetween distinctive regions. The following is the monitoring based on the occurrence and motiveforce of the convection.
Monitoring Indicators[Definition of indicator] (Source)Concept
Formation of compact city in local cities
Development of a vibrant economy and living area with a Collaborative urban area for regional hub, etc.
Strengthening the competitiveness of the transport-export industry
- Promotion of regional-oriented innovation- Fostering a town for growing entrepreneurs
Promotion of local migration or relocation, two-residence lifestyle, & living and working in two areas
Development of Tokyo metropolitan area to be a model global city to overcome competition between international cities
Number of municipalities announcing a land optimization plan[Number of municipalities that developed and announced a land optimization plan] (MLIT)
Number of areas with a cooperative center urban plan [Number of areas that formulated a cooperative center urban plan] (MIC)
Agricultural, marine products and food export[Export amounts of agricultural, marine products and food from wide area blocks] (MOF)
Number of certified projects using local resources [Number of
local resource utilization projects that were certified based on the Act on Promotion of Business Activities by Small and Medium Sized Enterprises Utilizing Local Resources](SME)
Proportion of young generation amongst the users of The Furusato Kaiki Shien Center Proportion of young generation (30s or younger] (Furusato Kaiki Shien Center)
Global Power City Index (Institute for Urban Strategies The Mori Memorial Foundation)
124 (May. 2017)
23(Mar. 2017)
745.1 billion yen(2015)
1,677(Dec. 2016)
45.9%(2016)
Tokyo: 3rd ranking
(2016)
Establish and take advantage of Small Stations consolidating core functions
Number of small centers[The number of small centers currently established] (Cabinet Office)
1,260(Oct. 2016)
Establishment of smart wellness housing and cities in metropolitan areas
Number of UR estates working on regional medical welfare centers[Number of UR estates starting to establish regional medical welfare centers] (Urban Renaissance Agency)
47(Jan. 2016)
Current Value
13

Example of Regional Analysis by Overlaying Multiple Data/Info
0.0
0.2
0.4
0.6
0.8
1.0
0
100
200
300
400
500
2010年人口
2050年人口(推計)
2010年→2050年の倍率(右目盛り)
Population by the distances from local authorities in non-urban areas
Estimated Population
Numbers of local authorities and branches: 2,894
Facing the risk
of extinctionCertain numbers of residents may remain in central districts
In terms of ≪points per 1 km2≫, the points where the population will decrease to half or less account for 60% or more.
According to the analysis by overlaying population and urban facilities location data by 1km sq. mesh, villages located close to local authorities or their branches, or primary schools have possibilities to survive, even in non-urban areas.
⇒ Access to basic services are significant for villages to survive.
Source: “Grand Design of National Spatial Development towards 2050” (MLIT, July 2016)Note: Population data prepared from “Population Census 2010”, (Ministry of Internal Affairs and
Communications) and “Population Estimation by mesh units” (MLIT). Data on zoning and locations of local authorities and branches are from “National Land Numerical Information” (MLIT), and distance from local authorities/branches to each 1km sq. mesh from “Distal Road Map” (DRM).
Rate of decrease/increase by 1 sq km mesh
Decrease 50% and more Decreaseless than
50%
In-crease
Disappear
-ance of
residents
Decrease of residents 50% and more
Nation-
wide128.06m 97.08m ▲24% 63% 19% 44% 35% 2%
Pop
ula
tio
nin
20
50
Rat
e o
f D
ecre
ase
Increase/decrease of population from 2010 to 2050
IncreaseDecrease 0% -50%Decrease 50-100%Disappearance of residents
Population in 2010 Population in 2050 (estimated)
(million)
Rate of 2050/2010 (right axis)
14
5.0
4.0
3.0
2.0
1.0
0.0
Pop
ula
tio
nin
20
10


