23
THE NATURAL GAS INDUSTRY METHANE EMISSIONS CHALLENGE

THE NATURAL GAS INDUSTRY METHANE EMISSIONS
CHALLENGE
2 3
The Natural Gas Industry | Methane Emissions Challenge
THE NATURAL GAS INDUSTRY METHANE EMISSIONS
CHALLENGE

4 5
The Natural Gas Industry | Methane Emissions Challenge
ContentsSection
1. Policy Recommendations ................................................................................................................... 6
2. The Challenge ........................................................................................................................................... 7
2.1 Global GHG Budget and Methane .................................................................................. 8
2.2 Fugitive Methane Emissions in the Natural Gas Industry ..................................... 9
2.3 Mitigation Options ............................................................................................................. 11
3. The Solutions: Case Studies ............................................................................................................. 12
3.1 Summary of Cases .............................................................................................................. 12
3.2 Upstream ............................................................................................................................... 15
3.2.1 U.S. Shale: Southwestern Energy ....................................................................... 15
3.2.2 Australian Processing: Quadrant Energy ......................................................... 17
3.3 Midstream ............................................................................................................................. 19
3.3.1 Spain LDAR: Enagás ................................................................................................ 19
3.3.2 Netherlands LDAR: Gasunie ................................................................................. 22
3.3.3 Italy MCU: SNAM ...................................................................................................... 26
3.4 Downstream ......................................................................................................................... 28
3.4.1 Mexico Vaccuum Pump: Gas Natural Fenosa ................................................ 28
3.5 People ..................................................................................................................................... 31
3.5.1 Employee Engagement Program: Gazprom ................................................... 31
4. Glossary ..................................................................................................................................................... 34
5. Appendices ............................................................................................................................................... 36
Appendix I European GHG Emissions Reporting Categories ....................................... 36
Appendix II SWN Flowback Methodology Old and New Approach Comparison .. 37
Appendix III Enagás Methane Emissions Factors ............................................................. 38
Appendix IV Gasunie Measurement Methodology (EPA 21) .................................... 39
Appendix V Gazprom Examples of Reduction Technologies........................................ 40
6 7
The Natural Gas Industry | Methane Emissions Challenge
2 The Challenge
Natural gas plays an important role in improving air quality and will continue to be a key resource in the transition to a cleaner energy economy. A natural gas combined cycle power plant produces about 50% fewer GHG emissions than coal and about 99% lower mercury and sulfur dioxide emissions, which are among the leading causes of premature deaths globally.2 It is a flexible and reliable fuel that can provide a wide range of services, from on-demand capacity, to modular distributed energy, to clean cooking and heating, to a high energy and feedstock fuel for industry, and clean transportation.
The reduction of methane emissions from natural gas value chain has been a priority for the natural gas industry for decades. Minimizing the loss of the product that the industry sells makes good commercial sense, ensures safety, and delivers on vital environmental objectives. Active scientific research in this area is improving the understanding of methane sources, and emerging technologies are enabling better detection and measurement of emissions. This duo of science and technology will aid the industry to improve its ability to proactively focus on addressing a small number of outliers – those specific areas and equipment that disproportionately contribute to the challenge (“super emitters”) – while continuing with robust overall reductions programmes.
Strategically, and in view of the important role that natural gas should play in an accessible and sustainable energy mix, the industry is strongly committed to minimizing its environmental footprint, and tackling methane emissions is a key component of this commitment.
Recognizing the importance of GHG measurement and mitigation, the IGU presents this report demonstrating examples of the global industry’s commitment to this goal and to help inform stakeholders of progress toward achieving it.
The IGU acknowledges the importance of reducing methane emissions from the gas value chain and is working with the industry in areas of measurement, reporting, and reduction by:
• Improving confidence in the accuracy of measurement, quantification, and reporting of methane emissions through sharing of latest developments in field and academic research.
• Encouraging systematic reduction of methane emissions through operations management, including the sharing of the best approaches to enhanced measurement, quantification, reporting and reductions, within and across the value chain.
• Promoting the rapid advance, development, and commercial deployment of cost-effective methane detection, measurement, and reduction technologies.
• Encouraging scientific research into the sources of methane emissions and understanding of methane in the environment.
2 See for example: National Petroleum Council, 2011. Prudent Development, Carbon and Other Emissions in End-Use Sectors (Chapter 4); NETL, 2014. Life Cycle Analysis of Natural Gas Extraction and Power Generation; IPCC, 2011. IPCC Special Report on Renewable Energy Sources and Climate Change Mitigation (chapter 9); IEA, 2016. World Energy Outlook Special Report: Energy and Air Pollution.
1 Policy Recommendations
The International Gas Union (IGU) supports urgent and increased efforts towards climate change mitigation, consistent with the Paris Agreement and its goal to limit the global temperature increase to below 2oC from pre-industrial levels by the end of the century.
Several nationally determined contributions under the Paris Agreement include a focus on reducing methane emissions, amongst other measures.1
The natural gas industry has had a long history of mitigating methane emissions. Methane is the primary component of natural gas, and reductions of methane emissions are important for operational efficiency, safety, and environmental excellence.
The IGU supports prudent, outcome-driven policy regimes for greenhouse gas (GHG) mitigation.
Effective policies to minimize anthropogenic methane emissions are those that take balanced approaches, consistently addressing all contributing sources of methane emissions across the economy. The IGU recommends that as governments formulate policies for reducing methane emissions, they:
• Commit to a balanced GHG reduction strategy, which covers long and short-lived pollutants. Avoid disproportionate emphasis on short-lived pollutants, like methane, to secure the long-term target of meeting CO2 reductions and 2oC temperature increase limit.
• When regulation is deemed necessary, choose a performance-based approach over compliance-based to ensure policies are economically efficient – balancing regulation with market-based mechanisms. This means that policies should seek to maximize the value of reductions, by allowing sufficient flexibility for the industry to identify opportunities for investment to achieve the highest reductions.
• Support technology development and deployment to accelerate innovation in methane detection and measurement. There has been much progress in the development of next generation technologies, some of which could become game changers; however, these still need to become commercially viable. In order to accelerate the pace of innovation and de-risk new technology, governments need to partner with industry and fund essential research and development.
1 UNFCC, 2015. Synthesis report on the aggregate effect of the intended nationally determined contribu-tions. United Nations. FCCC/CP/2015/7

8 9
The Natural Gas Industry | Methane Emissions Challenge
2.1 Global GHG Budget and Methane
The issue of methane emissions mitigation will play an important part in meeting global GHG reduction efforts.
Methane is the second most important GHG after CO2. Its greenhouse gas effect is stronger in the short term, which makes it a more potent short-term climate forcer than CO2. However, it also has a much shorter mean life in the atmosphere – only 12.4 years, in contrast to centuries for CO2.
3
According to some estimates, about 40% of total methane emissions come from biogenic (natural) sources, such as wetlands, while the other 60% are anthropogenic, or man-made.4,5 The largest source of anthropogenic methane emissions is agriculture, followed by industrial activity, and fossil fuels. Attributing emissions to specific sources is an extremely difficult task and subject of ongoing debate, as there are vast gaps in data and competing methodologies. Thus, to date there is no consensus on the specific quantity of natural gas sector’s contribution.
Combined, the oil and gas industry contribute roughly a quarter of the world’s methane emissions, as shown in the chart below.
3 https://www.ipcc.ch/pdf/assessment-report/ar5/wg1/WG1AR5_Chapter08_FINAL.pdf, p.731 4 M. Saunois et al., 2016. The Global Methane Budget 2000-2012. Earth System Science Data.5 Note: this breakdown is likely to change, as the science continues to develop, in particular with regard to combining top-down with bottom-up assessments.
2.2 Fugitive Methane Emissions Challenge in the Natural Gas Industry
Natural gas combustion is highly efficient, so in its end-use applications of providing energy for cooking and heating, fuelling transport, and producing electricity, the associated methane emissions are insignificant.6
Most methane emissions occur earlier in the value chain, during extraction, production, transport, and distribution of the product. However, due to the expanse of natural gas infrastructure, the exact measurement of emissions is challenging and, in some cases, impossible. The industry uses a combination of direct measurement and sophisticated estimation techniques to extrapolate methane emissions across its infrastructure.
A plethora of studies attempted to assess total methane emissions from the natural gas value chain. This body of knowledge continues to evolve, as researchers and industry strive to improve understanding in the field. However, the data challenge remains significant, and contention over methodologies is substantial.
There is no scholarly consensus around the key areas of this complex subject. Namely, sources vary extremely in their conclusions on:
The magnitude and range of methane emissions across the natural gas supply chain.
• The methods, data and assumptions used to estimate these emissions.
• The ‘global warming potential’ of methane compared to CO2 and the timescale over which it should be considered.7,8
• The contribution of intermittent high-emitting events is also a major one.
The researchers of the Imperial College of London’s Sustainable Gas Institute compiled an analysis of 424 studies published up to 2015, and found that most estimates of total methane emissions across the natural gas supply chain are in the range of 0.5% to 2.5% of total production volume. The analysis also identified high-emitting facilities that skew the emissions profile in each stage of the natural gas value chain (as implied by the median value and 75th percentile in the chart below).9
It must be noted however, that the below is based on studies available at the time, and those studies were heavily focused on the U.S.10 Hence the below attribution of emissions to different parts of the value chain is mostly representative of the U.S. These are expected to vary considerably between regions, due to their unique technical, physical, geographical, and geological characteristics.
6 e.g. EPA, AP-42. Industrial Flares (Chapter 13).7 Balcombe, P. et al., 2015. Methane and CO2 Emissions from the Natural Gas Supply Chain.8 See Understanding Methane’s Impact on Climate Change. IGU. 20179 Balcombe, P. et al., 2015. Methane and CO2 Emissions from the Natural Gas Supply Chain.10 Rapid development of natural gas production and infrastructure arising from the shale revolution, brought on a heavy focus on methane emissions by governmental, non-governmental entities, and the research communities in the United States.
Global Anthropogenic
GHG Emissions (2012)
Source: World Resources Institute
Source: M. Saunois et al., The Global Methane Budget 2000-2012. Earth System Science Data. (December 2016)
Anthropogenic Methane Emissions by Source (Mt, 2012)
Biomass & Biofuel
30 Mt
Fossil fuels
134 Mt
Agriculture & Waste
197 Mt
Carbone Dioxide (76%)
Nitrogen Oxides (6%)
F-Gas (2%)
Methane (16%)
Biofuel burning (3%)
Biomass burning (5%)
Gas, oil & industry (24%)
Coal Mining (13%)
Enteric Fermentation &
Manure (30%)
Rice cultivation (8%)
Landfills & waste (17%)

10 11
The Natural Gas Industry | Methane Emissions Challenge
Main Types of Methane Emissions
Vented emissions are intentional releases of methane, due to safety considerations, equipment design, or operational procedures, such as from pneumatic device bleeds, pipe blowdowns, and equipment venting. Equipment venting and non-routine flaring occur by design, but are difficult to measure.
Fugitive emissions result from methane that “leaks” unintentionally from equipment or components such as flanges, or valves, and pipeline damages. These emission types are the most challenging to quantify, since exact measurement is limited by the size and complexity of the infrastructure, as well as safety considerations. The industry and regulatory bodies continuously work to improve methods for improved detection and measurement of these emissions.
Un-combusted emissions are small amounts of un-combusted methane in the exhaust of natural gas combustion equipment in the production, processing and transmission segments.
2.3 Mitigation Options
The body of knowledge related to methane emissions abatement is developing rapidly, and new technologies for detecting, measuring, and abating emissions are holding significant promise.
However, there is no silver bullet and no single technology, or solution, that would fit every case. The challenge of mitigating methane emissions is of global scale. Operationally it consists of individual components across a broad range of facilities and facility types, and therefore, it materializes in unique ways for every operator in every region.
Thus, while it is imperative to share learnings and good practices amongst the global community of stakeholders, it is also important to resist the temptation to prescribe one-size-fits-all approaches. Optimal solutions can vary significantly from one operator to the next, depending on the unique characteristics of each system and other regional variables.
Approaches to mitigating emissions generally fall into three categories, summarized below.
Infrastructure & Equipment Replacement / Upgrade
Operational Practice Improvements
Direct Inspection & Maintenance
• Upgrades of old pipeline networks
• Replacement of old equipment
• Switching-out equipment to an alternative technology that reduces leakage
• Improvements to routine operational practices to avoid having to release methane (venting)
• Increasing efficiency, reducing down time, or augmenting existing processes with new technology that helps reduce emissions
• Conducting routine inspection surveys to detect sources of emissions, measure, and repair them
• Constantly adjust inspection frequencies through the application a risk based approach
CHALLENGES
Replacing legacy equipment before the end of useful life of the asset is costly, particularly in light of high counts of most devices
Case-specific, requires assessment of cost-prudency, as sometimes the additional cost can exceed benefit
Lack of field staff awareness of the importance and value of methane emissions management
Inspection campaigns should be established through a risk-based assessment, as constantly monitoring all equipment at all times is impractical and cost prohibitive
OPPORTUNITIES
Focusing equipment replacement cycles to those of emission outliers
Embedding an environmental benefit to repair vs replace decisions
Improving operational efficiency, reducing environmental footprint and realizing savings where the business case is positive
Effectively planned and executed campaigns can result in significant emissions reductions, and improve knowledge, build expertise, and support innovation
Source: Balcombe, P. et al., 2015. Methane and CO2 Emissions from the Natural Gas Supply Chain.
Gre
enho
use
gas
emis
sion
s (g
CO
2 eq.
/MJ H
HV)
)
60
40
20
0
Pre-production Extraction Processing Transmission,storage and distribution
Estimatedtotal
Site
pre
para
tion
Wel
l com
plet
ion
Dril
ling
Hyd
raul
ic fr
actu
ring
Fugi
tive
Fug
itive
ven
t
Fugi
tive
Flar
ing
Flar
e
Fuel
Fuel
Tota
l
Liqu
ids
unlo
adin
g
Wor
kove
rs
Median 25th/75th percentile
12 13
The Natural Gas Industry | Methane Emissions Challenge
3 The Solutions: Case Studies
This report will feature a number of specific case studies shared by the IGU member companies to shed more light on the industry’s ongoing efforts. The IGU is pleased to share them to demonstrate that the natural gas sector is committed to the issue.
3.1 Summary of Cases
UPSTREAM
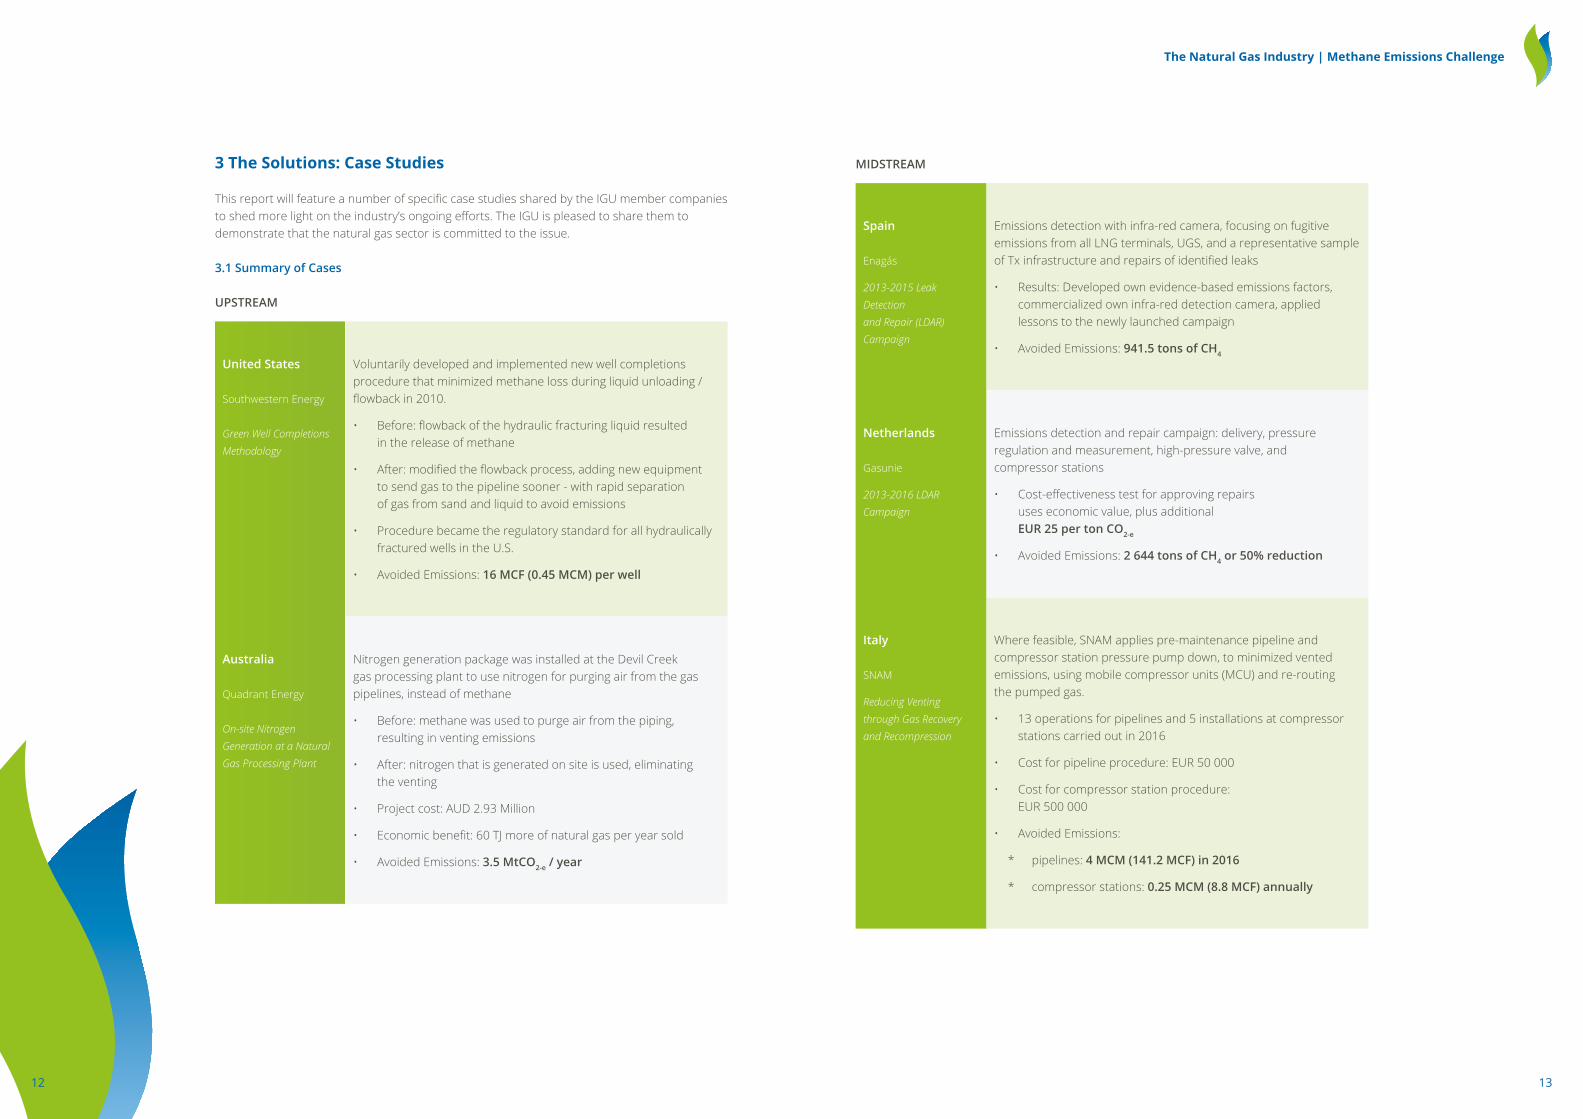
United States Southwestern Energy Green Well Completions Methodology
Voluntarily developed and implemented new well completions procedure that minimized methane loss during liquid unloading / flowback in 2010.
• Before: flowback of the hydraulic fracturing liquid resulted in the release of methane
• After: modified the flowback process, adding new equipment to send gas to the pipeline sooner - with rapid separation of gas from sand and liquid to avoid emissions
• Procedure became the regulatory standard for all hydraulically fractured wells in the U.S.
• Avoided Emissions: 16 MCF (0.45 MCM) per well
Australia Quadrant Energy On-site Nitrogen Generation at a Natural Gas Processing Plant
Nitrogen generation package was installed at the Devil Creek gas processing plant to use nitrogen for purging air from the gas pipelines, instead of methane
• Before: methane was used to purge air from the piping, resulting in venting emissions
• After: nitrogen that is generated on site is used, eliminating the venting
• Project cost: AUD 2.93 Million
• Economic benefit: 60 TJ more of natural gas per year sold
• Avoided Emissions: 3.5 MtCO2-e / year
MIDSTREAM
Spain Enagás
2013-2015 Leak Detection and Repair (LDAR) Campaign
Emissions detection with infra-red camera, focusing on fugitive emissions from all LNG terminals, UGS, and a representative sample of Tx infrastructure and repairs of identified leaks
• Results: Developed own evidence-based emissions factors, commercialized own infra-red detection camera, applied lessons to the newly launched campaign
• Avoided Emissions: 941.5 tons of CH4
Netherlands Gasunie
2013-2016 LDAR Campaign
Emissions detection and repair campaign: delivery, pressure regulation and measurement, high-pressure valve, and compressor stations
• Cost-effectiveness test for approving repairs uses economic value, plus additional EUR 25 per ton CO2-e
• Avoided Emissions: 2 644 tons of CH4 or 50% reduction
Italy SNAM
Reducing Venting through Gas Recovery and Recompression
Where feasible, SNAM applies pre-maintenance pipeline and compressor station pressure pump down, to minimized vented emissions, using mobile compressor units (MCU) and re-routing the pumped gas.
• 13 operations for pipelines and 5 installations at compressor stations carried out in 2016
• Cost for pipeline procedure: EUR 50 000
• Cost for compressor station procedure: EUR 500 000
• Avoided Emissions:
* pipelines: 4 MCM (141.2 MCF) in 2016
* compressor stations: 0.25 MCM (8.8 MCF) annually
14 15
The Natural Gas Industry | Methane Emissions Challenge
DOWNSTREAM
Mexico / Spain Gas Natural Fenosa (GNF)
Reducing Vented Emissions during Pipeline Commissioning using Vacuum Pump
New pipeline commissioning procedure, using a vacuum pump to remove gas and air mixture, instead of purging it through venting.
• Due to the success in Mexico, GNF implementing the new procedure into all its operations, starting with Spain in 2018
• Cost of pump: EUR 3 000
• Net Economic benefit in Mexico: EUR 8 300 in the first year
• Avoided Emissions: 31.68 ton CH4 annually - in the first year in Mexico
STAFF | ALL VALUE CHAIN
Russia Gazprom
Increasing Staff Engagement
In 2011, Gazprom implemented an incentive program for the employees of all of its subsidiaries, in order to develop a culture of emissions reductions and increase energy savings.
• Employees receive bonuses for the highest reductions achieved, relative to each other and in absolute terms year over year.
• Avoided Emissions: 9.2 kg /MCM km of CH4 from 2011 to 2016
3.2 UPSTREAM
3.2.1 U.S. Shale: Southwestern Energy
Gas Capture Initiative or “Green Completions”
Prior to it becoming the regulatory standard, Southwestern Energy (SWN) carried out its Gas Capture initiative and achieved significant emissions reduction at the well completion stage of the production process. Today it is known as “green completions,” or “reduced emissions completions,” technique and is a regulatory requirement in the U.S. shale gas production.
Hydraulically fractured well completion can be a significant source of methane emissions, partly due to a process known as “flowback” – the recovery of the water-based fluid and sand used in the fracturing process. During the flowback stage, methane entrained in the fluid has historically been vented to the atmosphere, or flared.
In 2010, SWN undertook Gas Capture initiative to minimize the loss of methane during well completion operations. Through this initiative, SWN developed and implemented modifications to flowback methods, which allowed natural gas to be directed to a pipeline sooner (after the well is drilled and gas flow initiated), avoiding the venting, or flaring, associated with prior techniques of establishing initial gas flow.
How it works
The new method uses a permanent oversized separator (separating liquid from gas), in conjunction with temporary equipment, that reduces flow from the well and separates sand from the water and natural gas. In addition, a portable compressor may be used to increase pressure in the well and enhance the removal of liquids and sands during flowback. A temporary, secondary separator may also be used for additional separation.
Outcomes
• Gas Capture helped to avoid an average of 16 MCF (0.45 MCM)11 per well from being vented to atmosphere during well completion flowback operations, based on initial testing in a low-pressure reservoir operation. In areas with higher reservoir pressures, the gas recovery volumes will be higher.
• Due to Green Completions, SWN voluntarily achieved over 30,000 MCF (850 MCM) of methane reductions, as reflected in its report to the EPA Natural Gas STAR program.
• SWN implemented its Green Completions methodology, prior to it becoming a regulatory requirement.
11 MCF – million cubic feet, MCM – million cubic metres

16 17
The Natural Gas Industry | Methane Emissions Challenge
Gas Capture Implementation Procedure
In general, modifications involve the following actions (see appendix II for detailed comparison between old and new approach):
1. Install tubing immediately after well stimulation.
2. Install separation equipment sufficient to handle large volumes of flowback water allowing for gas-water separation early in the flowback process.
3. Install flow lines, separator (mentioned above), meter run and ancillary equipment to flow wells directly into the sales line upon commencing completion flowback.
4. Utilize portable, temporary natural gas driven compressor to increase pressure in the well (primarily in low pressure basins).
5. Utilize temporary sand separator and well test separator (as needed) to handle significant early-stage proppant (sand) return.
6. Utilize temporary well choke manifold to control flowback rate.
7. Equip the wellhead to allow initial well flow up the tubing-casing annulus (between the tubing and casing) but switch to tubing flow after the well is producing.
8. Initiate SWN Gas Capture well completion flowback activities and deliver gas directly into the sales line.
Temporary Equipment Associated with Gas Capture or Green Completion methodology.
Gas compressor located on portable trailer (center of photo) and may be used for initial
gas lift, Choke manifold is “red piping and valves” used to control flow from the well.
Vertical sand separators (yellow) – separates sand from water and gas.
Sand is directed to the blue storage container. Gas and water are routed
to separator with gas going to pipeline and water going to storage.
Flow lines move gas to separator
which removes free water from natural
gas and delivers the natural gas into
the meter and pipeline.
About SWN
Southwestern Energy Company (SWN) is a Texas-based independent natural gas and oil company engaged in development and production activities, including related natural gas gathering and marketing.
3.2.2 Australia Gas Processing: Quadrant Energy
Installation of Nitrogen Generation at the Devil Creek Gas Plant
Gas processing is the last step in the upstream portion of the value chain, where the extracted raw gas is purified to meet the applicable standards to be transported to customers.
The Devil Creek Gas Plant is one of three natural gas processing hubs of Quadrant Energy that supply gas to the domestic gas market in Western Australia. The plant is located near Karratha (Figure 1) in the north west of Western Australia. Gas is supplied from the offshore Reindeer Gas Field. Devil Creek facility comprises a two-train gas plant with a capacity of 220 TJ/d and provides a reliable and independent supply of gas for Western Australia.
Figure 1 “Devil Creek Gas Plant Location Map and Arial View”
Case in Point
• For safety, prior to introducing natural gas into the plant processing systems, the plant pipelines must be purged of air. Prior to the project, natural gas was used as purging agent.
• The project was commissioned in December 2016 at a cost of AUD 2.93 Million, with the endeavour to replace fuel gas as the purge/blanked gas, which had been ultimately flared.
• The installation of the nitrogen generation package and replacement of fuel gas with nitrogen for purge/blanked gas resulted in reduced emissions of 3,463 tCO2-e per annum.
• An additional estimated 60TJ per annum of gas is now available to market which has an economic benefit to Quadrant.
• In addition to the environmental, there are safety benefits of not transporting nitrogen to site. Previously, nitrogen when required was delivered to site in quads at high pressure (250barg). Accessing this pressurised inventory involved the use of temporary hoses, manual handling and bespoke pressure relief all posing safety risks to employees. These risks have now been eliminated.

18 19
The Natural Gas Industry | Methane Emissions Challenge
Project Description
• Nitrogen is supplied at a nominal pressure of 1000kpag by a nitrogen generation package.
• The package consists of two units each including air compression, air treatment and nitrogen generation membranes.
• The continuous rate of supply during normal operations is estimated at 135 sm3/hr.
• Schematic of the installed nitrogen generation packages at the Devil Creek Gas Plant.
About Quadrant
Quadrant is an Australian-based upstream oil and gas company, primarily specializing in offshore operations. It is the largest domestic supplier to Western Australia.
3.3 MIDSTREAM
3.3.1 Spain LDAR Campaign: Enagás
Overall GHG Reductions
Enagás’ Carbon Footprint evolution (tCO2e)
Enagás set an absolute target of reducing GHG emissions12 by 30 % in the 2016-2018 period, compared to those registered during 2013-2015.
Approximately 2/3 of the total GHG emissions are CO2, while CH4 emissions account for less than 1/3 of the carbon footprint. Of these, 2/3 of CH4 emissions are due to fugitive methane emissions (22 %) and the remaining are related to venting (10 %) from operation, maintenance and safety.13
12 Including carbon footprint’s scope 1 (direct emissions) and scope 2 (indirect emissions from electricity consumption).13 As the base for our emission reduction strategy, Enagás started to voluntarily calculate and verify its Carbon Footprint in 2013. Carbon Footprint verification is carried out by an independent third party in accordance with standard ISO 14064 to enable its validity.
Reductions Breakdown
99% reduction in flaring at LNG terminals (since 2014)
39% reduction in venting (since 2014)
15% reduction in stationary combustion (since 2014)
8% reduction in fugitive emissions (since 2015)
CH4 31.5%CO2 66.8%
HFCs 1.7%
2016 Carbon Footprint
Note: The increase in emissions in 2014 is attributable to growth in natural gas con-
sumption, and the increased activity of the LNG terminals (the number reloading oper-
ations increased significantly). Nevertheless, those emissions were reduced by 47% in
2015 and by 5 % in 2016, compared to the previous year, respectively.
Air Compressor
A
Air Compressor
B
Air Treatment
A
Air Treatment
B
Nitrogen Generation
A
Vendor Package Existing PlantBrownfield Modifications Brownfield Modifications
Scope of Nitrogen Package
Nitrogen Generation
B
SDV
SDV
Tie-in for N2 quads
Tie-in for N2
Intensifier
N2 Receiver V8007
PSV1V8007 1500 kPag
PCV1 V8007
PCV2 V8007
600.000515.254 571.033
305.172290.549
2013 2014 2015 2016
HFC
N2O
CH4
CO2
500.000
400.000
300.000
200.000
100.000
0
20 21
The Natural Gas Industry | Methane Emissions Challenge
Methane Emissions
Enagás’ CH4 emissions are mainly due to fugitive emissions and vents. Key reduction activities include:
• Flaring instead of venting in LNG plants and UGS14 .
• LDAR campaigns for fugitive emissions.
• Replacing wet seals by dry seals, avoiding the presence of liquids (spilled oil) inside the pipes.
• Hot taps instead of Tie-ins for in-service pipeline connections.
• Composite wrap for non-leaking pipeline defects (fitness for purposes).
• Electric motor starters in turbo-compressors.
• Electrical driven chemical plants (odorizing).
• Converting gas pneumatic controls to instrument air.
• Optimizing the operation and try to align it with the maintenance works in order to reduce vents.
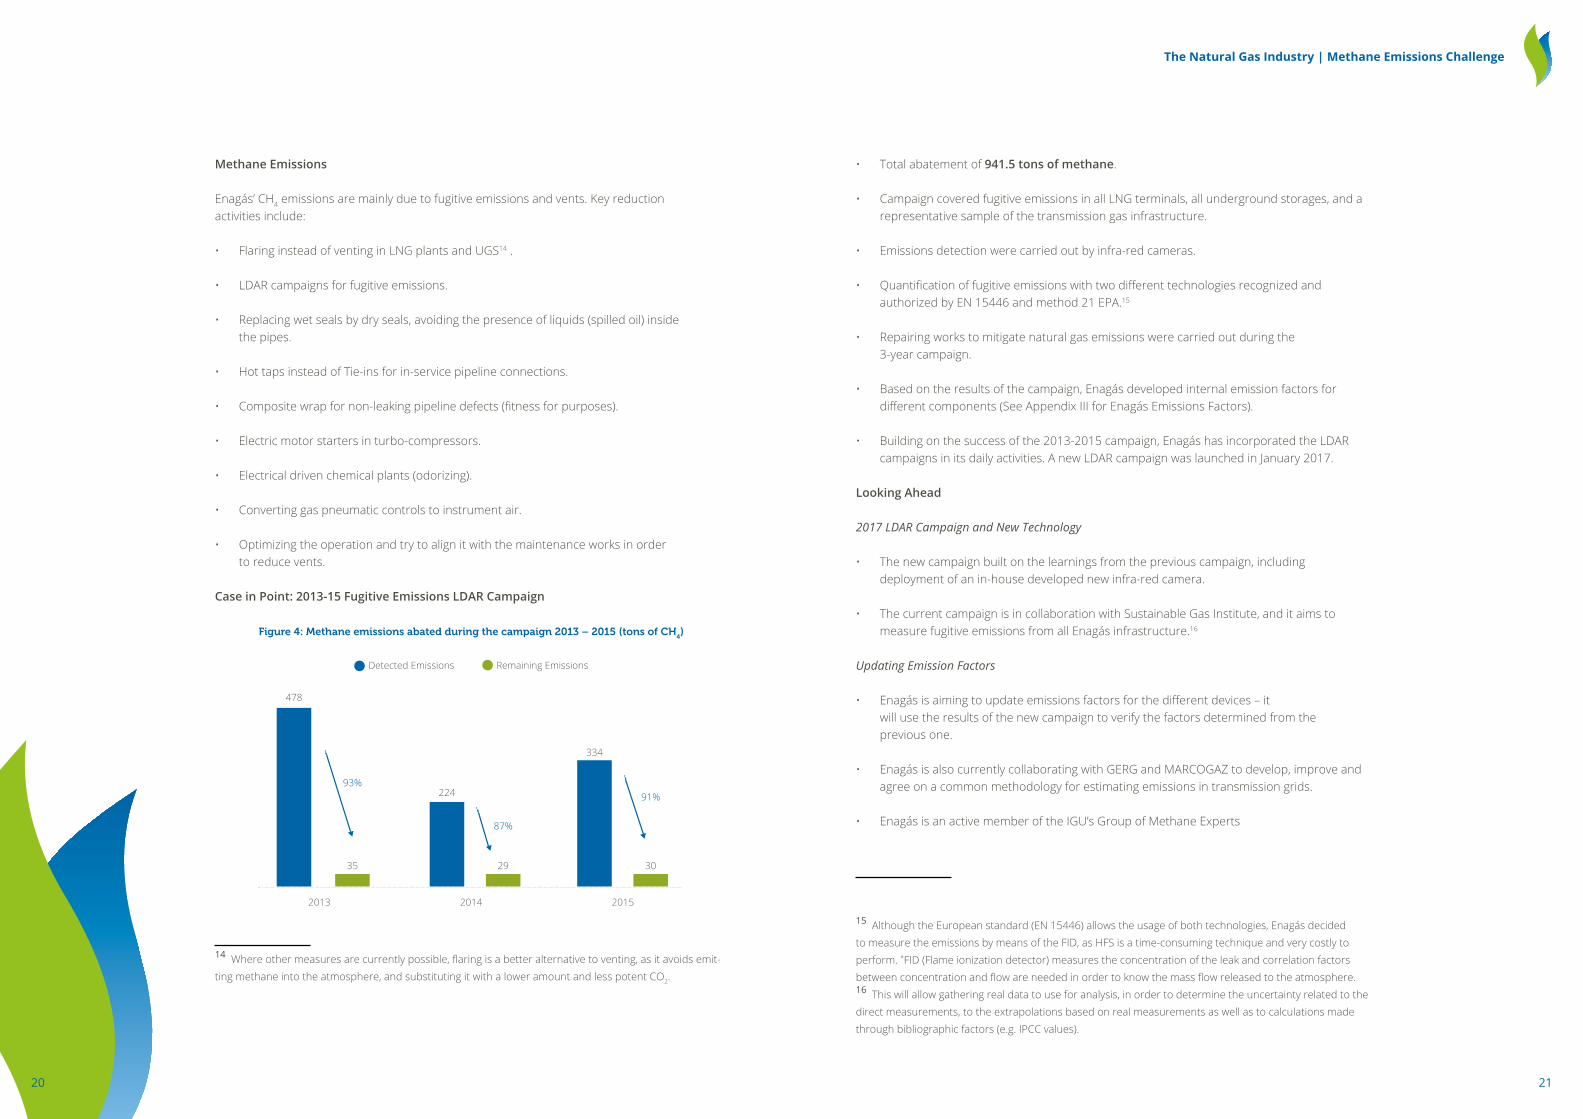
Case in Point: 2013-15 Fugitive Emissions LDAR Campaign
Figure 4: Methane emissions abated during the campaign 2013 – 2015 (tons of CH4)
478
2013 2014 2015
224
334
29 3035
93%
87%
91%
Remaining EmissionsDetected Emissions
14 Where other measures are currently possible, flaring is a better alternative to venting, as it avoids emit-ting methane into the atmosphere, and substituting it with a lower amount and less potent CO2.
• Total abatement of 941.5 tons of methane.
• Campaign covered fugitive emissions in all LNG terminals, all underground storages, and a representative sample of the transmission gas infrastructure.
• Emissions detection were carried out by infra-red cameras.
• Quantification of fugitive emissions with two different technologies recognized and authorized by EN 15446 and method 21 EPA.15
• Repairing works to mitigate natural gas emissions were carried out during the 3-year campaign.
• Based on the results of the campaign, Enagás developed internal emission factors for different components (See Appendix III for Enagás Emissions Factors).
• Building on the success of the 2013-2015 campaign, Enagás has incorporated the LDAR campaigns in its daily activities. A new LDAR campaign was launched in January 2017.
Looking Ahead
2017 LDAR Campaign and New Technology
• The new campaign built on the learnings from the previous campaign, including deployment of an in-house developed new infra-red camera.
• The current campaign is in collaboration with Sustainable Gas Institute, and it aims to measure fugitive emissions from all Enagás infrastructure.16
Updating Emission Factors
• Enagás is aiming to update emissions factors for the different devices – it will use the results of the new campaign to verify the factors determined from the previous one.
• Enagás is also currently collaborating with GERG and MARCOGAZ to develop, improve and agree on a common methodology for estimating emissions in transmission grids.
• Enagás is an active member of the IGU’s Group of Methane Experts
15 Although the European standard (EN 15446) allows the usage of both technologies, Enagás decided to measure the emissions by means of the FID, as HFS is a time-consuming technique and very costly to perform. *FID (Flame ionization detector) measures the concentration of the leak and correlation factors between concentration and flow are needed in order to know the mass flow released to the atmosphere.16 This will allow gathering real data to use for analysis, in order to determine the uncertainty related to the direct measurements, to the extrapolations based on real measurements as well as to calculations made through bibliographic factors (e.g. IPCC values).
22 23
The Natural Gas Industry | Methane Emissions Challenge
About Enagás
Enagás is a midstream company based in Spain. The company’s activities include the management, operation and maintenance of gas infrastructure:
• 493 regulation and metering stations • ~12,000 km of gas pipelines • 6 LNG terminals (+2 in development) • 3 underground storage facilities • 19 compressor stations • 6 international connections
3.3.2 Netherlands LDAR Campaign: Gasunie
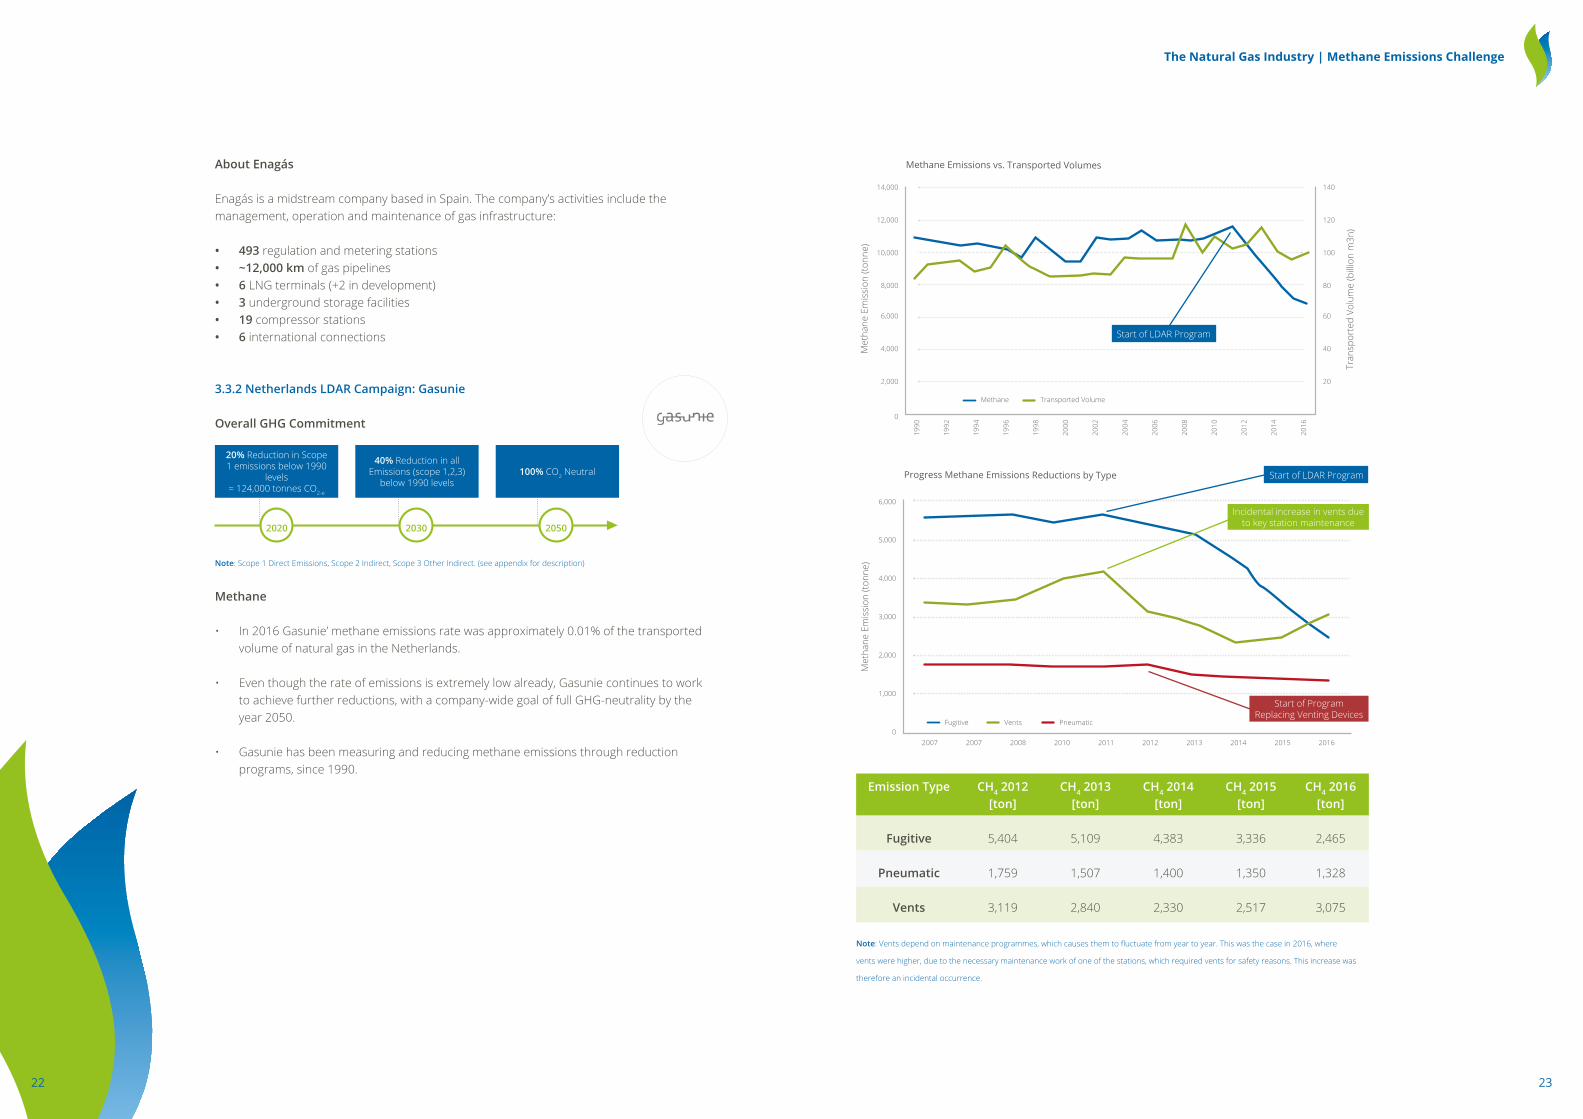
Overall GHG Commitment
Note: Scope 1 Direct Emissions, Scope 2 Indirect, Scope 3 Other Indirect. (see appendix for description)
Methane
• In 2016 Gasunie’ methane emissions rate was approximately 0.01% of the transported volume of natural gas in the Netherlands.
• Even though the rate of emissions is extremely low already, Gasunie continues to work to achieve further reductions, with a company-wide goal of full GHG-neutrality by the year 2050.
• Gasunie has been measuring and reducing methane emissions through reduction programs, since 1990.
Emission Type CH4 2012 [ton]
CH4 2013 [ton]
CH4 2014 [ton]
CH4 2015 [ton]
CH4 2016 [ton]
Fugitive 5,404 5,109 4,383 3,336 2,465
Pneumatic 1,759 1,507 1,400 1,350 1,328
Vents 3,119 2,840 2,330 2,517 3,075
Note: Vents depend on maintenance programmes, which causes them to fluctuate from year to year. This was the case in 2016, where
vents were higher, due to the necessary maintenance work of one of the stations, which required vents for safety reasons. This increase was
therefore an incidental occurrence.
20% Reduction in Scope 1 emissions below 1990
levels = 124,000 tonnes CO2-e
100% CO2 Neutral
2020 2030 2050
40% Reduction in all Emissions (scope 1,2,3)
below 1990 levels
14,000
12,000
10,000
8,000
6,000
1990
1992
1994
1996
1998
2000
2002
2004
2006
2008
2010
2012
2014
2016
4,000
2,000
140
120
100
80
60
40
20
0
Met
hane
Em
issi
on (t
onne
)
Tran
spor
ted
Volu
me
(bill
ion
m3n
)
Methane Emissions vs. Transported Volumes
Methane Transported Volume
6,000
5,000
4,000
3,000
2,000
1,000
2007 2007 2008 2010 2011 2012 2013 2014 2015 20160
Fugitive Vents Pneumatic
Progress Methane Emissions Reductions by Type
Met
hane
Em
issi
on (t
onne
)
Start of LDAR Program
Start of LDAR Program
Start of Program Replacing Venting Devices
Incidental increase in vents due to key station maintenance
24 25
The Natural Gas Industry | Methane Emissions Challenge
Key Reduction Measures Used
The key elements of methane reductions program (aimed to meet the overall company GHG target) are:
• Leak detection and repair (LDAR)
• The use of a mobile re-compressor unit
• Replacements of venting components and parts with non-venting (i.e. venting pressure regulators, start motors of compressors)
• Optimization of maintenance planning, and the substituting venting for flaring, where no other options are currently possible
• Detection, measurement, and mapping of the company methane emissions (this is a critical component for developing and executing an effective reduction strategy)
Case in Point: LDAR Campaign 2013-16
The LDAR campaign resulted in the reduction of methane emissions by over 50%, or 2, 644 tons. It covered:
• delivery stations
• pressure regulation and measurement stations
• high-pressure valve stations, and
• compressor stations.
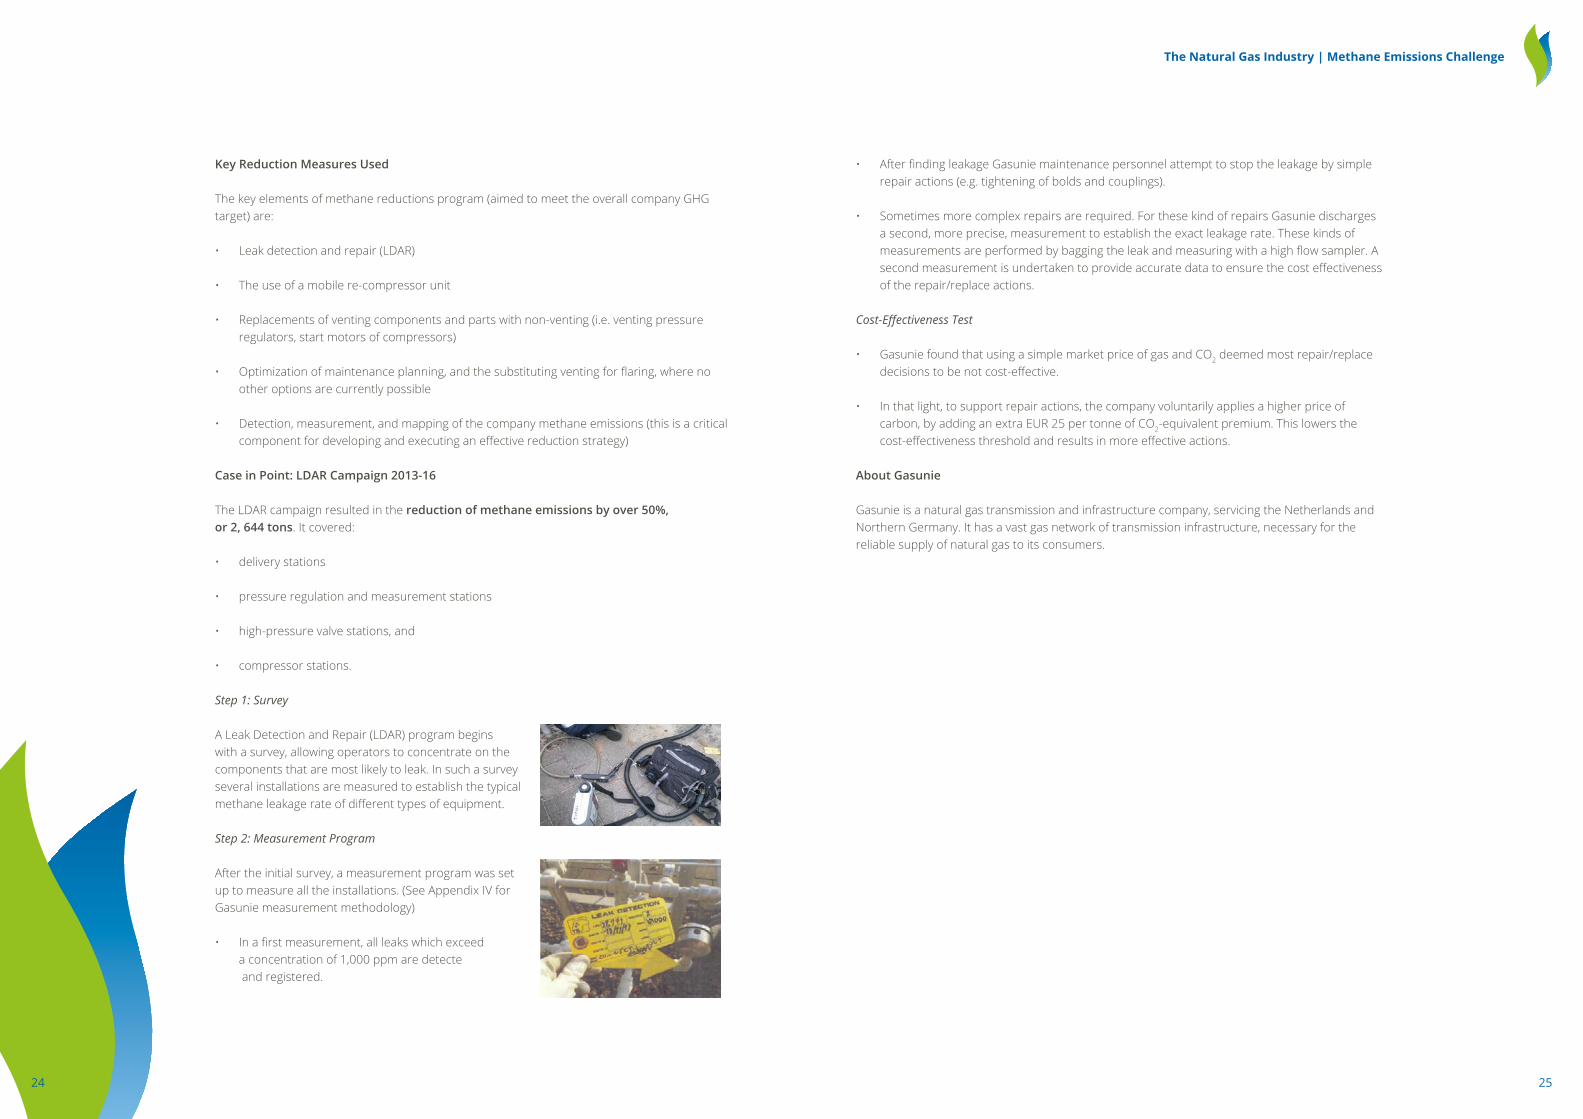
Step 1: Survey
A Leak Detection and Repair (LDAR) program begins with a survey, allowing operators to concentrate on the components that are most likely to leak. In such a survey several installations are measured to establish the typical methane leakage rate of different types of equipment.
Step 2: Measurement Program
After the initial survey, a measurement program was set up to measure all the installations. (See Appendix IV for Gasunie measurement methodology)
• In a first measurement, all leaks which exceed a concentration of 1,000 ppm are detecte and registered.
• After finding leakage Gasunie maintenance personnel attempt to stop the leakage by simple repair actions (e.g. tightening of bolds and couplings).
• Sometimes more complex repairs are required. For these kind of repairs Gasunie discharges a second, more precise, measurement to establish the exact leakage rate. These kinds of measurements are performed by bagging the leak and measuring with a high flow sampler. A second measurement is undertaken to provide accurate data to ensure the cost effectiveness of the repair/replace actions.
Cost-Effectiveness Test
• Gasunie found that using a simple market price of gas and CO2 deemed most repair/replace decisions to be not cost-effective.
• In that light, to support repair actions, the company voluntarily applies a higher price of carbon, by adding an extra EUR 25 per tonne of CO2-equivalent premium. This lowers the cost-effectiveness threshold and results in more effective actions.
About Gasunie
Gasunie is a natural gas transmission and infrastructure company, servicing the Netherlands and Northern Germany. It has a vast gas network of transmission infrastructure, necessary for the reliable supply of natural gas to its consumers.

26 27
The Natural Gas Industry | Methane Emissions Challenge
3.3.3 Italy Mobile Compressor Unit Application: SNAM
Methane Reduction Target
Target 1 for 2021: to reduce methane emissions by 10%, like for like, compared with 2016 figures
Target 2: Reduce vented emissions by 30% annually
Key Reduction Measures:
• Installation of electric motor starters
• Minimizing maintenance vented emissions when compressors are taken offline
• Replacing or eliminating old or unnecessary equipment
• Use of hot taps for in-service pipeline connections
• Convert gas pneumatic controls to instrument air
• Evaluate industry options for reducing methane emissions from pneumatic devices
• Injection of blow-down gas into mains in compressor stations
• Implement techniques to lower pipeline pressure prior to maintenance
Case in Point: Reducing Venting through Gas Recovery and Recompression
Pipelines
• In 2016, SNAM abated approximately 4 MCM and 141.2 MCF (about 13 operations).
• Pipeline maintenance often requires venting to ensure safe working conditions.
• One technique to reduce venting at this stage is known as pump-down, whereby the pipeline pressure is reduced to minimum, prior to venting. Snam applies this when that is technically feasible17.
• Pressure is reduced with the help of a mobile compressor. The compressor pumps the natural gas from the pipeline section to be vented and recompresses it into a nearby section.
• The cost of one procedure is over EUR 50 000, depending on the duration of the intervention.
17 Pipeline pump-down techniques require the use of a mobile compressor. It has to be noted that re-gardless the pump-down technique selected, methane emission reductions are directly proportional to the amount of pipeline pressure, which must be reduced before starting the activity.
Compression Stations
• A similar practice could be implemented in compressor stations, when being taken out of service for operational or maintenance purposes.
• In this case, it is possible to save gas, and avoid methane emissions, by depressurizing to a connected or nearby low-pressure system or by installing an electric gas compressor to reroute the non-vented (saved) gas into high pressure grid.
• SNAM installed 5 of these systems to date, avoiding 0.25 MCM (8.8 MCF) vented emissions annually.
• However, avoided emissions figure will vary, as it strongly depends on the operating conditions and technical limitations (for example it is not possible to re-route gas into the network in case of emergency, or when network pressure is below 3-4 bar).
Gas recovery system installed in Snam compressor stations
Mobile compressor - Snam gas facilities
•

28 29
The Natural Gas Industry | Methane Emissions Challenge
• The cost of one compressor station recovery system exceeds EUR 500 000.
• Because of the high capital cost, relative to achieved savings, this is a highly case-specific measure.
About SNAM
Based in Italy, SNAM is active in the construction and integrated management of natural gas infrastructure, including transport, storage, and regasification. Its infrastructure consists of more than 32,500 km of pipelines, 11 compressor stations, 9 storage facilities, 1 regasification plant. Through associated companies, Snam operates in Austria (TAG and GCA), France (TIGF), United Kingdom (Interconnector UK) and is shareholder of the TAP project.
3.4 DOWNSTREAM
3.4.1 Mexico / Spain Vacuum Pump Application: Gas Natural Fenosa (Gnf)
Overall GHG Commitment
• GNF has set a target of reducing GHG emissions by 26 % in the period 2012- 2025. To measure and track its progress, GNF reports the carbon footprint of its activities annually.
• Approximately 92% of its GHG’s come from CO2 emissions, while CH4 emissions represent approximately 7% (see the chart below).
Total Emissions: 19.6 Mt CO2-eq
Key Reduction Measures:
• Hot taps for in service pipeline connections.18
• Operational optimization of maintenance to reduce vents.
• Reducing Distribution System Pressure to Reduce Leakage Rate in low consumption periods (summer).
• Improvements in the leakage surveying activity for gas networks and facilities, by using a variety of instruments, including infrared cameras, organic vapor analyzers, acoustic leak detectors.
• Removal of leak risk mains from service.
Case in Point: Reducing Methane Emissions During Gas Pipeline Commissioning – Vacuum Pump
Commissioning of new gas pipelines is one of the most important stages during the construction of a distribution gas grid, or the extension of an old one; and with hundreds of kilometers of gas pipelines being put into operation in a year, eliminating methane emissions from the process of pipeline commissioning is a key priority.
Under usual operations, commissioning of a new distribution pipeline requires a certain amount of gas and air mixture to be vented, in order to achieve a safe concentration of gas in the added pipe segment. This is a safety requirement, as too much air in the mixture can lead to a safety hazard.
GNF is planning to eliminate these vented emissions by improving its commissioning procedures and using a vacuum pump to avoid the need to release any natural gas into the atmosphere.
• After initial deployment in Mexico, the new procedure reduced methane emissions by about 31.68 tons CH4/year, or 792 ton CO2-e, taking 2014 as reference year (new network constructed). That is a 0.5% reduction in GNF’s methane emissions.
• Savings from avoided gas loss were 11 300 EUR/year (only for Mexico). The vacuum pump incurred costs were EUR 3 000, resulting in net benefit of EUR 8 300 in the first year.
• Based on the success of the new procedure in Mexico, GNF will apply it to all of its operations globally, and all new pipeline commissioning will need to use the vacuum pump technology, avoiding venting. GNF is currently developing this new standard and plans to release it by the end of 2017.
18 Hot tap procedure attaches a branch connection and valve on the outside of an operating pipeline, and then cutting out the pipeline wall within the branch and removing the wall section through the valve. This allows to connect a new pipeline without taking the segment offline.
CO2 CH4 SF6 HFC PFCN2O
0.13%
0.13%
0.02%
0.00%
92.60% CO2
7.12% CH4

30 31
The Natural Gas Industry | Methane Emissions Challenge
Steel Pipeline
Diameter 2” 4” 6” 8” 12”
Avoided emissions (Ton CO2-e/1000 km) 722 2,740 6,221 10,771 2,4086
Polyethelene Pipeline
Diameter (mm) 63 90 110 160 200
Avoided emissions (Ton CO2-e/1000 km) 172 350 523 1,109 1,732
How it Works
• A vacuum pump is used to extract air inside the gas pipeline after the strength and gas tightness tests have been performed. This will allow natural gas to flow downstream without venting the new pipeline section.
• Once the required vacuum pressure is reached inside the pipeline, natural gas is injected into the pipeline section, avoiding any air-gas mixture formation within gas flammability limits; the final mixture is higher than 97% of Natural Gas.
Figure 1: Current procedure cannot avoid releasing some natural gas into the atmosphere
Figure 2: Using a vacuum pump, natural gas is not released into the atmosphere.
About GNF
Gas Natural Fenosa is an international natural gas distribution company, with operations in Spain, Italy, Chile, Columbia, Mexico, Brazil, and Argentina.
3.5 PEOPLE
3.5.1 Russian Federation Employee Incentive Program: Gazprom
Overall, Gazprom has reduced its methane emissions by 6.9%, since 2012 and continues efforts to increase these savings.
The natural gas transmission network is largest contributor of methane emissions in the Russian gas sector (about 80% of all emissions from the oil and gas industry).
Venting is the highest source of methane emissions at natural gas transmission facilities, and the reduction of these emissions is currently the focus of Gazprom’s abatement strategy. For example, transmission system methane emissions resulting from maintenance were reduced by 9.4 %, since 2011.
Key reduction methods applied:
• Improvement of dispatch management to avoid venting before repairing: natural gas transfer from the off-line section of the large diameter gas pipeline to next compressor stations or to consumer via gas distribution plants
• Tapping under pressure technology (hot taps)
Metalic pipe
MethaneEmissions
Safety area
Steel pipeService line valve
Service line PEFlexible
connectionPE-Steel
Tapping
32 33
The Natural Gas Industry | Methane Emissions Challenge
• Pumping the transmitted gas from the blocked pipeline via mobile compressor unit (MCU) and transferring it to another part of the pipeline
• Conducting gas-dynamic testing and geophysical well logging, without gas being released into the atmosphere
(See Appendix V for additional information about Gazprom methane reduction techniques.)
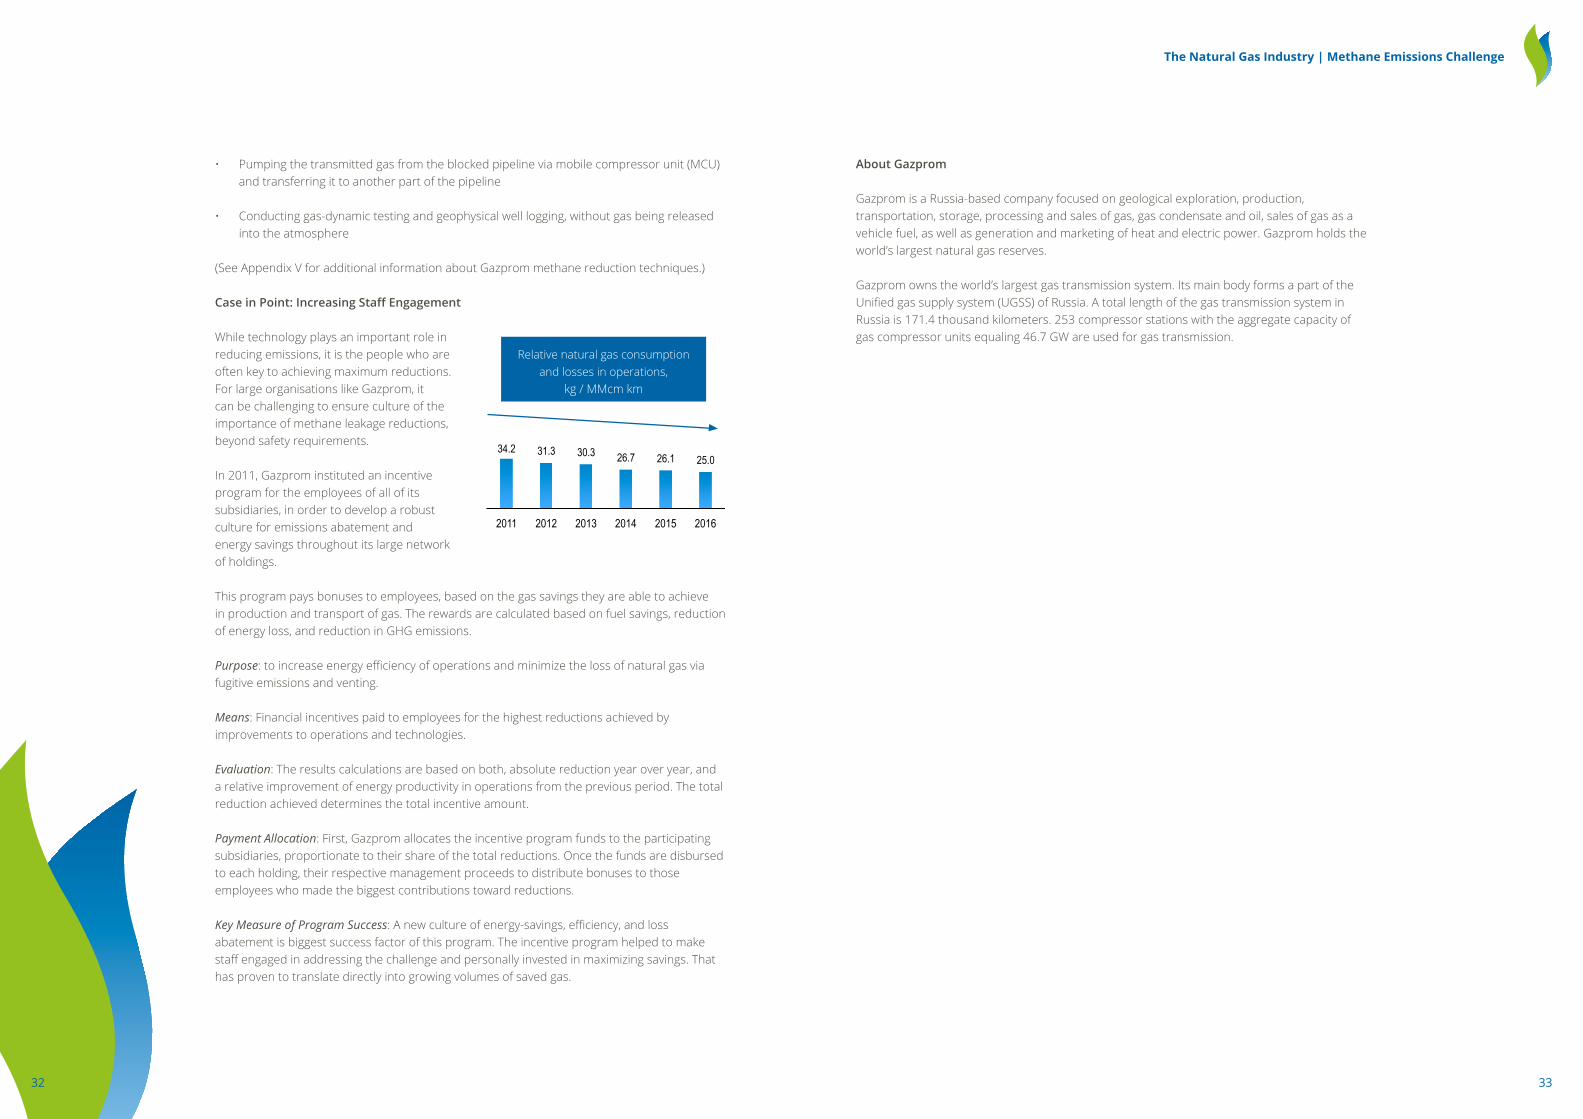
Case in Point: Increasing Staff Engagement
While technology plays an important role in reducing emissions, it is the people who are often key to achieving maximum reductions. For large organisations like Gazprom, it can be challenging to ensure culture of the importance of methane leakage reductions, beyond safety requirements.
In 2011, Gazprom instituted an incentive program for the employees of all of its subsidiaries, in order to develop a robust culture for emissions abatement and energy savings throughout its large network of holdings.
This program pays bonuses to employees, based on the gas savings they are able to achieve in production and transport of gas. The rewards are calculated based on fuel savings, reduction of energy loss, and reduction in GHG emissions.
Purpose: to increase energy efficiency of operations and minimize the loss of natural gas via fugitive emissions and venting.
Means: Financial incentives paid to employees for the highest reductions achieved by improvements to operations and technologies.
Evaluation: The results calculations are based on both, absolute reduction year over year, and a relative improvement of energy productivity in operations from the previous period. The total reduction achieved determines the total incentive amount.
Payment Allocation: First, Gazprom allocates the incentive program funds to the participating subsidiaries, proportionate to their share of the total reductions. Once the funds are disbursed to each holding, their respective management proceeds to distribute bonuses to those employees who made the biggest contributions toward reductions.
Key Measure of Program Success: A new culture of energy-savings, efficiency, and loss abatement is biggest success factor of this program. The incentive program helped to make staff engaged in addressing the challenge and personally invested in maximizing savings. That has proven to translate directly into growing volumes of saved gas.
About Gazprom
Gazprom is a Russia-based company focused on geological exploration, production, transportation, storage, processing and sales of gas, gas condensate and oil, sales of gas as a vehicle fuel, as well as generation and marketing of heat and electric power. Gazprom holds the world’s largest natural gas reserves.
Gazprom owns the world’s largest gas transmission system. Its main body forms a part of the Unified gas supply system (UGSS) of Russia. A total length of the gas transmission system in Russia is 171.4 thousand kilometers. 253 compressor stations with the aggregate capacity of gas compressor units equaling 46.7 GW are used for gas transmission.
34.2 31.3 30.3 26.7 26,1 25,0
2011 2012 2013 2014 2015 2016
Relative natural gas consumption and losses in operations,
kg / MMcm km
34.2 31.3 30.3 26.7 26,1 25,0
2011 2012 2013 2014 2015 2016
34.2 31.3 30.3 26.7 26,1 25,0
2011 2012 2013 2014 2015 2016

34 35
The Natural Gas Industry | Methane Emissions Challenge
4: Glossary
Blow-down refers to the intentional relieving or venting of pressure from piping, pipelines, compressors, vessels, and other equipment to ensure safety for maintenance, when equipment is taken offline.
Compressors are a mechanical device that increases the pressure of a gas or liquid by reducing its volume. Gas compressors are used to compress natural gas to help it move along the network, or from one segment of pipe to another.
Compressor Station is a facility that increases pressure of the natural gas to move it through gathering lines, transmission system, or into storage.
Composite Wrap for Non-leaking Pipeline Defects Non-leaking pipeline defects, such as corrosion, dents, gouges, pits, and cracks can increase the risk of pipeline failure. Composite wrap is used as an alternative to pipeline replacement, to reduce safety risks, decrease pipeline downtime, save gas, and decrease methane emissions to the atmosphere. The wrap is essentially a reinforcing sleeve that is placed over the repairable pipe segment. This also avoids having to take the segment out of service.
Flaring is the controlled burning of waste gases (including methane), using an open or closed flame without energy recovery.
Hot Taps / Tapping Under Pressure is a procedure that allows a new pipeline connection to be made, while the pipeline remains in service, flowing natural gas under pressure. The hot tap procedure involves attaching a branch connection and valve on the outside of an operating pipeline, and then cutting out the pipe-line wall within the branch and removing the wall section through the valve. Hot tapping avoids product loss, methane emissions, and disruption of service to customers.
Leak Detection and Repair (LDAR) is an industry practice to support the identification and repair of leaking components (e.g. valves, connectors, flanges, open ended lines), equipment (e.g. compressor rod packing, pneumatic controllers, storage tank theif hatches), or infrastructure that may be a source of methane emissions. Whilst LDAR in certain jurisdictions can have a specific regulatory definition it is more generally used to describe the processes and systems by which leaking equipment is identified, prioritised, and then repaired. Optical gas imaging cameras are often used within the LDAR practice alongside other techniques.
Plunger lift is a system installed on a well to assist in deliquification when there is no longer consistent and sufficient flow velocity to produce the well. A plunger lift system uses the well’s own energy (gas/pressure) to lift liquids from the tubing by pushing the liquids to the surface by the movement of a free traveling plunger ascending from the bottom of the well to the surface. When directed to by the plunger control system, a plunger drops from the well lubricator and will fall to the bumper spring and landing tool typically located at the production zone. As pressure increases in the well, typically after well shut-in, the plunger acts like a pipeline pig and begins lifting the liquids to the surface. Flow can be directed to the separation equipment and sales line in which case emissions do not occur. Flow can also be directed to storage tanks with the gas vented to atmosphere or to the separation equipment with gas vented to atmosphere.
Pneumatic Controllers are automated instruments used for maintaining a process condition such as liquid level, pressure, flow rates, and temperature. Pneumatic controllers employ the use of natural gas or instrument air to operate or signal the controller. Natural gas driven pneumatic controllers are the most common, due to their favourable economics, and the fact they can make use of readily available high-
pressure natural gas to provide the required energy and control signals. As part of normal operation, natural gas powered pneumatic devices release or bleed gas, and, consequently, are a source of methane emissions.
Instrument Air can be substituted for natural gas in pneumatic devices, to eliminate methane bleed. The major components of an instrument air conversion project include the air compressor, power source, dehydrator, and volume tank. In these systems, atmospheric air is compressed, stored in a volume tank, filtered and dried for instrument use. All other parts of a gas pneumatic system work the same way with air as they do with gas.
Tank blanket gas is a gas introduced into a fixed roof tank at low pressure. This is a common practice for minimizing air entering a tank and creating a potentially explosive atmosphere. Natural gas is sometimes used for tank blanketing, but other gases, such as inerts (e.g. nitrogen), maybe used instead.
Tie-in includes the conventional method of connecting pipeline segments, by taking a pipeline segment out of service to connect the new pipeline. A hot tap is another method that can be used to connect a pipeline segment.
Well Completion is a process that occurs after a well is drilled, where subsurface casing is perforated, the surrounding rock may be hydraulically fractured, and tubing and downhole well flow equipment is installed in a new or existing well bore. It is the process that is a precursor to, and allows for, the flowback of petroleum or natural gas from newly drilled or recompleted wells to expel drilling and reservoir fluids (including water and hydrocarbons) and test the reservoir flow characteristics.
Well Stimulation is the treatment of a well to enhance gas production and recovery by increasing the permeability.
Wet Seals & Dry Seals are both used in centrifugal compressors to prevent natural gas from escaping.
Wet Seals use oil that is circulated under high pressure around the compressor, forming a barrier against gas leakage. While leakage is largely prevented by the seal oil, the oil ends up absorbing gas instead. Seal oil is then purged of the absorbed gas and reused, and the recovered methane is often vented.
Dry Seals are an alternative to the traditional wet (oil) seal. This is a seal system that operates mechanically under the opposing force created by hydrodynamic grooves and static pressure, not using seal oil.
US EPA Method 21 – Is a method of using portable instruments to detect VOC leaks from process components (e.g. valves, connectors, flanges, open ended lines, pressure relief valves) and equipment (e.g. compressor seal system degassing vents, pumps, agitator seals). U.S EPA Method 21 –Determination of Volatile Organic Compound Leaks” establishes portable instrument performance criteria, calibration criteria, and individual source surveys (e.g. how to survey a valve).
US EPA Natural Gas Star Program - The Natural Gas STAR Program provides a framework for partner companies with U.S. oil and gas operations to implement methane reducing technologies and practices and document their voluntary emission reduction activities. By joining the Program, partners commit to: 1) evaluate their methane emission reduction opportunities, 2) implement methane reduction projects where feasible, and 3) annually report methane emission reduction actions to the EPA.
36 37
The Natural Gas Industry | Methane Emissions Challenge
5: Appendices
Appendix I European GHG Emissions Reporting Protocol
In Europe emissions are reported in the three following categories.
Scope 1 Direct GHG emissions: includes emissions from sources owned or controlled by companies;
Scope 2 Indirect GHG emissions: includes emissions from energy that is purchased and consumed in operations, but is not controlled by the company; i.e. generation of purchased electricity
Scope 3 Other Indirect emissions: a flexible category that can include emissions not covered in Scope 1 and 2. It provides an opportunity to be innovative in GHG management. Companies may want to focus on accounting for and reporting those activities that are relevant to their business and goals.
For example, Gasunie accounts for the purchase of nitrogen which is added to natural gas for quality conversion as a scope 3 emission. Energy is needed for the production of nitrogen.
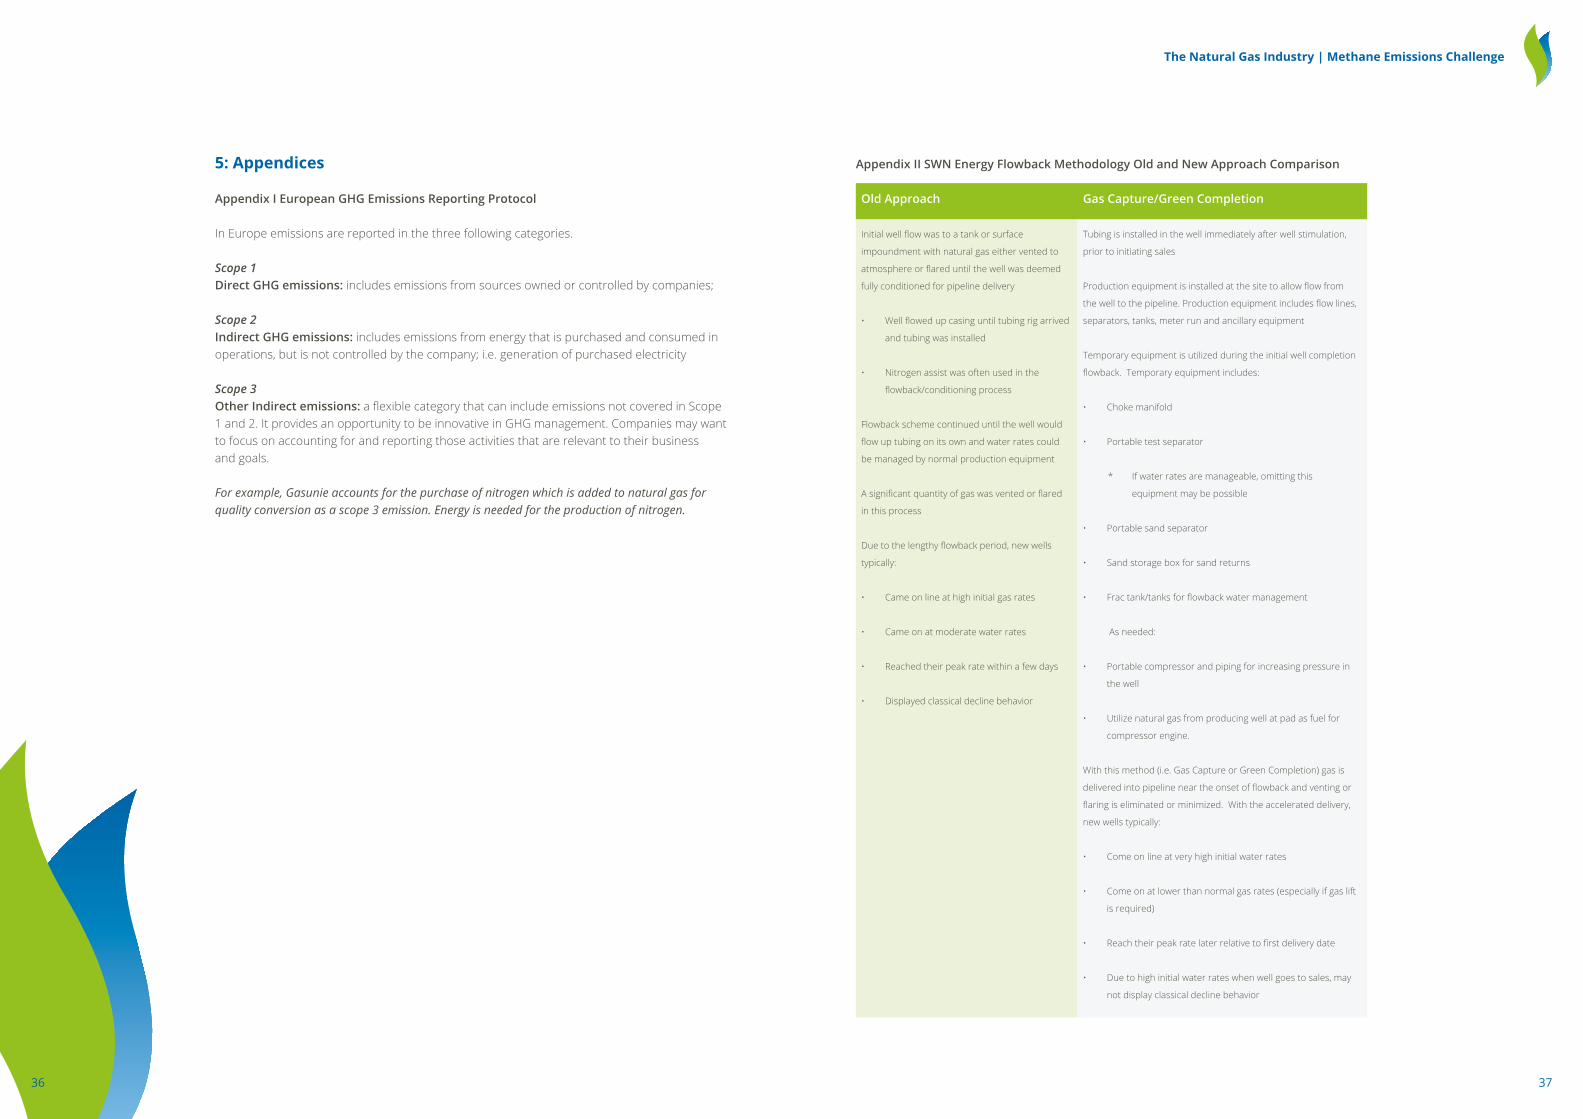
Appendix II SWN Energy Flowback Methodology Old and New Approach Comparison
Old Approach Gas Capture/Green Completion
Initial well flow was to a tank or surface
impoundment with natural gas either vented to
atmosphere or flared until the well was deemed
fully conditioned for pipeline delivery
• Well flowed up casing until tubing rig arrived
and tubing was installed
• Nitrogen assist was often used in the
flowback/conditioning process
Flowback scheme continued until the well would
flow up tubing on its own and water rates could
be managed by normal production equipment
A significant quantity of gas was vented or flared
in this process
Due to the lengthy flowback period, new wells
typically:
• Came on line at high initial gas rates
• Came on at moderate water rates
• Reached their peak rate within a few days
• Displayed classical decline behavior
Tubing is installed in the well immediately after well stimulation,
prior to initiating sales
Production equipment is installed at the site to allow flow from
the well to the pipeline. Production equipment includes flow lines,
separators, tanks, meter run and ancillary equipment
Temporary equipment is utilized during the initial well completion
flowback. Temporary equipment includes:
• Choke manifold
• Portable test separator
* If water rates are manageable, omitting this
equipment may be possible
• Portable sand separator
• Sand storage box for sand returns
• Frac tank/tanks for flowback water management
As needed:
• Portable compressor and piping for increasing pressure in
the well
• Utilize natural gas from producing well at pad as fuel for
compressor engine.
With this method (i.e. Gas Capture or Green Completion) gas is
delivered into pipeline near the onset of flowback and venting or
flaring is eliminated or minimized. With the accelerated delivery,
new wells typically:
• Come on line at very high initial water rates
• Come on at lower than normal gas rates (especially if gas lift
is required)
• Reach their peak rate later relative to first delivery date
• Due to high initial water rates when well goes to sales, may
not display classical decline behavior

38 39
The Natural Gas Industry | Methane Emissions Challenge
LNG Plants
Storage
Compressor stations
Meter & regulation stations
Pipeline
0.005-0.1% of throughput
0.05-0.07% of working gas capacity
6,000-100,00 m3/MW.year
1,000-50,000 m3/station.year
200-20,000 m3/km.year
IPCC 2006 Ratios
Enagáś ratios
Appendix III Enagas Methane Emissions Factors
Based on the results of its LDAR campaign, Enagás developed internal emission factors for different components. In addition to the FID method, used during the campaign, several components were also measured, in order to make the emission factors consistent with those from literature.
The table below shows methane emission ratios provided by IPCC (TIER 1) compared to Enagás´ factors based on our on-site measurements and own correlation factors (TIER 3).
Figure 5: Comparison TIER 1 (IPCC) vs. TIER 3 (Enagás data)
Enagás’ ratios (TIER 3) are in general much lower than the IPCC ratios (TIER 1) and in some cases in line with the lowest range of the IPCC ratios.
It is important to highlight that Enagás ratios are calculated from actual data, gathered through on-site measurements in all, or in a significantly high proportion of our infrastructure components; in the latter case, an extrapolation can be completed confidently for that entire infrastructure.
Appendix IV Gasunie Measurement Methodology (EPA 21)
For the measurement of fugitive emissions, the EPA2119 measurement method offers an approach to determine emissions from equipment leaks.
The first step of this method is to measure the concentration of a leaking equipment. For this a measurement device is used which uses part of the surrounding air in the direct vicinity of the equipment which leads to the measurement. A flame ionisation detector (FID) is used to measure the methane concentration in the sample.
The next step of the method is to calculate a leak rate from the measured concentration. The algorithm to convert a concentration (in ppm) to a flow rate (in kg /year) is based on experimental data which was obtained for the Synthetic Organic Chemical Manufacturing Industry (so called SOCMI-factors), and for the petroleum industry (PI-factors).
For example the leak rate of a gas valve is calculated as:
leak rate (kg per hr) =1.87.10-6×(concentration (ppm)).0.873
Gasunie uses the SOCMI correlation factors for determining and reporting its fugitive emissions. This decision was based on the fact that Dutch national legislation prescribes this standard.
Measurements according the EPA21 method can be executed in a relative short time compared to other methods. This is a necessary requirement because of the large number of equipment (i.e. flanges, couplings, valves) in the gas infrastructure.
Implementing a directed inspection and maintenance program is a proven way to detect and repair equipment leaks to reduce methane emissions from gas facilities in gas infrastructure systems.
• This program contains:
• The choice of measuring equipment;
• Training of personal to perform the LDAR programme;
• Planning of the measurements;
• Criteria for repair;
• Registration of the measurements before and after repair.
19 United States Environmental Protection Agency Method 21
40 41
The Natural Gas Industry | Methane Emissions Challenge
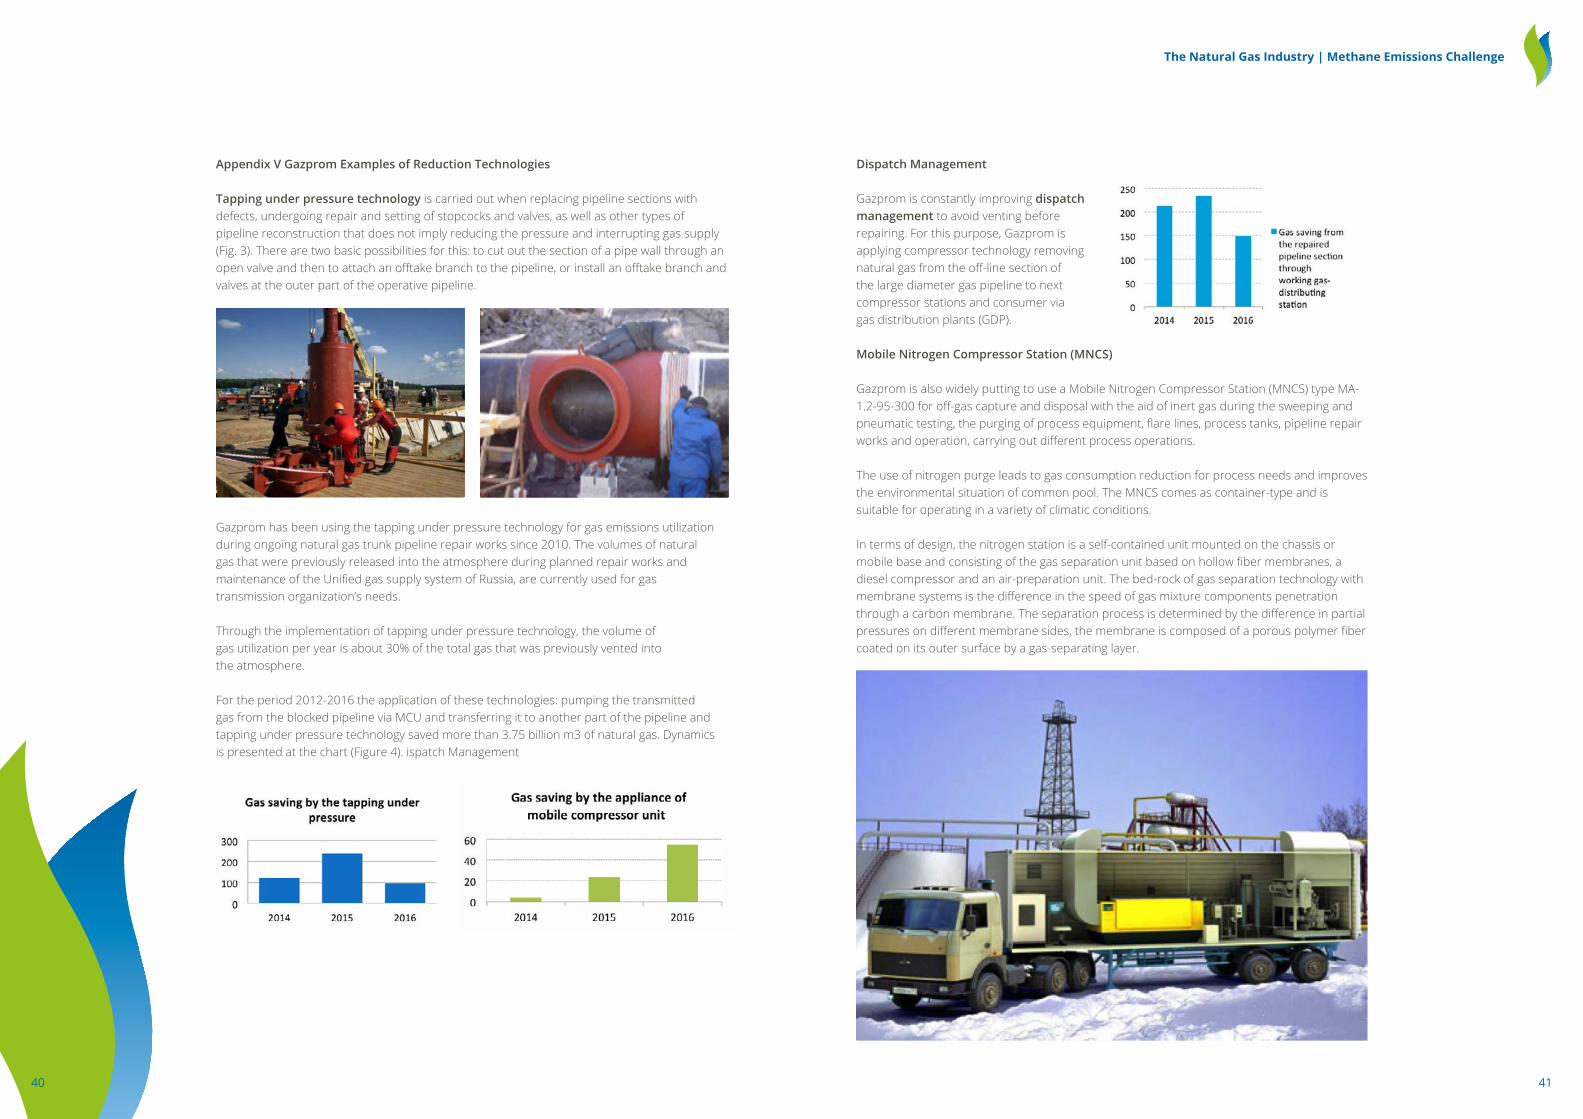
Appendix V Gazprom Examples of Reduction Technologies
Tapping under pressure technology is carried out when replacing pipeline sections with defects, undergoing repair and setting of stopcocks and valves, as well as other types of pipeline reconstruction that does not imply reducing the pressure and interrupting gas supply (Fig. 3). There are two basic possibilities for this: to cut out the section of a pipe wall through an open valve and then to attach an offtake branch to the pipeline, or install an offtake branch and valves at the outer part of the operative pipeline.
Gazprom has been using the tapping under pressure technology for gas emissions utilization during ongoing natural gas trunk pipeline repair works since 2010. The volumes of natural gas that were previously released into the atmosphere during planned repair works and maintenance of the Unified gas supply system of Russia, are currently used for gas transmission organization’s needs.
Through the implementation of tapping under pressure technology, the volume of gas utilization per year is about 30% of the total gas that was previously vented into the atmosphere.
For the period 2012-2016 the application of these technologies: pumping the transmitted gas from the blocked pipeline via MCU and transferring it to another part of the pipeline and tapping under pressure technology saved more than 3.75 billion m3 of natural gas. Dynamics is presented at the chart (Figure 4). ispatch Management
Dispatch Management
Gazprom is constantly improving dispatch management to avoid venting before repairing. For this purpose, Gazprom is applying compressor technology removing natural gas from the off-line section of the large diameter gas pipeline to next compressor stations and consumer via gas distribution plants (GDP).
Mobile Nitrogen Compressor Station (MNCS)
Gazprom is also widely putting to use a Mobile Nitrogen Compressor Station (MNCS) type MA-1.2-95-300 for off-gas capture and disposal with the aid of inert gas during the sweeping and pneumatic testing, the purging of process equipment, flare lines, process tanks, pipeline repair works and operation, carrying out different process operations.
The use of nitrogen purge leads to gas consumption reduction for process needs and improves the environmental situation of common pool. The MNCS comes as container-type and is suitable for operating in a variety of climatic conditions.
In terms of design, the nitrogen station is a self-contained unit mounted on the chassis or mobile base and consisting of the gas separation unit based on hollow fiber membranes, a diesel compressor and an air-preparation unit. The bed-rock of gas separation technology with membrane systems is the difference in the speed of gas mixture components penetration through a carbon membrane. The separation process is determined by the difference in partial pressures on different membrane sides, the membrane is composed of a porous polymer fiber coated on its outer surface by a gas-separating layer.

42 43
The Natural Gas Industry | Methane Emissions Challenge
Published by the International Gas Union (IGU)
Copyright © 2017 The entire content of this publication is protected by copyright, full details of which are available from the publisher. All rights reserved. No part of this part of this publication may be reproduced, stored in retrieval systems or transmitted in any form or by any means – electronic, mechanical, photocopying, recording or otherwise – without the prior permission of the copyright owner.
International Gas UnionIGU SecretariatATT: Gas Natural FenosaPlaça del Gas, 1Building B 3rd floor08003 BarcelonaSpain
Telephone: + 34 93 412 97 89Fax: + 34 93 402 54 26E-mail: [email protected]: www.igu.org


