THE AMERICAN MINERALOGIST, VOL. 48, JANUARY-FEBRUARY, 1963 THE NATURE AND SYNTHESIS OF FERRIMOLYBDITE Plur F. Konn, Anrnun W. Tnouas .qNnAnrnun M. LaNcnn, Department oJ Geology, Colwmbia Un'irersity, New York, N. Y. Assrnlcr The yellow coating frequently found on sulfide ores of molybdenum and described as ferrimolybdite has been studied New data are given based on studies by teray diffraction, difierential thermal analysis, optical examination, and infrared absorption. The mineral has been synthesized and the artificial product compared with natural ferrimolybdite. INrnooucrtoN It has long been recognizedthat oxidation producesa yellow coating on sulfide ores of molybdenum and early specimens in a number of collec- tions carriedthe label molybdic MoOawith the beliefthat the coating was molybdic oxide. However, through the work of Schaller (1907), Guild (1907),Pilipenko (19t4), Smith (1923),Simpson(1926)and others it has becomeapparent that the yellow material ordinarily observedis ferri- molybdite. Recently, through the courtesy of the Climax Molybdenum Company a suite of oxidized molybdenum ores from Climax, Colorado was assem- bled. It was decided to examine the yellow oxidized mineral of these ores and compareit with similar material from other localities. It was felt to be particularly desirable to confirm the absence of molybdite, to obtain more data on the naturb of ferrimolybdite, and for purposes of study to prepare synthetic material comparable to natural ferrimolybdite. The yellow mineral of Climax is essentially microcrystalline and con- sists of minutely massive material, bundles of fine fibers, and nodules of radial fibers.It is found associated with limonite, goethite and jarosite in surface exposures and drill holes in the vicinity of the large caved area above the Climax mine. Presumably the weathering of pyrite and molyb- denite has resulted in the formation of ferrimolybdite, and at the same time jarosite, goethite and limonite were produced, all of which yield molybdenum on analysis. The yellow mineral may occur intimately mixed with these associates, in isolated veinlets, disseminated through the oxidized material, or in thin crusts. Apparently it is one of the prod- ucts of oxidation. In hand specimen ferrimolybdite may form bands around small molybdenite areasand grade into surrounding limonite. This study has been supported by the Climax Molybdenum Co., and the courtesy of the company in releasing the paper for publication is gratefully acknowledged. We are indebted to Prof. Nathaniel Arbiter for separated concentrates of Climax minerals. The optical studies, early mineral separationsand initial x-ray data were made with the assistance of Mr. Carl Hott. t4
Transcript
THE AMERICAN MINERALOGIST, VOL. 48, JANUARY-FEBRUARY, 1963
THE NATURE AND SYNTHESIS OF FERRIMOLYBDITE
Plur F. Konn, Anrnun W. Tnouas .qNn Anrnun M. LaNcnn,Department oJ Geology, Colwmbia Un'irersity, New York, N. Y.
Assrnlcr
The yellow coating frequently found on sulfide ores of molybdenum and described asferrimolybdite has been studied New data are given based on studies by teray diffraction,difierential thermal analysis, optical examination, and infrared absorption. The mineral hasbeen synthesized and the artificial product compared with natural ferrimolybdite.
INrnooucrtoN
It has long been recognizedthat oxidation produces a yellow coating onsulfide ores of molybdenum and early specimens in a number of collec-tions carried the label molybdic MoOa with the belief that the coating wasmolybdic oxide. However, through the work of Schaller (1907), Guild(1907), Pil ipenko (19t4), Smith (1923), Simpson (1926) and others it hasbecome apparent that the yellow material ordinarily observed is ferri-molybdite.
Recently, through the courtesy of the Climax Molybdenum Companya suite of oxidized molybdenum ores from Climax, Colorado was assem-bled. It was decided to examine the yellow oxidized mineral of these oresand compare it with similar material from other localit ies. It was felt tobe particularly desirable to confirm the absence of molybdite, to obtainmore data on the naturb of ferrimolybdite, and for purposes of study toprepare synthetic material comparable to natural ferrimolybdite.
The yellow mineral of Climax is essentially microcrystalline and con-sists of minutely massive material, bundles of fine fibers, and nodules ofradial f ibers. It is found associated with l imonite, goethite and jarosite insurface exposures and drill holes in the vicinity of the large caved areaabove the Climax mine. Presumably the weathering of pyrite and molyb-denite has resulted in the formation of ferrimolybdite, and at the sametime jarosite, goethite and limonite were produced, all of which yieldmolybdenum on analysis. The yellow mineral may occur intimatelymixed with these associates, in isolated veinlets, disseminated throughthe oxidized material, or in thin crusts. Apparently it is one of the prod-ucts of oxidation. In hand specimen ferrimolybdite may form bandsaround small molybdenite areas and grade into surrounding limonite.
This study has been supported by the Climax Molybdenum Co., andthe courtesy of the company in releasing the paper for publication isgratefully acknowledged. We are indebted to Prof . Nathaniel Arbiter forseparated concentrates of Climax minerals. The optical studies, earlymineral separations and initial x-ray data were made with the assistanceof Mr. Carl Hott.
t4
FERRIMOLVBDITE
CnBlrrcar, Couposrtrox
Palache et al. (1951, p. 1095) give the composition of ferrimolybdite asFer(MoOa)3.8 HzO (3 MoOs: FezOr i 8 HrO). The molecular proportions ofthese components represent averages from numerous analyses (Table 1).
T.qrrB 1. ANer,vsrs or Fr,nmuclr,ynlrro
Ratio MoO: : FezOa : HrO Analyst Location of Sample
10.00 Simpson (1926)9.37 Simpson (1926)7 .42 Smith (1923)8.81 Schaller (1908)
14.00 Carrobi (1930)8.90 Pilipenko (1914)
ND Jones and Milne (1954)ND Jones and Milne (1954)
Westmoreland, N. H.Telluride, ColoradoCaliforniaRenfew, OntarioSanta Rita, AirzonaSanta Rita, ArizonaMt. Mulgine, W. Aus.Mt. Mulgine, W. Aus.Wilson's Downfall, S. WalesHortense, ColoradoBivongi, ItalyYeniseisk, SiberiaClimax, ColoradoClimax, Colorado
These anaiyses have been recalculated to 100 per cent aiter subtracting the ,,insolu-
bles." The amount of extraneous material ranges between 1 67 and 24.0 per cent. rn-solubles were not given for samples 7, 8 and 12.
The FezOg:MoOsrat io ranges between the l imi ts of 1:3 and 1:4 whi lethe water content ranges considerably. With these ranges of values inmind, an attempt was made to determine the composition through syn-thesis. synthesis was also undertaken to obtain uncontaminated materialfor Iaboratory study. Ferrimolybdite is found only in fine aggregates andpure natural material is both difficult to separate and limited in amount.
PnopBnrrns oF FERRrMorysDr.l.E
Several physical properties of ferrimolybdite show a considerablerange of values. A number of these have been re-determined, on bothnatural and synthetic materials, and compared with existing data.
Both natural and synthetic crystals of ferrimolybdite suggest ortho-rhombic crystall ization on the basis of optical properties. Syntheticferrimolybdite is easily crushed between the fingers and is 1-2 on Mohs,hardness scale. Synthetic crystals pressed to eliminate air yield aspecific gravity value of 4.46; but the same material powdered yields avalue as determined with the pycnometer of 3.06. The color of both
16 P. F. KERR, A. W. TI]OMAS AND A, M. LANGER
natural and synthetic ferrimolybdite is S.0 Y* in Munsell colorsl the
streak is pale yellow. The luster of natural crystals ranges with occur-
rence, adamantine to silky when fibrous and earthy when encrusting'
Synthetic ferrimolybdite tends to be earthy
SvNrnorrc Fpnnrltor-YslItB
Carrobi claimed to have synthesized the hydrous iron-molybdenum
oxide ferrimolybdite in 1930. Confirmation of the synthesis, however,
was limited to comparison of an apparent similarity of chemical and
optical properties between the synthetic substance and the mineral.
The originai description of the apparent synthesis omits desirable
information. Although the descriptions of the reagents are detailed,
quantitative data are not included on the preparation procedure. Fur-
ther, buffer solutions for maintenance of pH, are omitted, the times
required for various reactions are not given and several other phases of
the process are so vague as to require reworking. The experimental work
has led to redevelopment of the entire synthesis technique. In addition,
although the material Carrobi produced possessed the optical character-
istics and chemical composition of ferrimolybdite, in the absence of
r-ray data uncertainty concerning the identity of the synthetic com-
pound exists. Confirmatory r-ray and physical measurements appeared
desirable.Carrobi used two solutions in his synthesis which were adapted to the
present study as f ollows:
(A) Sodium molybdate-dihydrate, (Na2MoOq'2HzO), (1a'0 g) was dissolved in
clistilled water (500 ml) and acidified by the addition of acetic acid (40 ml) to
pH 3.5-4.0 as judged by the use of indicator paper.
(B) Ferric chloride, (Fecl3.6Hro), (9.0 g) was dissolved in distilled water (50 ml).
Both solutions were prepared at room temperature, whiie the ensuing reaction was carried
out at room temperature and under atmospheric pressure.
The molybdate solution (A) was placed in a beaker on a magnetic stirrer and the chlo-
ride solution (B) added slowly from a burette. The solution first turned deep red, and on the
addition of about 48 ml of the chloride solution a yellow precipitate began to appear. The
remainder of the chloride solution was then added, the system was stirred magnetically for
15 minutes, and was allowed to stand over night. The next day the system was magnetically
stirred for 10 minutes, filtered with a Buchner funnel, washed with 95 per cent ethanol and
the precipitate placed between filter papers to dry at room temperature. The preparation
(laboratory No. 8) was a fine powder, extremely soft, and examination with the microscope
revealed no signs of crystallinity. Powder patterns also failed to yield *-ray diffraction
iines.
This procedure appeared to be basically correct and more expeliments
were continued along this l ine for several months. Variations in types of
buffer solutions and methods of controll ing the reaction were attempted.
At the same time a portion of laboratory preparation No. 8 was im-
FERRIMOLYBDITE I7
mersed in disti l led water and allowed to stand. on a chance reexamina-tion of this material after a number of weeks it showed transparentcrystals about 0.01 mm long. X-tay dif iraction patterns of No. 8 (Water)were found to agree with patterns of natural ferrimolybdite.
At this point, a new preparation (No. 20) was made following theprocedure previously employed for No. 8. In this case, however, in orderto accelerate crystall ization the material was repeatedly heated to 60o c.and allowed to cool.
In the period Oct. 30-Nov.23, 1967 heating, stirring and coolingprocedures were applied to a water preparation of No. 20 (Water). Thisresulted in a laboratory product which consisted of a yellow crystall inematerial. The material was made up of a mat of intergrown needle-likecrystals, larger and more abundant than the crystals formed in prepara-tion 8w. The r-ray diffraction measurements of this material agree withferr.imolybdite (Table 2).
In the preparation of 20W periods of 30 minutes to several hours ofheating solutions up to 60o C., while stirring with a magnetic stirrer,alternated with periods of several hours of cooling and stagnation at roomtemperature. The process was repeated on 10 separate days in the periodOct. 30-Nov. 2I. The solution was allowed to stand overnight withoutagitation and on weekends. By accident the solution was heated to 81oC. on Nov. 10 and 70' C. on Nov. 14, but the duration of the elevatedtemperature was short in both instances. Throughout, water was con-stantly added to the system in order to maintain the proper level ofdilution.
foBNrrrv oF TrrE SvwrnBrrc Marnnr,qr,
The presence of crystall inity in synthetic preparations was detectedby optical birefringence in polarized light and diffraction of r-rays.
Among 32 samples of synthetic preparations examined optically forevidence of crystall inity, 28 showed signs of an ordered atomic arrange-ment. All 28 of these samples were run either on the r-ray diffractometeror the powder camera. On examination of the r-ray patterns, not all ofthese samples were found to be ferrimolybdite. Some samples weretentatively identif ied as complex iron-molybdic acid which had crystal-lized.
Among the samples produced synthetically, two crystall ized entirelywith the optical and structural characteristics of ferrimolybdite (prepara-tions 8W and 20W).
8W and 20W are both l ight-yellow powders. In plane polarized l ight,8W is yellow-green. The interior of this sample does not display geo-metrical indications of crystals. With crossed nicols, however, small
birefringent needle-shaped crystals, 0.01 mm in length, are visible withinthe anhedral mass. Under a magnification of 360 X, these needles displaybirefringence of the 2nd order with extinction parallel to crystal length.Such optical features were reported by Carrobi.
Sample number 20W shows crystallinity in plane polarized light, withcrystal outlines visible without the benefit of crossed nicols. Undercrossed nicols, the sample appears as a mat of intergrown fibers, in apilotaxitic relationship. The average length of these needles is 0.3 mm,with some crystals nearly 1.0 mm long. The birefringence is upper firstorder with extinction parallel to the length of the crystal.
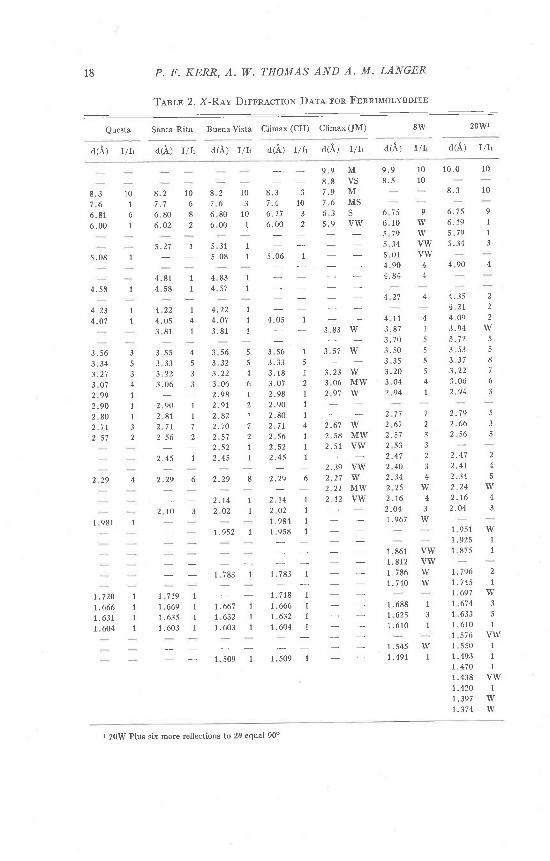
The first sample to be run on the powder camera was 8W and severalphotos were taken. Secondary fluorescence of iron in the sample wasreduced by using sheet aluminum filters, and the optimum exposure timefor best reflection resolution was established. The resulting patterns showmore reflections than naturally occurring ferimolybdite (Table 2).
One powder photograph of 8W (Table 2, Column 6) revealed 38reflections in 8.5 hours with a single sheet of aluminum foil as a filter.An r-ray photograph of 20W produced 49 reflections. This was takenwith a double layer of aluminum foil as a filter and exposed for 7.0 hours.
TabIe 2 shows reflections obtained from four carefully separated fer-rimolybdites; Questa, New Mexico, Santa Rita, Arizona, Buena Vista,Colorado, and Climax, Colorado. The four reference localities are in-cluded since a considerable range both in position and intensity has beenobserved in r-ray reflections of natural ferrimolybdite. Spacings at9.9-10.0o occur in fully hydrated material, but may be otherwise absent.
No. 22W was prepared in sufficient quantity for chemical analysisfollowing the procedure for 20W, and was analyzed by Mr. R. H.Maurer, Climax Molybdenum Corporation Detroit Laboratory asfollows:
Cnrrrrcnl ANer,vsrs or SyNrurrrc Fnnnrnol-vsorrr, (22W)
Total water was determined by loss on ignition at 500o C. This prob-ably includes some adsorbed water and is therefore in excess of the postu-lated octahydrate state. The per cent of molybdic oxide per 100 per cent
20 P. F. KERR. A. W. THOMAS AND A. M. LANGER
of sample is in general agreement with analyses from the l iterature while
the per cent of ferric oxide is low.The r-ray data for 22W agree with data for natural ferrimolybdites.
The range from a molecular proportion of 1:3 FezOa:MoOa to a ratio of
l:4 :rrray not radically change the structure. It is possible the Fe:Mo
oxide ratio is not stoichiometric at 1:3, and may range within the l imits
Palache et aI. (195t) have suggested that the range in the indices of refraction is caused
by differences in water content. Present chemical analyses show possible ranges in Mo:Fe
ratio which may also alter optical properties. Natural ferrimolybdite crystals from Climax
exhibit the following optical characteristics.Pleochroism: X and Y clear. Z ash-gray to canary-yellow or olive-green. r(v Crystals
are length slow (Z), with Z as the direction of elongation. Absorption is strongest parallel
to Z. Extinction is parallel.I The above optical properties for natural ferrimolybdite lrom Climax, Colorado were
determined by Mr. Carl Hott.
DrrreneNtral Trrenual ANar,vsrs
Both schaller (1907) and carrobi (1930) made dehydration studies of ferrimolybdite
as follows:
Temperature o CSchaller Remaining
H:O (1907)Carrobi Remaining
HrO (1930)
2578
110t25
180-185200250
7 . 5not determined
l . J
1 . 00 . 5
less 0 .5not determined
8 . 04 . O3 0
not determined2 . 11 . 0
less 1 .0
FERRIMOLYBDITE 2T
The two studies are basically similar, Up to one-half the water ofcrystall ization is lost at temperatures between 25o C. and 78o C. At atemperature of 110" C., the "normal" temperature for driving off non-structural water, the structure is nearly dehydrated. The mineral maybe further dehydrated in the temperature range 200-250o C., where itapparently becomes anhydrous.
Golding et al.. (7960) found that ferrimolybdite dehydrated at tempera-tures as low as 50o C. In the current study the thermal history of ferri-molybdite was examined by differential thermal analysis (DTA). Thereactions on the curve for natural ferrimolybdite from Buena Vista,Colorado, (Fig. 1) are tabulated at the top of the next page.
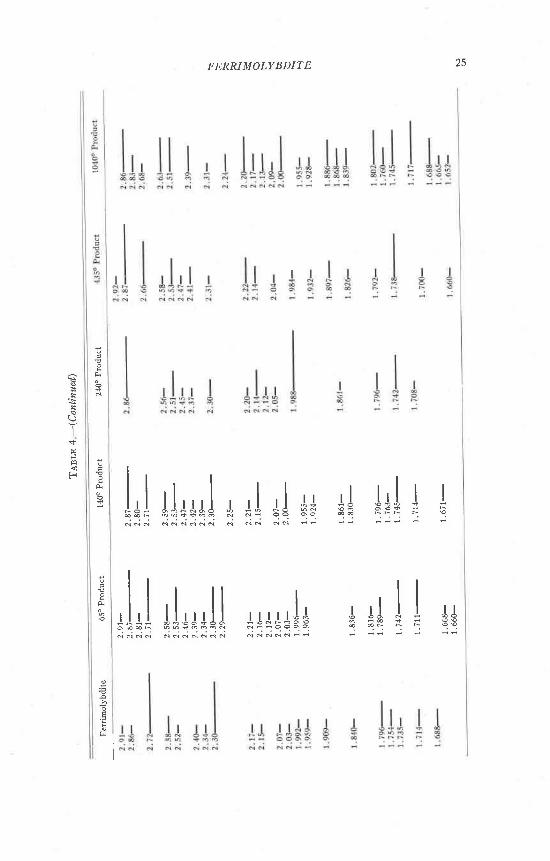
The x-ray data are shown in Table 4. In general, the above reactionsfit the dehydration data described by Schaller and Carrobi. The firstendothermic peak at 40o C. may be questionable, but it agrees approxi-mately with the observations of Golding, et al. (1960). The amount ofdehydration is probably small, since the physical characteristics, colorand the r-ray pattern, of the 65" C. product and the natural unheatedmaterial are quite similar.
DEGREES CENTIGRADE
o m 200 300 zloo 500 600 700 8oo 90 tooo
EXOTHERMIC
BUEIA VTSTA
. P R O O U C T X . R A Y E D
uo{
tgtt o
385 :
EI{DOTHERMIC
c
SYNTHETIC
Frc. 1. Difierential thermal curves of natural and svnthetic ferrimolybdite.
The material produced at 140" C., above the 110o endothermic peak,resembles the 65o C. material structurally, but color indicates a physical
change.The dehydration peak at 165o C. represents a major structural
change, as shown by a pronounced change in color as well as the #-raypattern of the material formed 240" C. At this temperature, the normal
baseline is regained after the reaction. The physical changes support the
dehydration data and indicate the formation of the anhydrous ferri-molybdite phase in this temperature range.
At 365' C. a new structural phase is developed. The material resem-bles physically that formed above the dehydration peak at 165" C., butin the higher temperature product, the lines are more numerous andintense, indicating complete removal of residual water and the formationof Fe-Mo oxide.
The material formed at 1040o C. is similar in structure and color tothe 435o C. material, but new reflections appear in the smaller d-spacingarea. This is probably the end-product of the dehydrated material.
Figure 1 represents the difierential thermal curve for synthetic ferri-
molybdite No. 22W. The reaction types and temperature ranges are
similar to the natural material. Reactions 2 and 3 centered at 110o C.for the synthetic material, were recorded as a single reaction in thenatural material. Since this sample shows abundant fine-grained, pure
material, which would yield a sensitive reaction, this curve probably
represents the actual dehydration. The major peaks at 185o C. and
385' C. are slightly higher than for the natural material, but the overallcomparison is satisfactory. It should also be noted that the dehydration
of the synthetic material begins at 50" C., as described in the literature.
INlnanBn SpBcrnoscopv
Infrared curves were run to ascertain the type or types of water
bonding in ferrimolybdite, the effect of increasing temperatures on the
30 40901 110
1501 165365' 375950 960
58OJ
585 1
7 l
FERRIMOLYBDITT,
rate of water loss from the structure, and the ultimate effect of increasedtemperature on the ferrimolybdite structure.
The instrument used was a Pekin-Elmer Model 21 Split-Beam Infra-red Spectrophotometer with a NaCI prism (Wright and Herscher,1947).Recordings were made at the following settings: resolution 927, gain5.5, speed 5.5 and pen speed 11.00. All phases were solid. The runningtime for each curve was approximately 15 minutes. The ferrimolybditeused for DTA and the products formed at 65," 140", 240",435o and 1045oC. were used for infrared curves. The preparation of samples followedprocedures as outl ined by Geise (1961).
RexcBs ol AnsonpuoN oF WerBn MorBcurBS
Absorption of infrared radiation at specific wavelengths by bondedwater molecules, II2O, and the unbonded hydroxyl groups, (OH), yieldspectral bands which have been studied extensively by organic chemists(Hunt et a|.,1959), and the positions of these absorption peaks on infraredspectrographs are well known. Hydroxyl groups, (OH), may absorbanywhere in the wavelength interval 2.7 to 3.1 microns. The degree ofhydrogen bonding of hydroxyl groups with each other, with other oxygenatoms in the structure, structural complexity, and (OH) orientation areimportant factors which determine the peak position. Absorption ofindependent (OH) groups, monomeric groups, are in the theoreticallycalculated 2.75 micron area. trncrease of hydrogen atoms sharing betweenadjacent structural oxygen atoms, or from oxygen atoms from other(OH) groups produces an absorption in the 2.85 micron area. These aredimeric groups. If adjacent (OH) groups share a hydrogen atom theyabsorb radiation at 2.95 microns. These are polymeric groups. (Kellerand Picket t , 1949, p. 861) .
Water, HzO, absorbs strongly in the 3.0 micron area, Iess strongly in4.5 micron area, and again strongly in the 6.0 to 6.2 micron area. Hydroxylpeaks in the 3.0 micron area are narrow and well defined, whereas theH2O peaks are broad and cover a much greater area. The 9.0 to 15.5micron region of the infrared spectrographs is a reflection of the iron andmolybdenum oxide adsorption. Data appear to be lacking in the l itera-ture concerning the importance of metall ic oxide spectra of this type.However, qualitative deductions indicate that in crystals containingcomplex molecules, the internal vibrations caused by the heat from theinfrared radiation are characteristic of the molecules involved.
Three separate determinations of the natural ferrimolybdite infraredspectrum were made to confirm the reproducibility of a single sample onsuccessive determinations. The ferrimolybdite spectra in this micronrange and the large absorption peak indicate HzO in the mineral. Aslisht shift off the 2.97 micron water maximum results because of the
P, F. KERR, A. W. TIIOMAS AND A. M, LANGER
I
o N t s o < d + o o e o c o e
+ + o o o c o
o 6 @ h 6 I h 6 S + $ + + O O S O O O
o € € F € € € + + + < + + < o o o o o o c o o q
6 € r € € b b $ s 3 $ 9 0 Q O 9 0 0 0
II:
5
a!
!
24
@FOp
o
H
F
z
ts
trr.l
:c
&
ts
il.
x<1
ti
25FI':RRIMOLYBDII'E
l r r l
I*l ll+*rl r rl ll ** *l lll I I; ; ; . ; . ; . i i . i . i . i . i d . i . i ' ' ; J J ' ' ; t J j ' ' i J
I '
-l-l ll*,*ll rr{rll* * sl I I *sl : : : : : l : : : : . i ̂ ; d . i . ; r J * . ; . i ' i - i - ; - i
!
E
d
.s()I
Fr
P. F. KERR, A. W. THOMAS AND A. M. LANGER26
l lt l
" IJJ JJJ ] I€ D + : O r 9 b
* -i * *' ..i -..i ..; ,.;
I
JlJl l l l , t r-r r.r. lrr J r Jq q D i l ; ? ! ? s $ s \ s x t R n :J J J - ; J _ ; J . . . i i J , _ . ; . . ; - :
. tt lt t i l t l3 g $ , 9 R :" : i ' l
It ll l l{${5 $
l t
l l r l l l lr l lr '1,r,,1,E;E 3$r $ $$i* srsBi**S-i,..;.. i ,.. i J...; J -; J J _i _;;; .;.; _;: -;
r l
I
t l . l llrrrrl l l r lr rJqqBB ; ; q$ B Fs R RJ _ ; - . . ; , . ; - i - . : _ ; _ . i _ . i , . ; , . i - ;
l l l lJ rrrr"r rurB B ; G ; 5 i s [ E H X R pJ *'; ".i ..i -i ,.i _i ..i J .i..:,.; -i
JIJ JO N
" l : - :
E
!
I
Q
I
d
F
FERRIMOLYBDITE 27
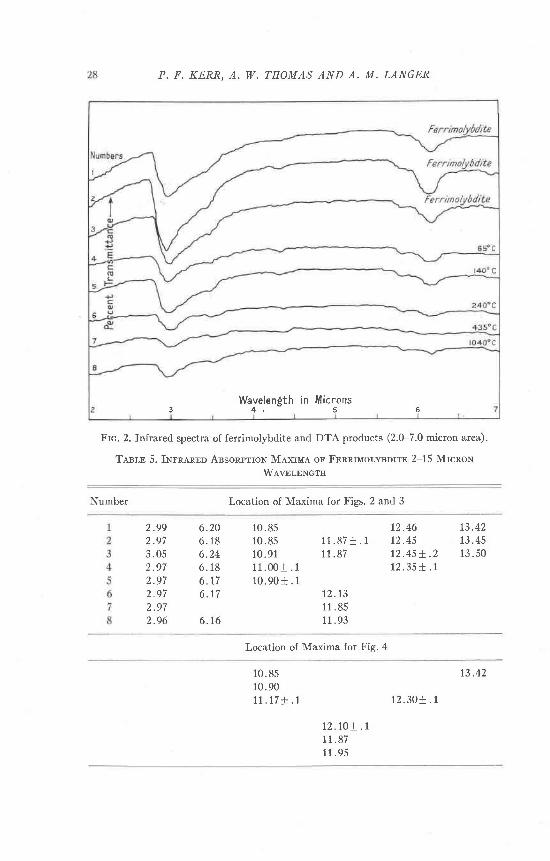
effect of cation attraction and the water molecule in the structure; Nedaand Roy (1956 p. 931) have shown that the water molecule may bebroadly centered around the 3.0 micron region rather than beingcontained at a single wavelength (Fig. 2).
A secondary water peak, centered at 6.2 mictons, is a harmonic func-tion of the primary peak. fts presence confirms the indentif ication ofHzO. Small water peaks are also present in the 4.5 micron area.
Spectrum number 4, of the 65' C. DTA product, has a water absorp-tion peak at 3.0 microns which has diminished in amplitude from theunheated material. A decrease in peak area is also evident. A similarchange is observed in the harmonic peak in the 6 micron area. Loss ofwater from the structure is apparent since identical sample sizes wereused.
Spectrum number 5, of the 140" C. DTA product, is similar to number4. A slight increase in primary peak area may be caused by an increasein sample, but the harmonic peak at 6.2 microns is identical. Loss ofwater, as contrasted to the original mineral, is evident.
Spectra 6,7 ,8, indicate complete dehydration. The small primary waterpeaks are attributed to adsorbed water in the sample and the KBrmatrix. Both the negligible harmonic peak, and the uniformity of theprimary peaks in these spectra, indicate the presence of adsorbed waterindependent of mineral structure.
Samples are marked as in Fig. 2. Absorption spectra for the 7.0-9.0micron wavelength region have been eliminated because of the absence ofabsorption reactions. The "pip" at 10 microns is an internal checkpointfor the spectrophotometer.
The first three spectra represent unheated ferrimolybdite. Absorptionpeaks are located at 10.85, 1I.80, 12.46, and 13.50 microns (Table 5).
Spectrum 4 displays a change in the absorption characteristics fromunheated ferrimolybdite. Broad, i l l-defined, maxima are discernible inthe 10.85 and 12.40 micron areas.
Spectrum 5 displays an absorption pattern which corresponds to thepreceding sample 4, but shows better definit ion at 10.85 and 12.40microns.
Spectra represented by curves 6, 7, 8, indicate the evolution of a newabsorption pattern. The pattern comprises a change from a series ofpeaks distributed in the upper micron interval, to a single, well-definedtrough in the 11.5-12.0 micron area. The highest temperature sampledisplays evidence of a split of the single peak into two peaks. The init ialchange to the new absnrption pattern occurs in the material heated to240" C., but the structural development is not completed unti l the 435" C.sample.
P. F. KERR, A. W. THOMAS AND A. M. LANGER
Fro. 2. Infrared spectra of ferrimolybdite and DTA products (2.O-7.O micron area).
Tasln 5. INrnerup Ansonprron Mexrun or FpnmMolsorro 2-15 MrcnoN
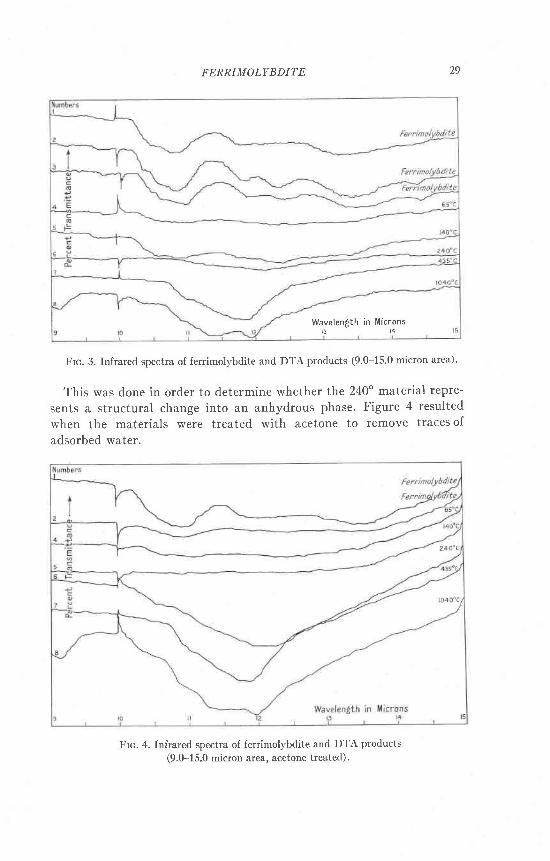
Frc. 3. Infrared spectra of ferrimol)'bdite and DTA products (9'0-15'0 micron area)'
This was done in order to determine whether the 240" material repre-
sents a structural change into an anhydrous phase. Figure 4 resulted
when the materials were treated with acetone to remove traces of
adsorbed water.
29
Wavelenf,th in Micronst 3 1 4
Frc. 4. Infrared spectra of(9.0-15,0 micron
ferrimolybdite and DTA products
area. acetone treated).
30 P. F. KERR, A, W. TIIOMAS AND A. M. LANGDR
4 5W A V E L E N G T H I N M I C R O N S
f O t t t Z t 3 t 4 t 5W A V E L E N C T H I N M I C R O N S
Frc. 5. Infrared absorption of synthetic ferrimolybdite.
only two of the ferrimolybdite patterns are shown. The 240" materialshows the effects of dehydration. The 240o product is structuraily i ike thedehydrated material.
Figure 5 shows infrared spectra of synthetic ferrimolybdite No. 22W.In all aspects it is l ike the natural material.
Sulrlranv arqo CoNclusroNs
A study of the l iterature reveals a range in chemical composition,physical and optical properties of ferrimolybdite. Examination of ther-ray patterns reflects these differences. rt has been suggested that arange in water content may in part account for these discrepencies.Recent Australian workers have found that ferrimolybdite dehydratesat relatively low temperatures on the order of 50o c., temperatureswhich may occasionally prevail in desert occurrences.
The synthesis of ferrimolybdite has been substantiated by r-ray,chemical, and physical comparison with the natural mineral. An apparentcrit ical factor in synthesis is to allow the preparation to remain im-mersed in water, with occasional heating and agitation, to permit thecompound to hydrate fully. Temperatures above 60" C. appeared toreduce the crystallization rate. A comparison of crystal size and abund-ance in laboratory preparations revealed that lower temperature solu-tions produced the most abundant and largest crystals.
uz
zz
E
F=UoEEc
U
z
tzEF
zUo
Uc
FEKRIMOLYBDITE 3I
Differential thermai analysis of natural ferrimolybdite has shown it
to begin to dehydrate at temperatures as low as 50o C. A major dehydra-
tion peak begins as low as 90o C. Synthetic ferrimolybdite dehydrates
at 50o C.Synthesis of fully hydrated ferrimolybdite under conditions of atmos-
pheric temperature and pressure indicates stability in a supergene
environment. The distribution, mineial association and occurrence of
ferrimolybdite at Climax, Colorado support this origin.It is proposed that the formula Fer(MoOr)3'nHrO be used unti l a
stable hydrated phase of ferrimolybdite is better established. The low
temperature of stability, and the ability to dehydrate and rehydrate at
50o C., casts some doubt as to whether a low temperature phase actually
exists. Furthermore, a range in Mo/Fe ratio between the l imits of 1:3
and 1:4 is probable, so that the empirical formula may further change.
The water in ferrimolybdite is bonded as HzO. The existence of the
OH group has not been detected, but its existence in the structure is
possible, in which case the absorption peaks would be included in the
3.0 micron area. The hydroxyl bonding would necessarily be dimeric or
polymeric. Monomeric groups would have been detected as a separate
absorption.The progressive heating of ferrimolybdite which produces a dehydrated
structure may be traced by comparison of a series of infrared spectra.
The dehydration of ferrimolybdite in the 40-50' C. range is reflected
in the infrared spectrum of material heated to 65o C. Completely de-
hydrated material results on heating to 240" C., as shown by the high
wavelength absorption and by the diminished harmonic water peaks.
This change in the higher wavelength area rrray be caused by a redistribu-
tion of the bonding charges after water is removed from the structure.
Increased bonding of silicon cations and oxygen anions from nesosilicate
to tektosilicate structure produces an effect whereby the absorption of
radiation evolves from a series of peaks in the higher micron range, to a
narrow, well-defined, single maximum in the moderate micron range
(Launer, 1952). This may be anaolgous to the ferrimolybdite transforma-
tion when dehydration is completed.
RrlrnrNcrs
C,mnonr, G. (1927) Sulla ferrimolybdite di Bivongi (Calabria)' Rend'. Accad. Sci" Fis'
Mat. NaPoI i ,33 ' 139.-- (1930) Richerche sul molibato ferrico idrate' Napol,i Inst. Chim. R. Unizt' 8, 169-
I lv .
f)urNn, J. A. eNo P. F. Knnn (1961) Difierential thermal analysis of galena and clausthat-
Iite. Am. Mineral'. 46, l-ll.
Gnrsr, R. (1969) The infrared absorption spectra of some hydrated borate minerals.
Thesis, Geology, Columbia University.
32 P. F. KERR, A. W. THOMAS AND A. M. LANGER
GororNc, H. G., P. Bavr.rss, aNo N. TnurueN (1960) Dehydration and rehydration offerrimolybdite from Lowther, New South Wales. Am Mineral.45, 1111-1113.
Gurr-o, F. N. (1907) Composition of molybdite from Arizona. Am. Jour. 9ci.23,455-456.Hunr, J. M., M. P. Wrsnrnnl, ann L. C. Boxneu (1950) Infrared absorption spectra of
minerals and other inorganic compounds. Anal. Chetnl. 22, 1478-1497.
Joxr,s, L. P. ano A. A. Mrr.Na (1954) Ferrimolybdite. Aust. four. Sci. L7,100-101.Knlt.nn, R., eNo W. Prcxrr:r (1949) Absorption of infrared radiation by powdered silica
minerals. Am. Mineral. 44, 855-868.Lnnsam, E. S. .tNl H. BrnueN (1934) The microscopic determination of the non-opaque
minerals. U. S. Geol. Surv. Bwll.848, 133, 135, 138.Leunnt, P. J. (1952) Regularities in the infrared absorption spectra of silicate minerals.
Am. Mineral. 37, 764-784.Nrne, T. ero R. Rov (1956) OH-F exchange in flourine phlogopite. Am. Minerol. 41,
929431.Pera.cur, C., H. BrnulN lNo C. FnoNonr. (1951) The System of Mineralogy, 7th ed.
John Wiley & Sons, N. Y., v. 2,[email protected], P (1914) Beilage z.d. mater. z. geol. Baues d. Russ. Reichs. Festschrift V. I.
Vernadsky, Moscolv.Scner,r.nn, W. T. (1907) The chemical composition of molybdic ocher. Am. Jour. Sci.23,
297 303.SrwsoN, E. S. (1926) Contributions to the mineralogy of Western Australia. Jota. Roy.
Soc. West. Australia, 12, 57-66.Snrrrr, H. T. (1923) Mineralogical notes. Records Australion Mus. 14, 105-106.Yenosn, N. A. (1955) Mineralogy of the oxidation zone of the Blagodot deposrts. Truno