The NEHRP site class and liquefaction susceptibility mapping for the City of Pocatello were performed by Fugro William Lettis & Associates, Inc. under contract with the Idaho Bureau of Homeland Security. Its content and format may not conform to agency standards.
Transcript
The NEHRP site class and liquefaction susceptibility mapping for
the City of Pocatello were performed by Fugro William Lettis &
Associates, Inc. under contract with the Idaho Bureau of
Homeland Security. Its content and format may not conform to
agency standards.
A member of the Fugro group of companies with offices throughout the world
Pocatello Shear Wave Velocity and P-Wave Mapping: NEHRP Site Response and Liquefaction Susceptibility Mapping for Pocatello, Idaho
Prepared by: Fugro William Lettis & Associates, Inc. 1777 Botelho Drive, Suite 262 Walnut Creek, CA 94596
New site-specific shear wave velocity structure profiles were measured across a representative range of surficial geologic deposits to characterize seismogenic ground shaking hazards in Pocatello, Idaho. Interferometric MASW (IMASW) surface shear wave geophysical survey methods were used to calculate 52 high-resolution shallow shear wave velocity profiles in order to develop empirical relationships between shear wave velocity and lithology, and to produce predictive hazard maps of seismically-induced ground shaking in Pocatello. P-Wave refraction processing methods were used to estimate water table depths for the seismic surveys to produce liquefaction susceptibility maps for Pocatello. 1.1 Purpose This Seismic Survey Data Report presents results of the Fugro Consultants, Inc. (FCL) surface geophysical investigation and resulting liquefaction potential and National Earthquake Hazard Reduction (NEHRP) site classification maps. This study was funded by the Idaho Department of Homeland Security (IDHS) Purchase Orders BH120570, BH120571, and BH130014 in effort to characterize seismic ground shaking and liquefaction hazards within the city limits of Pocatello, Idaho. This investigation develops empirical relationships between subsurface shear wave velocity (Vs) and lithologic properties of surficial geologic units in order to produce predictive microzonation maps of expected shallow surficial response to strong ground motions. Similar empirical relationships between surficial geology and subsurface shear-wave velocity have been used for many years to predict ground motion amplification (e.g. Joyner and Fumal, 1985; Boore et al., 1993; Borcherdt, 1994; Holzer et al., 2002, 2005), and shear-wave velocity is a well-accepted and widely used measure of rock or soil conditions for calculating ground motions for soil and rock (e.g., Fumal, 1978; Fumal and Tinsley, 1985; Park and Elrick, 1998). Ground motion prediction equations often require depth-averaged shear-wave velocities to 30 meters depth (Vs30) to estimate Next Generation Attenuation ground shaking parameters (NGA, 2008). Geologic units were correlated into groups that are expected to perform similarly based on the Vs-based NEHRP soil classification criteria. This method has been applied in other recent studies at local (e.g., Clahan et al., 2010, Turner et al., 2010, 2011, 2012; Phillips, 2011, Scott et al., 2006), regional (e.g., Wills et al., 2000; Wills and Clahan, 2006; Louie, 2008; Wills and Guiterrez, 2008), and national (e.g., Petersen et al., 2008) scales. In addition to the NEHRP classification maps, results of this study provide quantitative Vs inputs for future site classification efforts, NGA ground shaking modeling efforts, and calculations of expected amplification factors for Pocatello, Idaho. The degree of seismogenic ground shaking a location will experience at the ground surface is related to the underlying shear-wave velocity (Vs) structure. For example, under seismogenic ground shaking, Holocene-aged unconsolidated alluvial and fluvial deposits are expected to produce strong amplification of ground motions and experience higher peak particle velocities, have higher liquefaction susceptibility, and increased ground shaking relative to older, stiffer soils and bedrock units.
Fifty-two sites were surveyed in June 2012 using phase processing techniques of the recently developed (O’Connell and Turner, 2011) Interferometric Multichannel Analysis of Surface Waves (IMASW) method to measure shear-wave velocities across a representative range of geologic units. The IMASW method was designed to measure site-specific line-averaged shear-wave velocity (Vs) profiles to a minimum depth of 30 meters (Vs30) although, in general, IMASW surveys resolve shear-wave velocity structure significantly deeper than 30 meters. The resulting line-averaged shear-wave velocity values were calculated for a variety of depths from 5 to 30 meters (Vs5, Vs10, Vs20, and Vs30), the depth zone of influence to most buildings and engineered structures. These Vs values were compiled to develop a characteristic Vs for each major mapped surficial geologic unit (Rogers and Othberg, 1999; Othberg, 2002). These geologic units were subsequently grouped by similar lithologic and Vs characteristics to provide a basis to examine the relationships between lithology and shear wave velocity. P-wave refraction processing methods were applied to image depths to the saturated zone, or water table, at each survey location. These new water table data are combined with existing static water table well data (Welhan and Moore, 2012) to develop predictive seismogenic liquefaction susceptibility maps for Pocatello. Seismic ground shaking behavior of surficial deposits can be understood as an interaction between the physical characteristics of the material: age of the deposit, the degree of lithification, grain size, compaction, the intrinsic Vs of the material, shear and bulk moduli, and the level of water saturation. The 52 seismic surveys provide new Vs and water saturation data. Further analyses in this investigation combine these new data with existing geologic mapping and associated lithologic data, water saturation data, and publically available ArcGIS geodatabase files. The investigation was implemented in a phased approach. Site selections and land permissions were followed by a field campaign to acquire new site-specific shear-wave and P-wave velocity data at 52 locations in Pocatello from June 18-23rd, 2012 (Figure 1). The 52 locations were chosen to obtain multiple measurements across a representative range of each surficial geologic deposit in Pocatello (Figure 2). 1.2 Acronyms and Abbreviations AWD Accelerated Weight Drop FCL Fugro Consultants Incorporated IBC International Building Code IDHS Idaho Department of Homeland Security IGS Idaho Geological Survey IMASW Interferometric Multichannel Analysis of Surface Waves NEHRP National Earthquake Hazard Reduction Program P-f Slowness-frequency P-wave Primary (acoustic) Wave Vs Shear Wave Velocity WET Wavepath Eikonal Traveltime
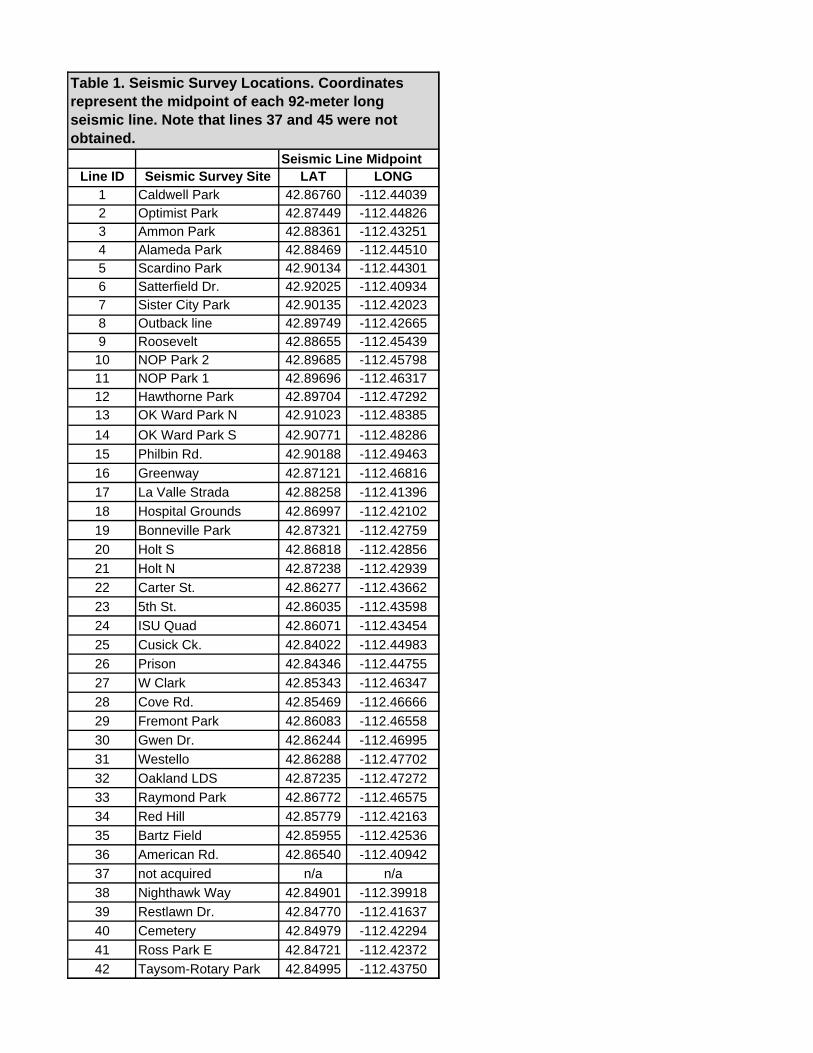
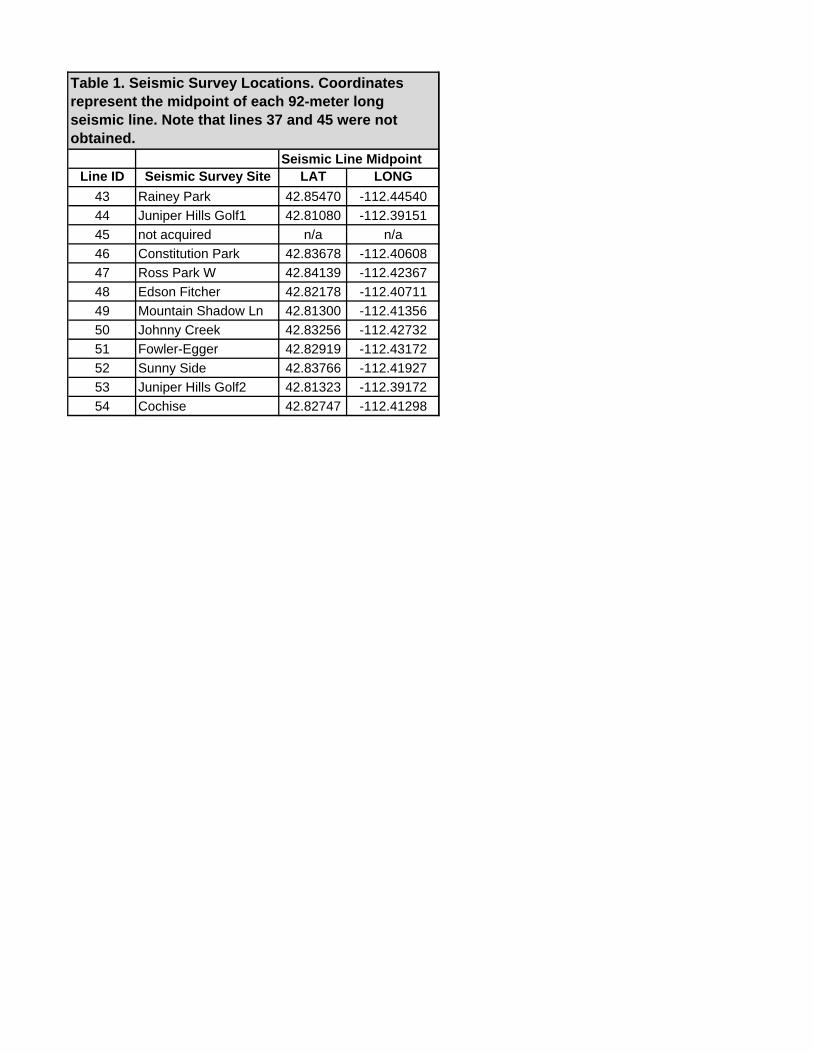
Thirty to forty seismic survey sites were proposed prior to field activities. In an initial desktop study, 60 potential sites were identified using a combination of Google Earth, geologic maps, and land ownership parcel data available on the Bannock County website. 60 sites were initially targeted to ensure at least 40 sites would be available for seismic surveying, and to have extra sites in case seismic surveys were acquired faster than anticipated during the 6-day field campaign. The selection criteria for viable sites were: 1) obtain sufficient coverage of each surficial geologic unit as functions of area and anthropogenic development, 2) have sufficient open space to conduct the 92-meter long surveys, and 3) have access and landowner permission. 2.1 Seismic Survey Locations Of the 60 potential seismic survey sites identified in the desktop study, the Permission Coordinator obtained permission to 54 sites prior to the start of field work. 52 seismic surveys were acquired during the field campaign. Lines 37 and 45 were not acquired due to logistical factors. To avoid line naming and seismic data management complications, no changes were made to the original 54 proposed line numbers. Data tables and maps list Lines 1 through 54, with “not acquired” and “n/a” for lines 37 and 45. Footnotes addressing this point are provided on the maps and figures. A 24-channel seismic array with 4 meter geophone spacing (92 meter overall line length) was deployed at each of the 52 sites. The resulting post-processed Vs-depth profiles depict the average shear wave velocity measurements along the length of the 92 meter array, and the resulting calculated Vs value is representative of the midpoint of each line. Line locations are provided in Table 1. 2.2 IMASW: Interferometric Multichannel Analysis of Surface Waves The primary objectives of the IMASW investigations are to estimate vertical variations in shallow shear-wave velocity structure averaged across the lateral dimensions of each individual survey line and to estimate depth-averaged shear-wave velocities along each survey alignment (O’Connell and Turner, 2011). For this investigation, depth-averaged Vs data are calculated at 0.5 meter vertical resolution, and depth-averaged values are calculated for 5 meter (Vs5), 10 meter (Vs10), 20 meter (Vs20), and 30 meter (Vs30) ranges at each of the 52 survey locations. In contrast to borehole seismic surveys, IMASW surface surveys sample a much larger volume of the subsurface, and generate a one-dimensional shear wave velocity profile averaged over the 24-channel 92 meter survey line length; this one-dimensional Vs-depth profile is representative of the midpoint of the line. Table 1 line location coordinates show the midpoint of each survey line. Active-source IMASW acquisition and data processing techniques provides improved depth resolution and depth-uncertainty constraints relative to ReMi and MASW methods (O’Connell and Turner, 2011). MASW (Park, 1999) and ReMi (Louie, 2001), are useful and widely-accepted methods for measuring shallow Vs; IMASW builds upon and improves upon these approaches with bi-directional active sourcing and seismic interferometry methods to improve depth resolution and to delineate the data resolution and depth uncertainties.
In some circumstances the IMASW surveys received sufficient low-frequency surface wave signals to estimate shear-wave velocities to 150-180m depth; these deep Vs-depth profiles are included in Appendix A. These data are of interest to the geoscience community for further interpretation. Sufficient data were obtained for all Pocatello IMASW line profiles to estimate shear-wave velocities to depths substantially greater than 30m. Although uncertainties in shear-wave velocities increase with depth, the Pocatello IMASW data provide well-constrained minimum shear-wave velocities significantly deeper than 30m. Lower shear wave velocity corresponds to increased ground shaking; therefore it is more important to constrain minimum Vs values rather than maximum Vs values to obtain a conservative estimates of ground shaking potential.
2.3 Data Acquisition At each survey location, active-source seismic shot records were recorded with a 92 meter long 24-channel array with 4 meter station spacing using Seistronix EX-6 acquisition equipment and Mark Products L10-A geophones in conjunction with a Digipulse 40 Kg Accelerated Weight Drop (AWD) source. 2 second (sec) records with 2 millisecond (ms) sampling rate were obtained. Typically 4 to 6 shot records were real-time stacked at each source location through the line. Low-quality shot records were not included in the real-time field stacks. Raw data exported from the Siestronix system are in .dat (SEG2) format. 9 source locations were shot through each line; 6 meters off the phone 1 end, at stations 1.5, 4.5, 8.5, 12.5, 16.5, 20.5, 23.5, and 6 meters off the phone 24 end. Shot records, observer’s logs, and GPS data were uploaded and backed up onto FCL servers each evening. FCL conducted daily data quality monitoring to ensure sufficient data were recorded at each site. Raw seismic data and observer’s logs are provided in Appendix G. 2.4 Data Post-Processing 2.4.1 IMASW Phase Slowness-Frequency for Shear Wave-Depth Shear wave data were processed using FCL’s proprietary IMASW v1.2 software. Seistronix 2.48 software was used to convert the .dat (SEG2) files into SEGY format. The SEGY files were read into IMASW v1.2 for all subsequent processing. Phase slowness-frequency (p-f) data were interpreted for each line by bi-directionally stacking each stacked shot record, so all shot records from the line are displayed in a single line-averaged stacked p-f image. Each shot p-f record was then viewed individually, and any bad records that were too noisy or dominated by higher mode or aliased energy were removed from the overall stack to improve p-f dispersion image quality. P-f plots were resized to depict the range of slowness and frequency bandwidth with sufficient data resolution for dispersion interpretation and picking. p-f Rayleigh Wave best-estimate dispersion picks were made in the area of highest data density, with upper bounding uncertainty picks constraining the slowest, or most conservative dispersion interpretation. All p-f dispersion images with best-estimate and uncertainty picks are provided in Appendix A. Seismic illumination from the Digipulse 40 Kg weight drop is of high quality; Rayleigh Wave dispersion is typically saturated in the frequency bandwidth window of interest with relatively narrow slowness ranges of large amplitude at each frequency (approximately 5 to 50 Hz). P-f
dispersion pick inversion sufficiently constrain the subsurface velocity structure, so it was unnecessary to conduct supplementary IMASW processing steps to obtain additional group- and phase-velocity constraints such as calculating Correlation Green’s Functions and estimating group arrival times and group velocities. . The p-f dispersion and uncertainty pick parameters are used in the IMASW v1.2 software Monte Carlo inversion module to evaluate 14,000 possible velocity-depth models over 5 convergent iterations to provide inputs for the final inversion. The 6th final inversion uses these inputs to develop 2000 final models using iterative inversion parameters (O’Connell and Turner, 2011). Results of the final inversion module provide the statistical mean, median, and chi-squared uncertainties for the final 2000 best-fit models. Statistical Vs-depth profiles from the Monte Carlo inversions are output into graphic plots shown in Appendix A, and excel spreadsheet files in digital Appendix C. All Vs-depth data are calculated in 0.5 meter vertical resolution. See Section 6.0 Guide to Appendices for detailed information. 2.4.2 Rayfract P-wave Processing for Depth to Water Table P-wave plots, shown in Appendix B, were generated with Rayfract Software version 3.22. Shot records were imported for each seismic line. First-breaks were picked for each channel on the 24-channel line. Subsequently, the first-break picks were imported into a Wavepath Eikonal Traveltime (WET) smooth tomographic inversion (Shuster and Quintus-Bosz, 1993; Spetzler and Snieder, 2004) with 1-D initial model. Rayfract inversions ran with 20 WET iterations. IDL 8.1 software was used to generate the P-Wave Refraction Vp contour plot and Ray Density plot graphic outputs for each line. The P-wave velocity of water corresponds to approximately 1470 meters/sec. The P-wave and depth-to-water table plots with 1470 m/s contour lines depicting the depth to the water table below ground surface are provided in Appendix B.
3.1 Depth-averaged Shear Wave Velocity Calculations Final Vp-Vs spreadsheets that contain the Vs-depth data and imbedded Vs5, Vs10, Vs20, and Vs30 calculations are provided digitally in Appendix C. The analytical methodology used to determine Vs-depth values for each seismic survey is presented in the International Building Code (2009) Section 1613, Equation 16-40:
sV =
n
i si
i
n
i
i
V
d
d
1
1
Where:
Vsi =The shear wave velocity in meters per second (m/s) di = The thickness of any layer between 0 and 30 meters; in this case thickness is 0.5 m
n
i
id1
= 30 meters for Vs30,
n
i
id1
= 5 meters for Vs5, etc...
3.2 Vs-depth Results
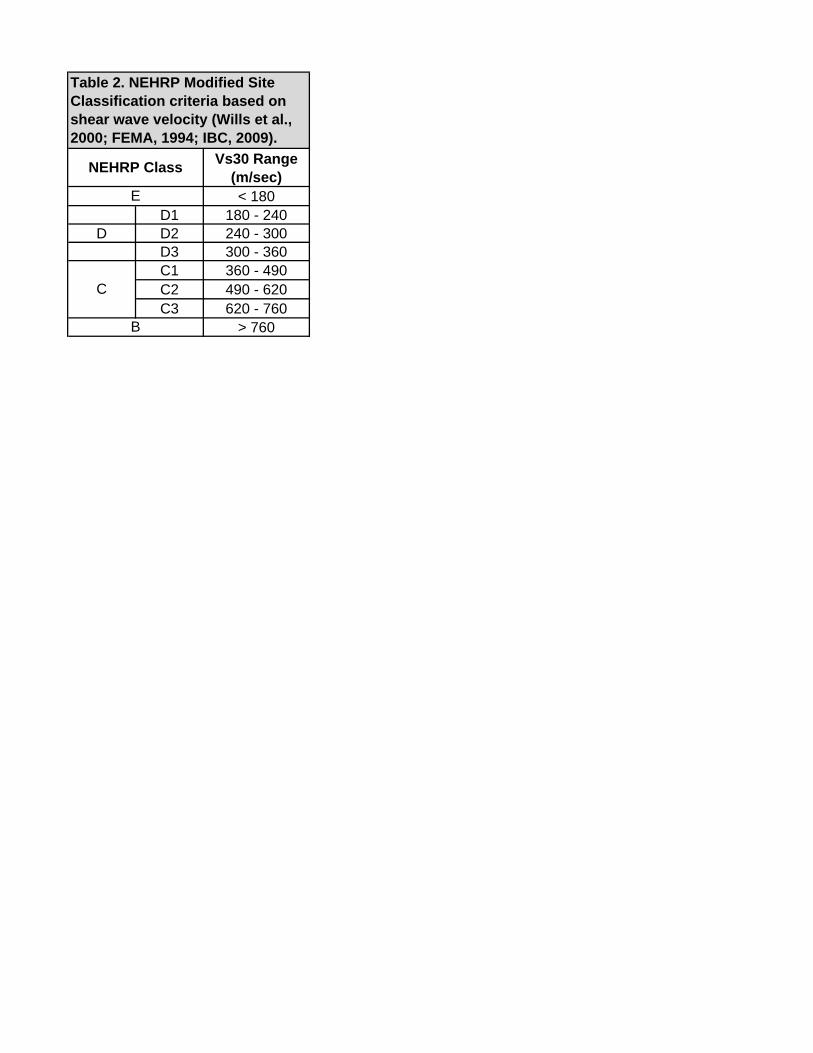
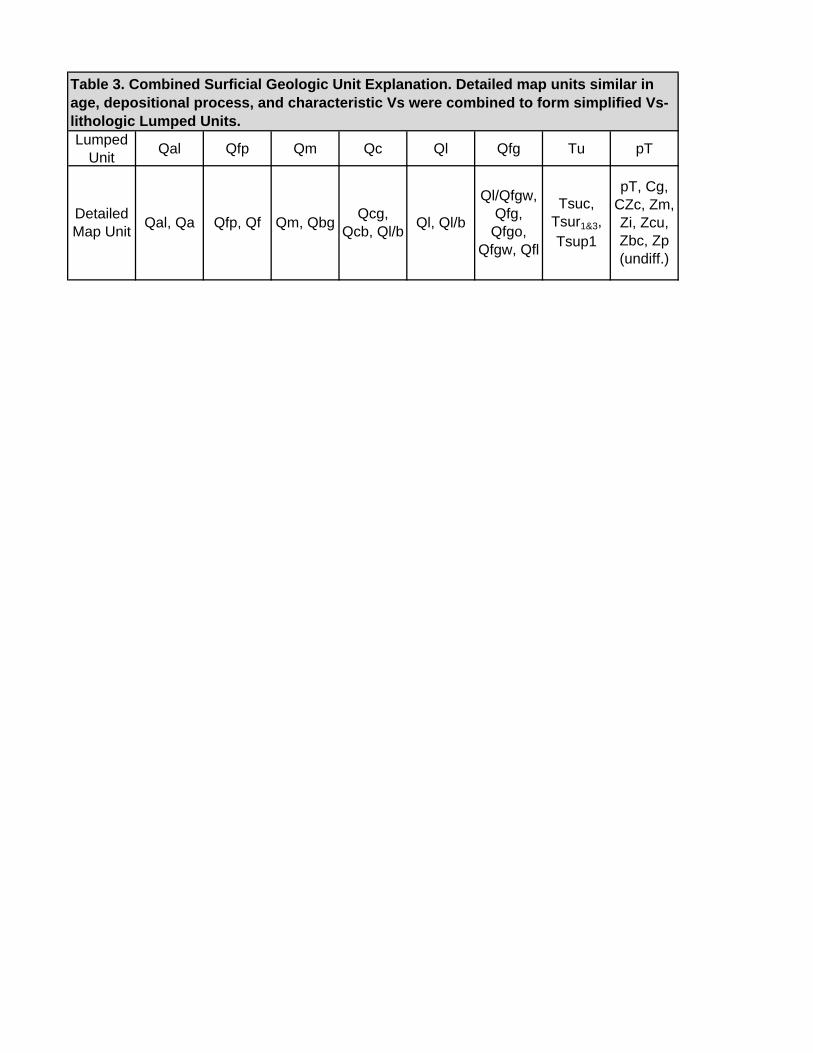
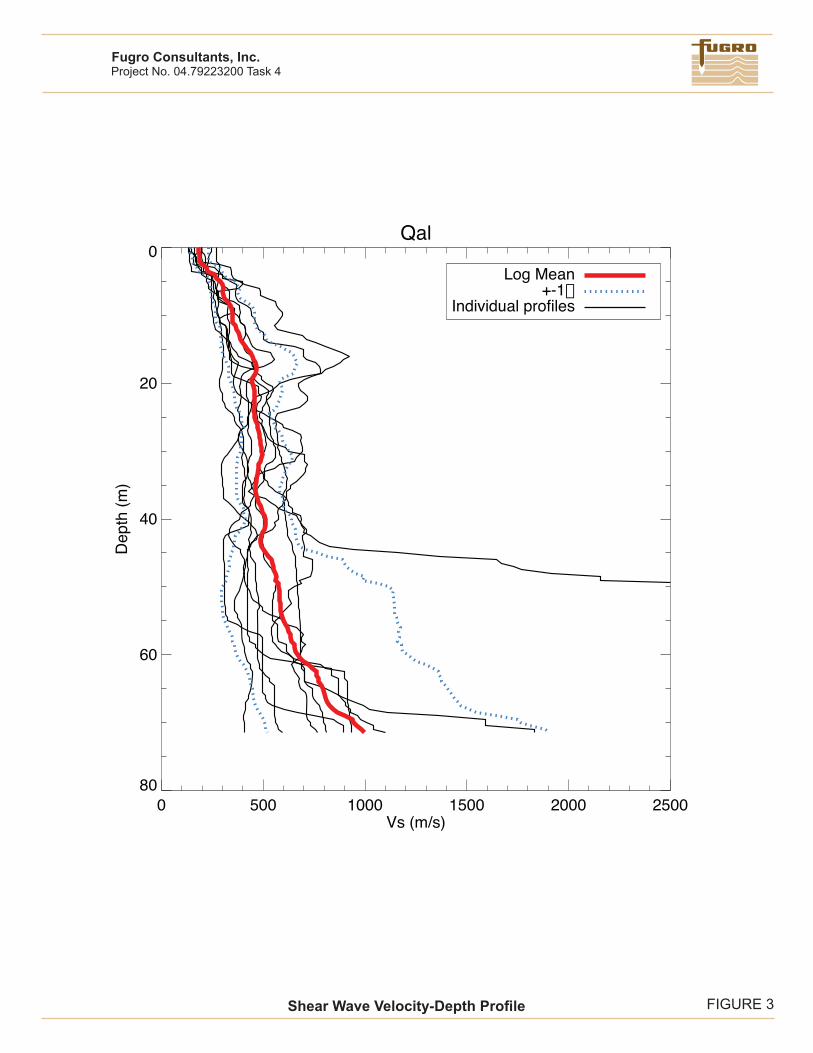
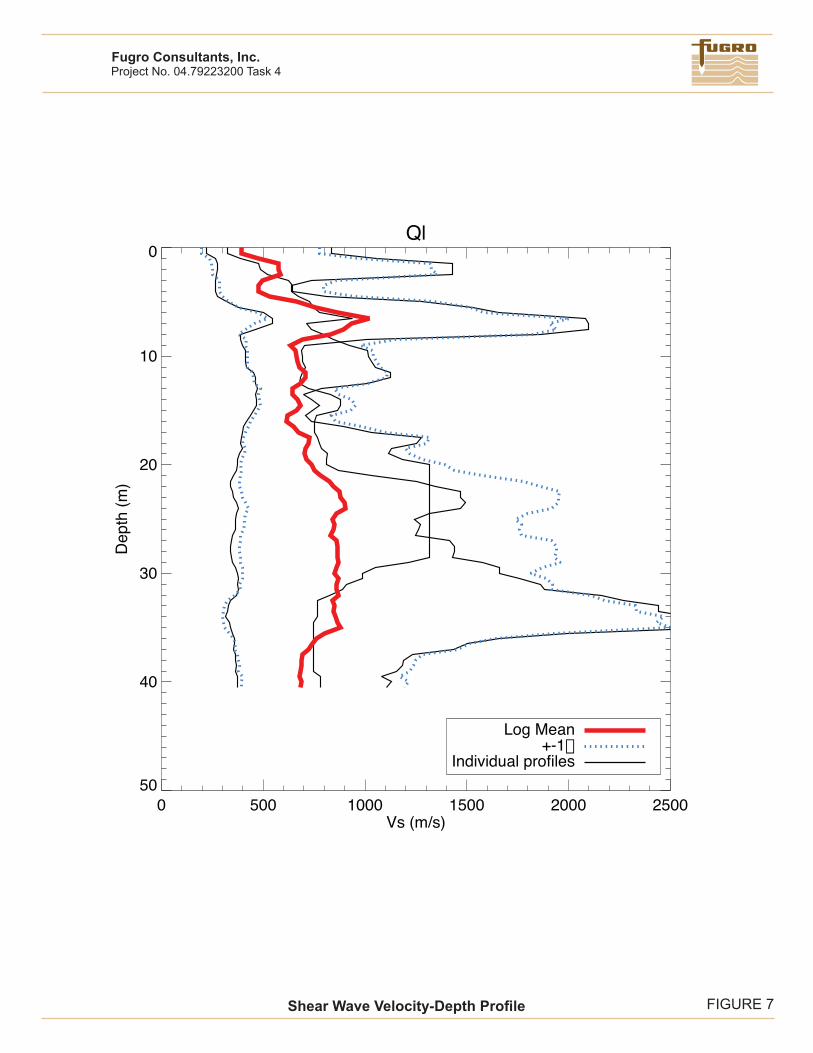
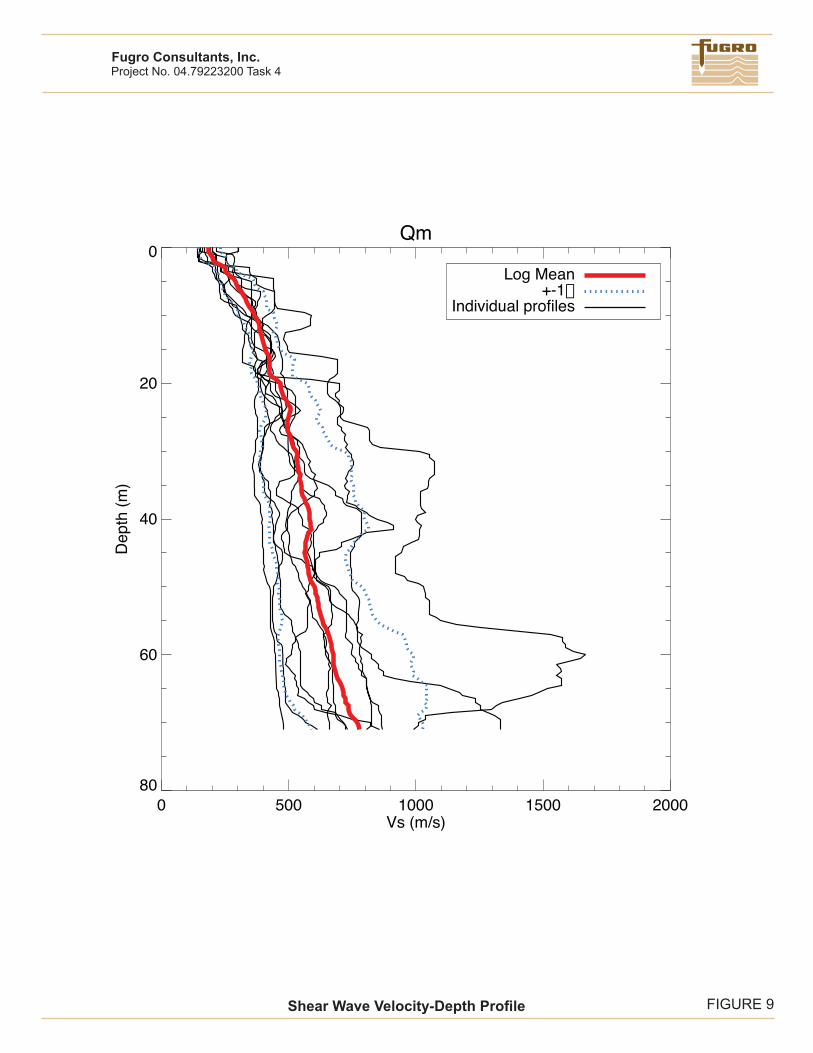
The individual Vs-depth plots presented in Appendix A are grouped by surficial geologic unit are shown in Figures 3 through 9. The figures are grouped and labeled by their NEHRP Site Classification (Table 2) and “lumped,” or combined surficial geologic map unit (Table 3), and in the NEHRP Site Class maps in Appendix E. Highly detailed map units of similar provenance and age were “lumped” into combined surficial geologic units, as detailed in Table 3 and discussed in further detail in Section 4.3. In the IMASW plots in Appendix A, only S-wave velocities are well resolved. P-wave velocities are included in the inversions to avoid introducing a priori biases in estimated S-wave velocity, but P-wave velocities are generally only weakly resolved and are superseded by the P-Wave constraints provided by the P-wave first-arrival picks and 2D P-wave tomography estimates in Appendix B. In some ideal circumstances IMASW surveys received sufficient low frequency surface wave signals to estimate shear wave velocities to 180 m depth. Sufficient data were obtained during this study to calculate shear wave velocities to 30 m for all line profiles, and shallow velocity structure is well constrained at depths <30 m. Typical frequency bandwidth of well resolved phase velocities varies over the frequency range of 2 Hz to 50 Hz, with most IMASW lines obtaining good resolution of phase and group velocities in the 5 Hz to 40 Hz frequency band.
3.3 Vs-Depth Profiles for Surficial Geologic Units Vs-depth profiles organized by surficial geologic unit are shown in Figures 3 (Qal), 4 (Qc), 5 (Qfg), 6 (Qfp), 7 (Ql), 8 (Qls), and 9 (Qm). The surficial geology Vs-depth figures show the individual seismic survey Vs-depth profiles for each geologic unit, and the log-mean composite Vs-depth profile that represents the average Vs-depth plot for each respective geologic unit. These plots are truncated at the minimum depth of data resolution of the profile that had the shallowest maximum depth of resolvable Vs from amongst all the individual profiles included in each geologic unit. Figure 10 compiles the log mean composite for each geologic unit into one figure for side-by-side comparison. The individual Vs-depth plots from each seismic survey line are provided in Appendix A. The Appendix A plots are not depth-truncated and show the maximum depth resolution of each line, although areas with high (yellow) uncertainty should not be used for interpretation. Spreadsheet files containing the source data for the Appendix A P-wave and S-wave plots, that include imbedded IBC Vs-depth calculations of Vs values for this project, are provided in Appendix C as a digital supplement.
The maps generated for this study combine new Vs-depth and P-wave-depth data with existing surficial geologic maps. The NEHRP Site Classification schema (Table 2) is used as the basis for Vs-depth classifications (FEMA, 1994; Wills et al., 2000). This same Site Classification schema is also adopted by the International Code Council (2009), and is included in the International Building Code. The NEHRP site classification Vs-depth mapping techniques and methods applied in this investigation build on previous work funded by USGS NEHRP program in Albuquerque, NM, and the Idaho Department of Homeland Security in Teton County, Idaho (Clahan et al., 2010; Turner et al., 2010, 2011, 2012; Zellman et al. 2010; Phillips, 2011). 4.1 NEHRP Mapping Approach The general velocity structure in Pocatello is clearly demonstrated in Figures 3 through 10, and Appendices A and C. Surficial deposits with slow Vs values (NEHRP Class D, or Vs <360 m/s) are only several meters thick and are underlain by older, faster-Vs geologic unit(s). Five-meter depth-averaged Vs values are noticeably slower than deeper intervals (e.g. Vs10, Vs20, Vs30). Vs increases with depth. This slow-over-fast, or young weakly- or non-lithified soil over older lithified bedrock, phenomenon is common and nearly ubiquitous in the world. This phenomenon in Pocatello is basically obscured in a simple Vs30 map for the study area. Vs30 maps are more appropriate for regional-scale estimates. Displaying these new high resolution site-specific data requires a different approach. We approach this complication by generating a suite of Vs-depth maps to delineate surficial deposits which may experience ground amplification as a function of the underlying Vs-depth structure. Conceptually, a 5-meter thick unconsolidated soil deposit with Vs=100 m/s overlying 25 meters bedrock of Vs=1000 m/s would yield a Vs30 of 850 m/s, and a Vs5 value of 100 m/s. Looking at the Vs30 value, or Vs30 map alone would not accurately delineate the potential for strong ground amplification effects of the 5 meter thick 100 m/s soil. End users can derive more information from the data using a combination of Vs-depth maps, individual Vs-depth profiles for each line, and characteristic values for each unit. Vs values for the surficial deposits in Pocatello are delineated by showing shallower Vs-depth data in the maps provided in Appendix E. The maps include: Surficial Geologic Map, Vs30 NEHRP Site Class Map, Vs20 NEHRP Site Class Map, Vs10 NEHRP Site Class Map, Vs5 NEHRP Site Class Map, Water Table Contour Map, and Liquefaction Susceptibility Map. The maps were compiled in ESRI ArcGIS version 10 with Geographical Information System (GIS) data provided by the City of Pocatello. 4.2 Existing Map Data GIS data files representing the Geologic Map Compilation of the Pocatello 30 x 60 Minute Quadrangle, Idaho (Link and Stanford, 1999) and the Geologic Map Compilation of the Malad City 30 x 60 Quadrangle (Long and Link, 2007) were downloaded from the Idaho Geological
Survey (IGS) and used as the primary map base of the study. The geologic data in these geodatabase files are digitized after more detailed 1:24000 scale mapping. Pocatello is located within the Pocatello 30 x 60 quadrangle and lies across the 42°52'30'' E-W boundary which separates the 1:24000 scale Pocatello North quadrangle from the Pocatello South quadrangle. 1:24000 mapping by Rodgers and Othberg (1999) in the Pocatello South quadrangle and Othberg (2002) in the Pocatello North quadrangle are the primary geologic mapping source used for this study. A shapefile representing the boundary for the City of Pocatello was provided by the City of Pocatello. Using ESRI ArcGIS version 10, the IGS geology files were clipped to the city boundary. The clipped geology file was then modified to reflect map correlations and unit descriptions of the more detailed mapping (1:24,000) by Rodgers and Otheberg (1999) and Othberg (2002). The geologic units displayed in this file were then “Lumped” based on geologic properties to create the surficial geologic map depicted in The Surficial Geologic Map of Pocatello (Appendix E). The Pocatello North and Pocatello South 1:24,000 Topographic maps, and a 10 meter National Elevation Data (NED) Digital Elevation Model (DEM) and equivalent Hillshade image were downloaded (May 2012) from the Idaho State University GIS Center's Web Server (http://giscenter.isu.edu/index.htm). The cached map service 'Topo_10m' was downloaded from the Idaho State University GIS Center's Web Server (http://ags.gis-center.isu.edu/arcgis/services) and used as a base map. This base map uses the IdahoNED_10mHlshd and Idaho_24k_DRG image services to create a textured topographic map. The geodatabase is projected in Universal Transverse Mercator zone 12N and uses the 1983 North American Datum. The correlation and description of map unit sections are after Rodgers and Othberg (1999) and Othberg (2002). 4.3 Development of Vs-Lithologic Lumped Units Detailed map units similar in age, depositional process, grain size, provenance, and characteristic Vs values are combined into characteristic Vs-lithologic units for the NEHRP Site class maps. The areal extent of surficial geologic units was tabulated along with qualitative percentages of human development per surficial geologic unit (Table 4). These results were used to choose relevant seismic survey locations that were evenly dispersed across a representative range of surficial geologic units with a general weighting towards highly populated areas. Table 3 lists which detailed geologic units were lumped together for this study. Units Qal, Qm and Qfg were lumped similarly as Link and Stanford (1999). Most of the surficial units in the Pocatello area had some amount of loess varying from a thick loess mantle, to mixed loess and colluvium, to reworked loess alluvial fans. Bedrock units, comprising pre-Tertiary and Tertiary age units exposed at the surface and/or underlying surficial deposits were delineated within the city boundary and tabulated in Table 7; the underlying bedrock units have characteristic Vs values that effect the Vs10, Vs20, and Vs30 values and corresponding maps. 4.4 NEHRP Site Class Maps of Pocatello
NEHRP site class maps were created to aid Pocatello city planners in seismic hazard mitigation in the event of potential earthquake-induced ground shaking and liquefaction. To characterize the susceptibility of ground shaking during an earthquake, NEHRP classifications were made for surficial geologic units within the city limits of Pocatello. From available geologic maps (Link and Stanford, 1999; Rodgers and Othberg, 1999; Othberg, 2002), detailed surficial unit divisions were lumped into seven simplified surficial units on the basis of similar age, depositional grain size, and provenance (Table 3). Site-specific Vs values organized by surficial unit were classified using the NEHRP/IBC Site Class schema (Table 2). Depth-averaged Vs values were calculated by with the International Building Code calculation shown in Section 2.3 to depths of 5m, 10m, 20m, and 30m and averaged over the respective depths. These individual values for each line 5m, 10m, 20m, and 30m depth intervals were compiled into an Excel database according to the surficial unit at the survey location. For each surficial unit, the individual line values are averaged to develop the characteristic Vs-depth values applied to the map. These averaged characteristic Vs values were then used to correlate surficial units to Vs-based NEHRP classifications. The color-coded NEHRP maps (Vs5, Vs10, Vs20 and Vs30) use the NEHRP site classification criteria. 4.5 Liquefaction Susceptibility and Water Table Contour Maps Liquefaction is the process by which soils and sediments become liquefied and behave as a fluid mass that can experience lateral spreading or downslope movement. Liquefaction can occur when saturated soils and sediments are shaken by ground strong seismogenic ground motions to the point that non-cohesive soils begin flowing, or cohesive soil properties are overcome in weakly-lithified deposits. To map the liquefaction susceptibility of the surficial units underlying Pocatello, new water table depth values were calculated from the P-wave refraction data processed using Rayfract for the 52 seismic survey lines (Appendix B). 43 of the 52 sites produced well-constrained water table depths. Lines that did not constrain the depth to the water table are lines 5, 7, 18, 25, 26, 27, 29, and 51; maximum P-wave velocities resolved in lines 5, 7, 18, 25, 26, 27, and 29 were < 1470 m/s suggesting that the water table was deeper than the maximum depth of resolved P-wave velocities for these lines. These 43 new water table depth values were combined with existing published static water table values from local water wells (Welhan and Moore, 2012) (Appendix D). New water level estimates are made for peak snow melt and runoff season. 191 water well logs from months March-June over the last 50 years from the Idaho Department of Water Resources website (IDWR, 2012) static water measurements are combined with new P-wave refraction water table depth results from the new seismic surveys. A total of 43 (of the 54 surveys) Vs contour models imaged the 1470 m/s contour (Appendix B). The P-wave refraction data correlate well with the spring well log data. The combined water table data were imported into ArcGIS to generate a triangular irregular network (TIN) contour map. The 12m contour defines the area within Liquefaction Susceptibility Class 2 (Moderate) shown on the Water Table Contour Map (Appendix E).
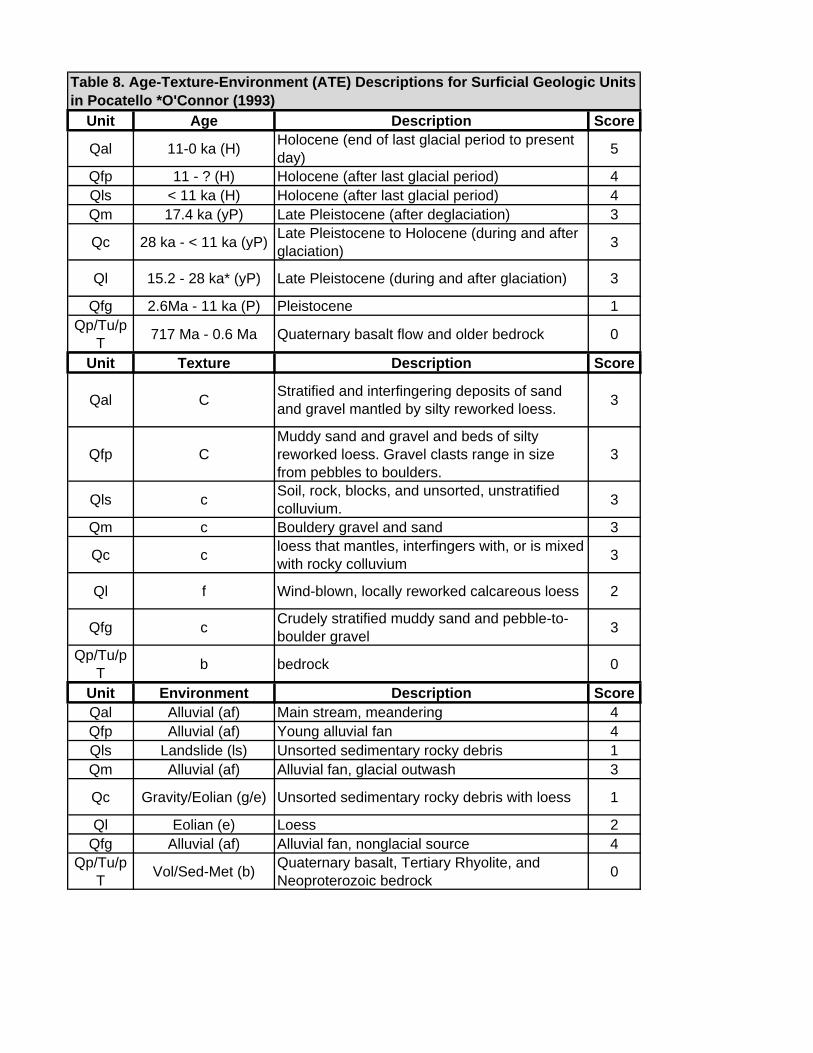
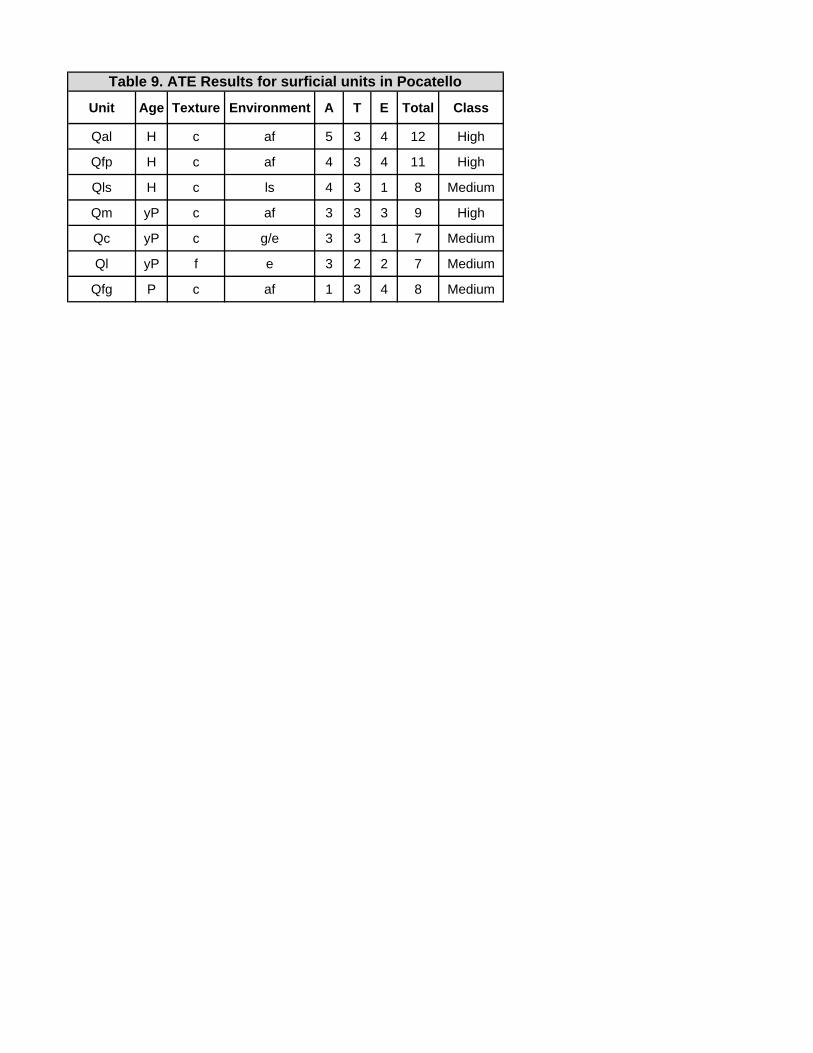
4.5.1 Hydrogeology Discussion The dominant source of water in the Lower Portneuf Valley Aquifer comes from the Lower Portneuf River, flowing NNW from the Portneuf Narrows area towards American Falls Reservoir NW of the Pocatello. The Lower Portneuf River is channelized within concrete containment walls throughout much of the city and no substantial wetlands exist. Water table contours show a water table that dips gently NNW from depths of <6m from its southern extent to depths of >15m in the northwest portion of the city. 4.5.2 Age Texture and Environment (ATE) Classification As previously discussed, liquefaction is a function grain-to-grain cohesion within a body of soil or sediment. Cohesion is a function of age, texture and environment (depositional). Age-Texture-Environment (ATE) classification scheme (Williams, 2011) is applied to the surficial units of Pocatello in Table 8. ATE classification results are shown in Table 9. 4.6 Mapping Discussion and Conclusions The NEHRP site class maps show Vs gradually increasing with depth. In general, Pocatello is underlain by 5m of sediment in NEHRP Class D1 (240-180m/s) and 10m of sediment in Class D1 and Class D2 (300-240m/s). The Vs20 and Vs30 maps show faster velocities in a similar depth-velocity profile underlain by faster bedrock. The water table and liquefaction study suggest that liquefaction susceptibility is, at its highest, only moderate (Class 2), with the highest liquefaction susceptibility potential in the springtime. 4.7 Limitations on the Use of These Maps The NEHRP Site Class maps use Vs30, Vs20, Vs10, and Vs 5 values measured at separated localities to characterize the surficial geologic units. The statistical mean and median Vs-depth interval values measured and calculated for this study are applied to the mapped units as the representative Vs value within Pocatello city limits. Site‐specific geotechnical investigations are required to determine actual ground conditions for specific building sites. This map is intended to be used at a scale of 1:24,000.
This work was funded by the Idaho Department of Homeland Security Purchase Orders BH120570, BH120571, and BH130014. Thanks to Joshua Keeley for coordinating the site selections, land access, seismic surveys, and mapping tasks. Shear wave velocity-depth mapping techniques developed by Jamey Turner and Mark Zellman of Fugro Consultants, Inc. (FCL). Seismic measurements conducted by Bird Seismic Services, Inc. Thanks to Bill Phillips and John Welhan of the Idaho Geologic Survey for comments. We thank the City of Pocatello City Parks Director, Jerry Sepich, and Cemetery Supervisor, Martin Peace, for land access. We thank the following land managers and property owners for permission to measure shear velocity: Alan Egger, Randy Fowler, Karl Holte, Lynn Tyler, Idaho State University, Williams NW Pipeline Corporation, Advantage Plus Fed Credit Union, Women's Correctional Facility, Portneuf Medical Center, Juniper Hills Country Club, Heritage Development, LLC., Bank of Idaho, and the Church of Latter Day Saints. This project compliments existing efforts to collect and analyze site conditions using non-intrusive surface wave analysis (Holzer, et al., 2002; 2005; Scott et al., 2004; 2006; Stephenson et al., 2005; Thelen et al., 2006) and provide data to update the national probabilistic seismic hazard mapping (Wong et al., 2004, Petersen et al., 2008). The NEHRP site classification shallow Vs-depth mapping for multiple depth intervals, and techniques and methods applied in this investigation build on previous work funded by USGS NEHRP program in Albuquerque, NM, and the Idaho Department of Homeland Security in Teton County, Idaho (Clahan et al., 2010; Turner et al., 2010, 2011, 2012; Zellman et al. 2010; Phillips, 2011).
Boore, D.M., Joyner, W.B., and Fumal, T.E., 1993, Estimation of response spectra and peak accelerations from western North American earthquakes: an interim report, U.S. Geological Survey Open-File Report 93-509, 72 p.
Borcherdt, R.D., 1994, Estimates of site-dependent response spectra for design (methodology
and justification): Earthquake Spectra, v. 10, p. 617-654. Clahan, K., Turner, J., Lutz, A., Zellman, M., 2010. Empirical Relationships between Lithology
and Shear Wave Velocity; Revised Digital NEHRP Site Classification Maps for Albuquerque, New Mexico, Program Element 1 U.S. Geological Survey National Earthquake Hazards Program, Final Technical Report Award G09AP00129.
FEMA 222A (1994). NEHRP recommended provisions for the development of seismic
regulations for new buildings, 1994 edition, Part 1 – provisions, Federal Emergency Management Agency, 290 pp.
Fumal, T.E., 1978, Correlations between seismic wave velocities and physical properties of
near-surface geologic materials in the southern San Francisco Bay region, California: U.S. Geological Survey Open-File Report 78-1067.
Fumal, T.E., and Tinsley, J.C., 1985, Mapping shear-wave velocities in near-surface geologic
materials, in Ziony, J.I. (ed.), Evaluating Earthquake Hazards in the Los Angeles Region: An Earth Science Perspective, US Geological Survey Professional Paper 1360, p. 127-150.
Holzer, T.L., Bennett, M.J., Noce, T.E., Padovani, A.C., and Tinsley, J.C., III, 2002, Liquefaction
hazard and shaking amplification maps of Alameda, Berkeley, Emeryville, Oakland, and Piedmont: A digital database: U.S. Geological Survey Open-File Report 02-296, http://geopubs.wr.usgs.gov/open-file/of02-296.
Holzer, T.L., Bennett, M.J., Noce, T.E., and Tinsley, J.C., III, 2005, Shear-wave velocity of
surficial geologic sediments in Northern California: Statistical distributions and depth dependence: Earthquake Spectra, v. 21, no. 1, p. 161-177.
Idaho State University GIS Center's Web Server; http://giscenter.isu.edu/index.htm.
(downloaded May, 2012) Idaho Department of Water Resources,
http://www.idwr.idaho.gov/GeographicInfo/GISdata/wells.htm (downloaded May, 2012) International Code Council (2009). The 2009 International Building Code, equation 16-40, page
342, International Code Council. Joyner, W.B., and Fumal, T.E., 1985, Predictive mapping of earthquake ground motion: U.S.
Geological Survey Professional Paper 1360, p. 203-220.
Link, P.K., and L.R. Stanford, 1999, Geologic map compilation of the Pocatello 30 x 60 minute quadrangle, Idaho: Idaho Geological Survey Technical Report 99-2, scale 1:100,000.
Long, S., and Link, P., 2007, Geologic map compilation of the Malad City 30 x 60 minute
quadrangle: Idaho: Idaho Geological Survey Technical Report, p. 07-1. Louie, J.N., 2001, Faster, better: shear-wave velocity to 100 meters depth from refraction
microtremor arrays: Bulletin of the Seismological Society of America, v. 91, p. 347-364. Louie, J.N., 2008, Shear-wave velocity map for California: Collaborative Research with CGS,
and UNR: Final Technical Report submitted to the U.S. Geological Survey NEHRP, Award 07-HQ-GR-0029, 98 p.
O’Connell, D., Turner, J., "Interferometric Multichannel Analysis of Surface Waves (IMASW)”,
Bulletin Seismological Society of America, Vol. 101, No. 5, pp. 2122-2141, October 2011, doi: 10.1785/0120100230
O’Conner, J.E., 1993, Hydrology, hydraulics, and geomorphology of the Bonneville Flood:
Geological Society of America Special Paper 274, 83 p. Othberg, K.L., 2002, Surficial geologic map of the Michaud and Pocatello North quadrangles,
Bannock and Power Counties, Idaho: Idaho Geological Survey Geologic Map 14, scale 1:24,000.
Park, S., and Elrick, S., 1998, Predictions of shear-wave velocities in southern California using
surface geology, Bulletin of the Seismologic Society of America, v. 88, n. 3, p. 677-685.Aydin, A., 1982, The East Bay Hills, a compressional domain resulting from interaction between the Calaveras and Hayward-Rodgers Creek faults: California Division of Mines and Geology Special Publication 62, p.11-22.
Park, C. B., Miller, R. D., Xia, J., 1999, Multichannel analysis of surface waves, Geophysics 64,
Wesson, R.L., Zeng, Y., Boyd, O.S., Perkins, D.M., Luco, N., Field, E.H., Wills, C.J., and Rukstales, K.S., 2008, Documentation for the 2008 update of the United States national seismic hazard maps: U.S. Geological Survey Open-File Report 2008-1128, 61 p.
Phillips, W.M., 2011, NEHRP Site Class and Liquefaction Susceptibility Maps for Teton County,
Idaho: Idaho Geological Survey, Digital Database - 6, two 1:50,000 scale map plates and downloadable data,http://www.idahogeology.org/Products/reverselook.asp?switch=title&value=NEHRP_Site_Class_and_Liquefaction_Susceptibility_Maps_for_Teton_County,_Idaho
Rodgers, D.W., and Othberg, K.L., 1999, Geologic map of the Pocatello South quadrangle,
Idaho: Idaho Geological Survey Geologic Map 26, scale 1:24,000. Scott, J.B., Clark, M., Rennie, T., Pancha, A., Park, H., and Louie, J.N., 2004, A shallow shear-
wave velocity transect across the Reno, Nevada area basin: Bulletin of the Seismological Society of America, v. 94, no. 6, p. 2,222-2,228.
2006, Shallow shear velocity and seismic microzonation of the urban Las Vegas, Nevada basin: Bulletin of the Seismological Society of America, v. 96, no. 3, p. 1,068-1,077.
Shuster, G.T. and A. Quintus-Bosz, 1993, Wavepath eikonal traveltime inversion: Theory,
Geophysics 58, 1314-1323. Spetzler, J. and R. Snieder, 2004, The Fresnel volume and transmitted waves, Geophysics 69,
Blind shear-wave velocity comparison of ReMi and MASW results with boreholes to 200 m in Santa Clara Valley: implications for earthquake ground motion assessment: Bulletin of the Seismological Society of America, v. 95, no. 6, p. 2,506-2,516.
Thelen, W.A, Clark, M., Lopez, C.T., Loughner, C., Park, H., Scott, J.B., Smith, S.B., Greschke,
R., and Louie, J.N., 2006, A transect of 200 shallow shear velocity profiles across the Los Angeles Basin: Bulletin of the Seismological Society of America, v. 96, no. 3, p. 1,055-1,067.
Velocity Relationships From New IMASW Measurements in Albuquerque, New Mexico: Updated NEHRP Site-Response Classification Maps and Preliminary Seismic Amplification Calculations, Seismological Research Letters, Vol. 82:2.
Turner, J., Clahan, K., Lutz, A., O’Connell, D., Zellman, M., Ortiz, R., 2010. “Empirical Lithology
and Shear-wave Velocity Relationships from 62 Site-specific IMASW measurements: NEHERP Site-Response Classification Maps for Albuquerque, New Mexico,” GSA Abstracts with Programs Vol. 42, No. 5.
Turner, J., Phillips, W., Zellman, M., O’Connell, D., 2012. Shear Wave Velocity-Depth from
IMASW Measurements in Teton County, Idaho: Updated NEHRP Site-Response Classification and Seismic Amplification Maps, Seismological Research Letters, Vol. 83, No. 2.
Turner, J., Zellman, M., O’Connell, D., Chow, C., Angell, M., Hoeft, J., 2012. A Proposed
Methodology to Create Digital Site Response Classification Maps for Trinidad and Tobago Using Existing Geologic Mapping and Proposed New Site- Specific IMASW Shear Wave Velocity Measurements Geological Society of Trinidad and Tobago 5th Geological Conference.
Welhan, A.J., and C. Moore, 2012, An Objective GIS Screening Tool for Rating the Suitability of
Land for Septic-based Development: Idaho Geologic Survey, Staff Reports S-12-1, p. 37.
Wills, C.J., and Clahan, K.B., 2006, Developing a map of geologically defined site-condition
categories for California: Bulletin of the Seismological Society of America, v. 96, no. 4A, p. 1,483-1,501.
Wills, C.J., and Gutierrez, C., 2008, Investigation of geographic rules for improving site-
conditions mapping: Final Technical Report submitted to the U.S. Geological Survey NEHRP, Award 07-HQ-GR-0061, 20 p.
Wills, C.J., Peterson, M., Bryant, W., Reichle, M., Saucedo, J., Tan, S., Taylor, G., Treiman, J.,
2000, A Site Conditions Map for California Based on Geology and Shear-Wave Velocity, Bulletin of the Seismological Society of America, 90, 6B, pp. S187-S208.
Wong, I., Olig, S., Dober, M., Silva, W., Wright, D., Thomas, P., Gregor, N., Sanford, A., Lin, K.,
and Love, D., 2004, Earthquake scenario and probabilistic ground-shaking hazard maps for the Albuquerque-Belen-Santa Fe, New Mexico, corridor: New Mexico Geology, v. 26, no. 1, p. 3-33.
Zellman, M., Turner, J., O’Connell, D., Clahan, K., 2010, “A Comparison of Digital Vs30
Classification Maps for Albuquerque, New Mexico: Results from 62 Site-specific IMASW Vs30 Surface Surveys vs. U.S. Geological Survey topographic-based Vs30 Map Server,” GSA Abstracts with Programs Vol. 42, No. 5.
Appendix A: IMASW Shear Wave Velocity Inversion Results Appendix A contains two pages for each seismic line. Figures A1 and A2 correspond to Line_1_Caldwell, Figures A3 and A4 correspond with Line_2_Optimist, and so on. These plots are provided as supporting data used for the NEHRP and liquefaction maps, and should be made available for geoscientists who would like to make additional geologic interpretations on subsurface geologic structure, depths to units, soil thickness, and depths of geologic contacts. Page 1 (e.g. Figure A1): The first figure for each line is titled “Bi-directional Slowness-Frequency Rayleigh Wave Dispersion Curve Stack with Picks,” and displays the subsurface slowness and phase velocity as a function of frequency bandwidth known as Rayleigh Wave dispersion. Slowness (in seconds/meter) is the inverse of velocity (meters/second). Dispersion picks are made for fundamental mode energy corresponding to the red color saturation. Slowest picks, or uncertainty picks, are made along the upper yellow area to constrain the slowest possible interpretation.
Page 2 (e.g. Figure A2): The second page contains two figures for each line. The upper figure contains P-wave plots which are superseded by the P-wave values presented in Appendix B. The lower figure shows S-wave Velocity/Depth plots which show the 0.5-meter resolution Vs-depth data plotted. The tabulated source data for these plots are presented in Appendix C.
2. Figure A2 Upper Plot: P-Wave/Depth plot Monte Carlo Inversion Results Figure A2 Lower Plot: S-Wave/Depth plot Monte Carlo Inversion Results
Appendix B – Rayfract P-wave Refraction Vp and Ray Density Plots Results of the Rayfract P-wave refraction and Ray Density processing are depicted as two plots per page. The upper plot shows the P-wave velocity in m/s and the interpreted water table is depicted as the 1470 m/s contour line as depth below ground surface. The depth to water table picks are tabulated in Tab 4 of Appendix D. The 1470 m/s contour was not resolved in Lines 5, 7, 18, 25, 26, 27, 29, 51. Appendix C – Final Vp-Vs Spreadsheets with Vs5, Vs10, Vs20, and Vs30 Calculations (Digital Appendix) The source data containing the x-y coordinates used to plot the S-wave/Depth plots are tabulated in the digital Appendix C excel spreadsheet files which contain the Vs-depth (Vs5, Vs10, Vs20, and Vs30) calculations. All Vs-depth data are provided at 0.5 meter depth resolution.
Appendix D – Final Spreadsheets with Depth to Water Table Compilation Data (Digital Appendix)
An Excel spreadsheet is provided with all water table depth data used for this investigation. Appendix E – NEHRP Site Class, Water Table, Surficial Geology, and Liquefaction
Potential Maps (Digital Appendix) Large format Adobe .pdf files of each final map are provided in Appendix E. These maps are ready to be printed and uploaded to the IGS website. The ArcGIS files used to generate these maps are provided in Appendix F. Appendix F - ArcGIS Data Files (Digital Appendix) The Geographical Information System (GIS) data package accompanying this report includes 4 shapefiles (Pocatello_Vs_Sites.shp, Vs_Surficial_Geology.shp, Vs_Surficial_Geology_Contacts.shp, and WaterTable_LessThan_12m.shp), a hillshade image (Pocatello_10m_hs) of a 10-meter Digital Elevation Model (DEM) from the National Elevation Dataset (NED), and an .mxd file (PocatelloVs.mxd). All files are clipped to the City of Pocatello, ID boundary with NAD 1983 UTM Zone 12N projection. These files were created and edited in ArcGIS version 10.0. Metadata, written in Federal Geographic Data Committee (FGDC) format, was completed for the shapefiles and the hillshade image. The shapefile attribute tables have been constructed with clearly labeled and organized attribute fields, and they are populated to show the relevant data gathered during this study. Additionally layer files (.lyr) have been created and added to this delivery package to symbolize the shear-wave velocity data (Vs5, Vs10, Vs30, and Vs30), surficial geology, surficial geologic contacts, and liquefaction hazard classification. This information is presented and organized within the .mxd file. Appendix G – Raw Seismic Records and Observer’s Logs (Digital Appendix) Raw unprocessed seismic data and the accompanying observer’s logs for each line are provided.
Line ID Seismic Survey Site LAT LONG1 Caldwell Park 42.86760 -112.440392 Optimist Park 42.87449 -112.448263 Ammon Park 42.88361 -112.432514 Alameda Park 42.88469 -112.445105 Scardino Park 42.90134 -112.443016 Satterfield Dr. 42.92025 -112.409347 Sister City Park 42.90135 -112.420238 Outback line 42.89749 -112.426659 Roosevelt 42.88655 -112.4543910 NOP Park 2 42.89685 -112.4579811 NOP Park 1 42.89696 -112.4631712 Hawthorne Park 42.89704 -112.4729213 OK Ward Park N 42.91023 -112.48385
14 OK Ward Park S 42.90771 -112.48286
15 Philbin Rd. 42.90188 -112.49463
16 Greenway 42.87121 -112.46816
17 La Valle Strada 42.88258 -112.41396
18 Hospital Grounds 42.86997 -112.42102
19 Bonneville Park 42.87321 -112.42759
20 Holt S 42.86818 -112.42856
21 Holt N 42.87238 -112.42939
22 Carter St. 42.86277 -112.43662
23 5th St. 42.86035 -112.43598
24 ISU Quad 42.86071 -112.43454
25 Cusick Ck. 42.84022 -112.44983
26 Prison 42.84346 -112.44755
27 W Clark 42.85343 -112.46347
28 Cove Rd. 42.85469 -112.46666
29 Fremont Park 42.86083 -112.46558
30 Gwen Dr. 42.86244 -112.46995
31 Westello 42.86288 -112.47702
32 Oakland LDS 42.87235 -112.47272
33 Raymond Park 42.86772 -112.46575
34 Red Hill 42.85779 -112.42163
35 Bartz Field 42.85955 -112.42536
36 American Rd. 42.86540 -112.40942
37 not acquired n/a n/a
38 Nighthawk Way 42.84901 -112.39918
39 Restlawn Dr. 42.84770 -112.41637
40 Cemetery 42.84979 -112.42294
41 Ross Park E 42.84721 -112.42372
42 Taysom-Rotary Park 42.84995 -112.43750
Seismic Line Midpoint
Table 1. Seismic Survey Locations. Coordinates represent the midpoint of each 92-meter long seismic line. Note that lines 37 and 45 were not obtained.
Line ID Seismic Survey Site LAT LONGSeismic Line Midpoint
Table 1. Seismic Survey Locations. Coordinates represent the midpoint of each 92-meter long seismic line. Note that lines 37 and 45 were not obtained.
43 Rainey Park 42.85470 -112.44540
44 Juniper Hills Golf1 42.81080 -112.39151
45 not acquired n/a n/a
46 Constitution Park 42.83678 -112.40608
47 Ross Park W 42.84139 -112.42367
48 Edson Fitcher 42.82178 -112.40711
49 Mountain Shadow Ln 42.81300 -112.41356
50 Johnny Creek 42.83256 -112.42732
51 Fowler-Egger 42.82919 -112.43172
52 Sunny Side 42.83766 -112.41927
53 Juniper Hills Golf2 42.81323 -112.39172
54 Cochise 42.82747 -112.41298
Vs30 Range (m/sec)< 180
D1 180 - 240D D2 240 - 300
D3 300 - 360C1 360 - 490C2 490 - 620C3 620 - 760
> 760
NEHRP Class
E
C
B
Table 2. NEHRP Modified Site Classification criteria based on shear wave velocity (Wills et al., 2000; FEMA, 1994; IBC, 2009).
Lumped Unit
Qal Qfp Qm Qc Ql Qfg Tu pT
Table 3. Combined Surficial Geologic Unit Explanation. Detailed map units similar in age, depositional process, and characteristic Vs were combined to form simplified Vs-lithologic Lumped Units.
Table 4. Surface Area and Human Development of Surficial Geologic Units. These values were used to develop project goals for how many seismic surveys per geologic unit were targeted.
Table 6. Line-specific Depth-Averaged Shear Wave Velocity Data. Vs data are presented a 5-meter (Vs5), 10-meter (Vs10), 20-meter (Vs20), and 30-meter (Vs30) depth-averaged values calculated at 0.5 meter vertical resolution. Line ID corresponds to the seismic survey locations displayed in Figures 1 and 2 and all maps. The Site Name provides the geographic reference, typically parks and open spaces in Pocatello city limits. Geologic Unit Labels correspond to the maps provided in Appendix E. The GeoAge column provides the depositional age for the various surficial units.
LINE ID Site NameLumped Geologic
Unit Label Geologic Age Vs5 Vs10 Vs20 Vs30
Table 6. Line-specific Depth-Averaged Shear Wave Velocity Data. Vs data are presented a 5-meter (Vs5), 10-meter (Vs10), 20-meter (Vs20), and 30-meter (Vs30) depth-averaged values calculated at 0.5 meter vertical resolution. Line ID corresponds to the seismic survey locations displayed in Figures 1 and 2 and all maps. The Site Name provides the geographic reference, typically parks and open spaces in Pocatello city limits. Geologic Unit Labels correspond to the maps provided in Appendix E. The GeoAge column provides the depositional age for the various surficial units.
45 not acquired n/a n/a n/a n/a n/a n/a
46 Constitution Park Qfp Holocene 163.5 189.4 235.0 257.2
47 Ross Park W Qal Holocene-active 235.7 271.8 302.0 346.8
48 Edson Fitcher Qal Holocene-active 212.1 239.4 309.4 330.3
Vol/Sed-Met (b)Quaternary basalt, Tertiary Rhyolite, and Neoproterozoic bedrock
0
Table 8. Age-Texture-Environment (ATE) Descriptions for Surficial Geologic Units in Pocatello *O'Connor (1993)
Unit Age Texture Environment A T E Total Class
Qal H c af 5 3 4 12 High
Qfp H c af 4 3 4 11 High
Qls H c ls 4 3 1 8 Medium
Qm yP c af 3 3 3 9 High
Qc yP c g/e 3 3 1 7 Medium
Ql yP f e 3 2 2 7 Medium
Qfg P c af 1 3 4 8 Medium
Table 9. ATE Results for surficial units in Pocatello
2
4
1
9
7
6
5
3
8
41
21
20
19
15
14
13
12 11
51
50
38
3534
32
44
16
23
10
3940
24
22
46
18
25
36
28
26
27
30
49
3129
17
33
43
47
48
52
42
53
54
§̈¦15
§̈¦86
§̈¦15
§̈¦86
£¤30£¤91
378000 381000 384000 387000
4741
000
4744
000
4747
000
4750
000
4753
000
N0 1 mi
0 1 km
New Seismic Survey Locations in Pocatello
L:\Projects\04_79223200_Pocatello_Vs30_Mapping\GIS\MXD\Pocatello_Vs30Mapping_GeophysicalLines_Fig.mxd; ticci; 10/3/2012Fugro C
onsultants, Inc.P
roject No. 04.79223200
FIGU
RE
1
Coordinates on NAD83 UTM Zone 12 North meters.Imagery from NAIP, 2011.
City boundary
Seismic line location and line ID15
Explanation
Note: No seismic data obtained for proposed Lines 37 and 45, these locations are not shown.
Qm
Qfp
Qfg
pT
Qfg
Qfp
Qfg
Qc
Qls
Ql Qp
m
Qal
Qfg
m
Qfg
Qfp
Tu
Ql
Qc
Qfg
Ql
pT
Qm
Ql
Ql
pT
Qal
Qfg
m
Qc
pT
pT
Qal
Qfg
Ql
pT
Ql
pT
Qfg
Qfg
Ql
Ql
Qfg
Qfg
m
Qc
Tu
m
pT
pT
pT
Ql
Qc
Tu
Ql
Tu
Ql
m
m
Qal
Tu
Tu
Qm
Ql
Tu
Ql
Qfg
Qal
Qal
Qal
Tu
Qal
Qfp
Ql
Qp
Tu
Tu
Tu
QalQm
Qal
Qal
m
m
pT
Qfg
Tu
Ql
mm
Qal
Tu
Qfg
pT
Tu
Qal
pT
Qfg
Tu
Ql
Qal
Tu
pT
m
pT
Qls
m
Qm
Tu
m
Qfg
m
m
Tu
Ql
pT
pT
Tu
Qm
Tu
Qfp
Qfp
pT
pT
2
4
1
9
7
6
5
3
8
41
21
20
19
15
14
13
12 11
51
50
38
3534
32
44
16
23
10
3940
24
22
46
18
25
36
28
26
27
30
49
3129
17
33
43
47
48
52
42
53
54
378000 381000 384000 387000
4741
000
4744
000
4747
000
4750
000
4753
000N
0 1 mi
0 1 km
Surficial Geology with New Seismic Survey Locations
L:\Projects\04_79223200_Pocatello_Vs30_Mapping\GIS\MXD\Pocatello_Vs30Mapping_Geology_Fig.mxd; ticci; 10/3/2012Fugro C
onsultants, Inc.P
roject No. 04.79223200
FIGU
RE
2
Coordinates on NAD83 UTM Zone 12 North meters.
City boundary
Seismic line location14
Explanation
Notes: No seismic data obtained for proposed Lines 37 and 45, these locations are not shown.(*) indicates a geologic unit not subject to seismic survey.Geology modified from: Link and Stanford, 1999; Othberg, 1999; and Rodgers and Othberg, 2002.
Young alluvial deposits of Portneuf River and Pocatello Creek
Colluvial deposits
Loess-mantled alluvial fan gravel deposits
Older fan gravel of lower Portneuf RiverLoess deposits