THE NEISS SAMPLE (DESIGN AND IMPLEMENTATION) 1997 to Present Prepared for public release by: Tom Schroeder Kimberly Ault Division of Hazard and Injury Data Systems U.S. Consumer Product Safety Commission June 2001
Transcript
THE NEISS SAMPLE(DESIGN AND IMPLEMENTATION)
1997 to Present
Prepared for public release by:
Tom SchroederKimberly Ault
Division of Hazard and Injury Data SystemsU.S. Consumer Product Safety Commission
June 2001
i
TABLE OF CONTENTS
INTRODUCTION 1
NEISS SAMPLE CHARACTERISTICS 1
JANUARY 1997 - DECEMBER 1998 1JANUARY 1999 TO PRESENT 2
TREND ANALYSIS OF NEISS DATA PRIOR TO 1997 3
HOSPITAL SELECTION PROCEDURE AND HOSPTIAL PARTICIPATION 4
HOSPITAL WEIGHTS, 1997 TO PRESENT 6
BASIC HOSPITAL WEIGHTS 6ADJUSTMENTS FOR NON-RESPONSE 6ADJUSTMENTS FOR HOSPITAL MERGERS 6ADJUSTMENTS FOR CHANGES IN SAMPLING FRAME 8FINAL NEISS WEIGHTS 10
NATIONAL ESTIMATES OF PRODUCT-RELATED INJURIES FROM NEISS 11
BIAS IN A RATIO ADJUSTED NEISS ESTIMATE 12
SAMPLING ERRORS ASSOCIATED WITH NEISS ESTIMATE 13
CALCULATING VARIANCES OF NEISS ESTIMATES 13GENERALIZED SAMPLING ERRORS 14
APPENDIX 1 27
APPENDIX 2 29
ii
REFERENCES 33
iii
LIST OF TABLES
Table PageTable 1: NEISS Sample Characteristics, January 1, 1997 through December 31, 1998 16Table 2: Ratio Adjustments to NEISS Weights, January 1, 1999 through December31, 1999
17
Table 3: NEISS Sample Characteristics, January 1, 2000 to present 18Table 4: Ratio Adjustments to NEISS Weights, January 1, 2000 through December31, 2000
19
Table 5: Ratio Adjustments to NEISS Weights, January 1, 2001 through December31, 2001
20
Table 6: National Estimates of the Total Number of Product Related Injuries,January – September 30, 1997
21
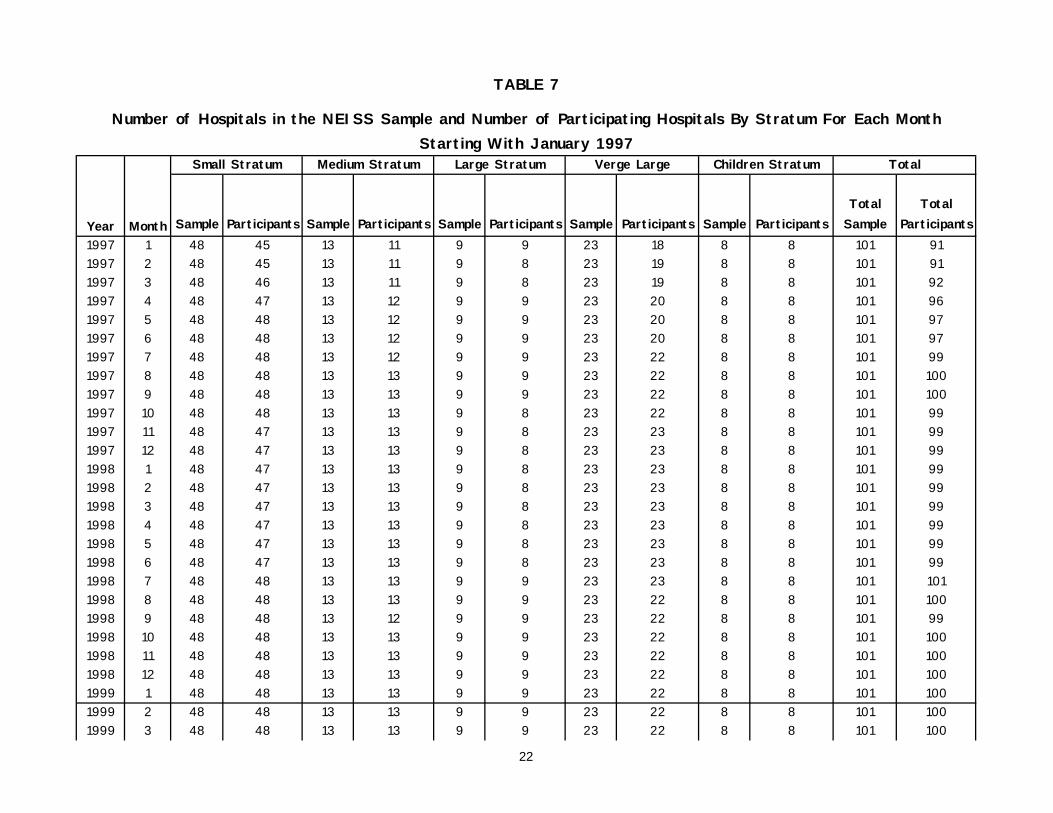
Table 7: Number of Hospitals in the NEISS Sample and Number Participating byStratum for each month starting January 1997
22
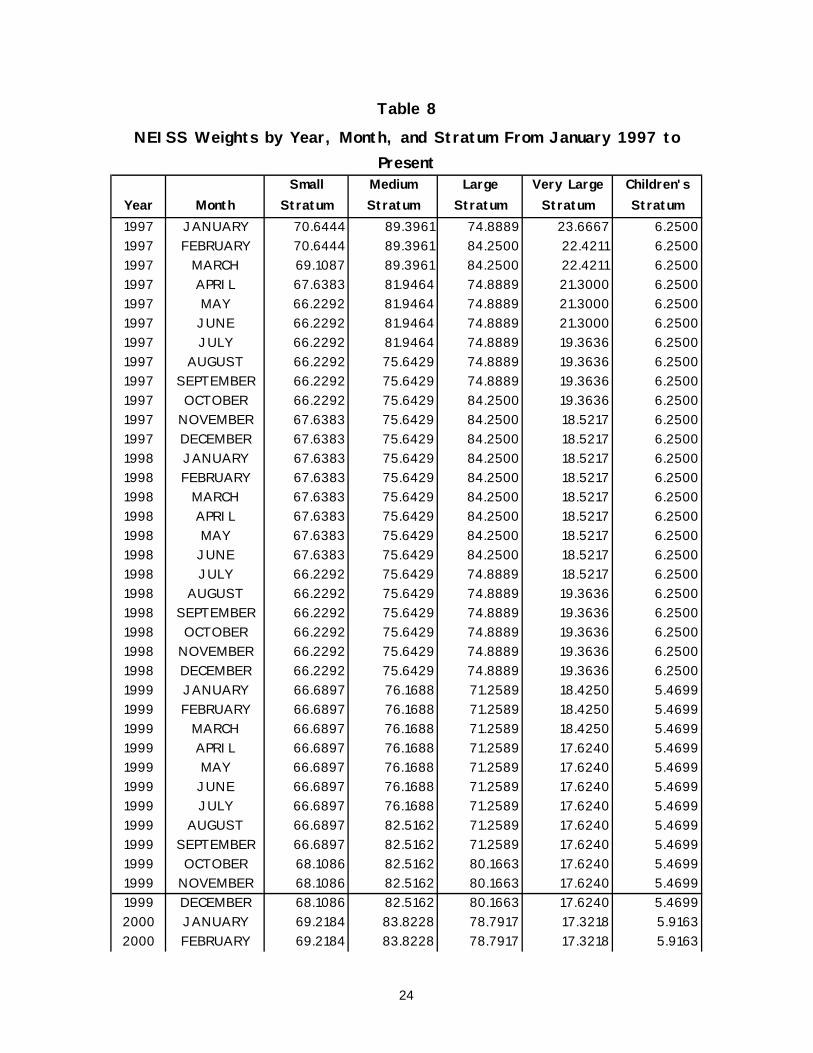
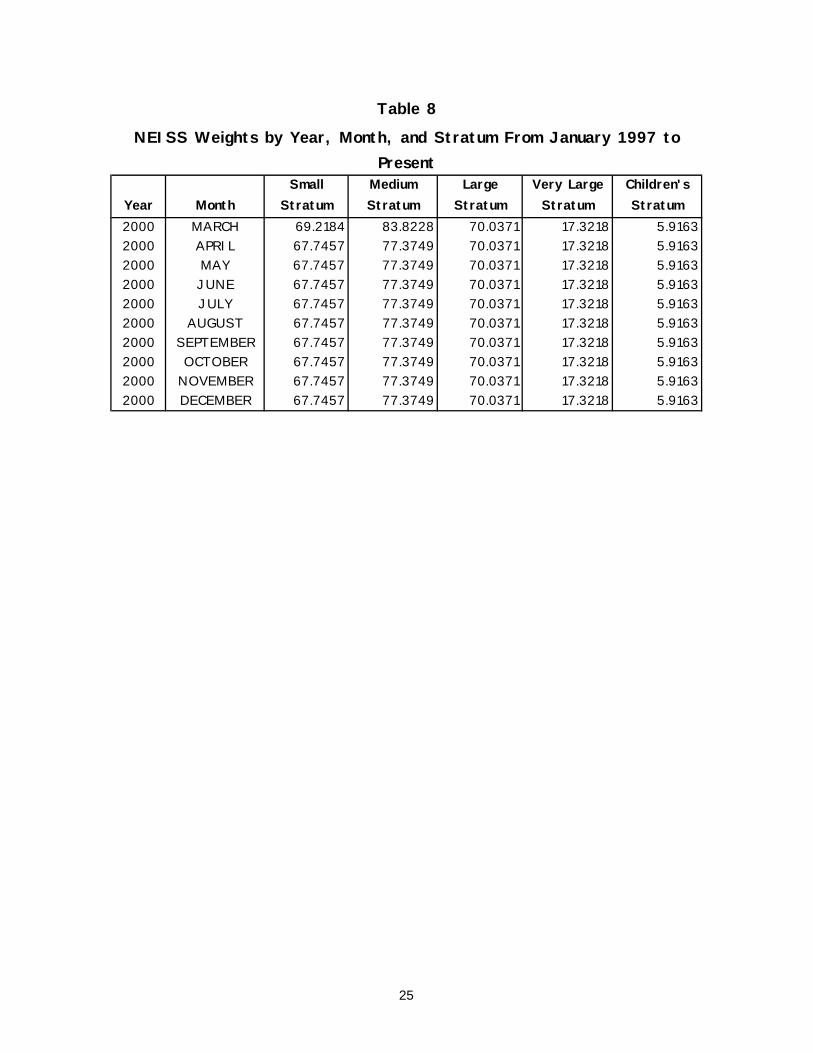
Table 8: NEISS Weights by Year, Month, and Stratum from January 1997 toDecember 2000
24
Table 9: Generalized Relative Sampling Errors for NEISS for Estimates of VariousSize
26
1
INTRODUCTION
The Consumer Product Safety operates a data system known as the NationalElectronic Injury Surveillance System (NEISS). The NEISS is a probability sampleof hospital emergency departments in the United States and its territories. Datacollected from the NEISS sample is weighted based on the sample design toproduce national estimates of the number of consumer products-related injuriestreated in hospital emergency rooms. Additionally, the NEISS data provide asource for follow-up investigations of product-related injuries.
This report documents the changes in NEISS sample design since January 1997. Fordocumentation of the NEISS sample prior to 1997, see the report “The NEISSSample Design (Design and Implementation) from 1979 to 1996”.
NEISS SAMPLE CHARACTERISTICS
January 1997 - December 1998
During 1996, under contract with Westat, Inc., the NEISS sample was updated toreflect changes in the universe of hospitals (Marker & Lo, 1996). A new samplingframe was constructed based on the most currently available (1995) listing ofhospitals and emergency room visits purchased from the SMG Marketing Group ofChicago, IL. The sampling frame included hospitals with 6+ beds having anemergency department; excluded were psychiatric and penal institutions. Theupdated sample contains five strata, four based on size (the total number ofemergency room visits reported by the hospital) and one stratum consisting ofchildren’s hospitals.
The hospital size strata were constructed as shown in Table 1, with a specialstratum for children's hospitals. In selecting the sample, Westat used a resamplingmethod that maximized the probability of retaining hospitals selected for theformer 1991 sample. The method was an extension of the Keyfitz procedures forstratified simple random samples. Therefore, 76 of the previously selectedhospitals were retained and 26 new hospitals were selected, for a total of 102hospitals. Of the 76 hospitals retained, 70 were retained from the probabilitysample and six were retained from the children’s sample. Data from these six
2
hospitals had been collected since January 1995 to increase case findings forchildren. One hospital was no longer in business when recruitment began in 1997,thus the in scope probability sample is comprised of 101 hospitals, instead of theinitially planned 102.
Three hospitals have unique weights because the hospital merged with anotherhospital after the updated sampling frame was chosen. The specifics of themergers are listed below:
• One hospital selected in the NEISS sample in stratum 2, merged with anotherhospital not selected in the NEISS sample in stratum 2. The hospital'sadministrative records are merged. The merged hospital is considered in thestatistical sample as one hospital beginning August 1, 1995. In the 1997 sample,the hospital has a weight of 38.0552.
• Another hospital selected in the NEISS sample in stratum 2, merged withanother hospital not selected in the NEISS sample in stratum 2. The mergedhospital is considered in the statistical sample as one hospital beginning May1998. In the 1997 sample, the hospital has a weight of 38.0552.
• One hospital selected in the NEISS sample in stratum 3, merged with anotherhospital not selected in the NEISS sample in stratum 3. The merged hospital isconsidered in the statistical sample as one hospital beginning July 1998. In the1997 sample, the hospital has a weight of 37.6683.
January 1999 to present
Beginning in January 1999, NEISS weights have been adjusted annually to take intoaccount changes in the most recent sampling frame of U.S. hospitals available. Thisnew component of the basic NEISS weight is the ratio of total emergencydepartment visits as listed on the updated sampling frame to the total emergencydepartment visits as estimated from the NEISS sample. Table 2 presents the totalemergency department visits (ERVs) from the 1998 sampling frame, the estimatedERVs from the NEISS sample for 1998, and the computed ratio adjustments forJanuary 1, 1999 – December 1999. The section labeled “Adjustments for Changesin the Sampling Frame” discusses the ratio adjustments in more detail. The report“Updated NEISS Weights Using the 1998 SMG Hospital Frame” written by TomSchroeder (1999) gives a complete description of this ratio adjustment procedure.
3
One hospital in the small stratum closed its emergency department on December 13,1999. Thus as of December 14, 1999, the NEISS is considered to be a sample of 100in-scope hospitals. Table 3 presents the characteristics of the NEISS sample forthis period.
Table 4 presents the total emergency department visits (ERVs) from the 1999sampling frame, the estimated ERVs from the NEISS sample for 1999, and thecomputed ratio adjustments for January – December 2000. The report “UpdatedNEISS Weights Using the 1999 SMG Hospital Frame” written by Tom Schroeder(2000) gives a complete description of this ratio adjustment procedure.
Table 5 presents the total emergency department visits (ERVs) from the 2000sampling frame, the estimated ERVs from the NEISS sample for 2000, and thecomputed ratio adjustments for January – December 2001. The report “UpdatedNEISS Weights Using the 2000 SMG Hospital Frame” written by Kim Ault andTom Schroeder (2001) gives a complete description of this ratio adjustmentprocedure.
TREND ANALYSIS OF NEISS DATA PRIOR TO 1997
One of the advantages of a long running data series such as the NEISS is theability to track trends across time. Periodic updates to the sample, such as the onedescribed in this report, can interfere with such analyses. One of the best ways toadjust for these updates is to have an overlap (bridge) during which data arecollected from both the old and new samples. Between January and September of1997, a nine-month overlap study was implemented as part of the sample update.Selecting a new sample from the same frame increases the variances in measuresacross time. When the new sample is selected from a different frame (as is thecase for the NEISS update) there is a potential break in the time series. Bycomparing the estimates produced by the two samples and the two frames, it ispossible to adjust old estimates (backcast) to be consistent with the new sample.Such an overlap can be expected to provide continuing useful information thatmore than compensates for the one time cost of the bridge sample.To backcast existing time series for the period from the previous frame update tothe current update requires a two-step process. The first step is to estimate thedifference between estimates from the two samples for the overlap period. Theratio of total number of injuries estimated from the new sample and new weights,
4
divided by the estimate for the same period from the old sample and old weights,should be calculated. This is an estimate of change due to fluctuations in thenumber and type of product-related injuries at existing emergency rooms, theaddition of new emergency rooms to the frame, and sampling variation from onesample to another. This measure of change could be computed separately by eachstratum. However, given the small sample sizes in some strata, the procedurechosen was to compute an overall measure of change and apply it to all strata.
The second step is to adjust for this change. Since the previous NEISS sampledesign was selected based on 1985 ERV data and the sample frame (prior to 1997)was based on 1995 ERV data, this change represents fluctuations over a 10-yearperiod. While the changes in number of emergency rooms and ERVs has probablybeen uneven over this period, a reasonable approximation is to assume that one-tenth of the change has occurred each year. Therefore, the adjustment procedureadopted was to add one-tenth of the estimated change to the 1986 estimates, two-tenths to the 1987 estimates, and so on up to nine-tenths of the change to the1994 estimates. The entire change has been applied to the 1995-1996 estimates.For additional information on analyzing NEISS data over time, see “Trend Analysisof NEISS Data” (February 2000).
Overlap estimates were calculated for individual product codes as well as higherorder groupings of product codes. The overall estimate during the overlap periodform the old sample was 9,258,592 while the estimate from the new sample was8,436,476. This represents an 8.9% decrease in the estimate from the new sampleas compared to the estimate from the old sample. The difference in estimatesfluctuated by product code or product grouping with some estimates increasing andothers decreasing when comparing the estimates from the new sample to estimatesfrom the old sample. Table 6 lists the estimates from the new and old sample atthe overall level as well as at the product grouping level used in CPSC’s annualreport.
HOSPITAL SELECTION PROCEDURE AND HOSPTIALPARTICIPATION
Westat, the contractor for the current NEISS sample redesign, provided CPSCwith the sampling frame, a set of primary hospital sample selections andprocedures for selecting alternate hospitals to be used as substitutes for hospitalsunwilling to participate. In each recruitment process, CPSC recruiters make
5
repeated and intensive efforts to obtain the participation of every primary samplehospital selected. Only when all approaches to obtain cooperation from a primaryhospital fail do the recruiters turn to a replacement hospital.
If the hospital being replaced is the primary selection, CPSC selects the alternate(replacement) hospital according to the procedures established by Westat. If thefirst alternate hospital refuses to participate, the second alternate is selected,etc., until cooperation is obtained with a replacement hospital. If the hospital to bereplaced is not a primary selection, we use the opportunity to try again to recruitthat hospital which is the primary sample selection. This has enabled us to obtainthe cooperation of some primary hospitals, which initially had refused toparticipate. Over time, whenever hospitals remain in business but elect to drop outof the system, CPSC attempts to return to the original recruitment order: primaryhospital, first alternate hospital, etc. Since the replacement hospitals have thesame probabilities of selection as the primary hospitals with which they areassociated, they also have the same statistical weights. All hospitals on the systemat the time of one of the updates of the NEISS are considered primary hospitalselections as of that time.
6
HOSPITAL WEIGHTS, 1997 to present
Basic Hospital Weights
The “basic” hospital weights used by NEISS are equal to the inverse of theprobability of selection for the hospitals in each stratum. The inverse of theprobability of selection is simply the total number of hospitals on the 1995-samplingframe divided by the total number of hospitals in the 1997 NEISS sample calculatedat the stratum level. Adjustments to these basic weights are made for non-responseand hospital mergers. Annual estimates of injuries are derived by summing themonthly estimates for all months of the year.
Adjustments for Non-Response
Shown in Table 7 are the number of in-scope hospitals for the sample, togetherwith the number of hospitals that actually participated in the system, by stratum,for each year and month since January 1997. This table may be used to computethe monthly stratum non-response adjustment factor for the basic hospitalweights.
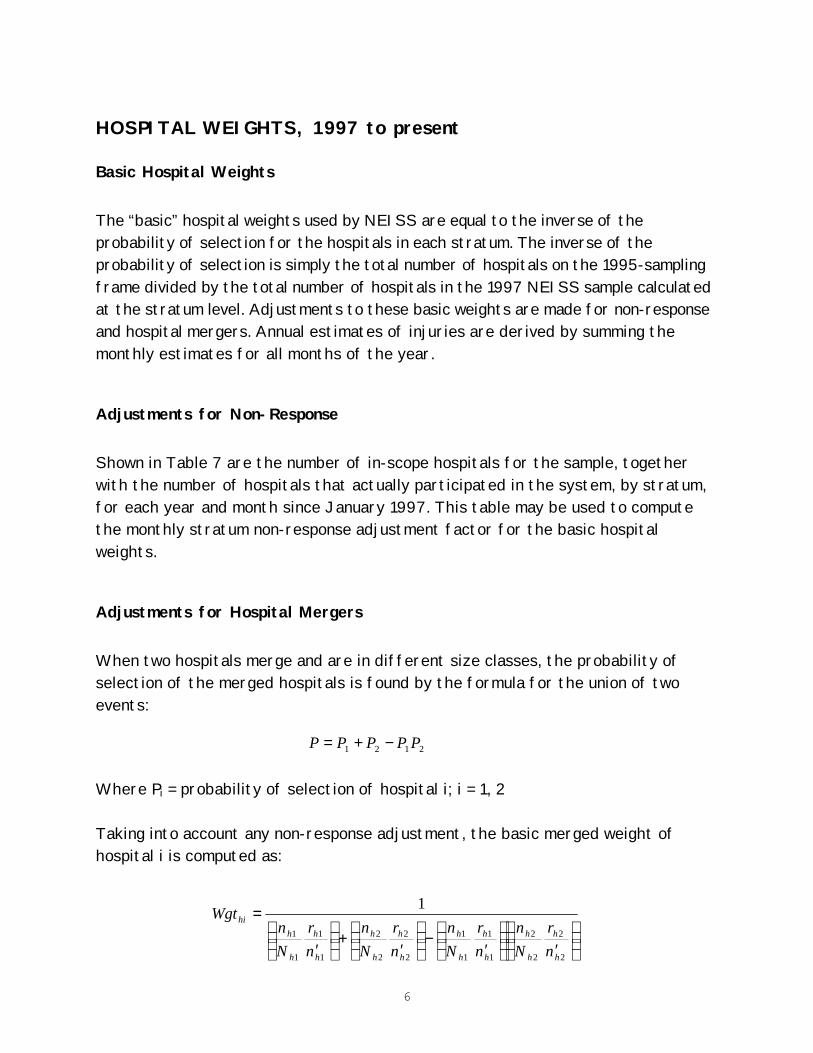
Adjustments for Hospital Mergers
When two hospitals merge and are in different size classes, the probability ofselection of the merged hospitals is found by the formula for the union of twoevents:
Where Pi = probability of selection of hospital i; i = 1, 2
Taking into account any non-response adjustment, the basic merged weight ofhospital i is computed as:
2121 PPPPP −+=
′
′
−
′
+
′
=
2
2
2
2
1
1
1
1
2
2
2
2
1
1
1
1
1
h
h
h
h
h
h
h
h
h
h
h
h
h
h
h
hhi
nr
Nn
nr
Nn
nr
Nn
nr
Nn
Wgt
7
where:Nh1(2) = Number of hospitals in the NEISS sampling frame for stratum h1(2)
n h1(2) = Number of hospitals selected for the NEISS sample for stratum h1(2)
rh1(2) = Number of hospitals participating in the NEISS sample for stratum h1(2)for the timeperiod
n'h1(2) = Number of in-scope hospitals in the NEISS sample for stratum h1(2)
When two hospitals merge and are in the same size class, the situation is morecomplex because the sampling in a size class is done without replacement. Thesample size in a particular size class was a fixed number n, and the total number ofhospitals in the size class was N for the original sample and frame. If S denotesthe sample, H1 and H2 the hospitals, the three possibilities that lead to theretention of the merged hospital in the sample are:
A. H1 ∈ S, H2 ⊄ S Hospital 1 is in the original sample, hospital 2 is notB. H1 ⊄ S, H2 ∈ S Hospital 2 is in the original sample, hospital 1 is notC. H1 ∈ S, H2 ∈ S Both hospitals are in the original sample
The probability of event A is:P(A) = P(H1 is selected on the first draw and H2 is not selected on any draw)
The leading multiplier n accounts for the possibility that H1 may be selected on anyof the n draws. The probability of event B, P(B), is the same as P(A) fromsymmetry.
The probability of event C is:
The probability of inclusion of the merged hospital is then:
1121...
23
121
−−=
+−−
+−+−
−−
−−=
NnN
Nn
nNnN
nNnN
NN
NN
Nn
111
2n
2
2nd) theon selected is Handdraw first then selected is H(2
2)( 21
−
=
=
NN
Pn
CP
)1()1(2
)1()12()()()(
−−−=
−−−=++
NNnn
Nn
NNnNnCPBPAP
8
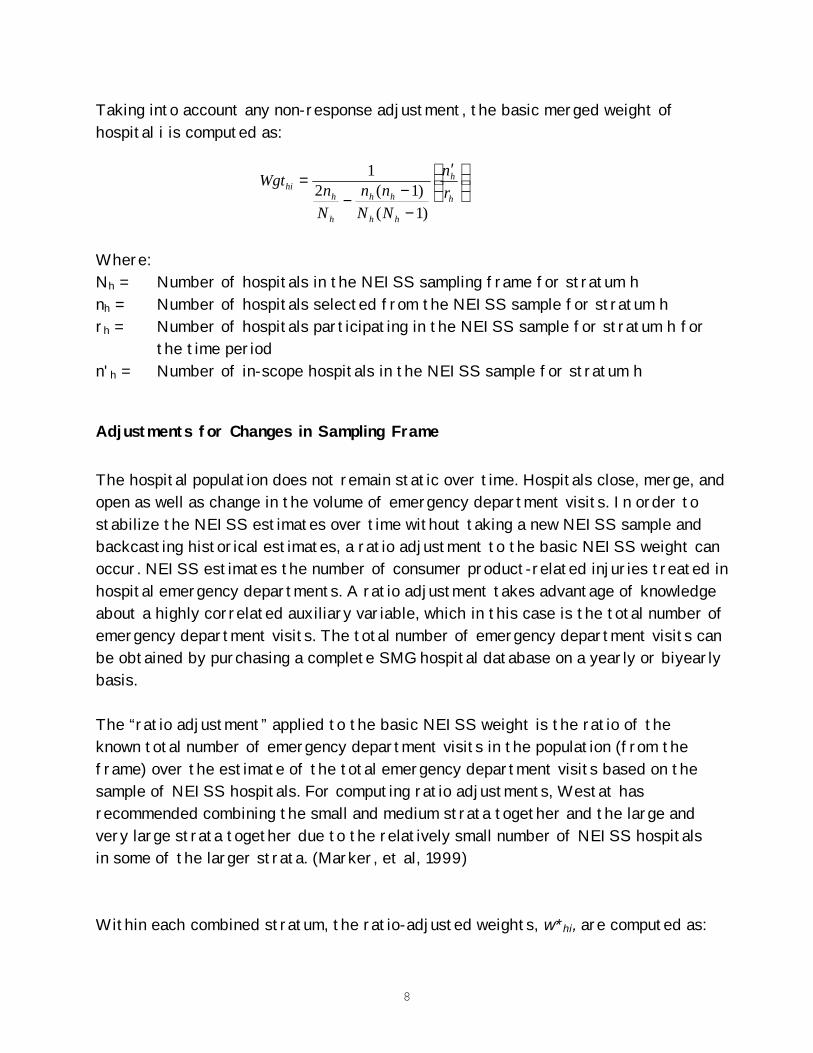
Taking into account any non-response adjustment, the basic merged weight ofhospital i is computed as:
Where:Nh = Number of hospitals in the NEISS sampling frame for stratum hnh = Number of hospitals selected from the NEISS sample for stratum hrh = Number of hospitals participating in the NEISS sample for stratum h for
the time periodn'h = Number of in-scope hospitals in the NEISS sample for stratum h
Adjustments for Changes in Sampling Frame
The hospital population does not remain static over time. Hospitals close, merge, andopen as well as change in the volume of emergency department visits. In order tostabilize the NEISS estimates over time without taking a new NEISS sample andbackcasting historical estimates, a ratio adjustment to the basic NEISS weight canoccur. NEISS estimates the number of consumer product-related injuries treated inhospital emergency departments. A ratio adjustment takes advantage of knowledgeabout a highly correlated auxiliary variable, which in this case is the total number ofemergency department visits. The total number of emergency department visits canbe obtained by purchasing a complete SMG hospital database on a yearly or biyearlybasis.
The “ratio adjustment” applied to the basic NEISS weight is the ratio of theknown total number of emergency department visits in the population (from theframe) over the estimate of the total emergency department visits based on thesample of NEISS hospitals. For computing ratio adjustments, Westat hasrecommended combining the small and medium strata together and the large andvery large strata together due to the relatively small number of NEISS hospitalsin some of the larger strata. (Marker, et al, 1999)
Within each combined stratum, the ratio-adjusted weights, w*hi, are computed as:
′
−−−
=h
h
hh
hh
h
hhi r
n
NNnn
NnWgt
)1()1(2
1
9
(Equation 1)
wherewhi = NEISS basic weight (adjusted for hospital mergers if necessary)w’hi = NEISS basic weight (adjusted for hospital mergers if necessary: see
discussion below)ERVup,h* = Total ERVs on updated SMG file for combined stratum h*Ervup,i = Number of ERVs from the updated SMG file for NEISS hospital iRh* = Ratio adjustment for combined stratum h*
Before applying equation 1 to compute the ratio adjusted NEISS weights, three issuesneed to be resolved. Several NEISS hospitals have been replaced since theredesigned sample was selected. It was decided that the ERVs from the set ofhospitals that are currently on the NEISS at the time of the update would be used inthe denominator of equation 1.
With the possible exception of the three hospitals with merger weights in NEISS,the two basic NEISS weights, whi and w’hi, are equal. A NEISS hospital is given amerged weight if that hospital has merged with another hospital and the NEISScoder cannot distinguish in which hospital emergency department an injury wastreated. However, it is possible on the updated frame that the total ERVs fromeach of the merged hospitals are listed separately, and for estimating total ERVsthe hospitals would not be considered merged. If this is the case then whi equalsthe merged weight and w’hi equals the NEISS basic weight. The following are howeach of the merged hospitals will be treated:
• For one of the merged hospitals in stratum 2: Of the two hospitals thatmerged, one eventually closed and one built a new facility. For computing ERVs,this will be treated as two separate hospitals on the updated frame, one withzero ERVs and the other with a specified number of ERVs. Thus whi ≠ w’hi.
• For the other merged hospital in stratum 2: Both of the merged hospitals haveseparate ERVs listed on the updated frame and both emergency rooms remainoperational. For computing ERVs, this will be treated as two separate hospitalson the updated frame. Thus whi ≠ w’hi.
** hhi
hh iup,i
'hi
up,hhi
*hi Rw
ervw
ERVww
*
*
=
=
∑∑∈
10
• For the merged hospital in stratum 3: Both emergency rooms remainoperational. However, the updated sampling frame lists ERVs for only one of thehospitals. This will be treated as a merged hospital in computing ERV totals.Thus whi = w’hi.
A ratio adjustment in its true form would only sum the total ERVs on the updatedframe for the hospitals that where eligible for NEISS on the 1995 frame.However, summing in this manner would not account for the ERVs from any of thenew emergency departments that opened in the interim and thus underestimatethe total number of injuries. Through NEISS, CPSC wants to estimate the totalnumber of product-related injuries treated at all eligible U.S. hospitals. This wouldinclude any new emergency departments that have opened since 1995. Thus, thetotal ERVs from the new emergency departments are added into their appropriatecombined strata.
Final NEISS Weights
The final NEISS weight calculated each month and used for national estimates canconsist of the following parts: basic weights, adjustments for non-response,adjustments for merged hospitals, and adjustments for changes in the samplingframe. The final weight (for all non-merged hospitals) can be written as:
(Equation 2)
where:Nh = Number of hospitals in the 1995 sampling frame for stratum hnh = Number of hospitals selected for the NEISS sample for stratum hn’h = Number of in-scope hospitals in the NEISS sample for stratum hrh = Number of NEISS hospitals participating in stratum h for the given monthRh = Ratio adjustment for combined stratum h
Table 8 shows the final NEISS weights for 1997 to 2000.
)*()'*(
hh
hhhwt
rnRnN
NEISS =
11
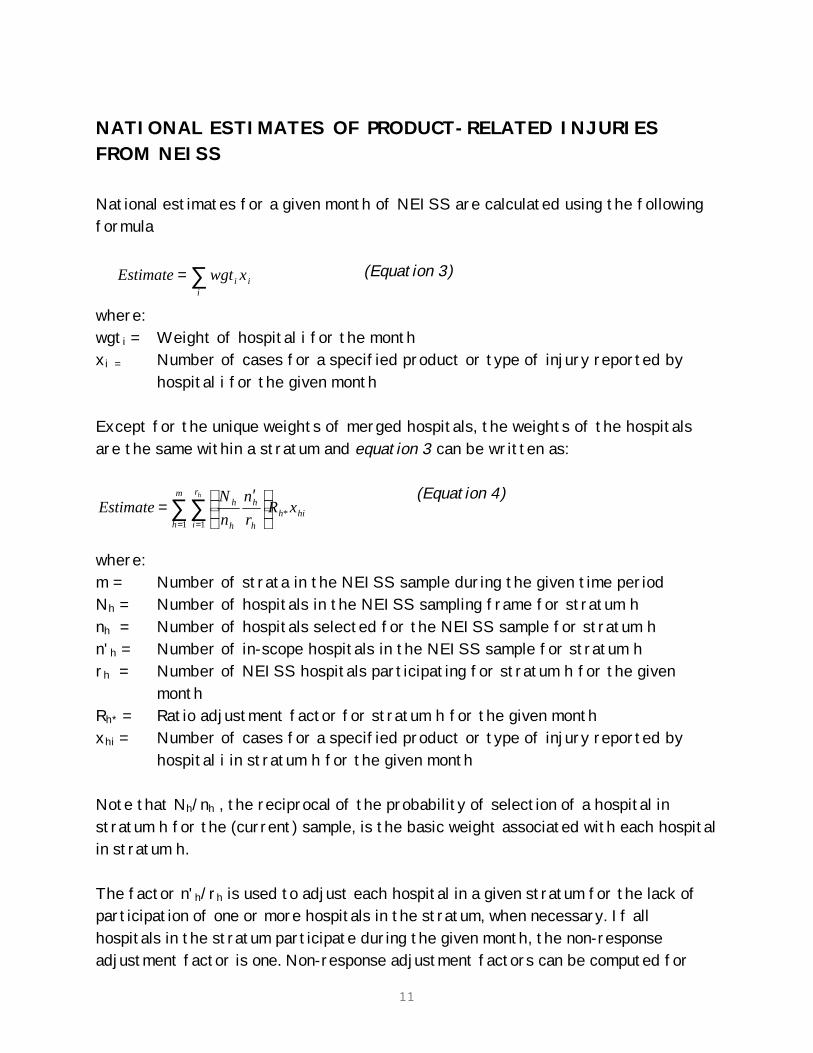
NATIONAL ESTIMATES OF PRODUCT-RELATED INJURIESFROM NEISS
National estimates for a given month of NEISS are calculated using the followingformula
(Equation 3)
where:wgti = Weight of hospital i for the monthxi = Number of cases for a specified product or type of injury reported by
hospital i for the given month
Except for the unique weights of merged hospitals, the weights of the hospitalsare the same within a stratum and equation 3 can be written as:
(Equation 4)
where:m = Number of strata in the NEISS sample during the given time periodNh = Number of hospitals in the NEISS sampling frame for stratum hnh = Number of hospitals selected for the NEISS sample for stratum hn'h = Number of in-scope hospitals in the NEISS sample for stratum hrh = Number of NEISS hospitals participating for stratum h for the given
monthRh* = Ratio adjustment factor for stratum h for the given monthxhi = Number of cases for a specified product or type of injury reported by
hospital i in stratum h for the given month
Note that Nh/nh , the reciprocal of the probability of selection of a hospital instratum h for the (current) sample, is the basic weight associated with each hospitalin stratum h.
The factor n'h/rh is used to adjust each hospital in a given stratum for the lack ofparticipation of one or more hospitals in the stratum, when necessary. If allhospitals in the stratum participate during the given month, the non-responseadjustment factor is one. Non-response adjustment factors can be computed for
hih
m
h
r
i h
h
h
h xRrn
nN
Estimateh
*1 1
∑∑= =
′=
∑=i
ii xwgtEstimate
12
each stratum of the NEISS since January 1997 by using Table 8. For a given monthand stratum, the non-response adjustment factor is obtained by dividing the numberin the column labeled "SAMPLE" by the number in the column labeled"PARTICIPANTS." For example, the non-response adjustment factor for the smallstratum for October 1999 is 48/47 or 1.021.
When the monthly non-response adjustment factor for the given stratum ismultiplied by the basic hospital weight, the result is the adjusted basic NEISSweight for the small stratum for October 1999. The basic weight for the smallstratum in October 1999 was 3179/48 or 66.23 (See Table 1). Therefore, theadjusted basic NEISS weight is 1.021 x 66.23, or 67.639.
The last adjustment is for changes in the sampling frame, so the finally NEISSweight for October 1999 is 67.639 x 1.0070 or 68.11.
Bias in a Ratio Adjusted NEISS Estimate
Ratio estimates in general are biased estimates. In practice, the bias is usuallynegligible and unimportant if the sample is of moderate size. As discussed in Cochran,the bias in each stratum of a stratified sample has an upper bound less than thestandard error of the estimate multiplied by the coefficient of variation of theestimated total ERVs.
Bias in NEISS Estimate h <= SE( NEISS Estimate h ) * C.V. (Estimated ERV h )where:
.10 in the combined small and medium strata
.09 in the combined large and very large strataC.V. (Estimated ERV h ) <=
.11 in he children’s stratum
Bias in a stratified sample is additive, but due to the relatively small upper bounds ofthe bias in terms of the standard error of the estimate for each stratum, the bias inratio adjusted NEISS estimates is considered negligible.
13
SAMPLING ERRORS ASSOCIATED WITH NEISS ESTIMATE
Calculating Variances of NEISS Estimates
Variances of NEISS estimates are calculated using the classical formula for thevariance of a total from a stratified sample. With adjustments to NEISS weightsmade for non-response, hospital mergers, and ratio adjustments, the classicalvariance formula doesn’t fit NEISS exactly. Other methods for approximating thevariance are available such as Taylor series approximation or various replication(Jackknife, Balanced Repeated Replication) methods. Taylor series approximationsand a ‘leave one out’ Jackknife approach available using SUDAAN software producesimilar if not identical results to the classical variance formula used by DataSystems. Because of the similar results to other methods of calculating variances,Westat recommended that the classical variance formula should be used incalculating variances for annual NEISS estimates.
Because NEISS estimates are based on a sample of hospital emergency roomsrather than on a census of all hospital emergency rooms, they may differ somewhatfrom the figures that would have been obtained if product-related injuries hadbeen obtained from all hospital emergency rooms in the U.S. Standard (or sampling)errors are measures of the sampling variability, that is, of the variations in theestimates that occur by chance because a sample rather than the entire set ofemergency rooms is surveyed. Measures of sampling variation are frequentlyexpressed as coefficients of variation (c.v.'s). The coefficients of variation arethe standard errors divided by the estimates. The c.v. is a measure of theproportionate error due to sampling and the standard error is a measure of theabsolute error.
The square of the standard error is referred to as the sampling variance. Thevariance of an estimate based on a sample can be calculated from the sample data,and this has been done for NEISS.
The estimates of variances for NEISS take into account the probabilities ofselection, stratification, and weighting. The variance estimating formula currentlyused is:
( ) ( )2
1 1
2
1
2
1
2
11 ∑ ∑∑∑= ===
−−
=−
′−
=m
h
r
ihihihi
h
hhhi
r
i h
h
h
hm
h h
hx
hh
xwgtxwgtr
rxxrn
nN
rrσ
14
m = Number of strata in the sample for the time periodrh = the number of hospitals participating in stratum h for the time periodNh = Number of hospitals in the NEISS sampling frame for stratum hnh = Number of hospitals selected for the (current) sample for stratum hn'h = Number of in-scope hospitals in the (current) sample or stratum h xhi = the number of injuries reported for the time period in the i-th hospital
in stratum hwgthi = the weight of hospital i in stratum h for the time period
and
The equation above applies to estimates of injuries during any period -- monthly,quarterly, annually, etc. -- with xhi interpreted as the number of injuries duringthat period. For periods greater than one month, the formula assumes that thesample size is constant over the period. When there have been variations in samplesize, rh is defined as the number of hospitals reporting during all, or the majorityof the months in the period. A “majority n” (number of hospitals reporting amajority of the time) or “fractional n” (sum of number of hospital months dividedby the number of months) can be used with little difference in the results betweenthe two methods.
This formula actually slightly overstates the true sampling variance, because itdoes not take into account the effect of the secondary stratification factor,geography. Test calculations indicate that there are only slight differencesbetween calculations using the formula above, and ones that consider thegeographic substratification.
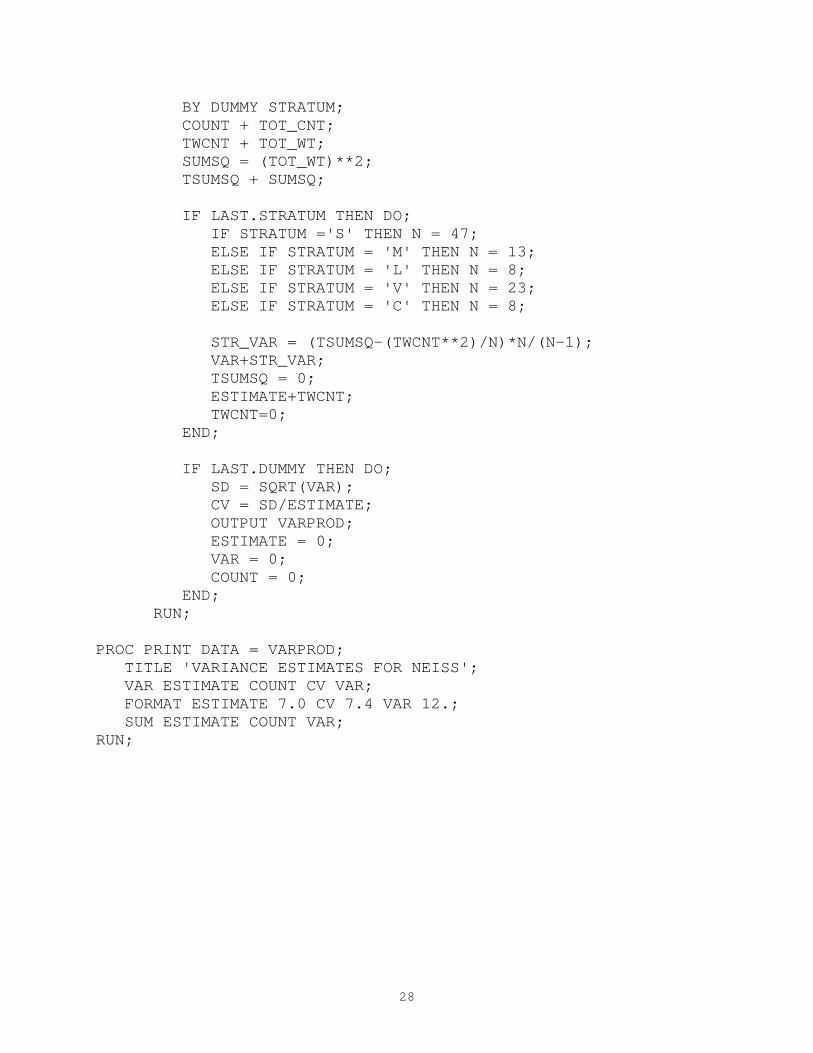
Appendix 1 contains sample SAS code for calculating variances associated with aparticular NEISS estimate. Appendix 2 contains sample SAS /SUDAAN code forcalculating variances associated with a particular NEISS estimate.
Generalized Sampling Errors
"Generalized sampling errors" are also produced for NEISS estimates. Thesesmoothed values are derived from fitting a curve to all calculated sampling errorsfor a defined set. Generalized sampling errors are commonly used by U.S.Government statistical agencies such as the Bureau of the Census, the Bureau ofLabor Statistics, and the National Center for Health Statistics to convey to the
∑=
=hr
i h
hih r
xx
1∑
=
=hr
i h
hihih r
xwgtxwgt
1
15
public information about the precision of their estimates. One reason for their useis to reduce the cost of computing and presenting the large number of variancesthat would be required if each required a separate computation. Another reason isto produce more stable estimates of variances. Sampling errors, when estimatedfrom sample data, have variances of their own; fitting a curve frequently reducesthese errors.
To fit curves for generalized sampling errors, the relationship between the size ofthe estimate xk for the k-th product group and the variance of that estimate, σ2
xk
is expressed by the formula:
where C.V. is the coefficient of variation, "a" and "b" are estimated by an iterativeprocedure. The iterative procedure produces estimates of "a" and "b" whichminimize the expression:
Recent approximate generalized standard errors and coefficients of variation forannual estimates of NEISS are presented in Table 9.
The standard errors derived from NEISS can be used in the following way: Thesample estimate and its standard error enable one to construct confidenceintervals, ranges that would include the average results of all possible samples witha known probability. For example, if all possible samples were selected andsurveyed, and an estimate and its standard error calculated from each, then:
1. Approximately 95 percent of the time the interval from twostandard errors below the estimate to two standard errors abovethe estimate would include the average result of all possiblesamples.
2. About 90 percent of similar confidence intervals using 1.6 standarderrors would include the average results of all samples.
3. About 68 percent of confidence intervals using one standard errorwould include the average results of all possible samples.
1/ Out of scope hospitals included hospitals no longer in existence, hospitals without emergency departments, or hospital emergency departments no longer in business.
a) Hospitals no longer in existence:
January 1, 1997 through December 31, 1998
One hospital selected in the small stratum was no longer in business as a hospital when the recruitment began in January 1997.
Table 1NEISS Sample Characteristics
16
Stratum1998 ERVs from Emergency Rooms on 1995 Frame
One hospital in the small stratum closed its emergency department on December 13, 1999.
January 1, 2000 to present
One hospital selected in the small stratum was no longer in business as a hospital when the recruitment began in January 1997.
Table 3NEISS Sample Characteristics
1/ Out of scope hospitals included hospitals no longer in existence, hospitals without emergency departments, or hospital emergency departments no longer in business.
18
Stratum1999 ERVs from Emergency Rooms on 1995 Frame
DATA IN ERROR(KEEP = HID WT STRATUM DUMMY); SET g.neiss; hid = put(hid,$subhosp.); stratum = put(hid,$strt97h.); dummy = 1; WT = WT/10000; *if wt has a format of 7.4 delete this line; if wt<1 then delete; if stratum in ('C','S','M','L','V') then output in; else output error;
PROC PRINT DATA = ERROR; TITLE 'Possible Error! Hospital with no stratum';
PROC SORT DATA = IN; BY HID DUMMY;
/**************************************************************//* SUM THE TOTAL WEIGHT AND TOTAL NUMBER OF CASES BY HOSPITAL *//**************************************************************/;
DATA TOTAL (KEEP = HID TOT_WT TOT_CNT DUMMY STRATUM); SET IN; BY HID DUMMY; TOT_WT + WT; TOT_CNT + 1; IF LAST.DUMMY THEN DO; OUTPUT; TOT_WT = 0; TOT_CNT = 0; END; RETAIN TOT_WT 0 TOT_CNT 0;
PROC SORT DATA = TOTAL; BY DUMMY STRATUM;
DATA VARPROD (KEEP = ESTIMATE COUNT CV VAR); SET TOTAL;
IF LAST.STRATUM THEN DO; IF STRATUM ='S' THEN N = 47; ELSE IF STRATUM = 'M' THEN N = 13; ELSE IF STRATUM = 'L' THEN N = 8; ELSE IF STRATUM = 'V' THEN N = 23; ELSE IF STRATUM = 'C' THEN N = 8;
IF LAST.DUMMY THEN DO; SD = SQRT(VAR); CV = SD/ESTIMATE; OUTPUT VARPROD; ESTIMATE = 0; VAR = 0; COUNT = 0; END; RUN;
PROC PRINT DATA = VARPROD; TITLE 'VARIANCE ESTIMATES FOR NEISS'; VAR ESTIMATE COUNT CV VAR; FORMAT ESTIMATE 7.0 CV 7.4 VAR 12.; SUM ESTIMATE COUNT VAR;RUN;
29
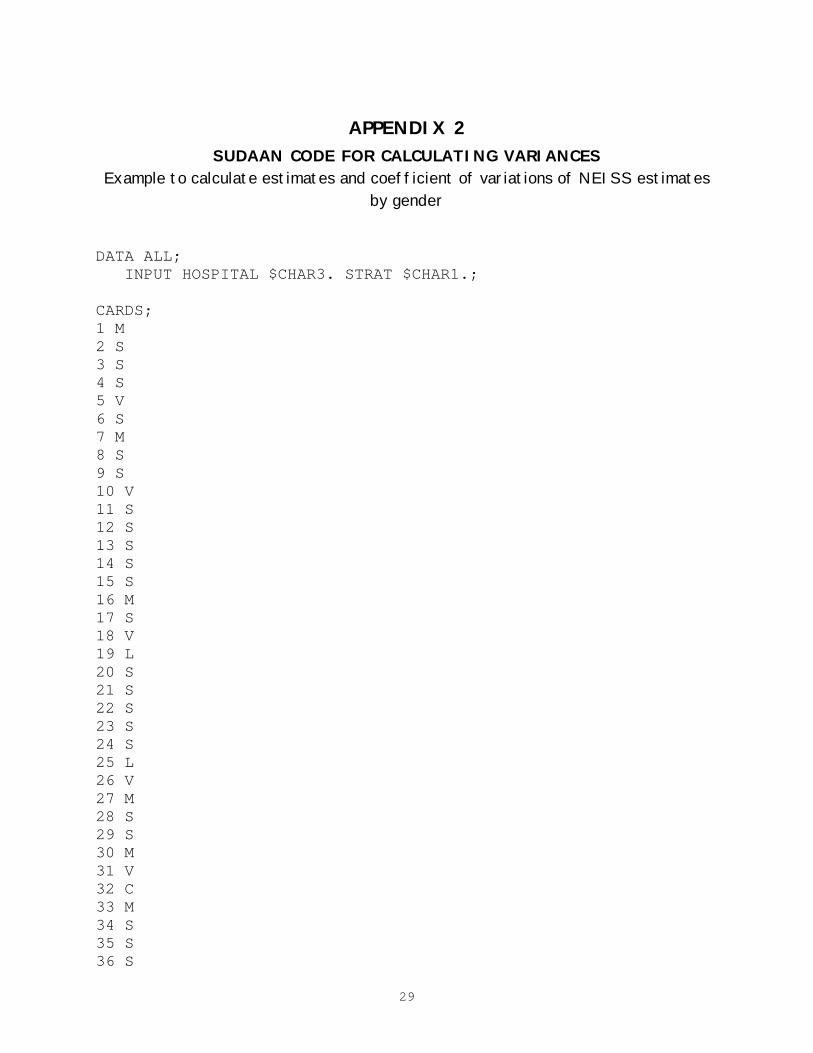
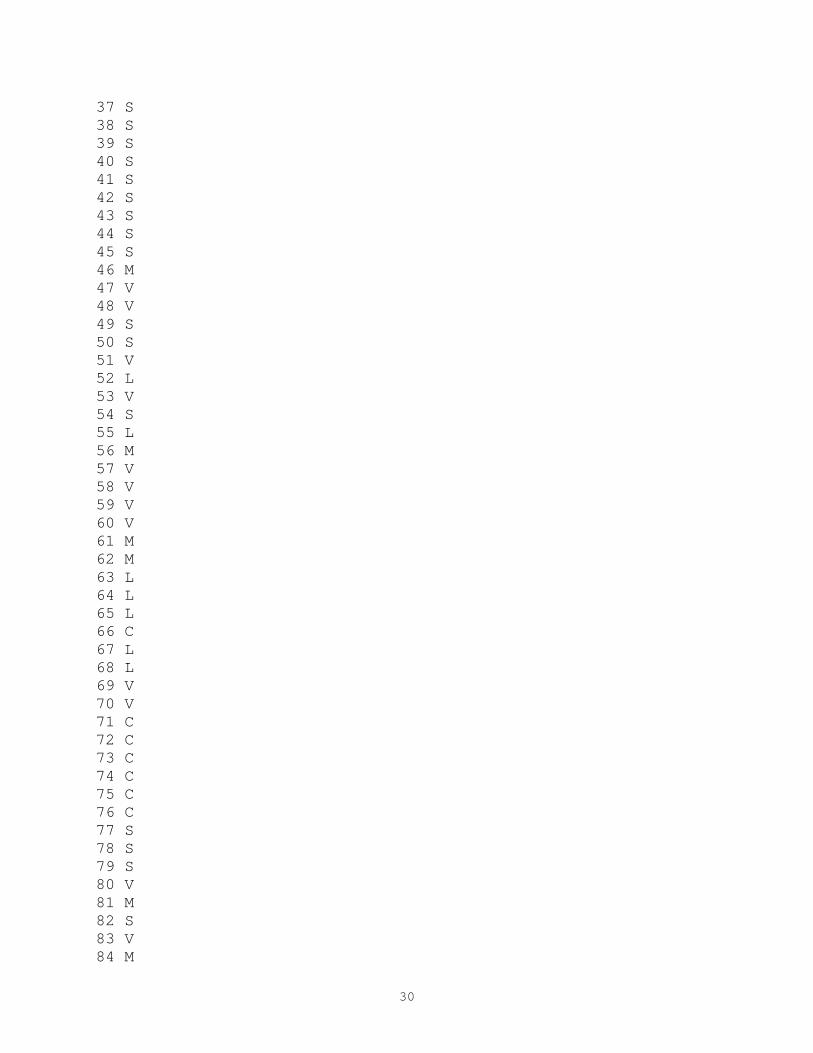
APPENDIX 2SUDAAN CODE FOR CALCULATING VARIANCES
Example to calculate estimates and coefficient of variations of NEISS estimatesby gender
PROC SORT DATA=DATASET; BY STRAT PSU;PROC SORT DATA=ALL; BY STRAT PSU;
/* CREATE AT LEAST ONE RECORD FOR EVERY HOSPITAL. *//* DATASET MUST CONTAIN VARIABLES NAMED PSU AND STRAT. */
DATA ALL; MERGE DATASET (IN=A) ALL (IN=B); BY PSU STRAT; IF ^A AND B THEN IN_STUDY = 0; IF A THEN IN_STUDY = 1; OUTPUT;
PROC SORT; BY STRAT PSU;
DATA ALL; FORMAT STRATUM 1.; IF STRAT = 'S' THEN STRATUM = 1; IF STRAT = 'M' THEN STRATUM = 2; IF STRAT = 'L' THEN STRATUM = 3; IF STRAT = 'V' THEN STRATUM = 4; IF STRAT = 'C' THEN STRATUM = 5; IF STRAT = ' ' THEN STRATUM = .;
PROC SORT; BY STRATUM PSU;
/***************************************************//* DATA SET IS NOW SORTED BY STRATUM PSU *//* READY FOR USE IN SUDAAN *//***************************************************/;
32
/* SUDAAN ESTIMATES OF TOTALS */;
DATA _NULL_; TITLE1 'VARIANCE ESTIMATES FOR GENDER'; TITLE2 'SUDAAN: DESIGN = WR';
PROC DESCRIPT DATA = "ALL" FILETYPE = SAS DESIGN = WR;
DATA SUDAAN1; SET SUDAAN1; FORMAT CV 7.4; CV = SETOTAL/TOTAL;
PROC PRINT; VAR SEX TOTAL NSUM CV SETOTAL;
RUN;
33
REFERENCES
Ault, Kimberly & Schroeder, Tom, “Updated NEISS Weights Using 2000 SMGHospital Frame,” U.S. Consumer Product Safety Commission, May 12, 2001.
Cochran, W. G. Sampling Techniques, 3rd ed., Chapter 6, John Wiley, New York,1977.
Kessler, Eileen & Schroeder, Tom, “ National Electronic Injury Surveillance System(NEISS) Estimated Generalized Relative Sampling Errors”, U.S. Consumer ProductSafety Commission, September 1998.
Marker, David & Lo, Annie, “Update of the NEISS Sampling Frame and Sample”,Westat, October 11, 1996.
Marker, David, Lo, Annie, Brick, Mike, & Davis, Bill, Westat, Inc. “Comparisons ofNational Estimates from Different Samples and Different Sampling Frames of theNational Electronic Injury Surveillance System (NEISS)”, Westat, January 25,1999.
Schroeder, Tom, “ National Electronic Injury Surveillance System (NEISS)Improving Estimated Generalized Relative Sampling Errors”, U.S. Consumer ProductSafety Commission, April 1996.
Schroeder, Tom, “Updated NEISS Weights Using 1998 SMG Hospital Frame,”memorandum, U.S. Consumer Product Safety Commission, February 12, 1999.
Schroeder, Tom, “Updated NEISS Weights Using 1999 SMG Hospital Frame,”memorandum, U.S. Consumer Product Safety Commission, January 19, 2000.
Schroeder, Tom, “Trend Analysis of NEISS Data”, U.S. Consumer Product SafetyCommission, February 2000.