We used fMRI to identify the brain areas related to the perception ofbiological motion (4 T EPI; whole brain). In experiment 1, 10 subjectsviewed biological motion (a human figure jumping up and down,composed of 21 dots), alternating with a control stimulus created byapplying autoregressive models to the biological motion stimulus(such that the dots’ speeds and amplitudes were preserved whereastheir linking structure was not). The lengths of the stimulus boutsvaried, and therefore the transitions between biological motion andcontrol stimuli were unpredictable. Subjects had to indicate with abutton press when each transition occurred. In a related biologicalmotion task, subjects detected short (1 s) disturbances within thesedisplays. We also examined the neural substrates of motion andshape perception, as well as motor imagery, to determine whetheror not the cortical regions involved in these processes are alsorecruited during biological motion perception. Subjects viewed linearmotion displays alternating with static dots and a series of commonobjects alternating with band-limited white noise patterns. Subjectsalso generated imagery of their own arm movements alternatingwith visual imagery of common objects. Biological motion specificBOLD signal was found within regions of the lingual gyrus at thecuneus border, showing little overlap with object recognition, linearmotion or motion imagery areas. The lingual gyrus activation wasreplicated in a second experiment that also mapped retinotopicvisual areas in three subjects. The results suggest that a region ofthe lingual gyrus within VP is involved in higher-order processing ofmotion information.
IntroductionHumans are very good at perceiving the movements performed
by others. They can readily recognize an actor’s movements even
from a display consisting only of the motion of point lights
corresponding to the joints of the actor — this has been termed
‘biological motion’ (Johansson, 1973). Each individual static
frame looks like a meaningless scatter of dots, but once the
frames are animated, observers immediately perceive the action
performed by the actor. In addition, with the same limited
information people can make more specific categorizations such
as male or female, friend or stranger (Cutting and Kozlowski,
1977; Mather and West, 1993). Behavioral studies also suggest
the existence of highly sensitive and f lexible mechanisms for the
analysis of biological motion (Neri et al., 1998). However, the
specific neural substrate for the analysis of biological motion is
still an unanswered question.
Oram and Perrett reported neurons in the anterior section of
the superior temporal polysensory area (STPa) in the monkey
that responded selectively to such biological motion (Oram
and Perrett, 1994). It has been suggested that processing of
visual information in primates follows two pathways: the ventral
‘form’, or ‘what’, pathway and the dorsal ‘motion’, or ‘where/
how’, pathway (Ungerleider and Mishkin, 1982; Goodale and
Milner, 1992). Area STPa receives inputs from both the ventral
and dorsal pathways (Felleman and Van Essen, 1991). Thus, it has
been suggested that outputs from the dorsal pathway (e.g. areas
MT and MST) which deal with motion information, and outputs
from the ventral pathway (e.g. area IT) which deal with form
information, are integrated in the STPa cells and contribute to
the perception of biological motion. Several human neuro-
imaging studies have reported activation in the posterior
superior temporal sulcus/superior temporal gyrus (STS/STG; a
region possibly encompassing the human homologue of area
STPa) during the observation of biological motion (Bonda et al.,
1996; Howard et al., 1996).
Human neuropsychological research suggests that a separate
site from STPa is involved in biological motion perception.
Patient AF with damage to occipitoparietal cortex and patient
LM with damage to dorsal occipitotemporal cortex both show
specific deficits in many early aspects of motion analysis but
normal biological motion processing (Vaina et al., 1990; McLeod
et al., 1996). Presumably, area MT and associated motion-
processing areas were damaged in these two patients; thus,
inputs from the dorsal motion pathway to the human homologue
of area STPa would no longer exist in these two patients. This
evidence suggests the existence of a separate motion pathway,
specialized for the perception of biological motion, that may not
require processing within the STS. In contrast to these two
patients, patient AL cannot recognize form-from-motion,
although she performs like normals on low-level motion tasks.
That is, AL can detect speed differences and the direction of
motion, but is impaired at recognizing two- or three-dimensional
form generated by motion (including Johansson figures).
Damage to the fusiform and lingual gyri that extends to latero-
ventral areas of the temporal lobe are most likely the source of
AL’s perceptual inabilities (Cowey and Vaina, 2000). Based on
these patient findings, the ventral pathway and not the dorsal
pathway appears critical for form-from-motion perception.
Consistent with this neuropsychological evidence, Zeki has
proposed that area V3 is a dynamic-form area on the basis of
neural connections within the occipital lobe (Zeki, 1993).
Motion information projects to MT from V1 and V2 and then
re-enters these visual areas diffusely, including areas which
project to V3; an area that contains form-sensitive neurons.
Additionally, the magnocellular layers of V1 and V2 project
directly to V3. Thus, both the direct and re-entry connections
provide a mechanism for form and motion to be integrated in V3,
making it a likely site in generating form-from-motion. Interest-
ingly, previous neuroimaging studies have placed little emphasis
on the role of V3 in the computation of biological motion. For
example, Howard et al. (Howard et al., 1996) observed acti-
vation in V3 and Bonda et al. (Bonda et al., 1996) found
activation within prestriate cortex which likely included V3,
however these observations were overshadowed by the STS
activation also observed in these studies.
The suggestion that two separate regions mediate biological
The Neural Substrates of Biological MotionPerception: an fMRI Study
Philip Servos1, Rieko Osu2, Andrea Santi1 and Mitsuo Kawato2
1Department of Psychology, Wilfrid Laurier University,
Waterloo, Canada and 2ATR Human Information Processing
anatomies (0.75 × 0.75 × 1.5 mm) were transformed into the Talairach
coordinate system (Talairach and Tournoux, 1988). The resulting
transformation was applied to the functional volumes. Finally, a general
linear model multi-subject analysis (non-separate predictor for each
subject) was performed for each of the five experiments to generate
group-average maps.
Results
Biological Motion Perception
Figure 5A shows the regions activated at the P < 0.001 (all P
values uncorrected) level of significance by the two biological
motion tasks, overlaid on the anatomical image of one subject
(which has been transformed into the Talairach coordinate
system). Significant activation was found only in the lingual
gyrus at the cuneus border (see Table 1). The high degree of
overlap between the regions responsive to the two biological
motion tasks indicates the reliability of the contribution of these
areas to biological motion perception. Although the group
analyses did not demonstrate significant activation in the STG,
individual analyses showed that five subjects displayed STG
activation in the biological motion experiment involving gradual
transitions (P < 0.001) and three subjects showed STG activation
in the biological motion with disturbances experiment (P <
Figure 1. Example segments of the biological motion and control motion sequences presented to the subjects. Note that dashed lines connecting joints (links) were not visible tothe subjects. Only the joints indicated by circles were shown (white dots on a black background).
774 Biological Motion Perception • Servos et al.
0.001). Group analyses revealed no significant activation in
MT/MST.
During both active tasks, performance was more than 90%
accurate for both biological motion and control sequences,
indicating that subjects were attending to the stimuli.
Linear Motion Perception
Figure 5B shows the regions activated by linear motion
perception in comparison to static dots (P < 0.00001). As many
others have found (Zeki et al., 1991; Watson et al., 1993; Dupont
et al., 1994; Tootell et al., 1995; Rees et al., 2000), we found
bilateral activation in lateral temporal–occipital–parietal cortex
(the human homologue of MT/MST, see Table 1).
Common Object Perception
Figure 5C shows the regions activated by object perception in
comparison to white noise patterns (P < 0.00001). Bilateral
activations were found in the fusiform gyrus (see Table 1),
consistent with previous work showing activation in this region
during object and face perception (Kanwisher et al., 1996, 1997).
Motor Imagery
Figure 5D shows the regions activated by motor imagery in
comparison to visual object imagery (P < 0.0001). Activations
were found in the left precentral gyrus and the left inferior
parietal lobe (see Table 1), both of which are involved in motor
execution (see Table 1). In our motor imagery task, 19 com-
mands out of 30 involved right-hand movements, while seven
involved the left hand, and four involved both hands. Therefore,
it is reasonable that we found higher left-hemisphere activation
in this task.
Overlap Between Biological Motion Perception and the Other
Tasks
We did not find overlap between the areas sensitive to biological
motion and the areas involved in the perception of motion and
shape, or the generation of motor imagery. This conclusion held
even when we lowered the significance levels of these three
tasks to that used for the biological motion tasks (i.e. P < 0.001).
Discussion
Our results show that the biological motion stimuli activated the
lingual gyrus at the cuneus border, whereas previous neuro-
imaging studies have reported the involvement of inferior,
middle and superior temporal regions as well as parietal and
lateral occipital regions. On the other hand, our finding comple-
ments observations in patient AL (Cowey and Vaina, 2000). As
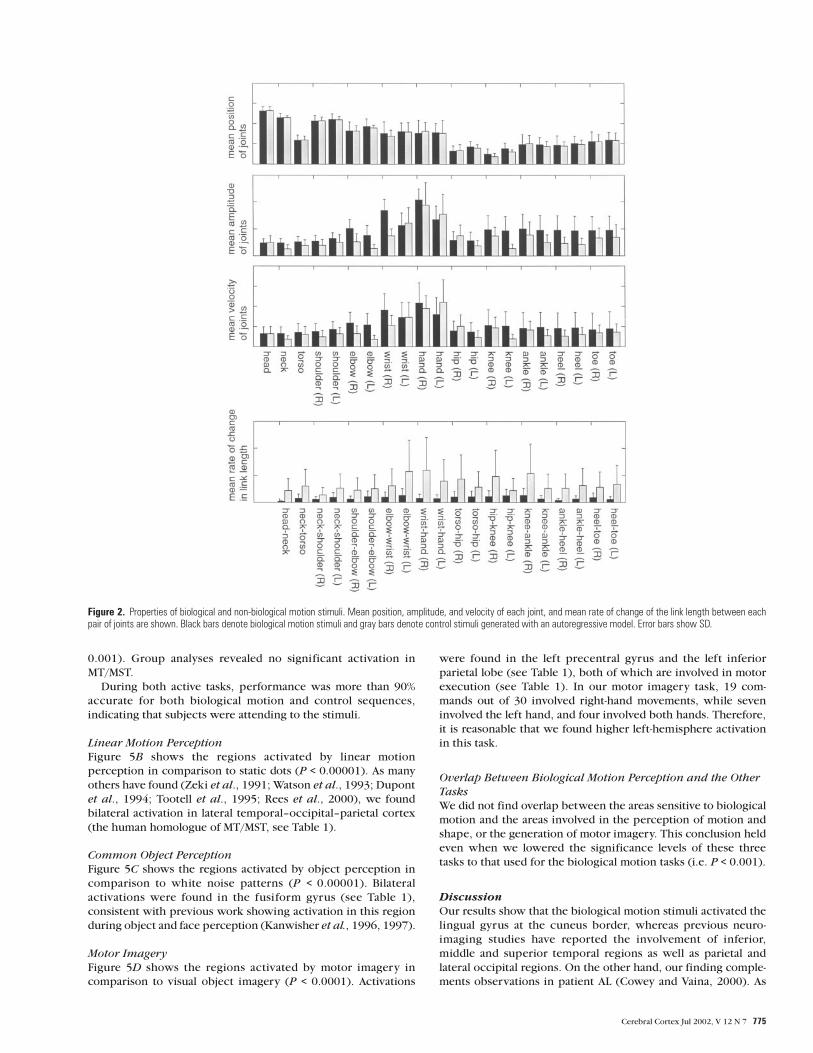
Figure 2. Properties of biological and non-biological motion stimuli. Mean position, amplitude, and velocity of each joint, and mean rate of change of the link length between eachpair of joints are shown. Black bars denote biological motion stimuli and gray bars denote control stimuli generated with an autoregressive model. Error bars show SD.
Cerebral Cortex Jul 2002, V 12 N 7 775
discussed in the Introduction, AL is impaired at recognizing
form-from-motion as a result of a lesion in the lingual and
fusiform gyri. Although AL’s perceptual inabilities could be due
to lingual gyrus inputs to biological motion specific regions
being disconnected, the present finding provides evidence that
the lingual gyrus directly mediates biological motion perception.
Human neuroanatomical work suggests that the lower parts of
the second (V2) and third (VP — the ventral component of V3)
visual areas lie on the lingual gyrus, whereas the analogue of the
macaque’s fourth visual area probably lies on the fusiform gyrus
(Clarke and Miklossy, 1990). It is possible that the region we
found lies within VP. Thus, our finding may provide support for
Zeki’s hypothesis concerning the role of V3 in form-from-motion
perception (Zeki, 1993). To determine whether the area lies
within VP, we conducted a second experiment that mapped
retinotopic visual areas. An additional purpose of the second
experiment was to replicate our biological motion finding, given
that few studies have detected activation within the lingual
gyrus.
Experiment 2
Materials and Methods
Subjects
Three neurologically intact adult volunteers (one male and two females,
mean age 25 years) participated in the experiment. Informed consent was
obtained from all the subjects prior to the experiment. The protocol of
the present study was in accordance with the ethical guidelines of the
Robarts Research Institute (London, ON, Canada).
General Procedure
Subjects participated in two functional runs. One run consisted of
biological motion stimuli and the other run consisted of polar angle
stimuli. The biological motion and polar angle runs lasted 360 s (six 60 s
stimulus–control cycles) and 288 s (six 48 s periods), respectively. In both
runs, subjects were instructed to fixate in the center of the stimulus
display.
The Tasks
Biological Motion Perception with Detection of Disturbances. See
experiment 1 methods.
Polar Angle Perception. Subjects fixated while a contrast-reversing
(8 Hz) 45° black and white checkerboard wedge, presented on a uniform
gray field, rotated 360° about the fixation point. The viewing aperture
was 14.25°. This method is similar to previous retinotopic mapping
studies of visual cortex (Sereno et al., 1995; Engel et al., 1997).
MRI Acquisition
Images were collected with a 4.0 T, whole-body MRI system (Varian, Palo
Alto, CA; Siemens, Erlangen, Germany) at the Robarts Research Institute
(London, ON, Canada), using a quadrature head coil. Functional data
were collected using T2*-weighted segmented gradient echo-planar
imaging. In the biological motion run, the field of view was
19.2 × 19.2 × 6.60 cm, with an in-plane matrix of 64 × 64 pixels and 11
pseudo-coronal slices, resulting in a voxel size of 3.0 × 3.0 × 6.0 mm (TE =
15 ms, TR = 750 ms, two shots, f lip angle = 40°, navigator-corrected). In
the polar angle run, the field of view was 19.2 × 19.2 × 5.5 cm, with an
in-plane matrix of 128 × 128 pixels and 11 pseudo-coronal slices, resulting
in a voxel size of 1.5 × 1.5 × 5.0 mm (TE = 15 ms, TR = 1000 ms, four shots,
f lip angle = 40°, navigator-corrected). The anatomies were sampled
pseudo-coronally in a 19.2 × 19.2 × 25.6 cm field of view at high
resolution (voxel size: 0.75 × 0.75 × 1.00 mm).
MRI Analysis
The biological motion data were analyzed in the same way as in
experiment 1 (see experiment 1 methods), except that the GLM analysis
was conducted separately for each subject. Given that most biological
motion activation was medial with a slight right hemisphere bias,
retinotopic analysis was restricted to the right hemisphere.
The polar angle data were first processed to remove any slow drift
trends and then cross-correlated with six phase delays to a reference
function of 6, 48 s cycles (4 s on; 44 s off). Each voxel was colored
according to the lag value with which it correlated highest. By identifying
patterns of phase reversals in the activation displayed on the f lattened
maps, the retinotopic visual areas (V1, V2, V3 and VP) were determined
for each subject. This technique of delineating visual area borders is
similar to previous studies [e.g. (Sereno et al., 1995; Engel et al., 1997)].
Figure 3. Examples of position–velocity plots of joints. Examples of position–velocityplots of individual joints in the x- and y-planes (left wrist, right shoulder and right knee).Solid curves indicate biological motion stimuli. Dashed curves indicate control stimuli.Values are normalized such that the maximum height of the stimuli is 1.
Table 1Activation foci in each condition of experiment 1
Linear motion L middle temporal gyrus 37 –41 –69 0R middle temporal gyrus 37 41 –68 1
Common objects L fusiform gyrus 37 –32 –43 –17R fusiform gyrus 37 30 –44 –18
Motor imagery L precentral gyrus 6 –28 –11 55L inferior parietal lobe 40 –38 –49 55
776 Biological Motion Perception • Servos et al.
The biological motion data were overlaid onto each subject’s f lattened
map and the visual area borders were then overlaid.
In addition to transforming the high-resolution volume anatomies to
the Talairach coordinate system (as in experiment 1), the cortical surfaces
were rendered, inf lated, and f lattened. In isolating the cortical surface,
first the skull and subcortical structures were stripped off, and the
ventricles filled. The gray–white matter boundary was determined by a
region growing technique and dilated to a point within gray matter
(approximately beneath layer 4). After smoothing the border, the
hemispheres were disconnected and any handles or topological errors
were removed through an automated algorithm (Kriegeskorte and
Goebel, 2001). The resulting border for each hemisphere was used to
create a three-dimensional reconstruction of the cortical sheet, which
was inf lated and then cut in five places. The surface was unfolded
outwards from the cuts. A similar unfolding technique has been reported
previously (Goebel et al., 1998).
Results
Figure 6 shows, for each subject, the activation produced by the
biological motion task (P < 0.000001) projected onto a f lattened
cortical representation with visual area borders overlaid. The
results replicate the lingual gyrus finding of experiment 1.
Voxels with the highest correlation values are located within VP
(two subjects) or at the VP/V2 border (one subject).
As in experiment 1, during the biological motion task,
performance was more than 90% accurate for both biological
motion and control sequences, indicating that subjects were
attending to the stimuli.
Discussion
The experiment 2 results replicate those of experiment 1 — a
Figure 4. Common objects stimuli and motion imagery stimuli. (A) Examples of common objects (left) and band-limited white noise patterns used as control stimuli (right).(B) Examples of motor and visual imagery sentences.
Cerebral Cortex Jul 2002, V 12 N 7 777
Figure 5. Average activation map for each task. The results of group analysis were overlaid on the anatomical image of one subject transformed into the Talairach coordinate system.(A) The regions activated by the two biological motion tasks. (B) The regions activated by linear motion perception in comparison to static dots. (C) The regions activated by commonobject perception in comparison to white noise patterns. (D) The regions activated by motor imagery in comparison to visual imagery.
778 Biological Motion Perception • Servos et al.
Figure 6. Activation for the biological motion with disturbance task for each subject (AD, AS and SK). The results are projected onto a flattened representation of the cortical surfaceof the right hemisphere. Overlaid on the cortical surface are also the borders of visual areas that have been identified with retinotopic methods.
Cerebral Cortex Jul 2002, V 12 N 7 779
lingual gyrus activation during the perception of biological
motion. Moreover, the results suggest that this lingual gyrus
activation is centered within area VP. The finding of activation
within VP is consistent with the proposal by Zeki (Zeki, 1993)
outlined in the Introduction. In addition, it refines his hypothesis
by suggesting that it is the ventral portion of area V3 (area VP)
that appears to play a special role in the perception of dynamic
form such as biological motion.
General DiscussionOur main finding is that a region of the lingual gyrus, within area
VP, is involved in biological motion processing. In experiment 1,
we observed no overlap between the biological motion sensitive
region and human area MT — the linear motion sensitive area —
suggesting that our control stimuli were appropriate. The lack of
overlap between the biological motion sensitive region and the
frontal (precentral gyrus) and parietal (superior parietal lobule)
regions involved in motor imagery suggests that the neural
substrates of point-light body motion perception are different
from those of motor imagery. Furthermore, the findings indicate
that the neural substrates of point-light body motion perception
are different from those of action perception (Decety and
Grèzes, 1999) and those of apparent human movement
perception (Stevens et al., 2000).
Although most other biological motion neuroimaging studies
do not report, or fail to emphasize, activation within the lingual
gyrus, our finding is less surprising when one considers that
several studies have demonstrated that the lingual gyrus appears
to be involved in more specific aspects of motion processing
than MT/MST. Orban et al. used PET to investigate the regions
activated during speed discrimination tasks in comparison with
simple motion detection tasks (Orban et al., 1998). They showed
that the right cuneus and right lingual gyrus, and to a lesser
degree the left lingual gyrus and a more anterior lingual region in
the right hemisphere, were involved in speed discrimination
tasks, whereas the MT/MST complex did not show different
activation between these tasks. Cornette et al. also showed a
far greater involvement of lingual gyrus than the MT/MST
complex in motion direction discrimination tasks than in
simple detection tasks (Cornette et al., 1998). These studies
demonstrate that the same visual input and the same attribute
(e.g. speed or direction of motion) produce different activation
sites depending on whether or not a temporal comparison is
required. Other studies have shown activation in the lingual
gyrus during the observation of second-order motion compared
with first-order motion (Smith et al., 1998), and during the
observation of motion-defined gratings, but not during the
observation of static dots or unidirectional speed (Shulman et
al., 1998). These findings are consistent with the role of the
lingual gyrus in such higher-level motion processing, as
form-from-motion.
The neuroimaging study having the most similar methodology
to ours is that conducted by Grossman et al. (Grossman et al.,
2000). Like our study, Grossman et al. used appropriate control
stimuli (same local motion as biological motion stimuli) and an
active task. Consistent with Grossman et al. (Grossman et al.,
2000), who reported STS activation in their group analyses, we
observed 5 out of 10 subjects showing STG activation in one of
our biological motion perception tasks. Unlike Grossman et al.,
however, our group analysis did not result in a significant overall
STG activation during the perception of point-light biological
motion. Our group analysis did identify lingual gyrus activation
in both of our biological motion perception tasks. Indeed, in
experiment 1, 9 of our 10 subjects showed lingual gyrus
activation during biological motion perception. The lack of
lingual gyrus activation in Grossman et al.’s (Grossman et al.,
2000) study is somewhat puzzling since our study is quite
similar. It is possible that any lingual gyrus activation that might
have been present in their study would have been obscured by
the relatively large (FWHM of 7.5 mm) spatial filter that they
used to smooth their data.
The present findings in combination with previous work
suggest that more than one cortical region is involved in the
perception of biological motion — paralleling results in the face
perception literature. As mentioned in the Introduction, in the
monkey, neurons that respond selectively to faces are located in
both the inferior temporal gyrus and on the bank of the STS.
Human imaging studies also suggest involvement of two distinct
areas (STS and fusiform gyrus) in face perception, which likely
play different functional roles (Kanwisher et al., 1997; Puce et
al., 1998). It is possible that the double dissociation found for
face perception also holds true for biological motion perception.
For example, the STS may be involved in providing the social
meaning of biological motion stimuli [cf. (Allison et al., 2000)]
whereas the lingual gyrus (specifically area VP) may be involved
in deriving biological forms from the motion information. It is
noteworthy that the observation of meaningful hand actions has
been shown to activate the STS while meaningless hand actions
do not (Neville et al., 1998).
We did not find activation in motor related, or motor imagery
related, areas during observation of biological motion. This
might be due to the nature of the biological motion perception
tasks our subjects performed. Grèzes et al. (Grèzes et al., 1998)
showed that even when a subject is observing the same stimulus,
areas of activation will differ depending on whether subjects are
simply perceiving the stimuli or if they know that they will be
asked to imitate the action later. Grèzes et al. (Grèzes et al.,
1998) found that when subjects perceived action with the aim to
reproduce it later, the dorsal pathway and premotor cortex were
more strongly activated than when they only perceived the same
actions. It is understandable that we did not find activation in
motor-related areas during the biological motion perception
tasks because we did not require subjects to subsequently
perform these movements.
Another area involved in the observation of action is the
inferior frontal gyrus (Brodmann’s areas 44/45). This appears to
be the human homologue of monkey area F5 where mirror
neurons (neurons that respond both when a particular action is
performed by a monkey and when the monkey observes the
same action performed by another individual) are found (Gallese
and Goldman, 1998). Grèzes et al. (Grèzes et al., 1998) found
activation in these areas during observation of action with no
purpose. We were unable to confirm this observation because
the signal around these areas was distorted due to the air in the
ear adjacent to these regions.
To summarize, the goal of the present study was to localize the
brain regions involved in biological motion perception. In order
to be confident that we were indeed localizing the critical brain
regions, we developed biological motion displays and related
control stimuli that had highly comparable local motion proper-
ties. We were able to identify a region in the lingual gyrus at the
cuneus border that appears to be involved in the perception of
biological motion. Furthermore, we replicated this finding in a
second experiment that additionally determined the area to be
within area VP. Given the findings from our study, and evidence
from the functional neuroimaging, neuropsychological and
single-cell recording literature, there is reason to believe that
two regions are involved in biological motion perception: one
780 Biological Motion Perception • Servos et al.
region centered around the STS and the other region centered
within the lingual gyrus. These two regions are dissociable from
cortical regions involved in the perception of linear motion,
objects, and in the generation of motor imagery. These two
spatially distinct regions may play complementary roles in the
perception of biological motion. One area (lingual gyrus) may
be involved in processing motion and deriving global form
information while the other region (STG) may derive social
meaning from this form-from-motion information. Future work
will hopefully disambiguate the role of these two regions in
biological motion perception.
NotesWe thank Dr Mel Goodale of the University of Western Ontario for
continuing encouragement; Drs M. Riley, E. Nakano of ATR-I ISD and
T. Yoshioka of ER ATO for acquisition of biological motion data; and
Joe Gati of the Robarts Research Institute for fMRI technical assistance.
P.S. is supported by an NSERC operating grant and the Canada Research
Chairs program.
Address correspondence to Philip Servos, Department of Psychology,
Wilfrid Laurier University, Waterloo, ON, N2L 3C5 Canada. Email: