*Emergency University Hospital of Bucharest, Romania **”Carol Davila” University of Medicine and Pharmacy Bucharest, Romania ***”Regina Maria” Private Clinic, Bucharest, Romania Correspondence to: Iulia Chițu, MD, Emergency University Hospital of Bucharest, 8 Regiei Blvd., District 6, Bucharest, Romania, Mobile phone: +40746 010 314, E-mail: [email protected]
Accepted: June 17th, 2019
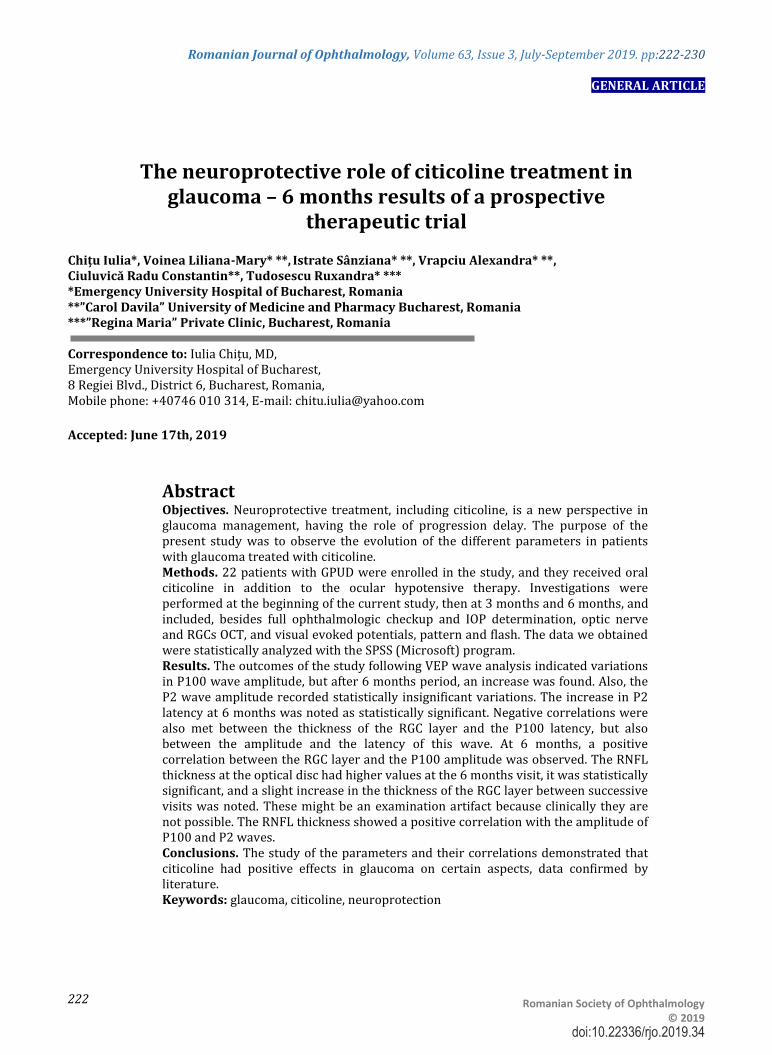
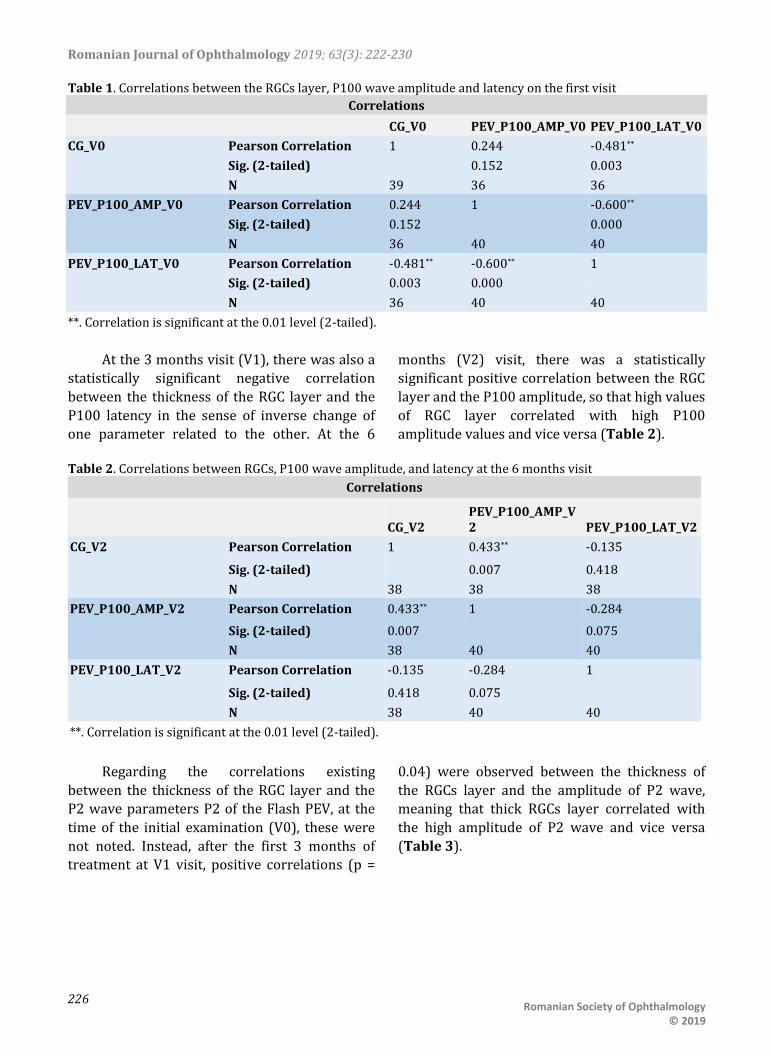
Abstract Objectives. Neuroprotective treatment, including citicoline, is a new perspective in glaucoma management, having the role of progression delay. The purpose of the present study was to observe the evolution of the different parameters in patients with glaucoma treated with citicoline. Methods. 22 patients with GPUD were enrolled in the study, and they received oral citicoline in addition to the ocular hypotensive therapy. Investigations were performed at the beginning of the current study, then at 3 months and 6 months, and included, besides full ophthalmologic checkup and IOP determination, optic nerve and RGCs OCT, and visual evoked potentials, pattern and flash. The data we obtained were statistically analyzed with the SPSS (Microsoft) program. Results. The outcomes of the study following VEP wave analysis indicated variations in P100 wave amplitude, but after 6 months period, an increase was found. Also, the P2 wave amplitude recorded statistically insignificant variations. The increase in P2 latency at 6 months was noted as statistically significant. Negative correlations were also met between the thickness of the RGC layer and the P100 latency, but also between the amplitude and the latency of this wave. At 6 months, a positive correlation between the RGC layer and the P100 amplitude was observed. The RNFL thickness at the optical disc had higher values at the 6 months visit, it was statistically significant, and a slight increase in the thickness of the RGC layer between successive visits was noted. These might be an examination artifact because clinically they are not possible. The RNFL thickness showed a positive correlation with the amplitude of P100 and P2 waves. Conclusions. The study of the parameters and their correlations demonstrated that citicoline had positive effects in glaucoma on certain aspects, data confirmed by literature. Keywords: glaucoma, citicoline, neuroprotection
Romanian Journal of Ophthalmology 2019; 63(3): 222-230
Glaucoma is as a group of progressive multifactorial optic neuropathies in which the optic nerve excavation increases as a result of retinal ganglion cells (RGC) loss, resulting in the permanent change of the visual field. It is the second cause of irremediable visual loss [1].
The leading risk factor for glaucoma is high intraocular pressure, but sometimes the decrease of intraocular pressure through hypotensive therapy may be insufficient and glaucoma may progress. Therefore, new adjuvant treatments, such as neuroprotectors, have been proposed to prevent, delay, or reduce the loss of neuronal cells, precisely of the RGC, by acting on cells undergoing apoptosis [2]. Along with the mechanical effect of intraocular pressure, injury to the optic nerve can also be determined by compromising its vascularity or by combining the two mechanisms [3].
Citicoline (cytidine-5'-diphosphocholine) is a pure endogenous compound acting as an intermediary product in the synthesis of membrane phospholipids, such as phosphatidylcholine, and can also increase the level of certain neurotransmitters in the central nervous system [4]. After exogenous administration, it is hydrolyzed and dephosphorylated, forming cytidine and choline, both of which will resynthesize the citicoline inside the neuronal cells. In a previous article, the authors have also described the positive effect of citicoline in Alzheimer’s disease, stroke, Parkinson’s disease and amblyopia [5].
Clinical and experimental studies have demonstrated the protective effect of citicoline on RGC by the antiapoptotic effect, thus opposing the thinning of the retinal nerve fiber layer, and thus causing a better transmission of the nervous impulse through the visual pathways [6]. Improvement of nerve impulse transmission was determined by visual evoked potentials (VEP), showing an enhancement in the latency and amplitude of recorded waves as a result of oral citicoline treatment [7].
The VEP examination is a useful tool for objectively quantifying the function of the visual system, being a diagnostic tool for neurological disorders. There are described two categories of VEP examination, Pattern and Flash. In the
Pattern examination, the result is recorded as a succession of waves, N75 being the initial negative wave, followed by a positive wave, P100. The P100 wavelength or latency evaluation and the N75-P100 amplitude can be useful in monitoring visual dysfunction. Thus, increased latency of P100 and amplitude reduction are commonly found in glaucoma patients [8,9]. Therefore, improving these parameters of VEP waves by developing new therapeutic modalities is an objective in the management of glaucoma. In the case of Flash stimulation, changes of P2 wave were also noticed.
Optical Coherence Tomography (OCT) is a non-invasive method that allows the retinal nerve fiber layer (RNFL) thickness to be quantified by making sections at the optical disc level. Also, OCT can measure the RGC axons loss, another useful instrument for monitoring glaucoma progression [10]. The VEP and the OCT are powerful methods for glaucoma diagnosis. The sensitivity and specificity of these methods are similar in detecting early damage [11].
The goals of the current study were the following:
Analysis of RGC layer and RNFL thickness evolution in patients receiving citicoline;
The study of the P100 and P2 waves parameters evolution (amplitude, latency) during the citicoline treatment;
Determining correlations of the RGC layer or RNFL and the P100 and P2 waves parameters of the VEP examination.
Materials and methods
The study is prospective, therapeutic, and includes 22 patients already having the diagnostic of primitive open-angle glaucoma (POAG). The conduction of this study and the tests, was performed in the Ophthalmology Clinic of the Bucharest Emergency University Hospital.
With the purpose to examine patients and to administer citicoline treatment, the patients signed the informed agreement. The research protocol was approved by the Ethics and
Romanian Journal of Ophthalmology 2019; 63(3): 222-230
Scientific Research Commission of “Carol Davila” University of Medicine and Pharmacy Bucharest (8218/ 15.02.2017).
The inclusion criteria in this study were the following:
Patients of both sexes aged 18 to 75; Confirmed diagnosis of primitive open-
angle glaucoma; IOP < 21 mmHg on unchanged topical
hypotensive therapy for at least 3 months;
The reduction of RGCs on OCT. The exclusion criteria were the
following: IOP > 21 mmHg; Optic neuritis; Macular or retinal disorders; Ophthalmologic surgery in the last 3
months; Hypersensitivity to citicoline; Diabetic patients, with multiple
sclerosis, Parkinson’s disease, nystagmus.
The study group was formed by 22 patients
(18 women and 4 males), aged 18 to 75 years,
already diagnosed with POAG, and treated with
local ocular hypotensive agents. A number of 43
eyes were analyzed because in one patient an
eye was eliminated from the study, as the TIO
was over 21 mmHg despite the hypotensive
treatment.
Patient examination consisted of both
clinical and paraclinical ophthalmologic
investigations performed at the beginning of the
study, before initiating general citicoline
treatment (V0), then at 3 months (V1) and at 6
months (V2) from onset.
Clinical ophthalmologic examination
performed at the beginning of the study, and
then at 3 months, included visual acuity, IOP
measurement, slit lamp inspection of the
anterior pole, of the fundus, and gonioscopy.
Paraclinical investigations consisted of
automatic perimetry examination, VEP, OCT with
RNFL thickness measurement at the optic nerve
level and RGC layer thickness.
For the VEP measurement, a Roland
Consult (RETI-port MINIganzfeld I8) system was
used. The testing was done monocularly, and two
types of stimulation were performed, pattern
and flash. For the pattern-VEP examination, the
procedure consisted of placing the patient at a
distance of 1 meter from the screen on which the
stimulus was projected, consisting of a pattern
similar to a reversible chess table with a
frequency of 1/ second. Potential visuals were
collected by the 3 electrodes fixed on the
patient’s scalp, 12 cm above the nasion, at the
vertex, 2 cm above the inion. As a result of pattern stimulation, the
recorded path was analyzed, thus the amplitude of the P100 wave was measured from the peak of negative N75 wave to the peak of the P100 positive wave. The latency was calculated from the moment of stimulus initiation to the top of each wave. The electrodes impedance was maintained below 5 kOhm. Flash-PEV stimulation is less sensitive than the pattern examination to the visual system dysfunction, and is mainly reserved for young, non-cooperating patients with media opacities or large refractive errors that cannot collaborate for pattern-PEV [11]. After the flash stimulation, the amplitude and latency of the resulting P2 wave were also analyzed. Investigation of VEP in the study consisted in performing both types of stimulation.
OCT was performed using a Carl Zeiss Cirrus HD-OCT 4000, thus measuring the RNFL thickness of the optic nerve and the RGCs layer thickness in the central macular area.
During the study, patients received each day a treatment consisting of 600 mg of citicoline, in the form of 4 capsules/ day (Neurovert-Sun Wave Pharma), each containing 150 mg of citicoline, plus Ginkgo biloba extract, Bacopa monnieri, alpha lipoic acid, salvia officinalis extract and phosphatidylserine.
After the initial clinical and paraclinical assessment by the above-mentioned methods, the treatment was started, and similar assessments were made at 3 months (V1) and 6 months (V2) from the beginning of the study.
Statistical analysis
It was performed using SPSS program
(Windows). The outcomes were interpreted as
medians. The effects of citicoline treatment on
the studied parameters were statistically
Romanian Journal of Ophthalmology 2019; 63(3): 222-230
Table 3. Correlations between RGCs, P2 wave amplitude and latency at 3 months visit
Correlations
CG_V1 PEV_P2_AMP_V1 PEV_P2_LAT_V1
CG_V1 Pearson Correlation 1 0.306* 0.179
Sig. (2-tailed) 0.046 0.250
N 43 43 43
PEV_P2_AMP_V1 Pearson Correlation 0.306* 1 0.182
Sig. (2-tailed) 0.046 0.243
N 43 43 43
PEV_P2_LAT_V1 Pearson Correlation 0.179 0.182 1
Sig. (2-tailed) 0.250 0.243
N 43 43 43
*. Correlation is significant at the 0.05 level (2-tailed).
The correlation is maintained 6 months
after the onset of the study, the stable thickness of the RGC layer being correlated with a slight increase of the P2 amplitude (p = 0.019).
The RNFL analysis obtained by OCT of the optic nerve revealed a slight increase during our study. As previously mentioned, this data could be an examination artifact, because the RNFL can only be stable or decrease, as the neurons cannot increase their number after being lost [12]. Thus, at 3 months, an increase in RNFL thickness by an
average of 1.58 μm was found, and it was statistically significant (p = 0.012). Between 3 and 6 months visit, the increase was only 0.889μm, but the result was not statistically significant (p > 0.05). The differences were more evident between the time of enrollment and the 6 months evaluation, when the RNFL thickness increased by an average of 2.447μm (p = 0.001). As this result could not be clinically possible, we could only conclude that the RNFL did not decrease during our treatment study (Table 4).
Table 4. Comparison between RNFL thicknesses at different examinations
Paired Samples Test
Paired Differences
t df Sig. (2-tailed) Mean
Std. Deviation
Std. Error Mean
95% Confidence Interval of the Difference
Lower Upper
Pair 1
RNFL_OCT_V0 - RNFL_OCT_V1
-1.585 3.860 .603 -2.804 -0.367 -2.630 40 0.012
Pair 2
RNFL_OCT_V1 - RNFL_OCT_V2
-0.889 4.374 0.729 -2.369 0.591 -1.219 35 0.231
Pair 3
RNFL_OCT_V0 - RNFL_OCT_V2
-2.447 4.385 0.711 -3.889 -1.006 -3.441 37 0.001
The RNFL changes also correlated with the
P100 and P2 waves’ parameters. Thus, the results showed a positive correlation between the thickness of the RNFL and the amplitude of the P100 (p = 0.022) and P2 (p = 0.007) waves at the beginning of the study. Low values of RNFL correlated with small amplitudes of these waves,
and elevated RNFL values with high amplitudes of the 2 waves. At the same moment, negative correlations of RNFL thickness and P100 latency (p = 0.001) were observed, so that high RNFL values correlated with low latencies and vice versa. The correlation was positive (p = 0.016) between RNFL and wavelength P2 (Table 5).
Romanian Journal of Ophthalmology 2019; 63(3): 222-230
*. Correlation is significant at the 0.05 level (2-tailed).
**. Correlation is significant at the 0.01 level (2-tailed).
The results also indicated a negative
correlation between the amplitude of P100 at baseline and its latency (p = 0.00), which meant the decrease of latency with the increase of amplitude and vice versa.
Between the amplitude of the 2 waves, P100 and P2, there was also a positive correlation (p = 0.003) at the initial examination, in the sense of associating the high values of the 2 waves and the low ones.
The correlation between RNFL and the P100 amplitude disappeared (p> 0.05) after the first 3 months of citicoline treatment, but the negative correlation between RNFL and latency
P100 (p = 0.005) and positive with the amplitude of P2 (p = 0.00) maintained.
Both at baseline and at 3 months, there was noticed a positive correlation between the RNFL measured on the OCT and P2 wave latency, which meant the correlation of elevated latency with those of RNFL and vice versa.
At 6 months (V2) from the beginning of the research, the results showed that the correlation between the RNFL thickness and the amplitudes of P100 (p = 0.013) and P2 (p = 0.023) waves was maintained. At the same moment of the study, there was a positive correlation between the magnitudes of the P100 and P2 waves (Table 6).
Romanian Journal of Ophthalmology 2019; 63(3): 222-230
*. Correlation is significant at the 0.05 level (2-tailed).
**. Correlation is significant at the 0.01 level (2-tailed).
Discussions
There is plenty of proof supporting the theory that neurodegeneration is the main pathogenic mechanism in glaucoma. Thus, although the primary stimulus is removed, glaucoma continues to progress [13]. P100 wavelength latency is thought to reflect both the function of retinal and post-retinal visual pathways. Consequently, nerve conduction impairment due to degeneration of neural fibers is responsible for increased PEV latency in glaucoma [14].
The effect of citicoline on VEP parameters, like increase of amplitude and decrease of latency was evidenced by Rejdak, also by oral administration of citicoline [7].
Electrophysiological tests are objective methods with reduced individual variability and can be used to study glaucomatous dysfunction. Paris also demonstrated the useful effect of the
administration of citicoline on the parameters of the VEP [15].
The negative correlations noted in this study between CG and RNFL on the one hand and the latencies of PEV waves on the other hand were confirmed by Esen in patients with multiple sclerosis [16].
Unlike the results of the present study, where the correlations between P100 latency before and after treatment with citicoline were negative (signifying the increase in latency), Rejdak noticed a decrease in P100 latency, meaning a favorable outcome of the treatment [7].
The outcomes of a study conducted by Lee are similar to those obtained by us regarding the negative correlation of P100 latency with RNFL and the thickness of the CG layer. The same study also confirmed another result we obtained, the positive correlation of the RGC layer thickness with the amplitude of the P100 wave [17].
Romanian Journal of Ophthalmology 2019; 63(3): 222-230
The role of citicoline on the evolution of glaucomatous optic neuropathy is positive, as showed by the results, some of which are consistent with those obtained by other authors. The effects are mainly highlighted by functional VEP investigations, which indicate improvement of certain parameters.
Acknowledgements
We would like to thank Sun Wave Pharma for their help during the study by providing free Neurovert for patient administration. We also thank Mrs. Raluca-Maria Bălă for supporting the statistical analysis of the study. All the authors had equal contribution to this paper.
Disclosure statement
None.
References
1. Weinreb RN, Aung T, Medeiros FAJJ. The pathophysiology and treatment of glaucoma: a review. Jama. 2014; 311(18):1901-11.
2. Weinreb RNJCjoo. Glaucoma neuroprotection: What is it? Why is it needed?. Canadian Journal of Ophtalmology. 2007; 42(3):396-8.
3. Osborne NN, Melena J, Chidlow G, Wood JPJBJoO. A hypothesis to explain ganglion cell death caused by vascular insults at the optic nerve head: possible implication for the treatment of glaucoma. British Journal of Ophtalmology. 2001; 85(10):1252-9.
4. Roberti G, Tanga L, Michelessi M, Quaranta L, Parisi V, Manni G et al. Cytidine 5′-Diphosphocholine (Citicoline) in Glaucoma: Rationale of Its Use, Current Evidence and Future Perspectives. International Journal of Molecular Science. 2015; 16(12):28401-17.
5. Iulia C, Ruxandra T, Costin L-B, Liliana-Mary VJRjoo. Citicoline–a neuroprotector with proven effects on glaucomatous disease. Romanian Journal of Ophtalmology. 2017; 61(3):152.
6. Parisi V, Oddone F, Ziccardi L, Roberti G, Coppola G, Manni GJCn. Citicoline and retinal ganglion cells: effects on morphology and function. Current Neuropharmacology. 2018; 16(7):919-32.
7. Rejdak R, Toczołowski J, Kurkowski J, Kamiński M, Rejdak K, Stelmasiak Z et al. Oral citicoline treatment improves visual pathway function in glaucoma. Medical Science Monitor. 2003; 9(3):PI24-PI8.
8. Horn FK, Bergua A, Jünemann A, Korth MJJog. Visual evoked potentials under luminance contrast and color contrast stimulation in glaucoma diagnosis. Journal of Glaucoma. 2000; 9(6):428-37.
9. Grippo TM, Hood DC, Kanadani FN, Ezon I, Greenstein VC, Liebmann JM et al. A comparison between
multifocal and conventional VEP latency changes secondary to glaucomatous damage. Investigative Ophtalmology and Visual Science. 2006; 47(12):5331-6.
10. A T, A R, P.G. S. Comparative evaluation of Optical Coherence Tomography (OCT) with Pattern Reversal Visual Evoked Potential (PRVEP) in early primary open angle glaucoma. International Journal of Bioassays. 2017; 66.
11. Chen X, Zhao YJBO. Diagnostic performance of isolated-check visual evoked potential versus retinal ganglion cell-inner plexiform layer analysis in early primary open-angle glaucoma. BMC Ophtalmology. 2017; 17(1):77.
12. Chhablani J, Krishnan T, Sethi V, Kozak IJSJoO. Artifacts in optical coherence tomography. Saudi Journal of Ophtalmology. 2014; 28(2):81-7.
13. Schwartz M, Belkin M, Yoles E, Solomon AJJog. Potential treatment modalities for glaucomatous neuropathy: neuroprotection and neuroregeneration. Journal of Glaucoma. 1996; 5(6):427-32.
14. Parisi VJG. Neural conduction in the visual pathways in ocular hypertension and glaucoma. Graefe’s Archive for Clinical and Experimental Glaucoma. 1997; 235(3):136-42.
15. Parisi VJDo. Electrophysiological assessment of glaucomatous visual dysfunction during treatment with cytidine-5′-diphosphocholine (citicoline): a study of 8 years of follow-up. Documenta ophtalmologica. 2005; 110(1):91-102.
16. Esen E, Sizmaz S, Balal M, Yar K, Demirkiran M, Unal I et al. Evaluation of the innermost retinal layers and visual evoked potentials in patients with multiple sclerosis. Current Eye Research. 2016; 41(10):1353-8.
17. Lee J-Y, Cho K, Park K-A, Oh SYJPo. Analysis of retinal layer thicknesses and their clinical correlation in patients with traumatic optic neuropathy. JAMA. 2016; 11(6):e0157388.