Kajian Malaysia, Vol. XXI, Nos. 1&2, 2003 THE NEW ECONOMIC POLICY AND FT'RTI{ER MARGINALISATION OF THE INDIANS K. Anbalakan School of Humanities Universiti SainsMalaysia Penang INTRODUCTION The two fundamentalobjectives of the New Economic Policy (NEP) were the eradication ofpoverly irrespectiveofrace and the restructuring ofthe society so as to eliminate the identification of a race with its economic functions, a legacy of the colonial times. The eradication of poverty and the restructuring of society, it was argued, would help foster national unity - the overriding objective of the whole policy. These objectives were to be achieved by redistributing the wealth of the nation equitably among all the major races.Thus, in twenty years, it was estimated that the bumiputera should be enjoying a 30 percent stake and the non- bumiputera 40 percent leaving the remaining 30 percent for the foreigners. Promiseswere made to the effect that no one race would be unduly discriminated against in pursuing these objectives and all would benefit as the economy was expectedto grow with the implementationof the NEP (Mid Term Review, Second Malaysia Plan [MTR-2MP 1973: 85-871). This assurance gave the Indian community, which at that time was holding a miserable one percent stake in the nation's economic wealth, some hope about its future economic position. However, in 1990, when the NEP officially came to an end, the community's stakeremained stagnated at one percent. The National Development Policy (NDP) and the National Vision Policy (NVP), which were formulated thereafter, too, did not improve any significantly the Indian community's economic position. This article analyses the position of the Indian community under the NEP. 379
Transcript
Kajian Malaysia, Vol. XXI, Nos. 1&2, 2003
THE NEW ECONOMIC POLICY AND FT'RTI{ERMARGINALISATION OF THE INDIANS
K. AnbalakanSchool of HumanitiesUniversiti Sains MalaysiaPenang
INTRODUCTION
The two fundamental objectives of the New Economic Policy (NEP) werethe eradication ofpoverly irrespective ofrace and the restructuring ofthesociety so as to eliminate the identification of a race with its economicfunctions, a legacy of the colonial times. The eradication of poverty andthe restructuring of society, it was argued, would help foster nationalunity - the overriding objective of the whole policy. These objectiveswere to be achieved by redistributing the wealth of the nation equitablyamong all the major races. Thus, in twenty years, it was estimated that thebumiputera should be enjoying a 30 percent stake and the non-bumiputera 40 percent leaving the remaining 30 percent for theforeigners. Promises were made to the effect that no one race would beunduly discriminated against in pursuing these objectives and all wouldbenefit as the economy was expected to grow with the implementation ofthe NEP (Mid Term Review, Second Malaysia Plan [MTR-2MP 1973:85-871). This assurance gave the Indian community, which at that timewas holding a miserable one percent stake in the nation's economicwealth, some hope about its future economic position. However, in 1990,when the NEP officially came to an end, the community's stake remainedstagnated at one percent. The National Development Policy (NDP) andthe National Vision Policy (NVP), which were formulated thereafter, too,did not improve any significantly the Indian community's economicposition. This article analyses the position of the Indian community underthe NEP.
379
K. Anbalakan
THE BACKGROUND TO THE NEP
It has become a trend in Malaysian political economy discourses to
closely associate the NEP with the 1969 May l3'n racial riot. It is often
u.gu.d that the racial clash was the result of continuous neglect of Malay
economic interest by the ruling Alliance government. Sometimes, it is
claimed that the May 13 incident was a watershed in the political and
economic history of Malaysia because only after that the economic
policies of the nation began to give due consideration towards the
iconomic upliftment of the Malay community. Well, while there ought to
be some truth in all these, however, to suggest that the riot was purely a
racial clash due to deep-seated frustrations of the economically deprived
Malay community is not at all plausible.
In the first place, the claim that Malay interests had all through been
completely neglected and that only after the riots did the government
began to take measures to overcome the economic backwardness of the
community is not true. Actually, the Malay grouses about economic
backwardness. too, was not new. There had been gross dissatisfaction
among the Malay leaders over the community's economic position even
before independence. The British introduced a couple of measures,
though haphazardly and arbitrarily, to help the community. In 1917, for
instance, the Land Reservation Act was enacted to protect Malay
ownership of agricultural land. In 1950, Rural Industrial Development
Authority (RIDA) was established to enhance rural development. Six
years later, Federal Land Development Authority (FELDA) was formed
io initiate large scale agricultural land development projects. The Malays,
too, were given preferential status when it came to awarding of
educational scholarships and jobs in the civil service. Yet, the
community's economic position did not improve much.
After independence, the Alliance government continued to give special
considerations for the economic upliftment of the Malays in all its
economic programmes. The Ministry of Rural Development was
established to specifically take care of Malay economic interests. Under
the First Malaya Plan (1956-1960), for instance, some RNI227 millions
was allocated for rural development. This was increased to RM468
millions under the Second Malaya Plan of 1961-1965 (Snodgrass 1980:
47-50). The First Malaysia Plan (1965-1970) went even further to help
the Malays. It incorporated almost all of the recommendations put forth
380
The Further Marginalisation of the Indians
by the First BumiputeraEconomic Conference of 1965. Several agencies,like Majlis Amanah Rakyat (MARA), Institut Teknologi MARA (ITM),
Federal Agricultural Marketing Authority (FAMA), Bank Bumiputraand so on were established to enable the Malay community to improve itseconomic standing. In short, the government had done as much as it couldto improve the economic position of the Malay community. Yet,unfortunately, while the agricultural sector registered remarkableimprovements, the majority of the Malays remained relatively poor (see
As it is, the argument that the main cause of the riot was the economicdeprivation of the Malay community is not tenable. Rather, it waspolitical factors that had caused the riot. It was the poor performance ofthe Alliance Party, or more accurately the United Malayan NationalOrganisation (UMNO), in the general elections that was held on the l0'h
of May 1969 that paved way for the clashes. In that elections, theAlliance which had ruled the country for twelve years since independencewithout much trouble was able to garner only 49.1 percent of the totalvotes cast compared to 58.5 percent it had received in 1964. Besides, ithad also lost the state of Penang to the Gerakan Rakyat Party and failed toregain back the predominantly Malay state of Kelantan from Parti IslamSe Tanah Melayu (PAS). ln two other states its position was uncertain. InPerak, it won only 19 out of the 40 seats while in Selangor it got only 14of the 28 seats (Ismail Kassim 1979: 9). Therefore, its victory in manyother seats, both state as well as parliament, was marginal' In total, theAlliance had lost 22 of the 89 parliament seats of which 7 were UMNO's,14 Malaysian Chinese Association (MCA)'s and one Malaysian IndianCongress (MIC) seat (Snodgrass 1980: 54).
Of course, many of the UMNO leaders argued that the poor performanceof the Alliance Party was a reflection of the Malay anger anddisappointment over their economic backwardness. But, it must beremembered that the Alliance Party's showing in the 1959 elections, too,was not as sood as its achievement in the earlier one held in 1955'.
I In fact, in the 1959 general elections, the Alliance lost both Kelantan andTerengganu, the two predominantly Malay states in the East coast, to the Pan
Malayan Islamic Party. It may also be noted here that UMNO had once againlost the state of Terengganu to PAS in the 1999 general elections despite
3 8 1
K. Anbalakan
However, in 1964 the parfy was able to recoup lost ground. It was alsoargued that in the 1969 elections, the Alliance was able to get only 54percent of the Malay votes as compared with 67 percent in 1964. Butthen, the non-Malay votes too had decreased. Only about 43 percent ofthe non-Malays had voted for the Alliance compared to some 48 percentin the 1964 elections (Snodgrass 1980: 55). That aside, the MCA had lostmore seats to the opposition Chinese parties like Democratic Action Party(DAP) and Gerakan then what had UMNO to PAS2. It must also be notedthat most of the MCA seats were in the predominantly Chinese urbancentres. Also not to be forgotten was that Penang was under the MCArule prior to the 1969 elections. What are we to decipher from this? Is itall right to suggest that the Alliance Party's poor results were purely dueto the economic backwardness and disappointment of the Malaycommunity alone? How are we to explain the defection of the Chinesevotes? Were they too angry with the Alliance government over economicgrievances?
Obviously, it was the Alliance Party's poor elections result and thevictory celebration by the opposition parties, especially DAP andGerakan, that created a provocative climate which later led to the flaringup of racial tensions. The fact that both DAP and Gerakan werepredominantly Chinese parties had made the situation worse. Thus, thesupposedly political skirmish between the disappointed Alliance and thejubilant opposition parties, unforfunately, turned out to be a racialbloodshed. Worse still, it was seen more as a clash between the Malaysand the Chinese though the Indians too were very much involved in it.
TIIE NEP AND TIIE INDIANS
As mentioned above, the government gave assurance that the NEP wasimplemented for the benefit of all Malaysians irrespective of race andreligion. It was categorically stated that the programme was designed toreduce and ultimately do away with the economic imbalances betweenthe various communities by redistributing the wealth of the nation in a
having brought in tremendous economic benefits to the Malay communitythrough NEP.
' As has been noted above in page one, the MCA had lost 14 seats while UMNOlost 7 only.
382
\!
i
The Further Marginalisation of the Indians
more equitable way. Nevertheless, from the very beginning the Indianshad felt that the NEP was purely a pro-Malay instrument to promote theinterests of the Malays alone.
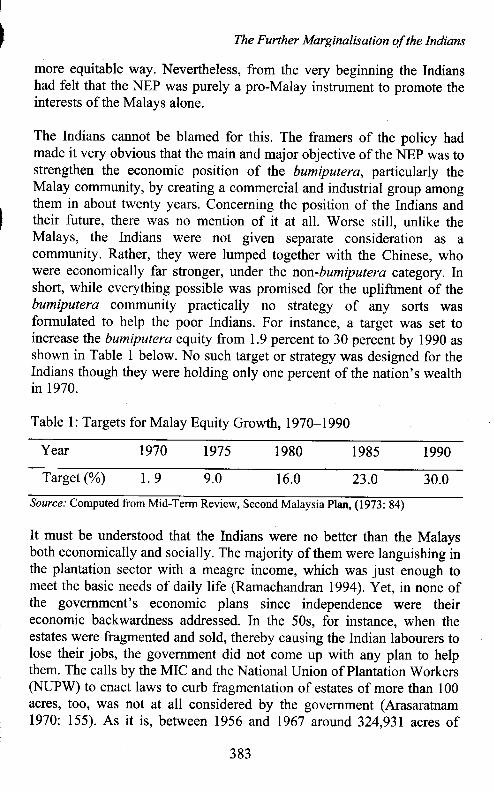
The Indians cannot be blamed for this. The framers of the policy hadmade it very obvious that the main and major objective of the NEP was tostrengthen the economic position of the bumiputera, particularly theMalay community, by creating a commercial and industrial group amongthem in about twenty years. Conceming the position of the Indians andtheir future, there was no mention of it at all. Worse still, unlike theMalays, the Indians were not given separate consideration as acommunity. Rather, they were lumped together with the Chinese, whowere economically far stronger, under the non-bumiputera category. Inshort, while everything possible was promised for the upliftment of thebumiputera community practically no strategy of any sorts wasformulated to help the poor Indians. For instance, a target was set toincrease the bumiputera equity from 1.9 percent to 30 percent by 1990 asshown in Table 1 below. No such target or strategy was designed for theIndians though they were holding only one percent of the nation's wealthin 1970.
Table l: Targets for Malay Equity Growth, 1970-1990
Year 1970 1975 1980 1985 1990
Target (%o) 1 . 9 9.0 16.0 23.0
Source: Computed from Mid-Term Review, Second Malaysia Plan, (1973: 84)
It must be understood that the Indians were no better than the Malaysboth economically and socially. The majority of them were languishing inthe plantation sector with a meagre income, which was just enough tomeet the basic needs of daily life (Ramachandran 1994). Yet, in none ofthe government's economic plans since independence were theireconomic backwardness addressed. In the 50s, for instance, when theestates were fragmented and sold, thereby causing the Indian labourers tolose their jobs, the government did not come up with any plan to helpthem. The calls by the MIC and the National Union of Plantation Workers(NUPW) to enact laws to curb fragmentation of estates of more than 100acres, too, was not at all considered by the government (Arasaratnam1970: 155). As it is, between 1956 and 1967 arowd 324,931 acres of
30.0
383
K. Anbalakan
estates were fragmented and sold as small holdings causing some 28,363
labourers, majority of whom were Indians, to lose their jobs'
Furthermore, the displaced Indians were unable to find alternative jobs as
they did not possess the necessary skills. Due to this, the unemployment
rate among the Indians in 1967 was among the highest, registering at 12.3
percent (Stenson 197 0: 203-204).
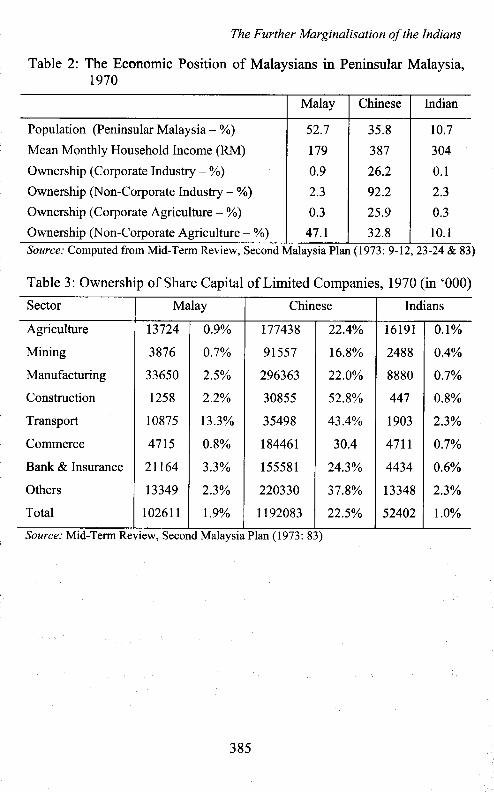
In 1970, the time the NEP was formulated, the economic position of the
Indians in general was worse than the Malays. Yet, the framers of the
NEP seemed to have assumed that the Indians were economically far
better off than the Malays. For instance, as could be seen from Table 2,
the mean household monthly income of the Indian community had been
stated as RM304, which was far higher than the Malays' RMl79 and
close to the Chinese' RM387. This, to say the least, is very misleading
and does not reveal the actual economic position of the community in
1970. It must be remembered that the majority of the Indians were
employed in the plantation sectors and other low paying jobs in the urban
and sub-urban areas. In fact, according to the Second Malaysia Plan Mid-
Term Review (1973: 13) itself, in 1970, the Indians formed only about
4.3 percent of the professional and management group, while there were
12 percent Malays and 72 percent Chinese in this group. Similarly, the
percentage oflndians in the technical and supervisory category was only
6.1 percent compared to 20 percent of Malays and 73 percent Chinese.
Besides, a quick glance at the ownership pattern as shown in Tables 2 and
3 confirms that the Indians were not any better off than the Malays and
nowhere near the Chinese. The Indians were holding only 1.0 percent of
the country's wealth compared to 1.9 percent by the Malays and 22.5
percent by the Chinese communitY.
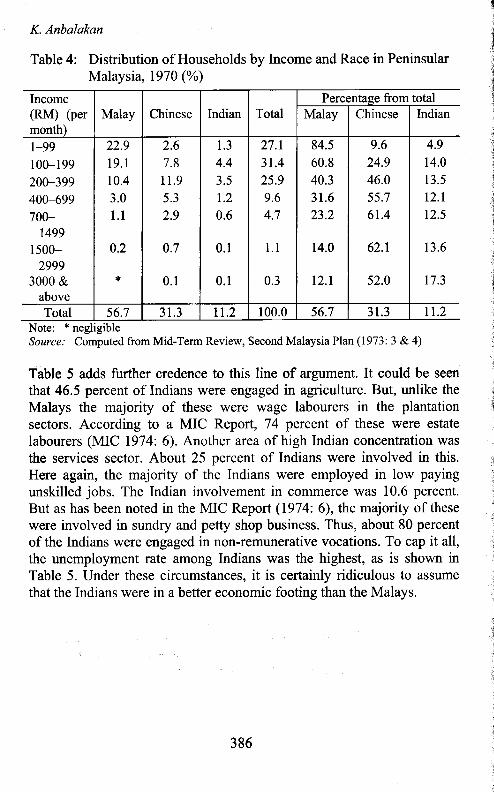
Furthermore, as could be seen from Table 4, the Indians could not be said
to have fared well in the area of household income. Compared to the
other communities in 1970, their position looked very precarious. Only
about 12 percent of the Indians were in the middle income bracket of
RM400-699. There were 33 percent of Malays and 56 percent of Chinese
in this category. Also close to 40 percent of the Indian households were in
the RMl00-199 category. On the whole, in none of the income brackets
the Indians were better than either the Malays or Chinese.
384
The Further Marginalisation of the Indians
Table 2: The Economic Position of Malavsians in Peninsular Malavsia.1 970
Malay Chinese lndian
Population (Peninsular Malaysia - %)
Mean Monthly Household Income (RM)
Ownership (Corporate Industry - %)
Ownership (Non-Corporate Industry - %)
Ownership (Corporate Agriculture - %)
Ownership (Non-Corporate Agriculture - o/o)
52.7
r790.9
2.3
0.3
47. l
3s.8387
26.2
92.2
2s.9
32.8
10.7
304
0 . 1
2.3
0.3
10.1Source: Computed from Mid-Term Review, Second Malaysia Plan (1973: 9-12,23-24 & 83)
Table 3: Ownership of Share Capital of Limited Companies, 1970 (in'000)
Sector Malay Chinese Indians
Agriculture
Mining
Manufacturing
Construction
Transport
Commerce
Bank & Insurance
Others
Total
13724
3876
33650
1258
10875
4715
21164
t3349
l026tl
09%
0.7%
2.5%
2.2%
t33%
0.8%
5 , J Y o
23%
r.9%
177438
9r557
296363
30855
35498
184461
I 5558 I
220330
1192083
22A%
16.8%
22.0%
52.8%
434%
30.4
243%
37.8%
22.5%
1 6 1 9 1
2488
8880
447
1903
4 7 t l
4434
13348
s2402
0. t%
0.4%
0.7%
0.8%
2.3%
0.7%
0.6%
23%
1.0%
Source: Mid-Term Review, Second Malaysia Plan (1973: 83)
385
Income(RM) (permonth)
Malay Chinese Indian TotalPercentase from total
Malay Chinese Indian
r-99100-199200-399400-699700-
r4991500-
29993000 &
above
22.9l 9 . l10.43.0l . l
0.2
rt
2.61 .8I 1 . 95 .32.9
0.7
0 .1
1.34.43.51.20.6
0.1
0.1
27.131.425.99.64.7
1 . 1
0.3
84.560.840.33r.623.2
14.0
t 2 . l
9.624.946.055.761.4
62.r
52.0
4.914.013.5t2 . l12.5
13.6
17.3
Total 56.7 3 1 . 3 |t.2 100.0 56.7 3 1.3 tt.2
K. Anbalakan
Table 4: Distribution of Households by Income and Race in PeninsularMalaysia, 1970 (%)
Note: * negligibleSource: Computed from Mid-Term Review, Second Malaysia Plan(1973:3 & 4)
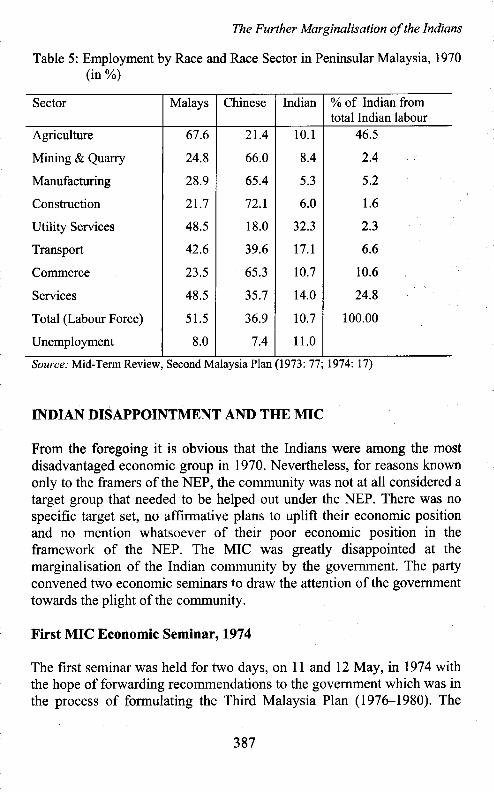
Table 5 adds further credence to this line of argument. It could be seenthat 46.5 percent of Indians were engaged in agriculture. But, unlike theMalays the majority of these were wage labourers in the plantationsectors. According to a MIC Report, 74 percent of these were estatelabourers (MIC 1974:6). Another area of high Indian concentration wasthe services sector. About 25 percent of Indians were involved in this.Here again, the majority of the Indians were employed in low payingunskilled jobs. The Indian involvement in commerce was 10.6 percent.But as has been noted in the MIC Report (1974:6), the majority of thesewere involved in sundry and petty shop business. Thus, about 80 percentof the Indians were engaged in non-remunerative vocations. To cap it all,the unemployment rate among Indians was the highest, as is shown inTable 5. Under these circumstances, it is certainly ridiculous to assumethat the Indians were in a better economic footing than the Malays.
386
The Further Marginalisation of the Indians
Table 5: Employment by Race and Race Sector in Peninsular Malaysia, 1970(in%)
Sector Malays Chinese Indian % of Indian fromtotal Indian labour
Agriculture
Mining & Quarry
Manufacturing
Construction
Utility Services
Transport
Commerce
Services
Total (Labour Force)
Unemployment
67.6
24.8
28.9
2 r . 7
48.5
42.6
23.5
48.5
5 1 . 5
8.0
21.4
66.0
65.4
72.1
18.0
39.6
6s.335.7
36.9
7.4
l 0 . l
8.4
5.3
6.0
32.3
t 7 . l
10.7
14.0
10.7
1 1 . 0
46.5
2.4
5.2
1 .6
2.3
6.6
10.6
24.8
100.00
Source: Mid-Term Review, Second Malaysia Plan (1973: 77;1974: 17)
INDIAN DISAPPOINTMENT AND THE MIC
From the foregoing it is obvious that the Indians were among the mostdisadvantaged economic group in 1970. Nevertheless, for reasons knownonly to the framers of the NEP, the community was not at all considered atarget group that needed to be helped out under the NEP. There was nospecific target set, no affirmative plans to uplift their economic positionand no mention whatsoever of their poor economic position in theframework of the NEP. The MIC was greatly disappointed at themarginalisation of the Indian community by the government. The partyconvened two economic seminars to draw the attention of the govemmenttowards the plight of the community.
First MIC Economic Seminar, 1974
The first seminar was held for two days, on l1 and I2May, n 1974 withthe hope of forwarding recommendations to the government which was inthe process of formulating the Third Malaysia Plan (1976-1980). The
387
K. Anbalakan
seminar targeted a growth of 2.25 percent every five years and hoped toachieve l0 percent equity by 1990 as shown below.
Table 6: Equity Growth Target for the Indian Community,1970-1990
,i
j
1
Year 1970 t975 1980 r985 1990
Total Share Capital*
Indian Equity
Percentage
5,289
52.9
1 . 0
8 , 6 6 3
281 .5
3.25
14,624
804.3
5.50
25,650
1987.9
7.75
46,821
4682.1
10.0
Note: * in RM millionSource: MIC (1974: I4)
The seminar reminded the government that the Indians were not at allbenefiting from the NEP and largely remained left out of the economicgrowth of the nation. At the end of the seminar, a blueprint containingrecommendations for the economic upliftment of the Indians wassubmitted to the government. The blueprint, among other things urged thegovernment to formulate specific policies to increase the Indian positionin the country's economy from 1.0 percent to l0 percent by 1990 andrequested an allocation of 10 percent of all newly listed shares in themarket to the community. It was also suggested that the estates bebrought under the purview of the Rural Development Ministry so that theeconomic problems of the estate labourers could be effectively addressed.The government was also requested to absorb the displaced estatelabourers under the FELDA scheme (MIC 1974: ll,12 &27).
The MIC had hoped that at least some of its request would beincorporated in the Third Malaysia Plan (1976-1980) that was beingframed just around that time. In fact, the MIC President, Tan Sri V.Manickavasagam, had openly expressed this hope in his opening speechat the seminar (MIC 1974: l). But, the government did not take note ofthese recommendations. According to one report (Ramachandran 1994:307) the then Prime Minister, Tun Abdul Razak, did not show anyinterest towards the MIC's blueprint. As such, none of the MIC's requestswere given consideration in the Third Malaysia Plan. However, anassurance was given to the effect that the government was not unaware ofthe Indian community's economic backwardness and action would betaken to elevate their problem (Third Malaysia Plan 1976:47,74, 159,
388
The Further Marginalisation of the Indians
165-167 & 177). Unfortunately, for the entire period of the ThirdMalaysia Plan nothing specific was done to assist the community.
Second MIC Economic Seminar, 1980
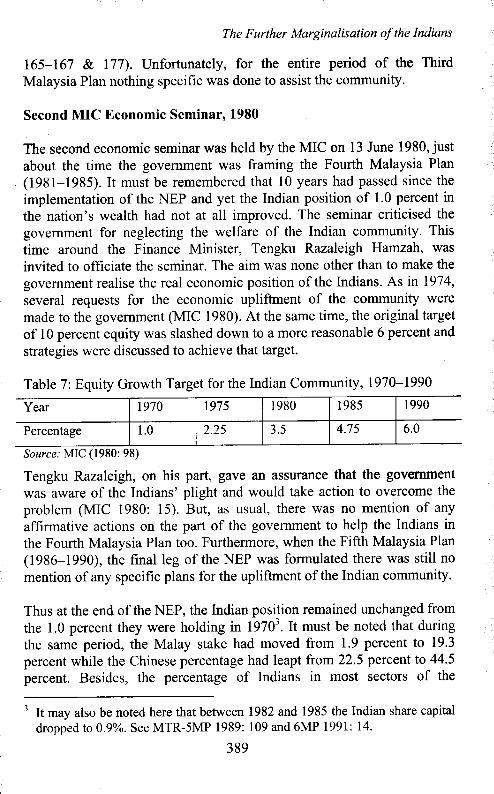
The second economic seminar was held by the MIC on 13 June 1980, just
about the time the government was framing the Fourth Malaysia Plan(1981-1985). It must be remembered that l0 years had passed since theimplementation of the NEP and yet the Indian position of 1.0 percent inthe nation's wealth had not at all improved. The seminar criticised thegovernment for neglecting the welfare of the Indian community. This
time around the Finance Minister, Tengku Razaleigh Hamzah' was
invited to officiate the seminar. The aim was none other than to make thegovernment realise the real economic position of the Indians. As in 1974,
several requests for the economic upliftment of the community were
made to the government (MIC 1980). At the same time, the original target
of 10 percent equity was slashed down to a more reasonable 6 percent and
strategies were discussed to achieve that target.
Table 7: Equity Growth Target for the Indian Community,1970-1990
Year 1970 r975 1980 I 985 1990
Percentage 1 . 0 2.25 3.5 4.75 6.0
Source: MIC (1980: 98)
Tengku Razaleigh, on his part, gave an assurance that the government
was aware of the Indians' plight and would take action to overcome theproblem (MIC 1980: 15). But, as usual, there was no mention of any
affirmative actions on the part of the government to help the Indians in
the Fourth Malaysia Plan too. Furthermore, when the Fifth Malaysia Plan(1986-1990), the final leg of the NEP was formulated there was still no
mention of any specific plans for the upliftment of the Indian community.
Thus at the end of the NEP, the Indian posilion remained unchanged from
the 1.0 percent they were holding in 1970i. It must be noted that during
the same period, the Malay stake had moved from 1.9 percent to 19.3percent while the Chinese percentage had leapt from 225 percent to 44.5percent. Besides, the percentage of Indians in most sectors of the
3 It may also be noted here that between 1982 and 1985 the Indian share capitaldropped to 0.9Yo. See MTR-5MP 1989: 109 and 6MP 1991: 14.
389
K. Anbalakan
economy had dwindled during this period. As could be stieri from Table 8below, the NEP had worked against the interest of the Indians in almostall sectors of employment. The acclaimed objective of abolishing theidentification ofa race by its vocation had not at all been effective in thecase of the Indians. Rather, they remained categorised as the labouringcommunity even at the end of the NEP. As Ramasamy (1999: 30) puts it,the mobility of the Indians under the NEP was horizontal and not vertical.Thus, if in 1970 they were associated with the estates, now, after twentyyears ofsocial engineering by the government, they had an added label asthe proletariat, largely engaged in menial odd jobs in the urban and semi-urban sectors.
Table 8: Employment by Occupation and Ethnic Group, 1970, 1985, 1990Race Bumiputera Chinese Indians
Total 51 .8 57.3 57.8 36.6 ) J . Z 32.9 10. 6 8 . 8 8 . 5
Source: Fourth Malaysia Plan (1981: 59, 6MP, l99l:34)
THE POST NEP PERIOD
The NEP officially ended in 1990. The government claimed that the mainobjectives of poverty eradication and restructuring of society had beenachieved to a remarkable level. Nevertheless, the government was quickto add that the affirmative policies to alleviate the bumiputera economicposition would be continued in future policies too. As the targeted 30percent share capital ownership for the bumiputera was not attained under
390
The Further Marginalisation of the Indians
the NEP it was indicated that continued emphasis would be given towardsachieving this. Surprisingly, nothing was mentioned about the patheticperformance of the Indians under the NEP. The fact that the communityhad stagnated at the miserable one percent was not at all recognised as aproblem. Rather, disappointment were expressed from somegovernment's UMNO quarters on the failure to attain the targeted 30percent for the bumiputera community and calls were made to enhancestrategies to improve the Malay position further.
However, the National Economic Consultative Council OrECC) that wasformed in 1985 to appraise the performance of the NEP and recommendsuggestions to overcome its shortcomings in the National DevelopmentPolicy (NDP) which was to replace the NEP, took note of the poorprogress made by the Indians under the NEP. In its final report, theNECC had expressed concern that the Indian community as a whole hadnot benefited much under the NEP. It had explicitly mentioned that theIndians' involvement in many of the sectors of employment was grosslydisproportionate to their population (Semparuthi 1999:4). To overcomethis, the NECC recommended that some affirmative policies similar tothose designed for the Malays must be initiated in the NDP. Therecommendations of the NECC, inter alia, includeda:
o awarding of monthly wages to the estate workers5. opening of kindergartens in estateso converting all the partially-aided Tamil schools into fully-aidedo providing technical skills to Indian youths in the estateso enabling the Indians to set up a bank. enabling the Indians to invest in share market by providing credit
facilities
Unfortunately, as in the past, the government did not show seriousinterest to the NECC's recommendations on Indians. In his forward toThe Second Outline Perspective Plan 199l-2000 (OPP2), whichembodies the structure of the NDP, the Prime Minister. Datuk Seri Dr.
o For an elaboration see Semparuthi 1994:4.5 In February 2001, almost after a decade it was announced that the estate
workers would finally be paid a monthly wage. However, the RM325.00agreed upon was much lower than the Poverty Line Index (PLI) which wasRM510 for a household size of 4.6 in Peninsular Malaysia (see 8MP 2001: 58).
39r
K. Anbalakan
Mahathir Mohamad, while thanking the NECC for its useful ideas and
suggestions had specified that "not all of their recommendations have
bein accepted". And as usual, mention was made in oPP2 to the effect
that the government was aware of the Indian economic backwardness. To
quote verbatim from the OPP2 (1991: 1 1),
However, in the case of the Indians, their share in some of theprofessions is below their population ratio' In those professionswhere they are well represented, the increase in absolute termshas been much slower than that for the bumiputera and theChinese. As a result, the share of Indian employment in theseprofessions has declined continuously since 1970'
As could be noted from the above, the government even after having
agreed that the position of the Indians was really bad did not give any
urrurun." as to what was going to be done to overcome this sorry state of
affairs. In fact, this was what the government had done in all its five year
plans between 1970 and 1990. It was not surprised that this trend
continued even after the NEP. In that context, it may not be out of place
to have a glance at how the government viewed the economic position of
the bumiputera, of more specifically the Malays. The first half of the
above quoted paragraph reads:
While bumiputera account for the largest share of public sectoremployment and predominate in the uniformed services, the
clerical and secretarial services and the teaching profession, thenon-Bumi are well represented in the professional and technicalcategories, particularly in the medical, engineering andaccountancy services. In the light of the above, there is anurgent need to expand the supply of bumiputera professionaland technical manPower."
It must be emphasised here that the aim of quoting the above is not to
take issue with the government's initiative to help out the bumiputera
community, but, rather to point out that the interests of the Indians,
perhaps also of the Chinese, had consistently been neglected in all of the
government'S frve year economic plans. As a result of this neglect, the
economic position of the Indian community in general continued to
'i
"!
6 Emphasis added from the original texl
392
The Further Marginalisation of the Indians
deteritirate under the NDP and NVP. Tables 9, 10, 1l and 12 belowexplain the position of the Indians under the NDP and NVP.
Table 9: Employment of Indians by Sector, 1990-2000 (in%)
Sector/Years 1990 t993 t99s 1998 2000
Agriculture
Mining/Quarry
Manufacturing
Construction
Electricity. Gas & Water
Transport
Commerce
Finance & Insurance
Other Services
Total Employed
Unemployment
7.9
9.2
1 1 . 1
5 .8
17.0
l 5 . l
t . )
9.9
7.9
8.8
8 .3
6.3
7 . 1
t2.9
5.2
13.3
t3.4
6.7
9 .1
1 . 5
8.5
7.6
6.0
10.5
rt.24.7
l l . l
l l.1
6 .1
9.3
6.8
7 .9
6.6
5.9
9 .5
I 1 . 8
4.8
I r . 9
12.3
6.s9.6
6.9
8.3
7.8
6 .1
10.2
tt.4
4.7
I 1 . 3
t2.0
6.7
9.9
7 .1
8.3
7.0
Unemployment Rate 4.8 2.7 3 .6 2 .7
Source: Mid-Term Review, Sixth Malaysia Plan (1999: 76-77) and Eighth Malaysia Plan(2001:66)
Table l0: Employment of Indians by Occupation, 1990-2000 (in %)
Occupatior/Years 1990 1993 1995 1998 2000
Prof. & Technical
Teachers & Nurses
Admin & Managerial
Clerical
Sales
Services
AgricultureProduction
7.8
6.4
4.3
8.7
7 . 1
9.5
7.910.9
7 .7
6.5
5.0
7.9
6.6
8.7
6.71 1 . 8
7 .0
6.6
4.8
7.4
6.2
8.2
6.99.6
8.4
7.0
6 .1
9.3
6.3
8.2
6.99.7
7.6
6.9
).)
8.6
6.8
8.5
6.910.0
Total 8.8 8.5 7.9 8.3 8.3
Source: Mid-Term Review, Sixth Malaysian Plan (1993: 65), Seventh Malaysia Plan(1999: 78-79) and Eighth Malaysia Plan (2001 : 79)
393
K. Anbalakan
Table I 1: Percentage of Indian Involvement by Occupation, 1990-2000
.:
,
Occupation 1990 t993 r995 1998 2000
Prof. & Technical
Teachers & Nurses
Admin & Managerial
Clerical
Sales
Services
Agriculture
Production
7.8
2.4
1 .2
9.7
9.3
12.6
25.4
34.r
8.2
2.6
1 .6
9 . 1
9.3
12.6
20.0
39.3
8 .8
2.9
1 . 9
10.2
8.6
I 1 . 5
17.7
41.3
10.9
3 . 1
2.9
t2.4
8.2
I 1 . 5
15.9
38.2
10.9
3 .0
3.2
12.0
8 . 1
I 1 . 8
14.3
39.7
Total 100 100 100 100 100
Source: Computed from Mid-Term Review, Sixth Malaysia Plan (1993: 64-65), Seventh
Malaysia Plan (1999: 78-79) and Eighth MalaysiaPlan(2001:66-67)
Table 12: Ownership of Share Capital of Limited Companies, 1990-1995(in RM million)
Race 1990 % 1995 % GrowthRate
AbsoluteGrowth
BumiputeraChineseIndiansOthers
20,877.549,296.01,068.0389.5) 1 \ ) S \
19.345.51 . 00.32s.4
36,981.273,552.72,723.11 , 7 5 1 . 149.792.7
20.640.91 . 51 . 027.7
12. r8.320.635. I12.6
16,t03.124,256.71 ,655.11,361.622.267.2
Source: Seventh Malaysia Plan (1996: 86)
CONCLUSION
The government had repeatedly emphasised that the oveniding mission ofits social engineering policies - the NEP, NDP and NVP - was nationalunity. It was stressed that the restructuring of society, and ensuring anequitable distribution of the nation's wealth among all the major ethnicgroups, would strengthen inter-ethnic relations and help forge nationalunity. However, as has been argued and substantiated with statistics in theforegoing there had been extraordinary preoccupation on the part of thegoveflrment to favour the bumiputera, especially the Malays in all the
394
The Further Marginalisation of the Indians
three programmes. So much so, that the interest of other weaker groups,particularly the Indians, had been neglected. Not to say that the otherMalaysian had not at all benefited from the government policies. TheChinese community, for instance, had almost doubled its economicstrength. But then, this was largely due to the strong economicfundamentals that the community enjoyed since before the launch of theNEP. The Indians too, had enjoyed some benefits. Again, this was notdue to genuine efforts on the part _of the government but from the spillover of the pro-bumiputera projects' .
If the government had been serious in helping the Indian community thensome attention should have been paid to the Indian poverty in theplantation sector. The majority of Indians were languishing in poverfy inthe estates. It is not that the government did not know of it. Thecommunity leaders had at several occasions brought to the attention of thegovernment the plight of the estate workers. At both economic seminarsof the MIC, the government had been requested to include the estatesunder the purview of the Rural Development Ministry. It must be notedthat about 35 percent of the budget of all the economic programmes hadbeen allocated for rural development (Ramachandran 1994: 329). Forinstance, the estimated development expenditure for rural and agriculturaldevelopment was RM2,279,000 under the Second Malaysia Plan. In thenext three plans the allocations had been significantly increased toRN16,448,250, RM7,888,200 and 11,799,850 respectively (see 2MP -
5MP). The major share of the allocations for the eradication of ruralpoverty was utilised specifically for the alleviation of the lot of theMalays only.
It was fervently hoped by the Indians that if the estates were to be placedunder the Rural Development Ministry, perhaps, they too could benefit alittle from these allocations. But, the government up to now has beenrefusing to consider this proposal by hiding behind the old lame excuse
' The MIC Presiden, Datuk Seri S. Samy Vellu had once commented that underthe NEP the Chinese had improved because they had strong economicfoundations and the Malays because of govemment support whereas theIndians had none of these (Tan Chee Khoon 1984: 157). On 28 September1989 he had said that the failure of the govemment to initiate any affirmativeaction was the cause of Indian backwardness (see SemparuthiNovember 1999:2) .
395
K. Anbalqkan
that the plantations were private properties and it was for the estates
owners to cater for the well being of their workers. unfortunately, the
govemment did not take any action to coax the estate management to
i-p.ou" the social amenities in the estates.t With the same justifications
the government has also been refusing to absorb all those Tamil schools
in the estates as fully-aided government schools. In conclusion it could be
said that, unless the government is willing to change its perception of the
Indian economic backwardness and formulate some kind of affirmative
policy to alleviate the community's economic misery the Indians will
remain a marginalised group. This in turn will continue to create a
conducive environment for more and more social problems among the
youths of the community.
REF'ERENCES:
Arasaratnam, S., 1970, Indians in Malaysia and Singapore, London:
Oxford University Press.
Ismail Kassim, 1979, Race, Politics and Moderation: A Study of the
Malaysian Electoral Process, Singapore: Times Book International.
Malaysia, 1971, Second Malaysia Plan, 1970-1975, Kuala Lumpur:
Government Printers.
-, 1973, Mid-Term Review of the Second Malaysia Plan, l97l-1975,
Kuala Lumpur: Government Printers.
-, 1976, Third Malaysia PIan, 1976-1 980, Kuala Lumpur: Govemment
Printers.
-, lg7g, Mid-Term Review of the Third Malaysia Plan, 1976-1980,
Kuala Lumpur: Government Printers.
8 According to one report in 1995, the health facilities provided in some estates
were worse than those available in the 50s (The star 25 June 1995). The
situation did seem to have improved even in 1999 (see Dr. Krishnan, the past
President of Malaysian Medical Association [MMA], in The Star,24 October
1999).
396
tt
j
1:
1.:
The Further Marginalisation of the Indians
*s 1981, Fourth Malaysia Plan, 1981-1985, Kuala Lumpur:Government Printers.
-,1986, Fifth Malaysia Plan, 198G1990, Kuala Lumpur: GovernmentPrinters.
-, 1989, Mid-Term Review of the Fifth Malaysia Plan, 198G1990'Kuala Lumpur: Government Printers.
-,I99I, Sixth Malaysia PIan, 1991-1995, Kuala Lumpur: GovernmentPrinters.
-, 1991, The Second Outline Perspective Plan, 1991-2000, KualaLumpur: Government Printers.
-, lgg3, Mid-Term Review of the Sixth Malaysia Plan, IggFlggsKuala Lumpur: Government Printers.
-s 1996, Seventh Malaysia Plan, 1996-2000, Kuala Lumpur:Government Printers.
-, lg9g, Mid-Term Review of the Seventh Malaysia PIan, 1996-2000,Kuala Lumpur: Government Printers.
-t 2001, Eighth Malaysia Plan 2001-2005, Kuala Lumpur:Government Printers.
-, 2001, The Third Outline Perspective Plan, 2001-2010, KualaLumpur: Government Printers.
Malaysian Indian Congress, 1974, Dasar Ekonomi Baru dan MalaysianIndians: Rantindak MIC. Kuala Lumpur, 30 June.
-,1975, Kemukakan kepada Jawatankuasa Kabinet tentang pelajaran.Kuala Lumpur, 28 Januari.
-, 1980, Declaration and Recommendations, Second Malaysian IndianEconomic Seminar, Kuala Lumpur, 13 July.
397
K. Anbalakan
Ramachandran, S., 1994, Indian Plantation Labour in Malaysia, Kuala ,Lumpur.