THE JOURNAL OF FINANCE • VOL. LXV, NO. 2 • APRIL 2010 The New Game in Town: Competitive Effects of IPOs HUNG-CHIA HSU, ADAM V. REED, and J ¨ ORG ROCHOLL ∗ ABSTRACT We analyze the effect of initial public offerings (IPOs) on industry competitors and provide evidence that companies experience negative stock price reactions to com- pleted IPOs in their industry and positive stock price reactions to their withdrawal. Following a successful IPO in their industry, they show significant deterioration in their operating performance. These results are consistent with the existence of IPO- related competitive advantages through the loosening of financial constraints, finan- cial intermediary certification, and the presence of knowledge capital. These aspects of competitiveness are significant in explaining the cross-section of underperformance as well as survival probabilities for competing firms. AN EXTENSIVE LITERATURE analyzes the performance of companies around their initial public offerings (IPOs). This literature focuses on returns on the first day of trading, as well as on returns and operating performance for the 5-year period after the IPO. For example, Ibbotson and Jaffe (1975) document a positive initial return for newly issued companies, while Ritter (1991) analyzes the long- run stock price performance of IPOs and Jain and Kini (1994) consider firms’ post-IPO operating performance. Our article adds a new dimension to this literature by considering not only the stock market and operating performance of the issuing company, but also the impact of the IPO on the performance of industry competitors. The competitive effects of IPOs have important implications for various agents including investors, industry competitors, and issuing firms. Issuing companies comprise a relatively small portion of portfolio value; in this arti- cle’s sample, for instance, existing and publicly traded firms comprise 97.5% of the total post-IPO market capitalization of industries in which IPOs occur, while IPO firms comprise only 2.5%. It is therefore important for investors to know how an IPO affects the operating and stock market performance of ∗ Hung-Chia Hsu is with the University of Wisconsin Milwaukee. Adam V. Reed is with the University of North Carolina at Chapel Hill. J¨ org Rocholl is with ESMT European School of Man- agement and Technology. The authors thank Ken Ahern, Diane Del Guercio, Paolo Fulghieri, Eitan Goldman, David Goldreich, Jarrad Harford, Cam Harvey (the Editor), Matthias Kahl, Adam Kolasinski, Jennifer Koski, Wayne Mikkelson, Harold Mulherin, Lars-Hendrik R¨ oller, Maya Wais- man, an anonymous Associate Editor, an anonymous referee, and seminar participants at the University of North Carolina, University of Oregon, University of Washington, the 2007 FMA Meetings in Orlando, 2008 EFA Meetings in Athens, Fifth Annual Conference on Corporate Fi- nance at Washington University in St. Louis, and 2009 AFA Meetings in San Francisco. 495
Transcript
THE JOURNAL OF FINANCE • VOL. LXV, NO. 2 • APRIL 2010
The New Game in Town: Competitive Effectsof IPOs
HUNG-CHIA HSU, ADAM V. REED, and JORG ROCHOLL∗
ABSTRACT
We analyze the effect of initial public offerings (IPOs) on industry competitors andprovide evidence that companies experience negative stock price reactions to com-pleted IPOs in their industry and positive stock price reactions to their withdrawal.Following a successful IPO in their industry, they show significant deterioration intheir operating performance. These results are consistent with the existence of IPO-related competitive advantages through the loosening of financial constraints, finan-cial intermediary certification, and the presence of knowledge capital. These aspectsof competitiveness are significant in explaining the cross-section of underperformanceas well as survival probabilities for competing firms.
AN EXTENSIVE LITERATURE analyzes the performance of companies around theirinitial public offerings (IPOs). This literature focuses on returns on the first dayof trading, as well as on returns and operating performance for the 5-year periodafter the IPO. For example, Ibbotson and Jaffe (1975) document a positiveinitial return for newly issued companies, while Ritter (1991) analyzes the long-run stock price performance of IPOs and Jain and Kini (1994) consider firms’post-IPO operating performance. Our article adds a new dimension to thisliterature by considering not only the stock market and operating performanceof the issuing company, but also the impact of the IPO on the performance ofindustry competitors.
The competitive effects of IPOs have important implications for variousagents including investors, industry competitors, and issuing firms. Issuingcompanies comprise a relatively small portion of portfolio value; in this arti-cle’s sample, for instance, existing and publicly traded firms comprise 97.5%of the total post-IPO market capitalization of industries in which IPOs occur,while IPO firms comprise only 2.5%. It is therefore important for investorsto know how an IPO affects the operating and stock market performance of
∗Hung-Chia Hsu is with the University of Wisconsin Milwaukee. Adam V. Reed is with theUniversity of North Carolina at Chapel Hill. Jorg Rocholl is with ESMT European School of Man-agement and Technology. The authors thank Ken Ahern, Diane Del Guercio, Paolo Fulghieri,Eitan Goldman, David Goldreich, Jarrad Harford, Cam Harvey (the Editor), Matthias Kahl, AdamKolasinski, Jennifer Koski, Wayne Mikkelson, Harold Mulherin, Lars-Hendrik Roller, Maya Wais-man, an anonymous Associate Editor, an anonymous referee, and seminar participants at theUniversity of North Carolina, University of Oregon, University of Washington, the 2007 FMAMeetings in Orlando, 2008 EFA Meetings in Athens, Fifth Annual Conference on Corporate Fi-nance at Washington University in St. Louis, and 2009 AFA Meetings in San Francisco.
existing firms when making portfolio allocation decisions. Similarly, firms thatcompete with IPO candidates need to understand how the new issuance af-fects their competitive environment and how they can strategically respond toit. Finally, Pagano, Panetta, and Zingales (1998) show for a sample of Italiancompanies that the likelihood of an IPO increases with the size of a companyand the market-to-book ratio in the industry in which a company operates.The latter result suggests that market timing is an important determinant of acompany’s issuance decision. Another important determinant may be the sub-stantial change and improvement in its competitive position from going public.While some private companies compete well with public companies in the sameindustry and thus stay private, other companies may decide to go public to gainadditional competitive advantages.1 In this article, we investigate the returnsand operating performance of publicly traded firms around the time of largeIPOs in their industry. Our results are consistent with the view that issuingfirms have competitive advantages over their publicly traded industry peers,advantages that are related to the IPO itself.
This article has two goals. The first is to measure the performance of pub-licly traded firms around IPOs in their industries. If IPO firms can successfullycompete against publicly traded firms, then we would expect these competitorsto perform worse after the IPO. We show that, indeed, industry competitorsexperience negative stock price reactions around IPOs and a significant deteri-oration in their operating performance after these IPOs. Moreover, as furtherevidence that IPOs are responsible for this underperformance, we show thatwithdrawn IPOs have the opposite effect: publicly traded firms respond posi-tively to the withdrawal of an IPO in their industry.
Our second goal is to explain the underperformance of publicly traded firmsby examining the relation of cross-sectional differences in performance andsurvival to firm competitiveness. We identify several possible determinants ofthe competitive advantage of IPOs over industry peers, including lower lever-age, recent certification by financial intermediaries, and operational differencessuch as higher levels of knowledge capital. We find that the performance andsurvival of publicly traded competitors are both related to all three of thesedeterminants. In what follows, we briefly describe each determinant.
First, as a direct consequence of the IPO, the offering recapitalizes the is-suing firm in a way that generally results in a low debt-to-equity ratio. Lowleverage may give issuing firms an advantage over their more highly leveragedcompetitors by allowing them more flexibility in their investments. This effecthas been documented empirically in papers outside the IPO literature. Forexample, Chevalier (1995) finds an increased incidence of exits of highly lever-aged supermarkets; similarly, Phillips (1995) finds that output is negativelyassociated with debt levels in three industries.2 To the extent that IPO firms
1The descriptive statistics in Table II show that the IPO sample firms are on average 23.41years old at the point of the IPO and have thus competed as private firms for a considerable periodof time before the IPO.
2Zingales (1998) shows that a company’s leverage and profitability are significant determinantsof its continued existence. Campello (2003) similarly analyzes the impact of leverage on companies’
The New Game in Town: Competitive Effects of IPOs 497
are less highly leveraged than their industry competitors, leverage differencesare expected to be an advantage for these issuers.
Second, issuing firms have the advantage of being recently certified by in-vestment banks. Although the market certifies firm value as shares are traded,Chemmanur and Fulghieri (1994) suggest that highly regarded investmentbanks play an important role in certifying new issues.3 To the extent that thecertification effect is stronger for new issues, the certification role of invest-ment banks affects investors’ willingness to purchase new issues as opposedto shares of other firms in the same industry. Investors rely on the repeatedinteractions of these banks with issuers and on the banks’ ability to reject un-derwritings for low-quality issues. In other words, firms underwritten by topinvestment banks have been selected because of their potential for success, andthis can convey an advantage for issuing firms.
Third, new entrants may have some nonfinancial advantage over their in-dustry competitors and a nonfinancial advantage may make issuing firms moreattractive to investors. Higher quality firms are more likely to go public thanlower quality firms, as Stoughton, Wong, and Zechner (2001) suggest. One ex-ample of a nonfinancial business advantage is knowledge capital, as describedin Cockburn and Griliches (1988). These researchers study the effectivenessof patents in protecting knowledge capital developed through research anddevelopment—knowledge capital that gives firms a competitive advantage. Anonfinancial advantage can be thought of more generally as any product, mar-keting scheme, or innovation that gives the new issuing firm some advantageover industry competitors.
The results in this article are consistent with all three of these determinants.Controlling for a number of factors such as market timing and the hotness ofthe IPO environment, we document that competing companies show relativelybetter operating performance after large IPOs in their industry if they have lessleverage, if their IPO has been underwritten by a highly ranked investmentbank, and if they spend more on research and development. In addition, wefind empirical evidence that these factors also affect a competitor’s probabilityof survival for the 3-year period after the IPO.
The remainder of this article proceeds as follows. In Section I, we provide thesetting for our study. In Section II, we develop the hypotheses for our empiricaltests. Section III describes our data sources and sample construction, and inSection IV we characterize our findings. Section V provides robustness tests,and Section VI concludes.
I. The Setting
This study is related to branches of the IPO and, more generally, corporatefinance literatures that analyze the determinants of the long-run performanceand competitiveness of companies after their IPOs. Ritter (1991) and Loughran
competitiveness across different business cycles. In that paper and also in Campello (2006), com-petitiveness is measured by the change in sales over time, which is also used as one of the keyvariables in this study.
3The next section provides a brief overview of the empirical evidence for the certification effect.
and Ritter (1995) document significant underperformance for IPO and seasonedequity offering (SEO) companies over the post-issuing period. These resultshave been the starting point for a lively academic debate that focuses on thedeterminants of firms’ long-run performance.4 Jain and Kini (1994), Mikkelson,Partch, and Shah (1997), and Loughran and Ritter (1997) document a corre-sponding decline in the operating performance of IPO and SEO companies afterthe issuance, and this evidence is confirmed and extended in a recent study byPastor, Taylor, and Veronesi (2009). Chemmanur, He, and Nandy (2007) showfurther that IPO companies’ factor productivity peaks at the IPO, decreasingsteadily thereafter. However, Carter and Manaster (1990) and Carter, Dark,and Singh (1998) provide evidence that companies experience less underpric-ing and better long-term performance if their IPO is underwritten by a highlyranked investment bank.5 Similarly, Barry et al. (1990) and Megginson andWeiss (1991) find that venture-backed IPOs are less underpriced, while Jainand Kini (1995) show that venture-backed firms also exhibit superior operatingperformance after they go public.6 Nonetheless, each of these studies has fo-cused on the performance of issuing companies. Our article, in contrast, focuseson the impact of IPOs on the performance of competing companies in the sameindustry.
From a methodological perspective, our article is related to the literature thatconsiders the valuation effects of capital market transactions on companies inthe same industry. Slovin, Sushka, and Polonchek (1992) analyze the industry-wide impact of the release of adverse information by investigating competitors’share price reactions to SEOs in their industry.7 Our study is distinct in thatit focuses on the competitive advantage of IPOs, which create exactly oppositeoutcomes for existing and issuing firms in the same industry. More similarly toour article, Lang and Stulz (1992) consider the effect of bankruptcy announce-ments on industry rivals and distinguish between contagion and competitiveeffects.
Most similar to our article, Akhigbe, Borde, and Whyte (2003) analyze theimpact of IPOs on rival firms. The article finds no significant valuation effect.This difference in findings is likely the result of two substantive differences inthe approach of the two papers. First, Akhigbe et al. (2003) use all 2,493 IPOsbetween 1989 and 2000 that have at least one publicly traded competitor. Thisapproach captures the effect of small IPOs as well as large IPOs. However, as
4See, for example, Barber and Lyon (1996), Brav and Gompers (1997), Teoh, Welch, and Wong(1998), Brav (2000), and Loughran and Ritter (2000). A more extensive review of the debate isprovided in Ritter and Welch (2002).
5Note that underwriting costs have also been studied in the literature (e.g., Chen and Ritter(2000)). In a sense, this paper also describes a cost of public issues, namely, the cost borne byexisting firms due to increased competition.
6More recently, Ljungqvist and Wilhelm (2003) find that underpricing decreases with the levelof venture capital (VC) ownership in a firm.
7Similarly, Slovin, Sushka, and Ferraro (1995) analyze the stock price effect on incumbents indifferent types of corporate restructuring to test for managerial information advantages, whileSlovin, Sushka, and Bendeck (1991) focus on the information effects of going-private transactions.Goldman et al. (2008) examine how the fraudulent earning manipulation of a firm affects theperformance of the rival firms.
The New Game in Town: Competitive Effects of IPOs 499
we argue in this article, the measurement of each IPO’s effect on its competi-tors is likely contaminated by other IPOs in the same industry. In other words,Akhigbe et al. (2003) focus on the average effect of all IPOs, whereas we employa selection criterion that reduces the possible effects of contamination by fo-cusing only on large, and presumably important, IPOs. Second, while Akhigbeet al.’s (2003) event window starts on the event date, which is meant to captureposttrading competitive effects, we allow market participants to respond topredicted events before the event by starting our event window up to 10 daysbefore the event date. The subsequent analysis shows that there is a substan-tial price reaction before the event, with the pre-event reaction depending onthe predictability of the event, and thus confirms the need to use an approachthat allows for pre-event price reactions.
In addition to these primary differences in approach, there are several dif-ferences in scope. Unlike Akhigbe et al. (2003), we identify three theoreti-cally motivated determinants for the competitive advantage of IPOs: leverage,recent certification, and knowledge capital. Furthermore, whereas Akhigbeet al. (2003) focus exclusively on stock returns, we analyze the cross-sectionaloperating performance (and likelihood of survival) of competing firms, basedon the theoretically motivated determinants. Similarly, Akhigbe et al. (2003)analyze returns around the IPO filing and issuance dates, whereas we add thewithdrawal date to shed further light on whether IPOs are indeed responsiblefor the event returns.
Evidence on valuation effects in less integrated markets is reported by Braunand Larrain (2009), who show that the cross-section of performance is related tothe supply of new assets from IPOs. Our study examines stock price reactionsin the United States, where individual financial assets’ supply and demand arefar more elastic. We argue that performance differences are related to identifysources of competitive advantages, as opposed to a supply effect.8
II. Hypothesis Development
The key question in this article is whether IPOs have an impact on theperformance of competing companies in the same industry. This performanceimpact can be measured in different ways. Accordingly, we develop severalhypotheses that form the basis for the empirical tests in the subsequent sectionsof the article.
Our first main hypothesis relates to how the stock prices of competing com-panies react to a large IPO in their industry. While an IPO is announced andregistered some time before the intended first day of trading, there is substan-tial uncertainty at that point about whether the IPO will in fact be completed.9
The IPO announcement and its subsequent completion or withdrawal is thusexpected to have an impact on rivals’ stock returns:
8In a recent study, Chod and Lyandres (2008) propose a theory of a firm’s incentives to go publicin the presence of product market competition. Consistent with our findings, they predict thatgoing public is expected to adversely affect the values of the IPO firm’s product market rivals.
9Busaba, Benveniste, and Guo (2001) and Dunbar and Foerster (2008) find that about 20% ofIPOs are withdrawn before the first day of trading.
Hypothesis 1 (Short-Term Price Reaction): Stock prices of publicly tradedfirms react to IPOs in their industry.
This main hypothesis is tested in three different ways. First, as the IPO isexpected to allow the issuing firm to compete more successfully against industryrivals, the successful completion of an IPO should have a negative impact onrivals’ stock prices:
Hypothesis 1a (Returns around Completed IPOs): The completion of an IPOhas a negative price impact on publicly traded firms in thesame industry.
However, if it is bad news for rival firms to face a completed IPO in theirindustry, it should be good news for them if an expected and announced IPOdoes not succeed:
Hypothesis 1b (Returns around Withdrawn IPOs): The withdrawal of anIPO has a positive price impact on publicly traded firms inthe same industry.
While Hypotheses 1a and 1b focus on the completion and withdrawal of alarge IPO in a specific industry, the next hypothesis relates to the initial filingof that IPO. The initial filing is the earliest event in the IPO process used inthis study and thus applies to IPOs that will eventually succeed as well asto IPOs that will eventually be withdrawn. The initial filing should have asimilar effect as the completion of an IPO, since it is likely that the IPO firmwill eventually compete successfully against the existing firms in the industry.More formally:
Hypothesis 1c (Returns around IPO Filings): The initial filing of an IPOhas a negative price impact on existing firms in the sameindustry.
Along with the impact on the stock price, an IPO should also have an impacton the operating performance of competing firms in the same industry. Inparticular, the completion of an IPO is expected to give the IPO company acompetitive advantage over its competitors and thus to negatively affect theiroperating performance.
Hypothesis 2 (Pre-IPO and Post-IPO Operating Performance): The oper-ating performance of existing firms will deteriorate after anIPO.
Hypotheses 1 and 2 focus on the price reaction of firms to IPOs in theirindustry and the development of their operating performance around the timeof the IPO, respectively.10 The next set of hypotheses turns to differences inthe magnitude of those reactions across firms. Based on the discussion aboveon the existing literature, we expect leverage, certification, and knowledge to
10These two hypotheses are subsequently analyzed in univariate tests (Table III and Table IV)as well as in a panel regression (Table V).
The New Game in Town: Competitive Effects of IPOs 501
all be factors in explaining cross-sectional variation in the underperformanceof existing firms:
Hypothesis 3 (Cross-Sectional Differences among Publicly Listed Firms):Leverage, certification, and knowledge are significant de-terminants of cross-sectional variation in firm performancearound IPOs.
In particular, competitors with low leverage may have more flexibility in theirinvestments to compete with the recently recapitalized issuing firms, competi-tors with better certification by investment banks may fare better againstrecently certified issuing firms, and competitors with more knowledge capitalmay perform better against new entrants with nonfinancial advantages.
Finally, one may argue that the most critical measure of a company’s oper-ating performance is its ability to survive. Thus, if, indeed, the variables abovehave an impact on firm performance, then we also expect them to have animpact on publicly listed firms’ survival probability around IPOs.
Hypothesis 4 (Survival of Publicly Listed Firms): Leverage, certification,and knowledge are significant determinants of a firm’s abilityto survive following an IPO in its industry.
In this case, the same economic justifications for the determinants of perfor-mance outlined in Hypothesis 3 apply to a different context: the probability offirm survival.
III. Data and Methodology
The IPO data used in this study come from the SDC New Issues Database.Our sample comprises all nonfinancial firms that went public between 1980and 2001 for which we could obtain both CRSP and Compustat data.11 Thefinal sample includes 4,188 IPO firms in 62 two-digit SIC industries. In manycases there is more than one IPO in a given year in an industry. To study theeffect of IPOs on their publicly traded competitors, we face the challenge of onlyselecting those IPOs for which the results are not contaminated by the impactof other IPOs in the same industry in the same time period. In most industries,we cannot use all IPOs because IPOs are not isolated in time; the fact that IPOscan occur in control periods makes it important to identify IPOs with the lowestpotential of other IPOs contaminating the results. We therefore identify IPOevents by choosing only those IPOs that are not preceded or followed by a largerIPO in the same industry in the surrounding 6 years.12 We use IPO proceeds asour measure of size in order to minimize cross-IPO contamination of the results.
11Since the literature documents some data issues with the SDC database, we follow Ljungqvistand Wilhelm (2003) in validating key variables, such as the date of the IPO and the SIC code,using the CRSP and Compustat databases.
12In the robustness tests, we repeat our tests using windows of 8 and 4 years, respectively.In addition, as the risk of contaminated results is much smaller for the short-term stock returnmeasures than for the long-run operating performance measures, we compute these stock returnsfor a variety of samples with a much larger sample size.
Asset Book value of assets.Sales Book value of sales.Underwriter ranking The Carter and Manaster (1990) underwriter ranking, ranging from
1 to 10.Firm age since trading The age of the firm (in years) from the first trading day in CRSP to
the date of the IPO event.Firm age since founding The age of the firm from the founding date to the date of the IPO
event. The founding date data come from Jay Ritter’s website(http://bear.warrington.ufl.edu/ritter/). The data were also used inLoughran and Ritter (2004).
VC backing An indicator variable equal to one if the firm is venture-backed.ROA1 The ratio of net income to assets.ROA2 The ratio of operating income to assets.Leverage ratio The ratio of long-term debt to the market-adjusted value of assets
(book value of debt plus market capitalization).Interest coverage ratio The sum of interest expense and pre-tax income divided by interest
expense.K-Z financial constraint
indexThe Kaplan and Zingales financial constraint index. Kaplan and
Zingales (1997) construct a linear combination of five financialratios that measure a firm’s level of financial constraint. In thisarticle, we follow Lamont, Polk, and Saa-Requejo (2001) andconstruct the K-Z index as: −1.002 ∗ (cash flow/ lagged netcapital) + 0.283∗ (market-to-book ratio) + 3.139 ∗ (long-term andshort-term debt/total assets) – 39.368 ∗ (dividends/lagged netcapital) – 1.315 ∗ (slack/lagged net capital). Higher levels of theK-Z index indicate a higher likelihood that a firm is financiallyconstrained.
Annual underpricing The average level of IPO underpricing in a given year as reported inRitter (2007).
Industry underpricing The median issue-day underpricing of IPOs in the industry over theyear prior to the IPO event.
Industry M/B ratio The median industry market-to-book ratio in the previous year.High UW ranking An indicator variable equal to one if the firm’s Carter and Manaster
(1990) underwriter ranking is at least nine.High research intensity An indicator variable equal to one if the ratio of research and
development expenses to assets is in the top quartile of thesample.
High HH An indicator variable equal to one if the firm’s Herfindahl-Hirschman index of industry concentration is greater than 1,800.
Bondrankyes An indicator variable equal to one if the firm has a Standard &Poor’s long-term domestic issuer credit rating in the CompustatDatabase.
Good bondrank An indicator variable equal to one if the firm has a Standard &Poor’s long-term domestic issuer credit rating of BBB or above.
As an illustration, assume we choose a relatively small IPO as an event. If alarger firm then goes public during our measurement period, the effect of ourchosen event on existing firms would be difficult to measure, because it wouldbe dominated by the effect of the larger IPO. A noisy measurement could then
The New Game in Town: Competitive Effects of IPOs 503
lead to mixed results, as described by Akhigbe et al. (2003), who do not findsignificant event returns. Following our selection criterion, we obtain 134 IPOevents.13
Our identification of IPO events has advantages and disadvantages. One ad-vantage is the maximum use of data. By selecting IPOs without larger IPOsin the surrounding years, we utilize all IPOs that have a minimally contami-nated measurement period. Similarly, by selecting IPOs based on relative size,we avoid bias that could arise from the selection of IPOs based on arbitrar-ily defined periods of time. Even though the value of IPOs has increased overtime, IPOs that are large relative to the IPOs in surrounding years can befound throughout the time span. The IPO events chosen using this methodare spread relatively evenly across the sample years, and there are at most 14IPO events in any given sample year.14 The selection methodology generates asample of IPO events that is mildly clustered in “hot” IPO markets as definedby Ibbotson, Sindelar, and Ritter (1994) and Loughran and Ritter (1995).15
We identify existing firms in the same industry as the IPO events usingtwo digit SIC codes, and we define them as incumbent firms.16 We furtherrestrict incumbent firms in our sample to those that were publicly listed atleast 3 years before the IPO event year so that we can clearly observe thedifference in performance before and after the IPO event. The final samplecontains 9,494 incumbent firms, and after merging with CRSP, we are left with8,966 incumbent firms. In some experiments, we include withdrawn IPOs, andin these cases, the sample of completed and withdrawn IPOs includes 11,105firms around 158 filing date events.17
The accounting information on both the IPO event firms and the incum-bent firms comes from Compustat. In order to investigate the impact of theIPO events on the survival of the incumbent firms, we obtain firm delistinginformation from CRSP, including delisting dates and reasons for delisting.We define incumbent firms as “nonsurviving” if the firm is delisted within3 years after the IPO event for reasons other than merger or acquisition. Theexact definition is provided in Section IV.D. Finally, we obtain the identity of
13The distribution of the IPO events is shown in the Internet Appendix available athttp://www.afajof.org/supplements.asp.
14Furthermore, IPOs are also fairly evenly distributed between early years and later years;there are 58 IPO events from 1981 to 1991 and 76 events from 1992 to 2001.
15Using the measure of hotness defined in these papers, we find that the hottest IPO years inour study, 1983, 1986, and 1996, have a relatively large number of IPO benchmark events, butthere are also a large number of IPO benchmark events in the “cold” IPO markets of 1988 to 1990and 2001. The time-series correlation between this study’s IPO events and the total number ofIPOs is significantly positive despite the relatively small sample of 134 events. However, there isno significant time-series correlation between our sample and indicators of IPO market hotnessfrom Baker and Wurgler (2000), Ritter (2007), and Helwege and Liang (2004).
16Similar results obtain for Fama-French 48 industry classifications, and for finer SIC code-based industry classifications in the IT industry, both of which are available in the Internet Ap-pendix.
17Filing dates are missing for nine withdrawn IPOs. This leaves 28 withdrawal events, amongwhich 24 events have CRSP daily stock data for the event study analysis. So there are 158 IPOevents in the filing date analysis.
In this table we report descriptive statistics for the sample IPO firms and associated incumbentfirms. Data for founding dates come from both Jay Ritter’s and Boyan Jovanovic’s website. Fromthese data sets, we obtain firm age since founding for 128 IPO events and 6,208 incumbent firms. VCBacking is the proportion of firms that are venture-backed. Assets, Sales, and Market Capitalizationare reported at the end of the IPO event year, inflation-adjusted in 2003 dollars. All other variablesare defined in Table I. ∗∗∗, ∗∗, and ∗ indicate significance at the 1%, 5%, and 10% levels, respectively.
Firm age since trading (years) 0.00 6.85 ∗∗∗(3.39)
Firm age since founding (years) 23.41 26.00 ∗∗∗(8.00) (14.00)
VC backing (%) 0.24 0.31
underwriters in the incumbent firms’ most recent equity issuance and venturebacking data from both the SDC New Issues and Venture Xpert databases. Weobtain underwriter ranking data from Jay Ritter’s website.
In Table II, we report descriptive statistics for both IPO and incumbent firms.The results suggest that our sample IPO firms have significantly larger salesthan incumbent firms and are brought to market by underwriters with a higherreputation. These results are a consequence of our sample selection criterion,which focuses on IPOs that are large relative to other industry IPOs. Assetsand market capitalization are also larger for the IPOs than for the incumbentfirms, but the difference is not statistically significant. Finally, the IPO firmsare on average 23.41 years old when they go public, and are about 2.6 yearsyounger than incumbent firms. This means that IPO firms have successfullycompeted with incumbent firms for a considerable amount of time before goingpublic, and thus they are not new competitors after the IPO, but rather existingcompetitors with new characteristics.
IV. Empirical Results
As outlined in Section II, we measure the effect of large IPOs on incum-bent industry competitors in several ways. In this section, we present evi-dence on the incumbents’ short-term price reactions around IPOs, univariateresults for the comparison of the incumbents’ pre-IPO and post-IPO operating
The New Game in Town: Competitive Effects of IPOs 505
Mean CAR
−2.50%
−2.00%
−1.50%
−1.00%
−0.50%
0.00%
0.50%
1.00%
1.50%
2.00%
2.50%
3.00%
−30 −20 −10 3020100
Event Date
Completed IPOs Withdrawn IPOs
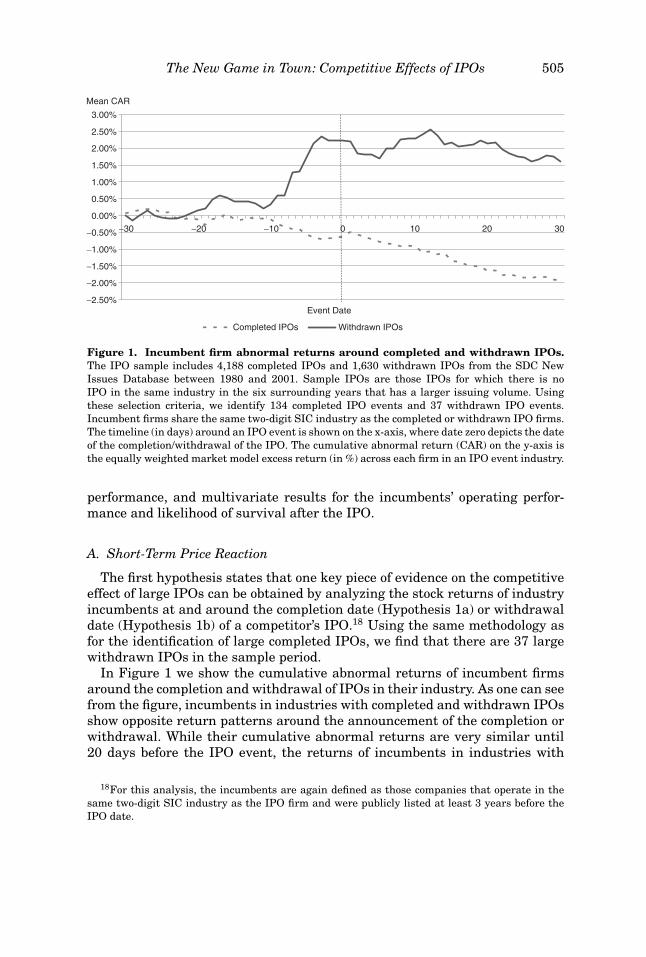
Figure 1. Incumbent firm abnormal returns around completed and withdrawn IPOs.The IPO sample includes 4,188 completed IPOs and 1,630 withdrawn IPOs from the SDC NewIssues Database between 1980 and 2001. Sample IPOs are those IPOs for which there is noIPO in the same industry in the six surrounding years that has a larger issuing volume. Usingthese selection criteria, we identify 134 completed IPO events and 37 withdrawn IPO events.Incumbent firms share the same two-digit SIC industry as the completed or withdrawn IPO firms.The timeline (in days) around an IPO event is shown on the x-axis, where date zero depicts the dateof the completion/withdrawal of the IPO. The cumulative abnormal return (CAR) on the y-axis isthe equally weighted market model excess return (in %) across each firm in an IPO event industry.
performance, and multivariate results for the incumbents’ operating perfor-mance and likelihood of survival after the IPO.
A. Short-Term Price Reaction
The first hypothesis states that one key piece of evidence on the competitiveeffect of large IPOs can be obtained by analyzing the stock returns of industryincumbents at and around the completion date (Hypothesis 1a) or withdrawaldate (Hypothesis 1b) of a competitor’s IPO.18 Using the same methodology asfor the identification of large completed IPOs, we find that there are 37 largewithdrawn IPOs in the sample period.
In Figure 1 we show the cumulative abnormal returns of incumbent firmsaround the completion and withdrawal of IPOs in their industry. As one can seefrom the figure, incumbents in industries with completed and withdrawn IPOsshow opposite return patterns around the announcement of the completion orwithdrawal. While their cumulative abnormal returns are very similar until20 days before the IPO event, the returns of incumbents in industries with
18For this analysis, the incumbents are again defined as those companies that operate in thesame two-digit SIC industry as the IPO firm and were publicly listed at least 3 years before theIPO date.
withdrawn IPOs become slightly positive over the next 10 days, while thereturns of incumbents in industries with completed IPOs are indistinguishablefrom zero.
The major difference then arises in the period that starts 10 days beforethe event. The returns of the firms in the withdrawn IPO industries show asignificantly positive reaction that continues for a substantial period of timeafter the IPO, but the returns of the companies in the completed IPO industriesexhibit a significantly negative reaction that also continues for a considerableperiod of time. It is important to point out that the stock prices of incumbentsstart reacting to the completion or withdrawal of an IPO before the event day.This suggests that the uncertainty about the completion success of an IPOalready starts to decrease up to 10 days before the IPO.19 Busaba, Benveniste,and Guo (2001) argue that withdrawals can occur at any point in time duringthe filing period. In the case of both a withdrawal and a completion of an IPO,more information about the prospects of an IPO becomes available before therespective event, which, in turn, affects competitors’ stock prices. One potentialinformation source is the road-show, during which the underwriter and theissuer meet institutional investors—the underwriter learns more about thedemand for the prospective IPO (See Benveniste and Spindt (1989)), whileinstitutional investors gain additional information on overall demand and thusthe completion chances of an issue.
The above result provides a first piece of evidence for Hypotheses 1a and 1b;incumbent firms suffer a drop in their stock price when a large IPO in theirindustry is completed, while they experience an increase in their stock pricewhen a large IPO in their industry is withdrawn. We analyze this evidencemore formally by calculating the stock returns of incumbents in industries inwhich an IPO is completed and in industries in which an IPO is withdrawn.The choice of the event window for these analyses is motivated by the evidencefrom Figure 1, and the results are presented in the next two subsections, thatis, Sections IV.A.1 and IV.A.2.
A.1. Returns around Completed IPOs
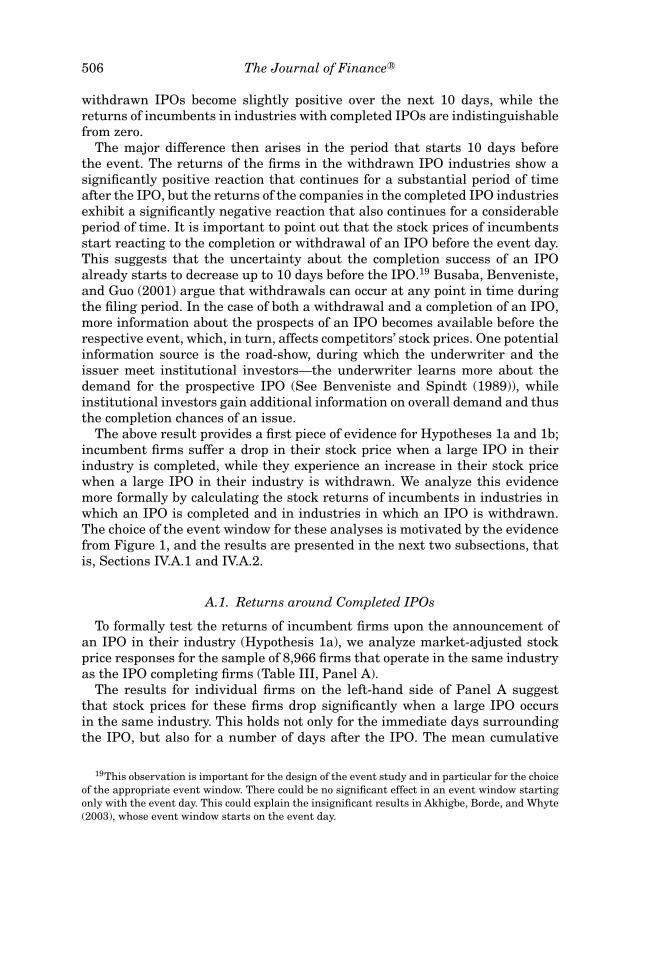
To formally test the returns of incumbent firms upon the announcement ofan IPO in their industry (Hypothesis 1a), we analyze market-adjusted stockprice responses for the sample of 8,966 firms that operate in the same industryas the IPO completing firms (Table III, Panel A).
The results for individual firms on the left-hand side of Panel A suggestthat stock prices for these firms drop significantly when a large IPO occursin the same industry. This holds not only for the immediate days surroundingthe IPO, but also for a number of days after the IPO. The mean cumulative
19This observation is important for the design of the event study and in particular for the choiceof the appropriate event window. There could be no significant effect in an event window startingonly with the event day. This could explain the insignificant results in Akhigbe, Borde, and Whyte(2003), whose event window starts on the event day.
The New Game in Town: Competitive Effects of IPOs 507
abnormal return (CAR) in the period between 10 days before and 1 day after theIPO amounts to −0.40% and is significant at the 5% level. This negative stockprice response can also be observed in longer time periods. CARs in the periodbetween 10 days before and 10 days after the IPO are equal to −0.82% andare significant at the 1% level. The returns remain negative and (statisticallyand economically) significant for longer event windows, the last of which ends20 days after the IPO day. The negative performance of incumbents in indus-tries with a large IPO starts about 10 days before the IPO (Figure 1), but theirperformance does not show any clear tendency in the immediate days beforethe IPO. Thus, it is not surprising that the CAR in the event window thatstarts 5 days before the IPO and lasts until 1 day after the IPO is only slightlynegative and fails to be significant. It becomes more negative and once againsignificant if the event period is extended to 5 days after the IPO. Overall, theresults indicate that industry incumbents suffer a drop in their share pricewhen a large IPO in their industry occurs.
The results reported in Table III, Panel A do not take into account the pos-sibility that returns could be correlated. While there are a large number ofsample companies, the maximum number of incumbents in a given industryis 1,558 and hence, we cannot rule out the possibility that returns aroundIPOs are highly correlated within each industry. We mitigate this concern byfirst forming a portfolio of incumbent firms for each of the given IPOs andthen averaging these portfolio returns across IPOs. The results, reported onthe right-hand side of Panel A, suggest that the returns remain negative andboth economically and statistically significant. The CARs are negative for allof the event windows and fail to achieve statistical significance only in theevent period between 10 days before and 1 day after the IPO event and (partlyconsistent with the previous results) for the event periods that start 5 daysbefore the IPO. In all other event windows, the CARs of the incumbents aresignificantly negative at least at the 5% level. This portfolio approach rules outthe possibility that the results are driven by IPO-specific determinants. It alsostresses the generality of the observed pattern.
A related question is whether short-term returns depend on the level ofcompetition in the industry in which the IPO firm operates. In order to shedmore light on this question, we follow the methodology of the U.S. Depart-ment of Justice and the Federal Trade Commission and sort IPOs by theHerfindahl–Hirschman index (HHI) in their industry at the IPO date. We formthree groups. The first group comprises IPOs in industries with a HHI above1,800, the second group contains those IPOs in industries with a HHI between1,000 and 1,800, and the third group includes IPOs in industries with a HHIbelow 1,000.20 The results show that returns of incumbent firms for these threegroups of IPOs show no particular pattern. While the CARs for IPOs in con-centrated industries are equal to −0.76% in the period between 10 days before
20The Department of Justice considers industries to be concentrated if the Herfindahl-Hirschman index is greater than 1,800 and to be moderately concentrated if the Herfindahl-Hirschman index is between 1,000 and 1,800. For more information, please see: http://www.usdoj.gov/atr/public/testimony/hhi.htm.
The New Game in Town: Competitive Effects of IPOs 509
and 1 day after the completion of an IPO and tend to be more negative than inmoderately concentrated (−0.41%) and nonconcentrated industries (−0.35%),these differences fail to be significant and even change signs for longer eventwindows. More importantly for the purpose of this article, the returns are neg-ative and significantly different from zero for each of the different groups andevent windows. In other words, they do not seem to be driven by the specificlevel of competition in a given industry.
Taken together, the results provide evidence in support of Hypothesis 1aand suggest that incumbent firms suffer stock price drops at and around thecompletion of large IPOs in their industry.
A.2. Returns around Withdrawn IPOs
We repeat the methodology above to analyze the price reaction of incumbentfirms to the announcement of a withdrawal of a large IPO in their industry. Re-call that we expect a positive stock price reaction (Hypothesis 1b). The results,reported on the left-hand side of Table III, Panel B show that incumbent firmsexperience a positive and significant return in their stock price around a with-drawal announcement. The average CAR across all incumbent firms is equal to1.97% for the window of 10 days before to 1 day after the announcement. Thisreturn remains positive and both statistically and economically significant forall of the event windows, except for the shorter event window that starts 5 daysbefore the IPO and ends 5 days after the IPO. Withdrawal stock returns thusshow a pattern exactly opposite to the stock returns of incumbents in industrieswith completed IPOs. As before, we test for the robustness of these results byfirst averaging across all incumbent firms in each withdrawn IPO firm’s indus-try and then averaging across all withdrawn IPO events. The results on theright-hand side of Table III, Panel B show that the CARs in the period between10 days before and 1 day after the withdrawal announcement are again eco-nomically and statistically significant. The CARs for the other event windowsremain positive, but for the most part fail to be significant. Note, however, thatthe sample size of 37 withdrawn IPO events is relatively small.
In principle, IPOs can be withdrawn for different reasons, for example, due tobad market conditions or bad firm-specific news, which might have a differentimpact on the price reaction of incumbents. We thus order withdrawn IPOs bythe overall market return between the IPO filing and the withdrawal date anduse the median market return in this period as the cutoff to sort the IPOs intotwo groups. If the market return in this period is above the median, then anIPO is expected to be withdrawn due to firm-specific news; on the other hand,the IPO is expected to be withdrawn due to bad market conditions if the marketreturn in this period is below the median. We find that incumbents experiencea positive stock price reaction of 4% if the withdrawal of an IPO is due tobad market conditions, while they experience a reaction of only 0.50% if thewithdrawal of an IPO is due to firm-specific news. One possible interpretationof these results is that competition induces more “pain” in bad times and thatthe reduction of competition is thus perceived more favorably. In any case, it is
important to point out that the withdrawal returns for incumbents are positiveand significant even in good market conditions. These results are consistentwith Hypothesis 1b and suggest that incumbent firms benefit if a large IPO intheir industry is withdrawn.
A.3. Returns around IPO Filings
So far our analyses of the short-term price reaction of incumbent firms havefocused on the date of the completion or withdrawal of a large IPO in theirindustry. Hypothesis 1c posits that the initial filing of the IPO also has a nega-tive price impact on incumbents. To test this conjecture we repeat the previousevent return analyses for the filing dates of all large IPOs that subsequentlycompleted or withdrew their IPO. As it is not known ex ante whether an IPOcandidate will eventually complete its listing, the incumbents, which are con-sidered separately in the previous two analyses, are considered as an aggregategroup for this analysis.
The results, presented in Table III, Panel C provide empirical evidence con-sistent with Hypothesis 1c. The event returns for incumbent firms are negativeboth for the individual firms and for the portfolios, which are constructed inthe same way as in the previous analyses. The event returns for the analysisof the individual firms are statistically significant at the 1% level for all of thechosen event windows. They are also significant for most of the event windowsin the portfolio analysis. Given that the market may be less able to antici-pate the exact filing date of an IPO than the IPO’s subsequent completion orwithdrawal date, it is not surprising to find that the event returns around thefiling date are negative and consistently significant even for the shorter eventperiods that start 5 days before the IPO.
The results in this subsection (Section IV.A.3) provide evidence that the re-turns of incumbent firms around the filing day are negative. The results in theprevious subsection (Section IV.A.2) show the exactly opposite reaction for in-cumbent firms around the subsequent withdrawal date. But the withdrawal ofan IPO should only be accompanied by positive stock price reactions by incum-bents if the initial filing was indeed a credible threat, that is, if the IPO’s initialfiling was accompanied by negative stock price reactions by incumbents. Wetest this relation by considering the correlation of stock returns of incumbentfirms around the IPO filing date and the IPO withdrawal date. The resultsshow that the filing and withdrawal returns are indeed significantly nega-tively correlated, with a p-value of less than 1% for each of the different eventwindows.
A.4. Economic Significance
As shown above, incumbents experience an average stock price reaction of−0.40% in the period between 10 days before and 1 day after the completionof an IPO in their industry. While this result is statistically significant atconventional levels, it is also important to analyze its economic significance.
The New Game in Town: Competitive Effects of IPOs 511
As reported in Table III, the analysis draws on a total of 8,966 incumbents.The value loss for each incumbent is calculated by multiplying the incumbent’sCAR in the event window by its market capitalization at the beginning of theevent window. For the (−10, 1) event window, an incumbent loses on average$3.271 million around the IPO, and the total loss of all incumbents amountsto $29.307 billion.21 This is the lower bound for the given event windows, asthe returns become even more negative for the longer event windows. And fora given IPO event, the average total loss of all incumbents amounts to $218million for the (10, −1) event window and is even higher for the longer eventwindows. These figures suggest that the losses experienced by incumbents aresubstantial and economically important. As a final consideration, we divide theaggregate loss of a given IPO by the market capitalization of the S&P500 justbefore the IPO. This provides a relative estimate of the losses in comparisonto a broad market index. The average aggregate loss amounts to 1.81% of theS&P500’s market capitalization.
In summary, the results on the short-term returns reported in Section IV.Aare consistent with the view that IPO firms successfully compete against in-cumbent firms. In the next section, we consider the effect of IPOs on industryincumbents’ operating performance.
B. Pre-IPO and Post-IPO Operating Performance
The return evidence reported in Section IV.A suggests that the market per-ceives IPOs as bad news for industry competitors. According to Hypothesis 2, weshould expect to obtain similarly negative evidence in regard to the operatingperformance of incumbents. Specifically, Hypothesis 2 posits that the marketanticipates that IPO firms compete successfully against industry incumbentsand, as a consequence, key performance variables of incumbents deteriorateafter these IPOs.
B.1. Univariate Results
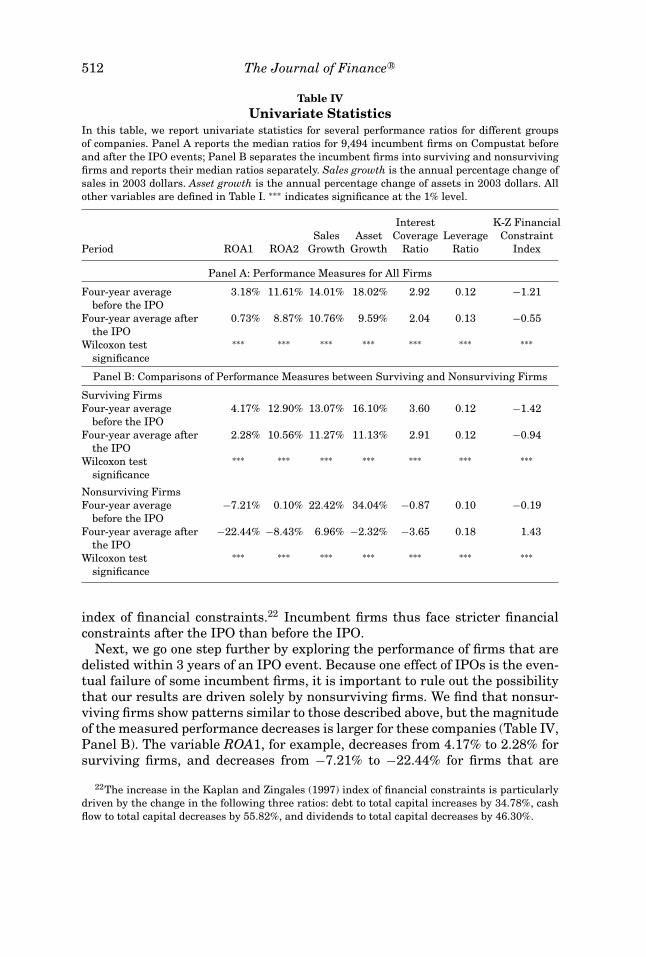
We find that the performance of incumbent firms is significantly lower afterIPO events (Table IV, Panel A). First, the results suggest that firms earn less onexisting assets. The ratio of net income to assets, ROA1, declines significantlyfrom 3.18% to 0.73% after the IPO event, and the ratio of operating income toassets, ROA2, declines significantly from 11.61% to 8.87%. Firms also investless with Asset Growth declining significantly from 18.02% to 9.59%, whereasleverage increases for incumbent firms: Interest Coverage Ratio decreases from2.92 to 2.04, and the ratio of debt to assets, Leverage Ratio, increases from 0.12to 0.13. Finally, there is a significant increase in the Kaplan and Zingales (1997)
21These figures are adjusted for inflation and expressed in 2003 $ terms. Data on marketcapitalization are missing for seven incumbents so that the sample is slightly reduced to 8,959firms.
In this table, we report univariate statistics for several performance ratios for different groupsof companies. Panel A reports the median ratios for 9,494 incumbent firms on Compustat beforeand after the IPO events; Panel B separates the incumbent firms into surviving and nonsurvivingfirms and reports their median ratios separately. Sales growth is the annual percentage change ofsales in 2003 dollars. Asset growth is the annual percentage change of assets in 2003 dollars. Allother variables are defined in Table I. ∗∗∗ indicates significance at the 1% level.
Panel B: Comparisons of Performance Measures between Surviving and Nonsurviving Firms
Surviving FirmsFour-year average
before the IPO4.17% 12.90% 13.07% 16.10% 3.60 0.12 −1.42
Four-year average afterthe IPO
2.28% 10.56% 11.27% 11.13% 2.91 0.12 −0.94
Wilcoxon testsignificance
∗∗∗ ∗∗∗ ∗∗∗ ∗∗∗ ∗∗∗ ∗∗∗ ∗∗∗
Nonsurviving FirmsFour-year average
before the IPO−7.21% 0.10% 22.42% 34.04% −0.87 0.10 −0.19
Four-year average afterthe IPO
−22.44% −8.43% 6.96% −2.32% −3.65 0.18 1.43
Wilcoxon testsignificance
∗∗∗ ∗∗∗ ∗∗∗ ∗∗∗ ∗∗∗ ∗∗∗ ∗∗∗
index of financial constraints.22 Incumbent firms thus face stricter financialconstraints after the IPO than before the IPO.
Next, we go one step further by exploring the performance of firms that aredelisted within 3 years of an IPO event. Because one effect of IPOs is the even-tual failure of some incumbent firms, it is important to rule out the possibilitythat our results are driven solely by nonsurviving firms. We find that nonsur-viving firms show patterns similar to those described above, but the magnitudeof the measured performance decreases is larger for these companies (Table IV,Panel B). The variable ROA1, for example, decreases from 4.17% to 2.28% forsurviving firms, and decreases from −7.21% to −22.44% for firms that are
22The increase in the Kaplan and Zingales (1997) index of financial constraints is particularlydriven by the change in the following three ratios: debt to total capital increases by 34.78%, cashflow to total capital decreases by 55.82%, and dividends to total capital decreases by 46.30%.
The New Game in Town: Competitive Effects of IPOs 513
eventually delisted. The key insight from the results is that performance ratiosdeteriorate for both surviving and nonsurviving firms. While the magnitudeof the change is more pronounced for nonsurviving firms, the change is stillsignificant for surviving firms for almost all of the performance measures. Theonly exception is the leverage ratio, which shows no significant increase forsurviving firms, but a significant increase for nonsurviving firms (from 0.10 to0.18).
The overall results are consistent with Hypothesis 2 and suggest that alarge-scale IPO in an industry has a negative effect on the performance ofincumbents. In what follows, we will attempt to describe the cross-sectionalcharacteristics of declines in incumbent performance in a regression settingthat allows us to control for mitigating factors.
B.2. Multivariate Results
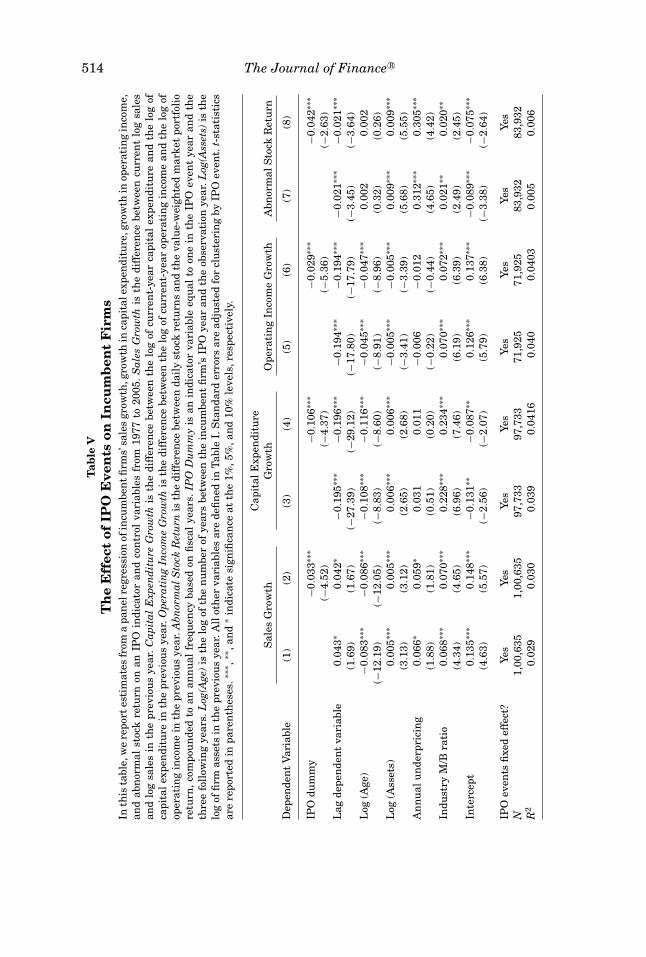
The univariate results so far suggest that IPOs affect the performance ofindustry incumbents, but one might question whether there are other factorsthat explain the results. In what follows, we look at performance over timeto determine whether performance declines are significantly affected by largeIPOs even after controlling for a number of factors that are known to predictperformance. Our approach is to model performance as a function of firm age,firm size, industry underpricing, industry valuation, and past performance.In other words, we would like to test Hypothesis 2 by measuring abnormalperformance, controlling for a number of factors that are known to predictperformance. Specifically, we estimate the following panel regression:
Performance is measured as sales growth, capital expenditure growth, oper-ating income growth, and abnormal stock return in each year t for every firmi. The indicator variable IPOi,t is equal to one if year t is within the 3 years ofa large IPO in firm i’s industry, and zero otherwise. The sample comprises asmany years as possible for each firm and thus we have a panel regression inwhich each firm has data from both IPO years and non-IPO years. Note thatwe estimate the model using fixed effects; we thus have a separate constantterm for each IPO event’s industry.23
In Table V, Model 1 we see that sales growth is significantly affected byage, size, underpricing, and the market-to-book ratio. In particular, older firmsperform worse than younger firms, as indicated by the negative coefficient onthe age variable in most of the models. These relationships hold throughoutthe sample, but there is a statistically significant decline in sales growth inIPO years (Model 2). In other words, incumbent firms face a 3.3% decline insales growth in the years in which a large IPO occurs in the same industry.
23The IPO-event fixed effects are similar to industry fixed effects, but there are differences thatarise from exits, entries, and industry changes. Replacing IPO-event fixed effects with industryfixed effects does not materially change the results.
The New Game in Town: Competitive Effects of IPOs 515
Similarly, capital expenditure declines by a statistically significant 10.6% inIPO years (Model 4), and operating income declines by a statistically significant2.9% in IPO years (Model 6). Overall, measures of performance based on firmprofitability decline in IPO years after age, size, and industry valuation aretaken into account.24
To further reinforce the event study results of Section IV.A.1, we verifywhether the effect of IPOs on incumbents’ stock prices is confounded by factorsapart from the IPO. Using the panel regression framework, we model annualstock price performance as a function of age, size, and industry valuation andfind that IPOs are associated with a statistically significant 4.2% decline inCARs (Table V, Model 8). Taking these results together, we conclude that in-cumbent firms’ sales growth, capital expenditure, operating income, and stockprice are all significantly weakened by the presence of a large IPO.
C. Cross-sectional Differences among Publicly Listed Firms
The previous subsection (Section IV.B.2) establishes that IPOs lead to sig-nificant performance deterioration for incumbent firms, even after controllingfor factors that affect performance. In this subsection we investigate whetherdeclines in performance in IPO years are related to specific competitive ad-vantages of IPO-issuing firms. In particular, we test Hypothesis 3 and analyzewhether cross-sectional differences in IPO-period incumbent performance canbe explained by three factors previously recognized as influencing IPO perfor-mance, namely, leverage, certification, and knowledge. Specifically, we run thefollowing cross-sectional regression
We measure performance as the difference in 3-year average sales growtharound IPO event e in incumbent firm i’s industry. We test our three mainhypothesized determinants of performance using measures of leverage, cer-tification, and knowledge around the time of the IPO event. In contrast tothe previous approach, this cross-sectional test uses only one observation perfirm in order to capture any cross-sectional pattern in abnormal performancearound IPO events.
The following subsections are organized as follows. The first three subsec-tions (Section IV.C.1 to IV.C.3) describe the relationship between sales growthand the three hypothesized sources of competitive advantage (leverage, certifi-cation, and knowledge capital). The next subsection, Section IV.C.4, describesthe effect of valuation cycles, and Section IV.C.5 analyzes the effect of thecontrol variables. Finally, Sections IV.C.6 and IV.C.7 describe the results for
24The results are very similar when age is defined by the log of the number of years sincefounding as well as when the original age definition and the log of the number of years betweenfounding and listing are used simultaneously.
two alternate measures of performance: operating income growth and capitalexpenditure.
C.1. Leverage
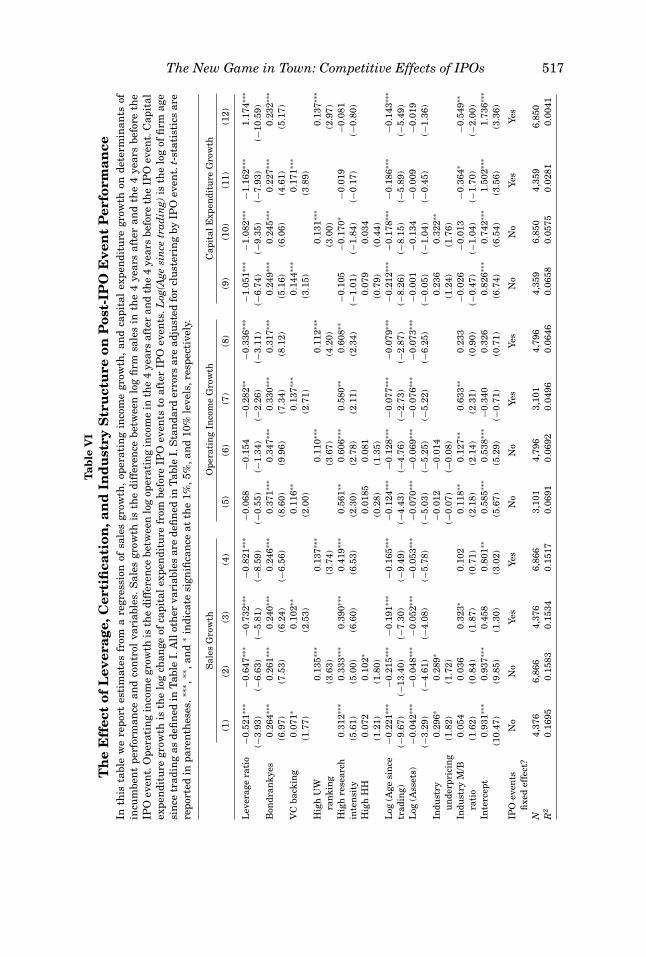
One of the potential mechanisms behind poor incumbent performance isleverage. We define Leverage Ratio as the average debt-to-assets ratio in the 4years preceding the IPO. We find that there is a negative and statistically sig-nificant coefficient of −0.521 on Leverage Ratio (Table VI, Model 1), which indi-cates that incumbent firms with high levels of leverage have poor performancearound the introduction of IPOs. The fact that highly leveraged incumbentsperform poorly with respect to their less leveraged counterparts is consistentwith the conclusions of Chevalier (1995) and Phillips (1995), and helps explainwhy IPOs perform better than their incumbent industry counterparts.
In addition to measuring leverage directly, we can also look at the availabil-ity of public debt financing for incumbent firms. Some firms may be highlyleveraged because they have optimally chosen to take advantage of high debtcapacity; thus, we need to look at firms’ ability to repay debt, in addition totheir level of debt. We use the existence of bond ratings as a proxy for debtcapacity: Bondrankyes is a dummy variable that takes the value one if an in-cumbent firm has a bond ranking, and zero otherwise. The existence of a bondranking has a positive and statistically significant coefficient of 0.264 (TableVI, Model 1). This coefficient estimate indicates that firms rated by the rat-ings agencies perform significantly better than their unrated peers. Since weknow that the existence of a rating is correlated with size, the existence ofa bond rating may be serving as a measure of financial flexibility, with thisflexibility allowing rated firms to perform better than other firms. Overall, theresults indicate that leverage and/or difficulty in obtaining credit contribute toincumbent underperformance.
C.2. Certification
To test whether certification plays a role in the performance of incumbentfirms, we must measure the certification quality difference between IPO firmsand their incumbent competitors. We construct the variable High UW Rankingas an indicator variable that takes the value one if an incumbent firm’s equityis underwritten by an investment bank with a Carter and Manaster (1990)ranking of nine or above. The statistically significant coefficient estimate of0.135 (Table VI, Model 2) indicates that incumbent firms underwritten by topinvestment banks perform better than other firms. This result is consistentwith the view that firms underwritten by top investment banks obtain certifi-cation, which results in a performance advantage over other firms. We also useventure capital backing as an alternate means of measuring the certificationeffect arising when firms are chosen by financial institutions. We find that in-cumbent firms that are backed by venture capital perform significantly betterthan their competitors. The statistically significant coefficient estimate of 0.071
The New Game in Town: Competitive Effects of IPOs 517T
(Table VI, Model 1) indicates that venture capital–backed firms perform betterthan other incumbent firms around IPO events.
C.3. Knowledge
Another possible reason for incumbent performance differences around IPOsrelates to differences in knowledge capital. We use a measure of research inten-sity that indicates whether incumbent firms are in the top quartile of expen-diture on research and development. The statistically significant coefficient of0.312 (Table VI, Model 1) indicates that incumbent firms with High ResearchIntensity perform better than other incumbent firms.
As Spence (1984) suggests, industry concentration may be related to knowl-edge capital, so it is reasonable to think that industry concentration may alsoplay a role in creating the competitive effects of IPOs. Furthermore, Langand Stulz (1992) find evidence of a stronger competitive effect of bankruptcyannouncements in industries with low levels of competition. We measure in-dustry concentration with an indicator variable, High HH, that takes thevalue one if the industry HHI exceeds 1,800 and zero otherwise. The vari-able makes a significant contribution to performance only in Model 2 whensales growth is used, but other performance measures indicate the effect is notrobust.
We also find that concentration has an interactive effect with leverage andresearch intensity. We create an interactive variable by multiplying High HHwith Leverage Ratio, and we find that this variable has a significantly negativeeffect on sales growth.25 The effect of leverage on firm competitiveness is thusespecially strong in highly concentrated industries. Similarly, we find thatfirms with high research intensity perform particularly well in concentratedindustries. However, while we find that concentration has these interactiveeffects, concentration has no robust explanatory power when interacted withmeasures of certification.
C.4. Valuation Cycles
Past returns could be an important part of the story if IPOs are more likelyto happen when industries have relatively high market valuations. If, as pro-posed by Baker and Wurgler (2002), managers are more likely to issue newequity when industries have high valuations, then we could find an increasedlikelihood of IPOs at the top of the valuation cycle to the extent that valuationcycles are industry-wide. If IPOs are most likely at the top of the valuationcycle, incumbent firms would tend to have better performance before the IPOthan after the IPO, and this difference would not necessarily be related to thecompetition of IPO firms with the incumbent firms.
We control for industry valuation cycles in the regressions by including twoproxies for valuation. The first proxy, Industry Underpricing, is defined as the
25The coefficient on the interaction variable is −0.397 and has a t-value of −2.08.
The New Game in Town: Competitive Effects of IPOs 519
median industry first-day IPO return over the year preceding the IPO event.The significant coefficient estimates indicate that the sales growth of incumbentfirms is higher after IPOs when market valuations are relatively high (TableVI, Model 1 and Model 2). Our second proxy, Industry M/B Ratio, is definedas the median market-to-book ratio of all of the firms in an industry over theyear preceding the IPO. We find that Industry M/B Ratio is not consistentlyrelated to sales growth. For the purposes of this article, the important thing isto rule out the possibility that industry cycles coincide with IPO cycles and thusconfound the results. We find that the effect of IPOs on industry performanceis not explained by industry valuation cycles.
C.5. Other Controls
In all of the regressions we include size and firm age. These variables mayaffect firm performance in a way that could confound the effect of IPO firms ontheir incumbent competitors. Our first control, size, proves to be a significantpredictor of returns. The statistically significant coefficient estimates in thevarious models show that larger firms, as measured by the log of book assets,have larger decreases in performance during IPO events. However, while thisrelationship is statistically significant, it does not replace our main explana-tions for decreased incumbent performance described above.
We also control for firm age. As shown in Spence (1977), firms have life cyclesin which operating performance tends to increase shortly at the beginning ofa firm’s life span and then increase less, or even decrease, at later stages. Theconcern for this article is that incumbent firms’ performance may be decliningin the years measured in our study. We control for firms’ life cycles by includingthe variable Log(Age since trading), which is defined as the number of years afirm has been publicly traded. We find firm age to be a significant predictor offirm performance. Again, however, after controlling for firm age we find that theexplanations described above are still important predictors of performance.
C.6. Operating Income Growth
In the previous subsection (Section IV.C.5), we follow Opler and Titman(1994) and Campello (2003) by measuring firm performance as the change inlog sales (Models 1–4 of Table VI). Of course, other performance measures couldprovide additional evidence on Hypothesis 3. In this subsection we provide theresults for the change in log operating income (e.g., Opler and Titman (1994)).With some notable exceptions, the results for this alternate performance mea-sure are very similar to the sales growth results.
In particular, the operating income results are consistent with our findingthat incumbent competitiveness is a function of leverage, certification, andresearch intensity. Consistent with previous results, Leverage Ratio has anegative and statistically significant coefficient in models 7 and 8 in whichIPO-event fixed effects are taken into account. Similarly, Bondrankyes has pos-itive and statistically significant coefficient estimates. Furthermore, our two
certification variables, VC backing and High UW ranking, have the same effectwhen this alternative performance measure is used. Finally, firms in high re-search intensity industries are shown to have significantly better performancearound IPOs under this alternate performance measure. Our three hypothe-sized determinants of incumbent underperformance are therefore supportedby these results, that is, operating income growth supports our earlier findingthat leverage, certification, and research intensity affect the competitivenessof incumbent firms around IPOs.
While this alternative performance measure supports Hypothesis 3, it alsoexhibits certain differences. First, the effect of industry concentration, HighHH, is not significant when performance is measured by operating incomegrowth. Overall, performance appears to be a weak function of industry con-centration; it is only significant when performance is measured with salesgrowth. Another difference between the performance measures is apparent inthe underpricing variable. When performance is measured with sales growth,Industry Underpricing has positive and statistically significant coefficient es-timates. This indicates that incumbents in high market valuation industriesperform better than other incumbent firms. However, when performance ismeasured with operating income, we find that Industry Underpricing has nostatistically significant coefficient estimates.
C.7. Capital Expenditure
In addition to describing how measures of leverage explain industry perfor-mance, we can provide more direct evidence on the importance of leverage bylooking at its impact on changes in capital expenditure. If incumbents haveless financial flexibility after the IPO, we should see that cross-sectional dif-ferences in capital expenditures are related to incumbent characteristics suchas leverage ratio and bond market access. In Models 9 to 12 of Table VI wepresent estimates of a regression of the change in incumbent capital expen-diture on these characteristics. Consistent with our results above, there is anegative and statistically significant coefficient on Leverage Ratio in each ofthese models. This indicates that incumbent firms with high levels of leveragehave lower growth in capital expenditure around the IPO period. Similarly,firms with available bond rankings have higher growth in capital expenditure(Table VI, Models 9 to 12). The cross-sectional determinants of low capitalexpenditure growth largely match cross-sectional determinants of underper-formance, as the results reported earlier in Table VI indicate that leverageis an important determinant of incumbent firm underperformance. These tworesults, taken together, support the view that leverage, through a decrease incapital expenditure, contributes to poor incumbent performance.
Overall, the results provide consistent empirical support for Hypothesis 3. Wefind that leverage, certification, and knowledge are significant determinants ofthe operating performance of incumbent firms and in particular of their growthin sales, operating income, and capital expenditure.
The New Game in Town: Competitive Effects of IPOs 521
D. Survival of Publicly Listed Firms
The previous subsection (Section IV.C) analyzes the impact of large IPOs onindustry competitors’ operating performance and shows that a number of vari-ables have a significant influence on the performance after the IPO. Accordingto Hypothesis 4, the same variables are also expected to have a significantinfluence on what is arguably the most critical benchmark for a company’soperating performance: its probability of survival.
We conduct a probit analysis to determine the effect of leverage, certification,knowledge capital, and control variables on incumbents’ probability of survivalin the first 3 years after the IPO.26 The probit estimation takes the followingform:
The dependent variable is equal to one if the incumbent firm i still exists3 years after its competitor’s IPO event e, and zero if the company has beendelisted for reasons of failure.27 The final sample comprises 8,559 companies,although limited information availability on venture capital backing and othervariables reduces the number of observations in some estimations. The ex-planatory variables are first tested separately and then jointly. The estimationalso controls for return on assets to take into account the fact that operatingperformance may influence survival probability.
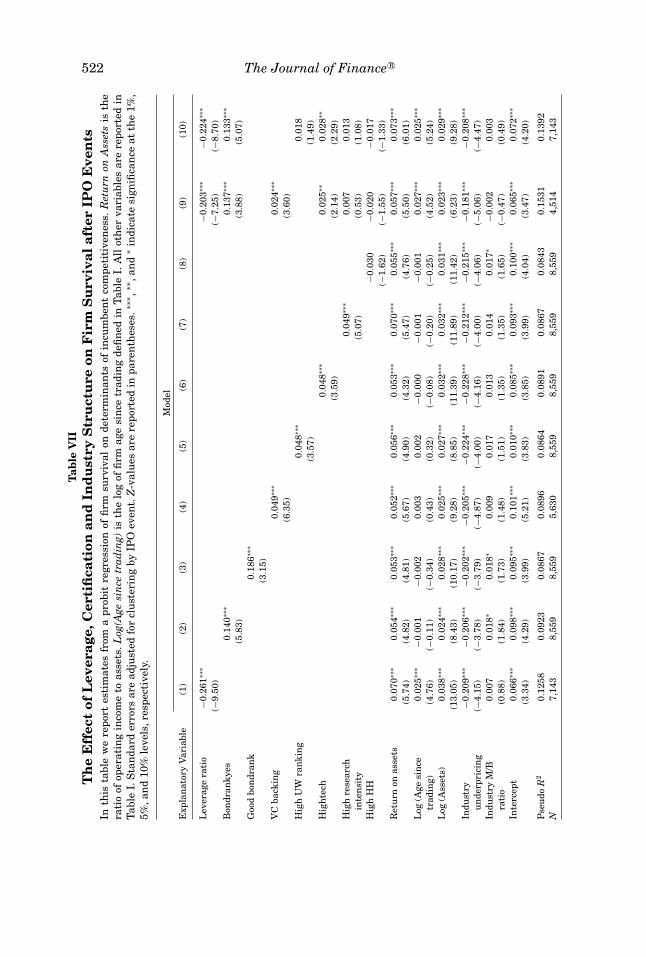
In general the results suggest that the same variables that determine a firm’soperating performance also determine a firm’s likelihood of surviving the publiclisting of a major competitor. Firms are more likely to survive if they have alower leverage ratio at the point of the IPO (Table VII, Model 1). They arealso more likely to survive if they have a bond rating, particularly, a good bondrating. Both results suggest that financial flexibility is important to firms whenthey are faced with an IPO in their industry.
The likelihood of survival also significantly increases for companies thathave the backing of venture capitalists before the IPO, as shown in Table VII,Model 4. The same holds for firms whose IPO is underwritten by an investmentbank with a high reputation. This is consistent with a certification story accord-ing to which top financial intermediaries only underwrite the equity offerings
26For the choice of the probit model, we conduct the test of the normality assumption as in Bera,Jarque, and Lee (1984). The test cannot reject the normality assumption for our main model. Forrobustness, we also run the estimation as a logit model, and the results do not materially differ.
27We determine failure by analyzing the delisting reasons given for these companies. In partic-ular, companies are defined to fail if their CRSP delisting code is larger than or equal to 300. Thisresults in a total number of 1,280 failed companies. In an alternative specification, companies aredefined to fail if their delisting code is larger than or equal to 400 (500). This reduces the totalnumber of failed companies to 1,215 (1,183). The empirical results from the probit estimations forthese specifications do not differ materially.
The New Game in Town: Competitive Effects of IPOs 523
of those companies for which they have performed careful due diligence andthat they have found to be of high quality.28
In addition, we test whether a company’s survival likelihood increases inits research intensity (Table VII, Model 7). We find that firms that are moreresearch intensive have a significantly greater chance of surviving than lessresearch intensive firms. This suggests that innovative firms with a high shareof new products are hit less severely by the intensified market presence ofa potential competitor. In contrast, the results show no significant impact ofmarket concentration on survival probability (Model 8). Finally, we use the dif-ferent explanatory variables simultaneously in Models 9 and 10 and find thatall of the results from the separate regressions remain significant, with twonotable exceptions. While underwriter ranking and research intensity matterfor the performance of incumbent firms, they become less important for deter-mining whether these firms survive. The results, taken together, indicate thata low underwriter rank and low research intensity contribute to the poor per-formance of incumbent firms, but they do not directly influence their survivalprobability.
The overall results from the probit estimations provide evidence for Hypothe-sis 4 and confirm the earlier results on the impact of a large IPO on its industrycompetitors’ operating performance. Incumbent firms are more likely to sur-vive following an IPO in their industry if they have a lower leverage ratio, ifthey have a bond ranking, if they have the backing of venture capitalists, andif they operate in high tech industries.
V. Robustness Tests
The methodology for the choice of sample companies in this article is mo-tivated by the desire to avoid any contamination of the measurement period,in particular with respect to the cross-sectional analysis of the performance ofincumbent firms over a period of 6 years. The robustness tests below examinewhether the results are sample specific or whether they also hold for differentand more broadly selected samples.
A. Short-Term Price Reaction Using a Larger Sample
The observation period for the analysis of the short-term price reaction of in-cumbent firms comprises a maximum of 31 days for each IPO. It thus overlapsmuch less with the observation periods of other IPOs than in the cross-sectionalanalysis of long-term performance. This allows us to consider alternative se-lection criteria of IPOs and test their impact on the stock prices of incumbentfirms. The first alternative selection criterion is whether the market capitaliza-tion of an IPO is above the top 10% of the market capitalization of all publicly
28This result is also consistent with the notion that venture capitalists help a start-up firm toimprove its operational, product market, and financial decisions. This argument is in line with thereasoning in Hellmann and Puri (2002).
traded firms in the same industry at the time of the IPO. The second alterna-tive selection criterion is whether the market capitalization of an IPO is abovethe top 10% of the market capitalization of all IPOs in the same industry.29 Werepeat the analysis of the short-term price reactions for these two alternativesamples and find similar results as before.30 The evidence thus suggests thatthe results are robust to other selection criteria and larger samples and arethus not due to our specific selection methodology.
B. Short-Term Price Reaction Using Different Rolling Windows
Even with the given selection methodology, we have discretion about thelength of the rolling window that we use to analyze the cross-sectional perfor-mance of incumbent firms before and after an IPO in their industry. While weuse a 3-year rolling window in our main analyses in this article, we test therobustness of the results by using in addition both a 2-year and a 4-year rollingwindow around the IPO, that is, a total period of 4 and 8 years, respectively.We find that the stock returns of incumbent firms are negative and significantin both windows, for the analysis of both individual firms and the portfolio offirms.31 These results thus suggest that the evidence is robust to the choice ofobservation period.
C. Short-Term Price Reaction Using Specific Industries
The selection methodology used in this paper concentrates on large IPOs.This may give rise to a bias towards firms in low tech and heavy industriesand not truly represent the universe of IPOs and firms in a given industry.This concern is alleviated by the first robustness test, which shows that theshort-term event results are negative and significant for different samples thatexplicitly take into account the industry in which an IPO firm operates. Wenonetheless rerun our analysis by excluding IPOs for those firms that operatein the following two-digit SIC industries: 10, 12, 13, 14, 15, 16, and 17. Thestock returns are negative and significant at the 1% level or better.32 Thus, inline with the results in the first robustness test, the evidence suggests that evenif an industry bias is induced by our sample methodology, the event returnsremain robust to different selection criteria.
D. Results Using a Differently Selected Sample
The IPO data in this article come from the SDC New Issues Database andare subsequently matched with CRSP and Compustat data. In order to further
29These criteria result in samples of 150 IPOs and 433 IPOs, respectively.30The results are presented in the Internet Appendix.31This selection criterion results in a sample of 161 firms for the 2-year rolling window and
a sample of 110 firms for the 4-year rolling window; the empirical results are presented in theInternet Appendix.
32These results are presented in the Internet Appendix.
The New Game in Town: Competitive Effects of IPOs 525
rule out the possibility that the results in this article are sample specific, allthe analyses in this article are repeated with a different underlying sample ofIPOs, but with the same methodology. The underlying sample of 5,747 IPOsfrom 1980 to 2001 for this robustness test comes from the data set provided byJay Ritter.33 As before, the selection methodology with 6-year rolling windowsis applied to Jay Ritter’s IPO sample. This results in a total sample size of 137IPOs, which is comparable to the sample size of 134 IPOs used in the mainbody of this paper.34 All the analyses for the main sample, including the short-term event studies as well as the cross-sectional performance and survivalestimations, are then repeated for this sample. The results do not materiallydiffer from the results for the original sample.35 The robustness tests suggestthat the results in this article are not sample specific, but hold as well fordifferent and more broadly selected samples.
VI. Conclusion
In this article, we analyze the stock price, operating performance, and sur-vival probabilities of publicly traded companies after a large IPO in their indus-try. We find that industry competitors experience negative stock returns whenan IPO is filed and thus initially announced as well as when an IPO is com-pleted. Further, reinforcing the conclusion that IPOs are driving the results,we show that withdrawn IPOs have the opposite effect on industry incumbents:The withdrawal of an IPO is associated with positive industry performance.
We also provide evidence of a significant deterioration in the operating per-formance of industry competitors after the IPO. We find in the cross-sectionalanalyses that companies perform better, and are more likely to survive, if theyare less leveraged and thus have more financial flexibility, if their IPO hasbeen underwritten and thereby certified by a top investment bank or by a ven-ture capitalist, and if they spend more on research and development and asa consequence possess a competitive advantage through the accumulation ofknowledge capital. Furthermore, when we control in our cross-sectional resultsfor the effect of industry valuation cycles on incumbent performance, we findthat while valuation cycles matter, the competitive aspects of IPOs have largeand significant effects on industry incumbents.
These results suggest that IPOs have competitive effects on other companiesthat operate in the same industry. The evidence we present has implicationsfor investors, particularly in the assessment of the expected risk and returnof companies in industries in which there is a high probability of new IPO
33The information is provided on Jay Ritter’s webpage at http://bear.cba.ufl.edu/ritter.34Twenty six percent (36/137) of the IPO events selected from Jay Ritter’s sample are also among
the events in the sample used in the main body of this paper. Using post-IPO market capitalizationfor size in the original selection technique, 37% (51/137) of the IPOs are shared in the two samples.Jay Ritter’s sample differs from our original sample in that it comprises a larger number of IPOs.However, it does not provide the proceeds for each of these IPOs, so we have to use the end-of-IPOmonth market capitalization as the measure of IPO size for this sample.
35The results are presented in the Internet Appendix.
entrants. Similarly, competitor companies need to understand how an IPOaffects their competitive position and how they can respond to it. The article alsosheds new light on the analysis conducted by companies considering whetherto raise capital through an equity offering. While the previous literature hasprimarily focused on market timing as well as direct and indirect issuing costssuch as underwriting fees and underpricing, we provide evidence of a beneficialcompetitive effect for certain IPOs. An open question for future research is towhat extent competitive effects can also be found for other capital markettransactions such as secondary offerings and delistings.
REFERENCESAkhigbe, Aigbe, Stephen F. Borde, and Ann M. Whyte, 2003, Does an industry effect exist for initial
public offerings? The Financial Review 38, 531–551.Baker, Malcolm P., and Jeffrey A. Wurgler, 2000, The equity share in new issues and aggregate
stock returns, Journal of Finance 55, 2219–2257.Baker, Malcolm P., and Jeffrey A. Wurgler, 2002, Market timing and capital structure, Journal of
Finance 57, 1–32.Barber, Brad M., and John D. Lyon, 1996, Detecting abnormal operating performance: The empir-
ical power and specification of test statistics, Journal of Financial Economics 41, 359–399.Barry, Christopher B., Chris J. Muscarella, John W. Peavy, and Michael R. Vetsuypens, 1990, The
role of venture capital in the creation of public companies: Evidence from the going-publicprocess, Journal of Financial Economics 27, 447–471.
Benveniste, Lawrence M., and Paul A. Spindt, 1989, How investment bankers determine the offerprice and allocation of new issues, Journal of Financial Economics 24, 213–232.
Bera, Anil K., Carlos M. Jarque, and Lung-Fei Lee, 1984, Testing the normality assumption inlimited dependent variable models, International Economic Review 25, 563–578.
Braun, Matias, and Borja Larrain, 2009, Do IPOs affect the prices of other stocks? Evidence fromemerging markets, Review of Financial Studies 22, 1505–1544.
Brav, Alon, 2000, Inference in long-horizon event studies: A Bayesian approach with applicationsto initial public offerings, Journal of Finance 55, 1979–2016.
Brav, Alon, and Paul A. Gompers, 1997, Myth or reality? The long-run underperformance of initialpublic offerings: Evidence from venture and nonventure capital–backed companies, Journalof Finance 52, 1791–1821.
Busaba, Walid, Lawrence M. Benveniste, and Re-Jin Guo, 2001, The option to withdraw IPOsduring the premarket: Empirical analysis, Journal of Financial Economics 60, 73–102.
Campello, Murillo, 2003, Capital structure and product markets interactions: Evidence from busi-ness cycles, Journal of Financial Economics 68, 353–378.
Campello, Murillo, 2006, Debt financing: Does it boost or hurt firm performance in product markets?Journal of Financial Economics 82, 135–172.
Carter, Richard B., Frederick H. Dark, and Ajai K. Singh, 1998, Underwriter reputation, initialreturns, and the long-run performance of IPO stocks, Journal of Finance 53, 285–311.
Carter, Richard, and Steven Manaster, 1990, Initial public offerings and underwriter reputation,Journal of Finance 45, 1045–1067.
Chemmanur, Thomas J., and Paolo Fulghieri, 1994, Investment bank reputation, informationproduction, and financial intermediation, Journal of Finance 49, 57–79.
Chemmanur, Thomas, Shan He, and Debarshi Nandy, 2007, The going public decision and theproduct market, Working paper, Boston College.
Chen, Hsuan-Chi, and Jay Ritter, 2000, The seven percent solution, Journal of Finance 55,1105–1131.
Chevalier, Judith A., 1995, Capital structure and product-market competition: Empirical evidencefrom the supermarket industry, American Economic Review 85, 415–435.
The New Game in Town: Competitive Effects of IPOs 527
Chod, Jiri, and Evgeny Lyandres, 2008, Strategic IPOs and product market competition, Workingpaper, Boston University.
Cockburn, Ian, and Zvi Griliches, 1988, Industry effects and appropriability measures in the stockmarket’s valuation of R&D and patents, American Economic Review 78, 419–423.
Dunbar, Craig G., and Stephen R. Foerster, 2008, Second time lucky? Withdrawn IPOs that returnto the market, Journal of Financial Economics 87, 610–635.
Goldman, Eitan, Urs Peyer, and Irina Stefanescu, 2008, Fraudulent earnings manipulation andindustry rivals, Working paper, Indiana University.
Hellmann, Thomas, and Manju Puri, 2002, Venture capital and the professionalization of start-upfirms: Empirical evidence, Journal of Finance 57, 169–197.
Helwege, Jean, and Nellie Liang, 2004, Initial public offerings in hot and cold markets, Journal ofFinancial and Quantitative Analysis 39, 541–569.
Ibbotson, Roger G., and Jeffrey F. Jaffe, 1975, Hot issue markets, Journal of Finance 30, 1027–1042.
Ibbotson, Roger G., Jody L. Sindelar, and Jay R. Ritter, 1994, The market’s problems with thepricing of initial public offerings, Journal of Applied Corporate Finance 7, 66–74.
Jain, Bharat A., and Omesh Kini, 1994, The post-issue operating performance of IPO firms, Journalof Finance 49, 1699–1726.
Jain, Bharat A., and Omesh Kini, 1995, Venture capitalist participation and the post-issue oper-ating performance of IPO firms, Managerial and Decision Economics 16, 593–606.
Kaplan, Steven N., and Luigi Zingales, 1997, Do investment–cash flow sensitivities provide usefulmeasures of financing constraints? Quarterly Journal of Economics 112, 169–215.
Lamont, Owen, Christopher Polk, and Jesus Saa-Requejo, 2001, Financial constraints and stockreturns, Review of Financial Studies 14, 529–554.
Lang, Larry H. P., and Rene M. Stulz, 1992, Contagion and competitive intraindustry effects ofbankruptcy announcements: An empirical analysis, Journal of Financial Economics 32, 45–60.
Ljungqvist, Alexander, and William J. Wilhelm, 2003, IPO pricing in the dot-com bubble, Journalof Finance 58, 723–752.
Loughran, Tim, and Jay R. Ritter, 1995, The new issues puzzle, Journal of Finance 50, 23–51.Loughran, Tim, and Jay R. Ritter, 1997, The operating performance of firms conducting seasoned
equity offerings, Journal of Finance 52, 1823–1850.Loughran, Tim, and Jay R. Ritter, 2000, Uniformly least powerful tests of market efficiency,
Journal of Financial Economics 55, 361–389.Loughran, Tim, and Jay R. Ritter, 2004, Why has IPO underpricing changed over time? Financial
Management 33, 5–37.Megginson, William L., and Kathleen A. Weiss, 1991, Venture capitalist certification in initial
public offerings, Journal of Finance 46, 879–903.Mikkelson, Wayne H., M. Megan Partch, and Ken Shah, 1997, Ownership and operating perfor-
mance of companies that go public, Journal of Financial Economics 44, 281–307.Opler, Tim C., and Sheridan Titman, 1994, Financial distress and corporate performance, Journal
of Finance 49, 1015–1040.Pagano, Marco, Fabio Panetta, and Luigi Zingales, 1998, Why do companies go public? An empirical
analysis, Journal of Finance 53, 27–64.Pastor, Lubos, Lucian Taylor, and Pietro Veronesi, 2009, Entrepreneurial learning, the IPO deci-
sion, and the post-IPO drop in firm profitability, Review of Financial Studies 22, 3005–3046.Phillips, Gordon M., 1995, Increased debt and industry product markets: An empirical analysis,
Journal of Financial Economics 37, 189–238.Ritter, Jay R., 1991, The long-run performance of initial public offerings, Journal of Finance 46,
3–27.Ritter, Jay R., 2007, Some factoids about the 2006 IPO market, Working paper, University of
Florida.Ritter, Jay R., and Ivo Welch, 2002, A review of IPO activity, pricing, and allocations, Journal of
Finance 57, 1795–1828.Slovin, Myron B., Marie E. Sushka, and Yvette M. Bendeck, 1991, The intra-industry effects of
going-private transactions, Journal of Finance 46, 1537–1550.
Slovin, Myron B., Marie E. Sushka, and Steven R. Ferraro, 1995, A comparison of the informationconveyed by equity carve-outs, spin-offs, and asset sell-offs, Journal of Financial Economics37, 89–104.
Slovin, Myron B., Marie E. Sushka, and John A. Polonchek, 1992, Informational externalities ofseasoned equity issues: Differences between banks and industrial firms, Journal of FinancialEconomics 32, 87–101.
Spence, A. Michael, 1977, Entry, capacity, investment and oligopolistic pricing, Bell Journal ofEconomics 8, 534–544.
Spence, A. Michael, 1984, Industrial-organization and competitive advantage in multinationalindustries, American Economic Review 74, 356–360.
Stoughton, Neal, Kit Pong Wong, and Josef Zechner, 2001, IPOs and product quality, Journal ofBusiness 74, 375–408.
Teoh, Siew Hong, Ivo Welch, and T. J. Wong, 1998, Earnings management and the underperfor-mance of seasoned equity offerings, Journal of Financial Economics 50, 63–99.
Zingales, Luigi, 1998, Survival of the fittest or the fattest? Exit and financing in the truckingindustry, Journal of Finance 53, 905–938.