28
The New Kidney Allocation System (KAS): The First 18 Months Darren Stewart, MS John Beck, MSME Anna Kucheryavaya, MS UNOS Research Department Slideset updated 08/12/2016
The New Kidney Allocation System (KAS):
The First 18 Months
Darren Stewart, MS
John Beck, MSME
Anna Kucheryavaya, MS
UNOS Research Department
Slideset updated 08/12/2016
1. Background
2. Transplant volume
3. Regional distribution of transplants
4. Pediatric transplants
5. “Bolus” effects CPRA 99-100 recipients
Recipients with 10+ years on dialysis
6. Kidney utilization
7. Recipient outcomes
8. KDPI mapping table error (April 20 – May 19, 2016)
Topics
2
KAS implemented Dec 4, 2014
Key goals:
Make better use of available kidneys
Increase transplant opportunities for difficult-to-match patients (increased
equity)
Increase fairness by awarding waiting time points based on dialysis start date
Have minimal impact on most candidates
Background
3
Pre-KAS: Dec 4, 2013 – Dec 3, 2014 (12 months)
Post-KAS: Dec 4, 2014 – May 31, 2016 (~18 months)
Some slides include a longer post-KAS evaluation (e.g., 19 or 20 months, as indicated)
Analysis periods
4
936.0
867.9
1,079.0
895.0939.7
1,039.41,012.0
0.0
200.0
400.0
600.0
800.0
1,000.0
1,200.0
01
/31
/14
02
/28
/14
03
/31
/14
04
/30
/14
05
/31
/14
06
/30
/14
07
/31
/14
08
/31
/14
09
/30
/14
10
/31
/14
11
/30
/14
12
/31
/14
01
/31
/15
02
/28
/15
03
/31
/15
04
/30
/15
05
/31
/15
06
/30
/15
07
/31
/15
08
/31
/15
09
/30
/15
10
/31
/15
11
/30
/15
12
/31
/15
01
/31
/16
02
/29
/16
03
/31
/16
04
/30
/16
05
/31
/16
06
/30
/16
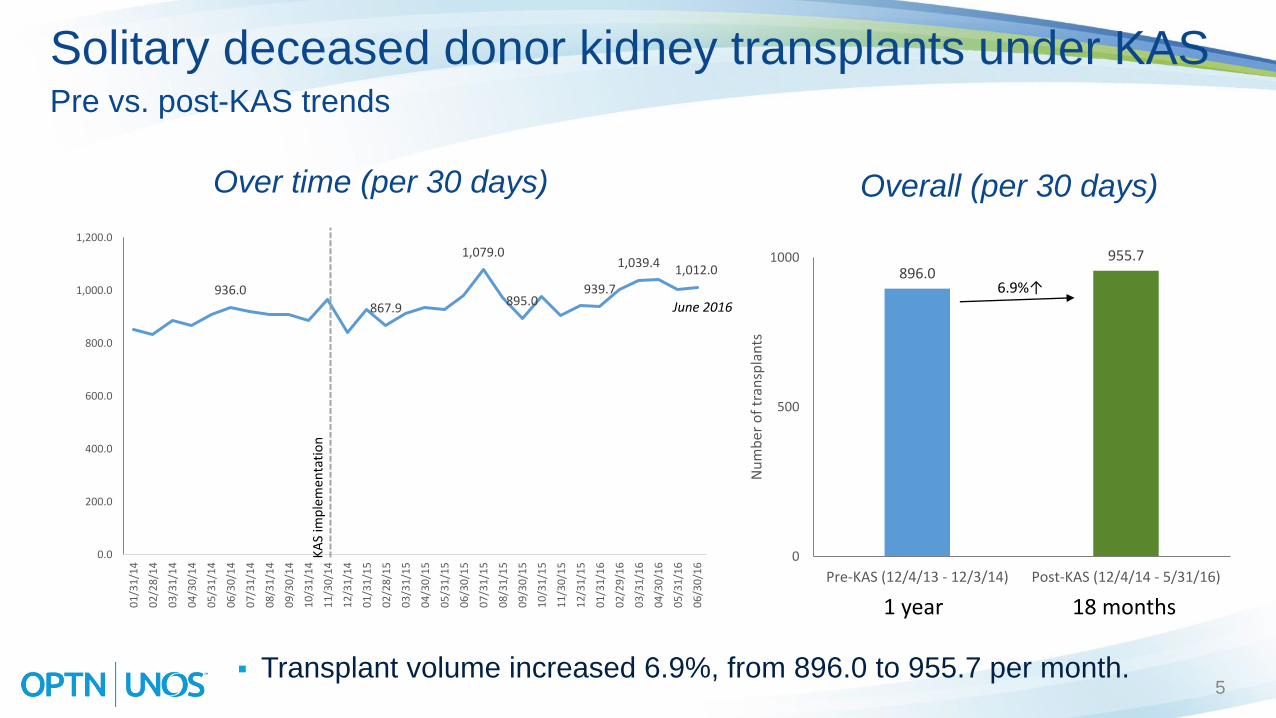
Solitary deceased donor kidney transplants under KASPre vs. post-KAS trends
Transplant volume increased 6.9%, from 896.0 to 955.7 per month.
KA
S im
ple
men
tati
on
Over time (per 30 days) Overall (per 30 days)
896.0955.7
0
500
1000
Pre-KAS (12/4/13 - 12/3/14) Post-KAS (12/4/14 - 5/31/16)
Nu
mb
er o
f tr
ansp
lan
ts
6.9%↑
1 year 18 months
June 2016
5
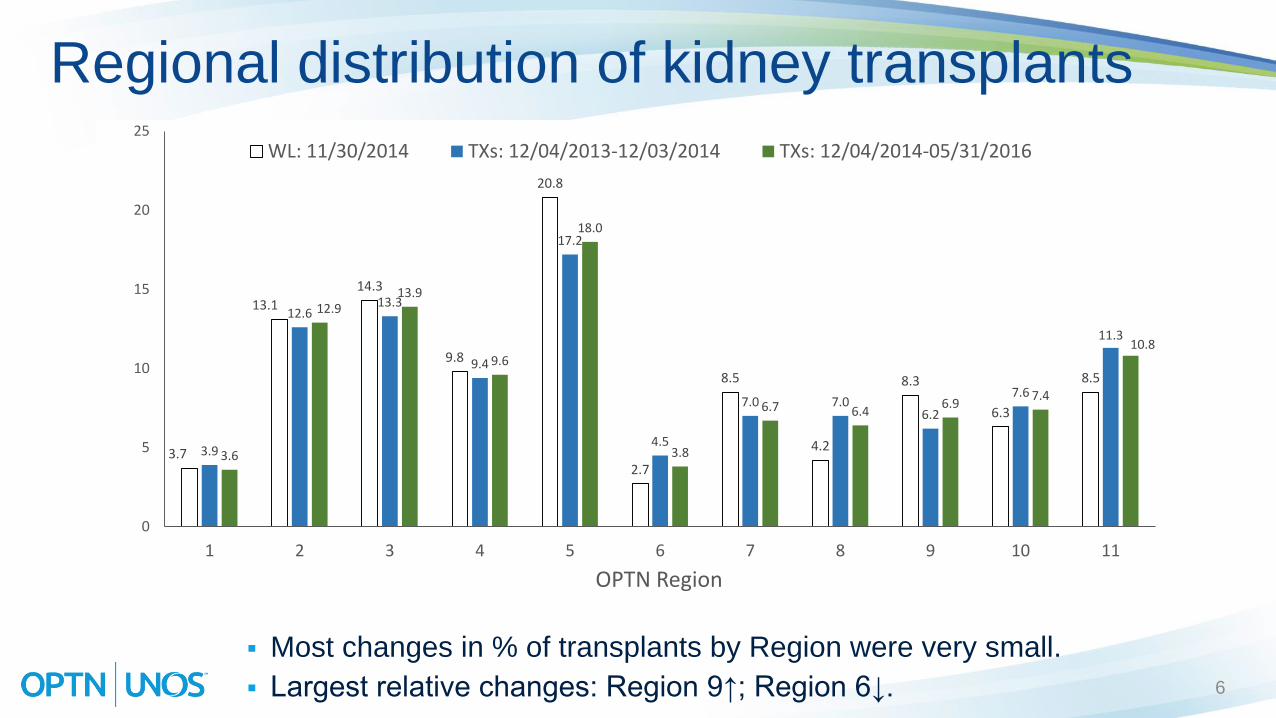
Regional distribution of kidney transplants
Most changes in % of transplants by Region were very small.
Largest relative changes: Region 9↑; Region 6↓. 6
3.7
13.1
14.3
9.8
20.8
2.7
8.5
4.2
8.3
6.3
8.5
3.9
12.613.3
9.4
17.2
4.5
7.0 7.06.2
7.6
11.3
3.6
12.913.9
9.6
18.0
3.8
6.7 6.46.9
7.4
10.8
0
5
10
15
20
25
1 2 3 4 5 6 7 8 9 10 11
OPTN Region
WL: 11/30/2014 TXs: 12/04/2013-12/03/2014 TXs: 12/04/2014-05/31/2016
0.2% 0.2%
0.5%
0.9% 0.8% 0.6%
2.8%
4.3%
0.7% 0.8%
2.2%
3.8%
0.7% 0.8%
2.4%
4.0%
0.7% 0.8%
2.4%
3.8%
0.0%
1.0%
2.0%
3.0%
4.0%
5.0%
Age 0-5 Age 6-10 Age 11-17 Age 0-17
WL Snapshot 11/30/14 Pre-KAS (1 year) Post (mos 1-6) Post (mos 7-12) Post (mos 13-20)
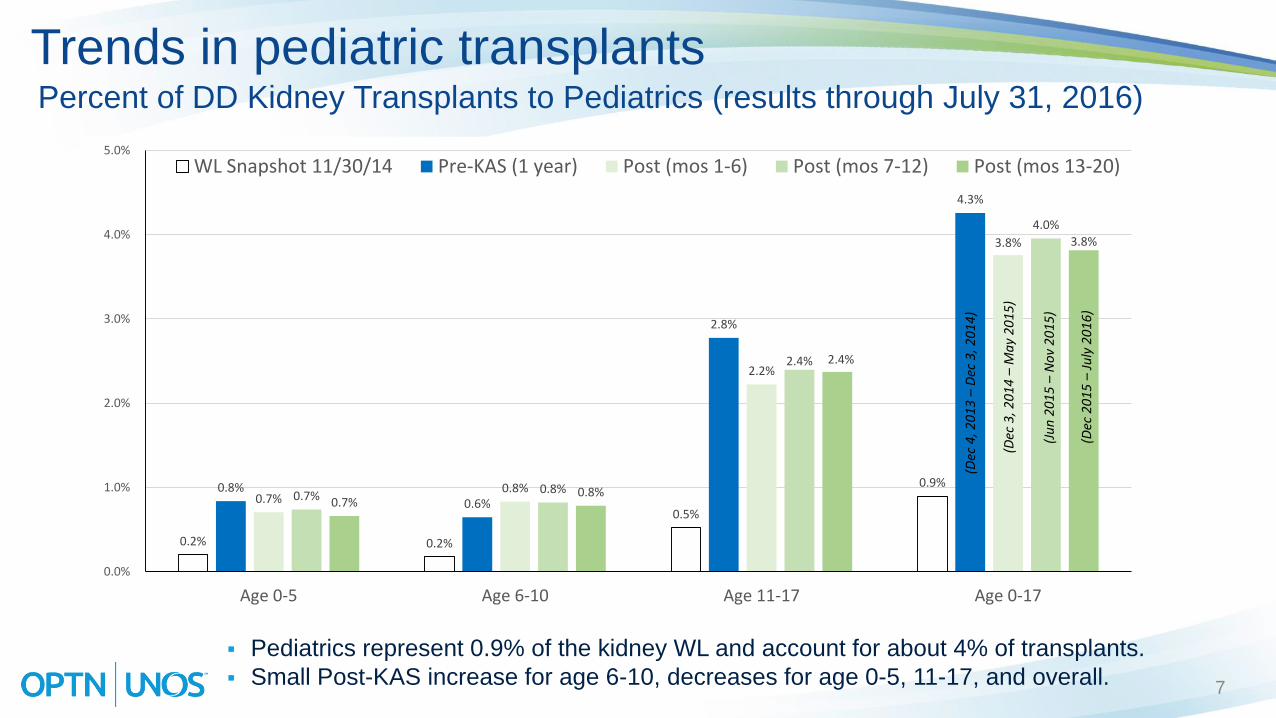
Trends in pediatric transplants
Pediatrics represent 0.9% of the kidney WL and account for about 4% of transplants.
Small Post-KAS increase for age 6-10, decreases for age 0-5, 11-17, and overall.
Percent of DD Kidney Transplants to Pediatrics (results through July 31, 2016)
(Dec
20
15
–Ju
ly 2
01
6)
7
(Dec
3, 2
01
4 –
Ma
y 2
01
5)
(Ju
n 2
01
5 –
No
v 2
01
5)
(Dec
4, 2
01
3 –
Dec
3, 2
01
4)
1.8%
12.8% 12.2% 10.8%
26.3%
3.2%
10.6%
5.5% 6.8%
3.2%
6.9%
4.1%
7.5%
17.1%
13.2%
21.4%
2.1%
5.6% 7.1%
5.1%
7.5%
9.4%
4.0%
10.4%
16.3% 15.5% 15.2%
3.2%
6.6%
8.5%
5.0%
7.5% 7.8%
0%
5%
10%
15%
20%
25%
30%
35%
40%
1 2 3 4 5 6 7 8 9 10 11
WL Snapshot 11/30/14 Txs 12-Mos PRE-KAS Txs 20-Mos POST-KAS
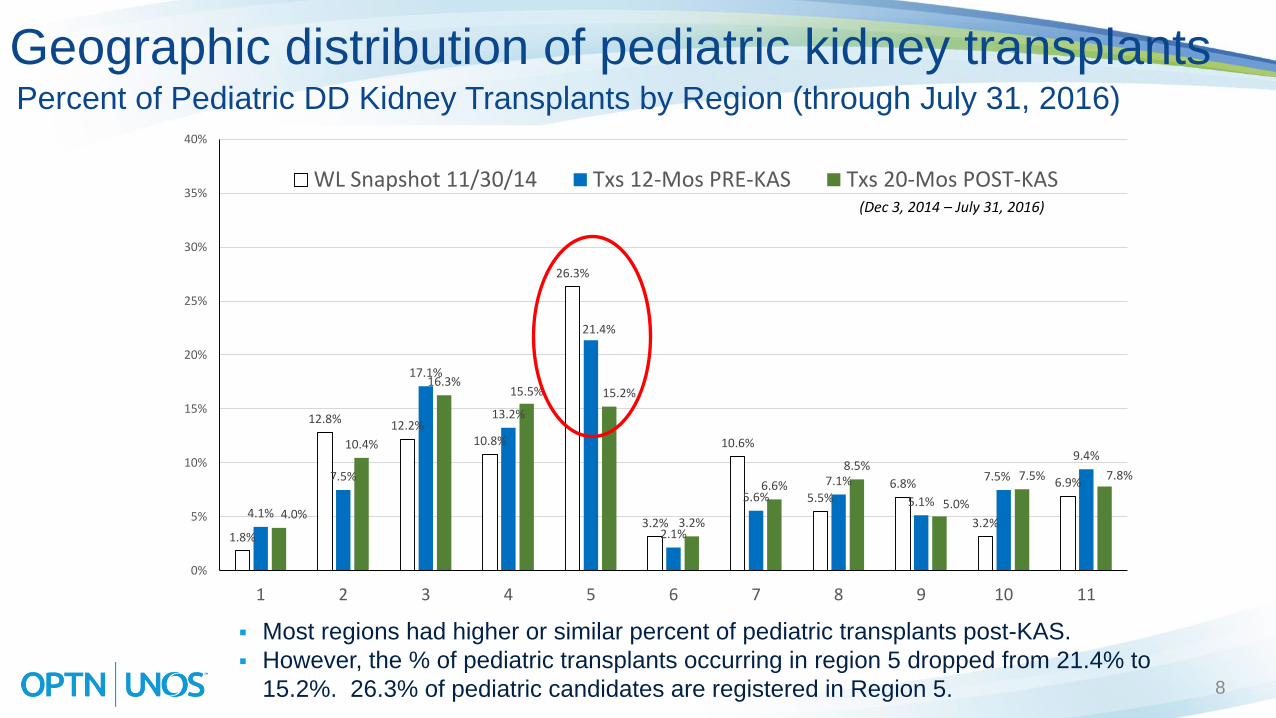
Geographic distribution of pediatric kidney transplants
Most regions had higher or similar percent of pediatric transplants post-KAS.
However, the % of pediatric transplants occurring in region 5 dropped from 21.4% to
15.2%. 26.3% of pediatric candidates are registered in Region 5.
Percent of Pediatric DD Kidney Transplants by Region (through July 31, 2016)
(Dec 3, 2014 – July 31, 2016)
8
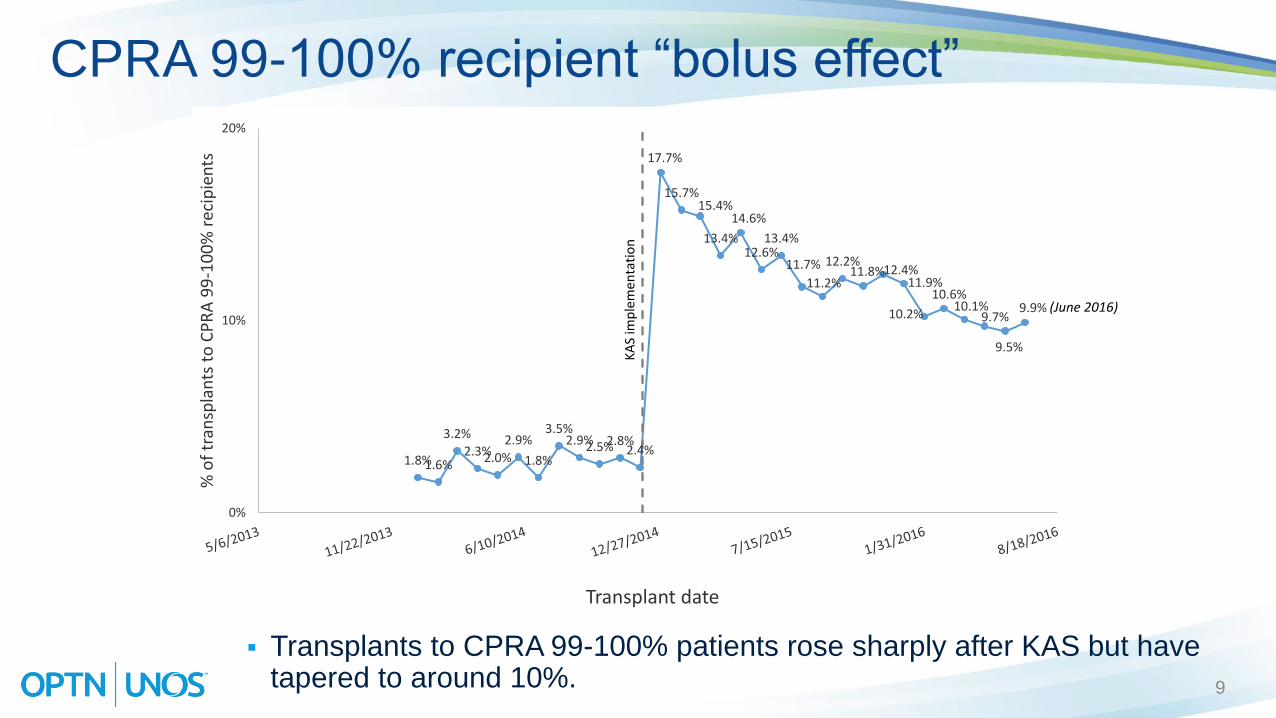
CPRA 99-100% recipient “bolus effect”
Transplants to CPRA 99-100% patients rose sharply after KAS but have tapered to around 10%.
1.8%1.6%
3.2%
2.3%2.0%
2.9%
1.8%
3.5%2.9%2.5%2.8%
2.4%
17.7%
15.7%15.4%
13.4%
14.6%
12.6%13.4%
11.7%
11.2%
12.2%11.8%12.4%
11.9%
10.2%
10.6%10.1%
9.7%
9.5%
9.9%
0%
10%
20%
% o
f tr
ansp
lan
ts t
o C
PR
A 9
9-1
00
% r
ecip
ien
ts
Transplant date
KA
S im
ple
men
tati
on
(June 2016)
9
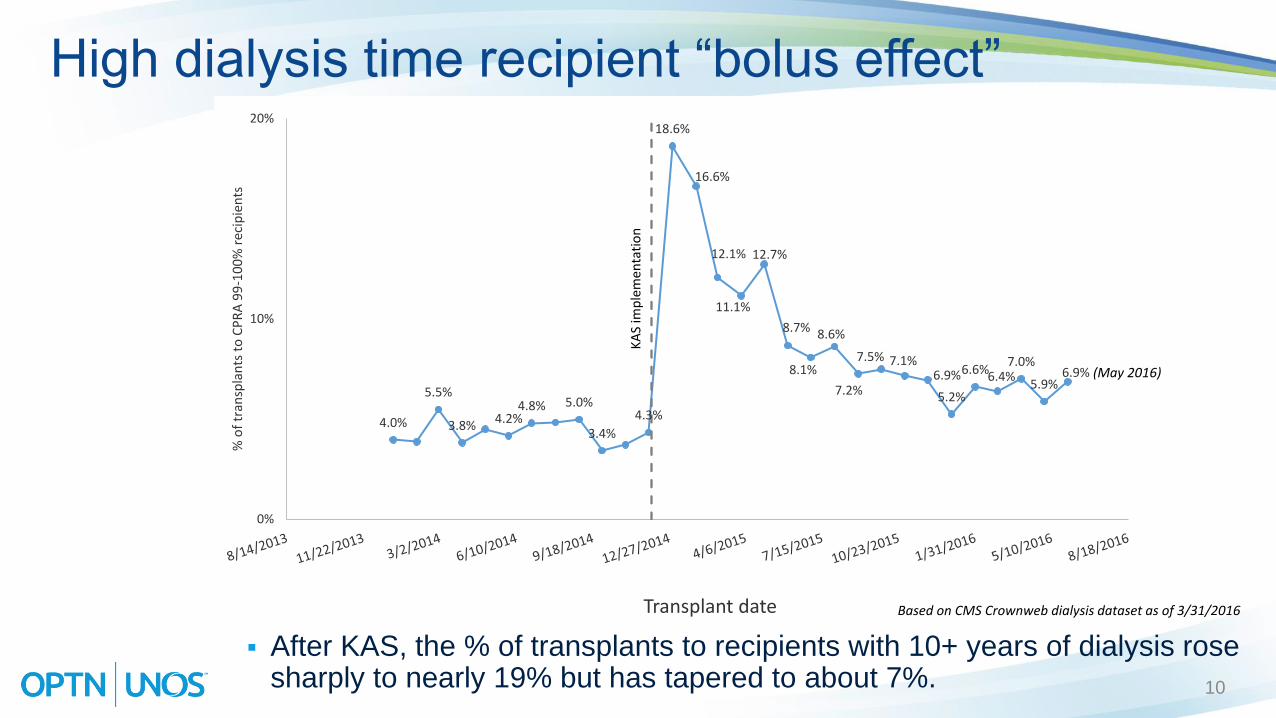
High dialysis time recipient “bolus effect”
After KAS, the % of transplants to recipients with 10+ years of dialysis rose sharply to nearly 19% but has tapered to about 7%.
4.0%
5.5%
3.8%4.2%
4.8% 5.0%
3.4%
4.3%
18.6%
16.6%
12.1%
11.1%
12.7%
8.7%
8.1%
8.6%
7.2%
7.5% 7.1%6.9%
5.2%
6.6%6.4%7.0%
5.9%6.9%
0%
10%
20%
% o
f tr
ansp
lan
ts t
o C
PR
A 9
9-1
00
% r
ecip
ien
ts
Transplant date
KA
S im
ple
men
tati
on
(May 2016)
Based on CMS Crownweb dialysis dataset as of 3/31/2016
10
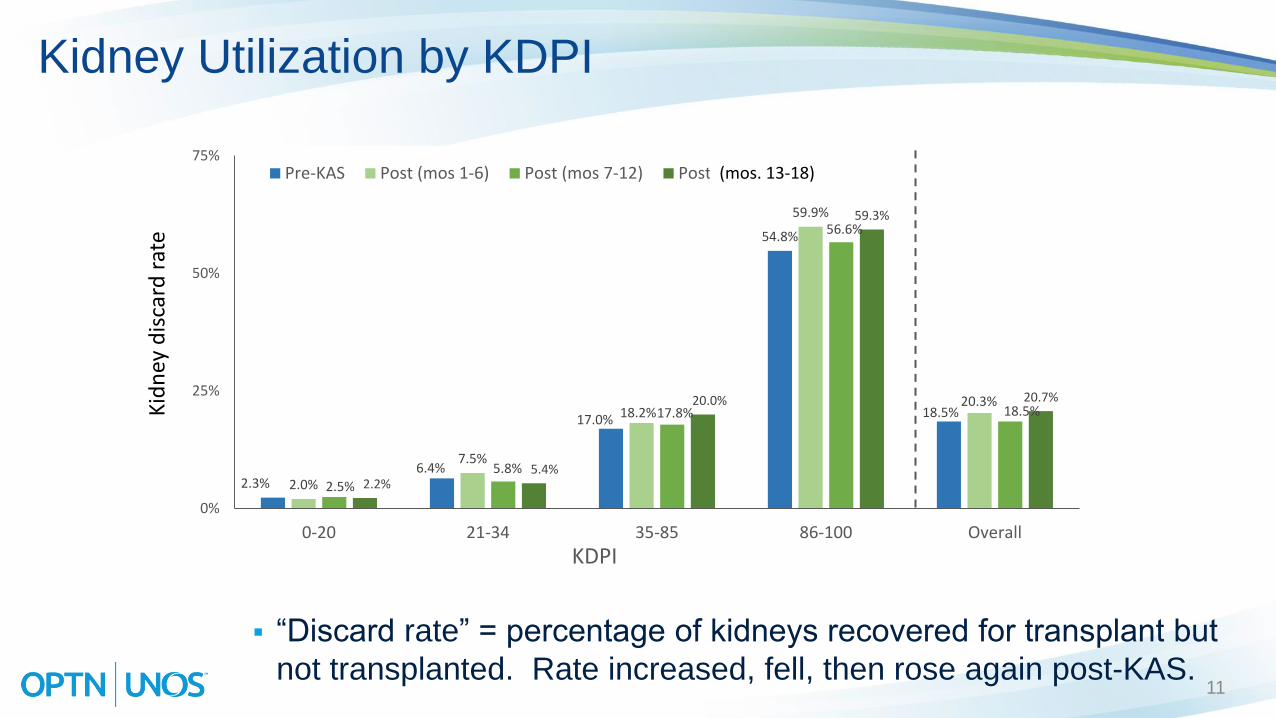
“Discard rate” = percentage of kidneys recovered for transplant but
not transplanted. Rate increased, fell, then rose again post-KAS.
Kidney Utilization by KDPI
2.3%6.4%
17.0%
54.8%
18.5%
2.0%
7.5%
18.2%
59.9%
20.3%
2.5%5.8%
17.8%
56.6%
18.5%
2.2%5.4%
20.0%
59.3%
20.7%
0%
25%
50%
75%
0-20 21-34 35-85 86-100 Overall
KDPI
Pre-KAS Post (mos 1-6) Post (mos 7-12) Post (mos 12-18)(mos. 13-18)
11
Kid
ney
dis
card
rat
e
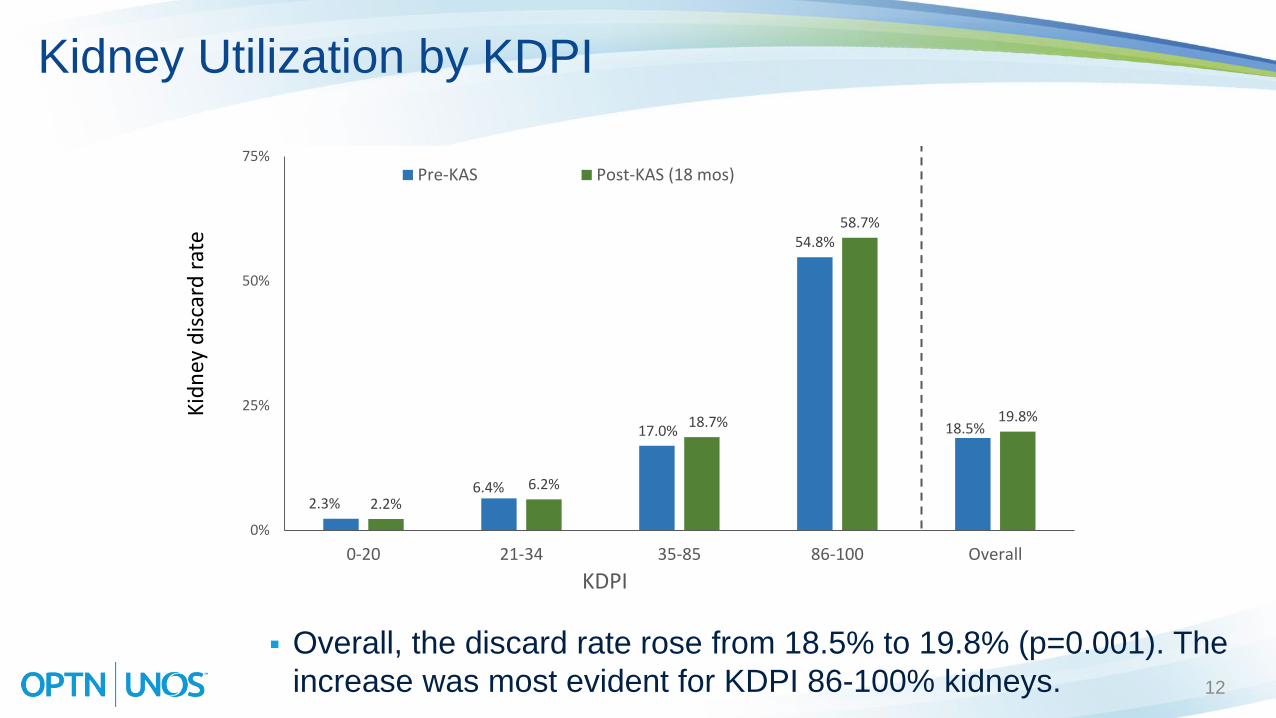
Overall, the discard rate rose from 18.5% to 19.8% (p=0.001). The
increase was most evident for KDPI 86-100% kidneys.
2.3%6.4%
17.0%
54.8%
18.5%
2.2%6.2%
18.7%
58.7%
19.8%
0%
25%
50%
75%
0-20 21-34 35-85 86-100 Overall
KDPI
Pre-KAS Post-KAS (18 mos)
Kidney Utilization by KDPI
12
Kid
ney
dis
card
rat
e
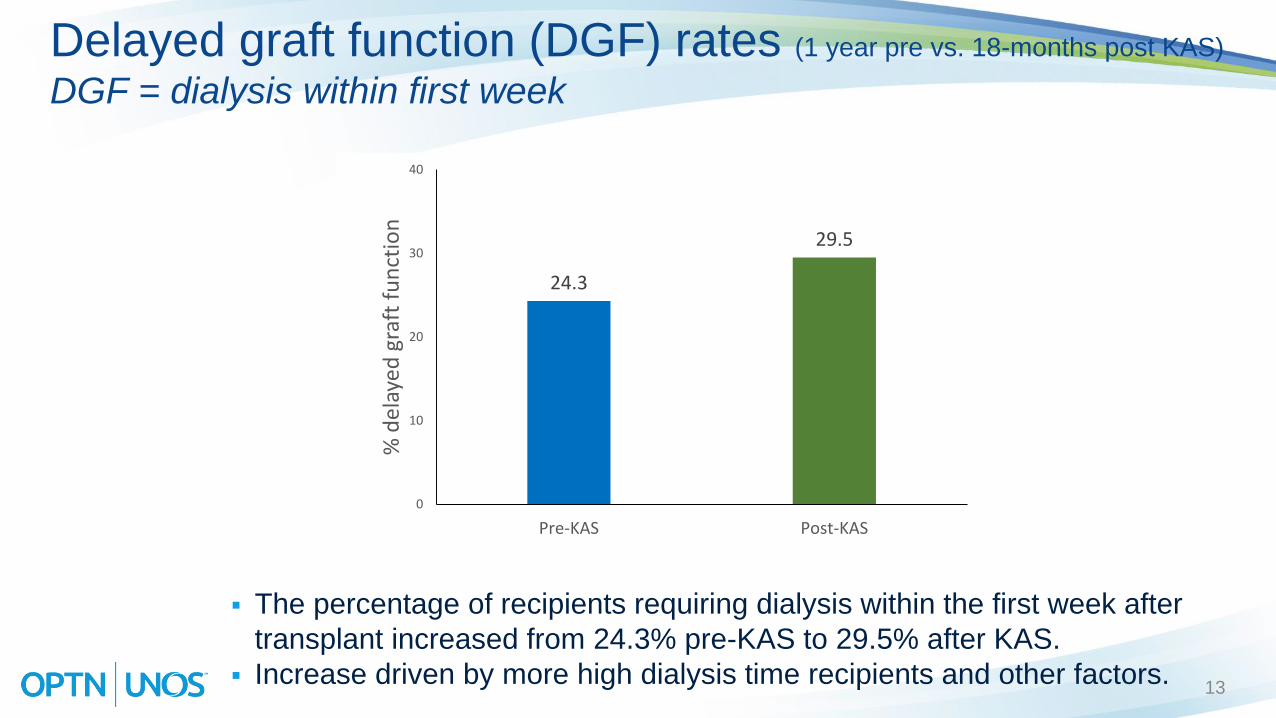
Delayed graft function (DGF) rates (1 year pre vs. 18-months post KAS)
DGF = dialysis within first week
The percentage of recipients requiring dialysis within the first week after
transplant increased from 24.3% pre-KAS to 29.5% after KAS.
Increase driven by more high dialysis time recipients and other factors.
24.3
29.5
0
10
20
30
40
Pre-KAS Post-KAS
% d
elay
ed g
raft
fu
nct
ion
13
23.3%23.5%
25.2%24.8%
25.9%26.1%
24.0%
26.2%
23.2%
24.9%
22.9%22.0%
31.3%32.6%
28.0%
30.7%
31.6%31.7%
27.5%
29.5%
27.5%28.4%
27.6% 28.0%
28.9%
32.0%
28.9%30.0%
25.9%
30.4%
0%
5%
10%
15%
20%
25%
30%
35%
14-Aug-13 22-Nov-13 2-Mar-14 10-Jun-14 18-Sep-14 27-Dec-14 6-Apr-15 15-Jul-15 23-Oct-15 31-Jan-16 10-May-16 18-Aug-16
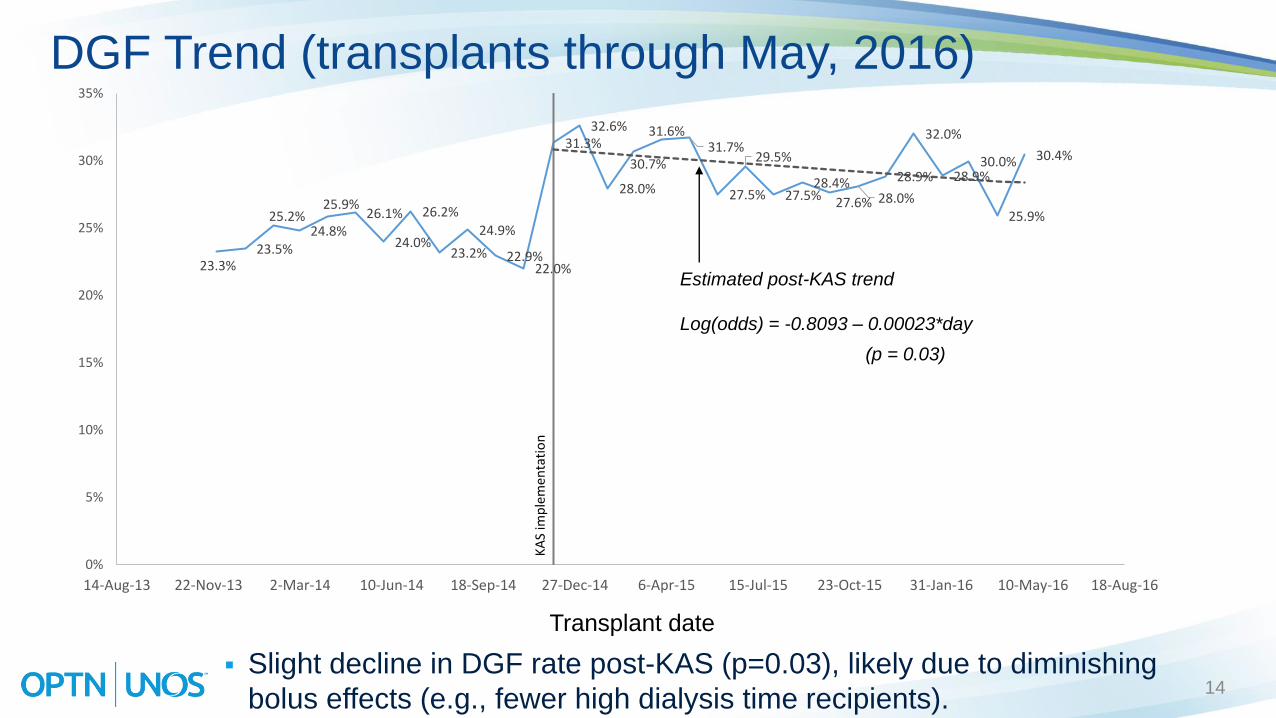
DGF Trend (transplants through May, 2016)
Slight decline in DGF rate post-KAS (p=0.03), likely due to diminishing
bolus effects (e.g., fewer high dialysis time recipients).
Estimated post-KAS trend
Log(odds) = -0.8093 – 0.00023*day
(p = 0.03)
KA
S im
ple
men
tati
on
Transplant date
14
95.7495.31
90
100
12/04/2013-12/03/2014 12/04/2014-10/31/2015
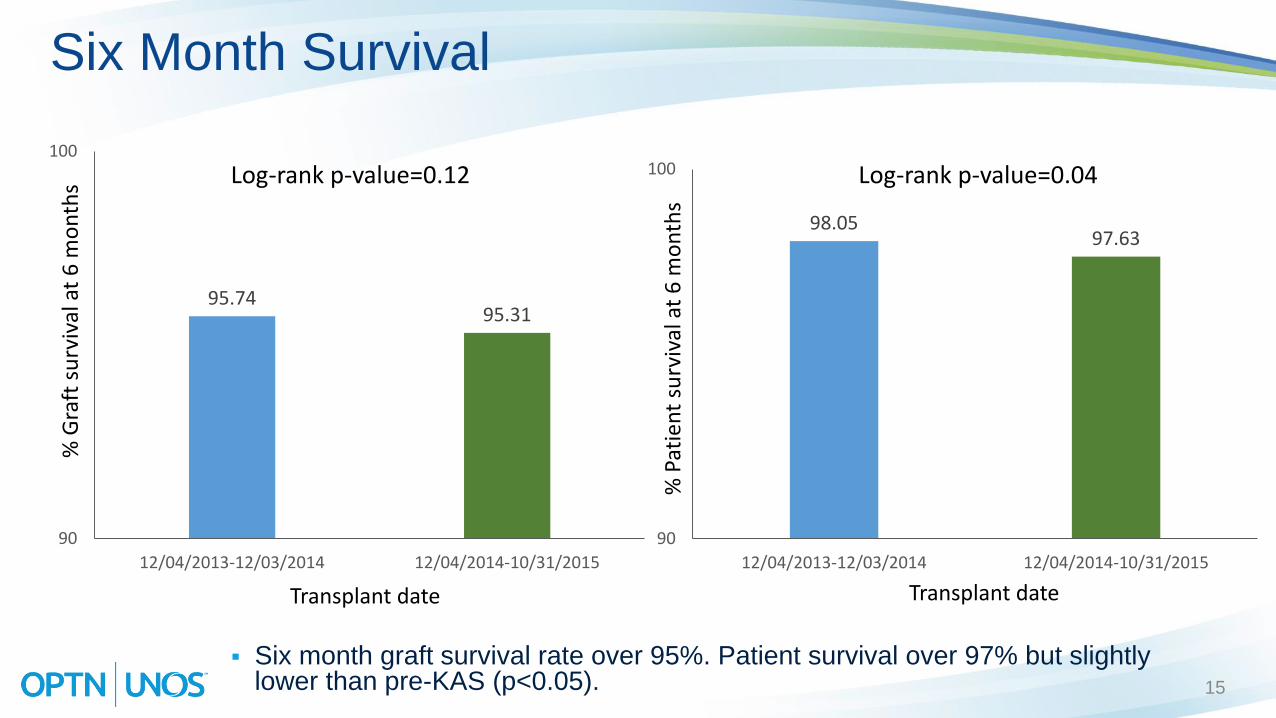
Six Month Survival
(60% of accepts)
(28%)(40%)
Log-rank p-value=0.12
Six month graft survival rate over 95%. Patient survival over 97% but slightly lower than pre-KAS (p<0.05).
% G
raft
su
rviv
al a
t 6
mo
nth
s
98.0597.63
90
100
12/04/2013-12/03/2014 12/04/2014-10/31/2015
% P
atie
nt
surv
ival
at
6 m
on
ths
Transplant date Transplant date
Log-rank p-value=0.04
15
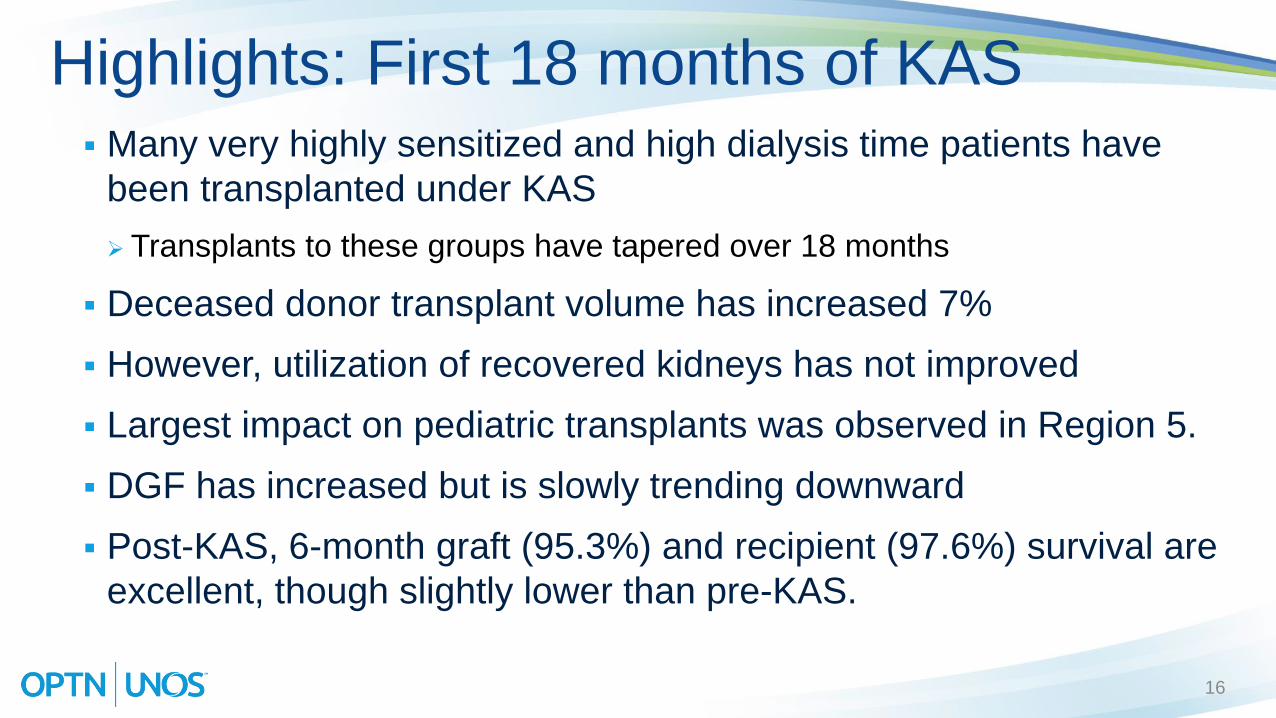
Many very highly sensitized and high dialysis time patients have
been transplanted under KAS
Transplants to these groups have tapered over 18 months
Deceased donor transplant volume has increased 7%
However, utilization of recovered kidneys has not improved
Largest impact on pediatric transplants was observed in Region 5.
DGF has increased but is slowly trending downward
Post-KAS, 6-month graft (95.3%) and recipient (97.6%) survival are
excellent, though slightly lower than pre-KAS.
Highlights: First 18 months of KAS
16
Additional information
For more detailed analyses of KAS’s impact after 1 year, other resources are available:
https://www.transplantpro.org/wp-content/uploads/sites/3/KAS_12month_analysis.pdf
Stewart, D. E., Kucheryavaya, A. Y., Klassen, D. K., Turgeon, N. A., Formica, R. N., & Aeder, M. I. (2016). Changes in Deceased Donor Kidney Transplantation One Year After KAS Implementation. American Journal of Transplantation, 16(6), 1834-1847.)
17
Incorrect KDPI Mapping Table
18
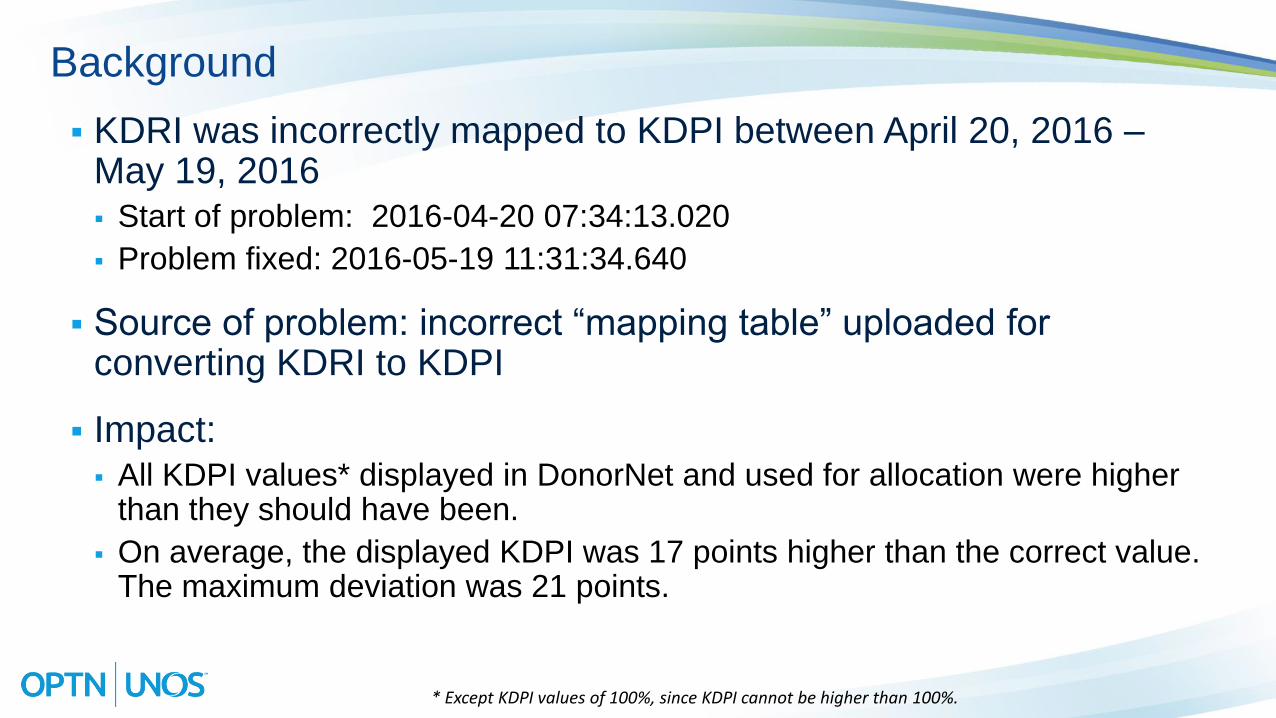
KDRI was incorrectly mapped to KDPI between April 20, 2016 –May 19, 2016 Start of problem: 2016-04-20 07:34:13.020
Problem fixed: 2016-05-19 11:31:34.640
Source of problem: incorrect “mapping table” uploaded for converting KDRI to KDPI
Impact: All KDPI values* displayed in DonorNet and used for allocation were higher
than they should have been.
On average, the displayed KDPI was 17 points higher than the correct value. The maximum deviation was 21 points.
Background
* Except KDPI values of 100%, since KDPI cannot be higher than 100%.
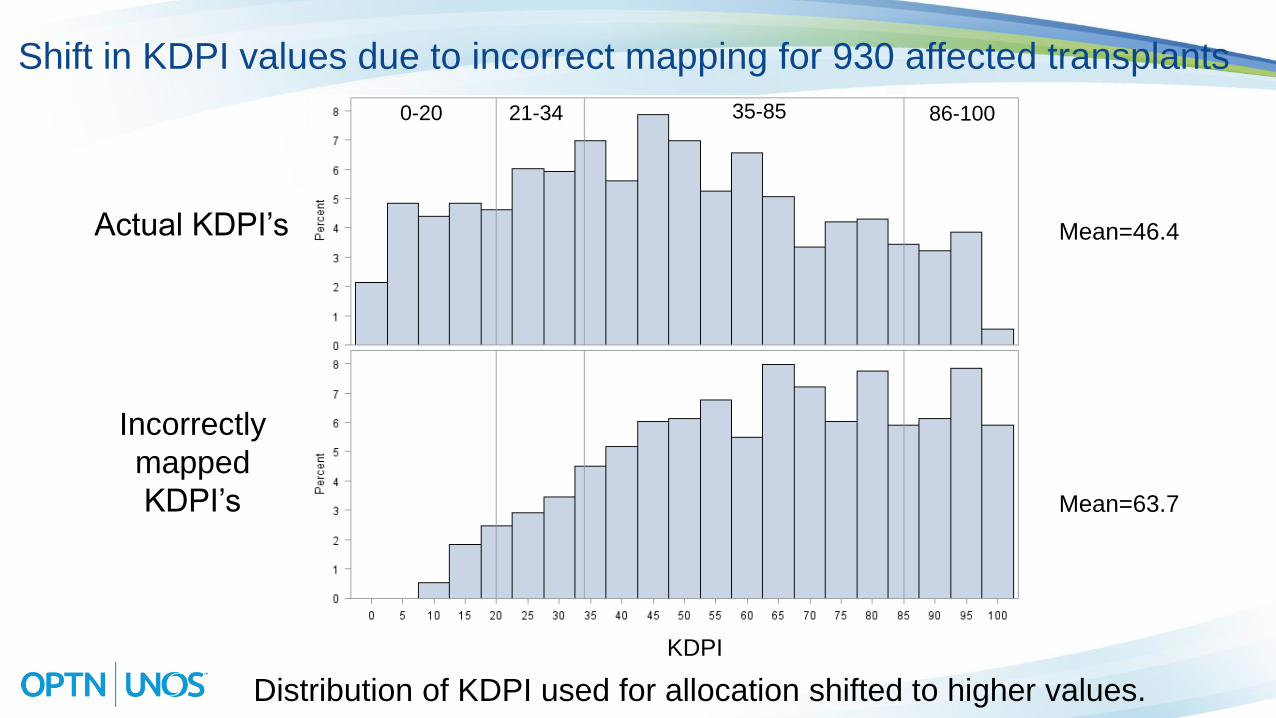
Shift in KDPI values due to incorrect mapping for 930 affected transplants
KDPI
Actual KDPI’s
Incorrectly
mapped
KDPI’s
0-20 21-34 35-85 86-100
Distribution of KDPI used for allocation shifted to higher values.
Mean=46.4
Mean=63.7
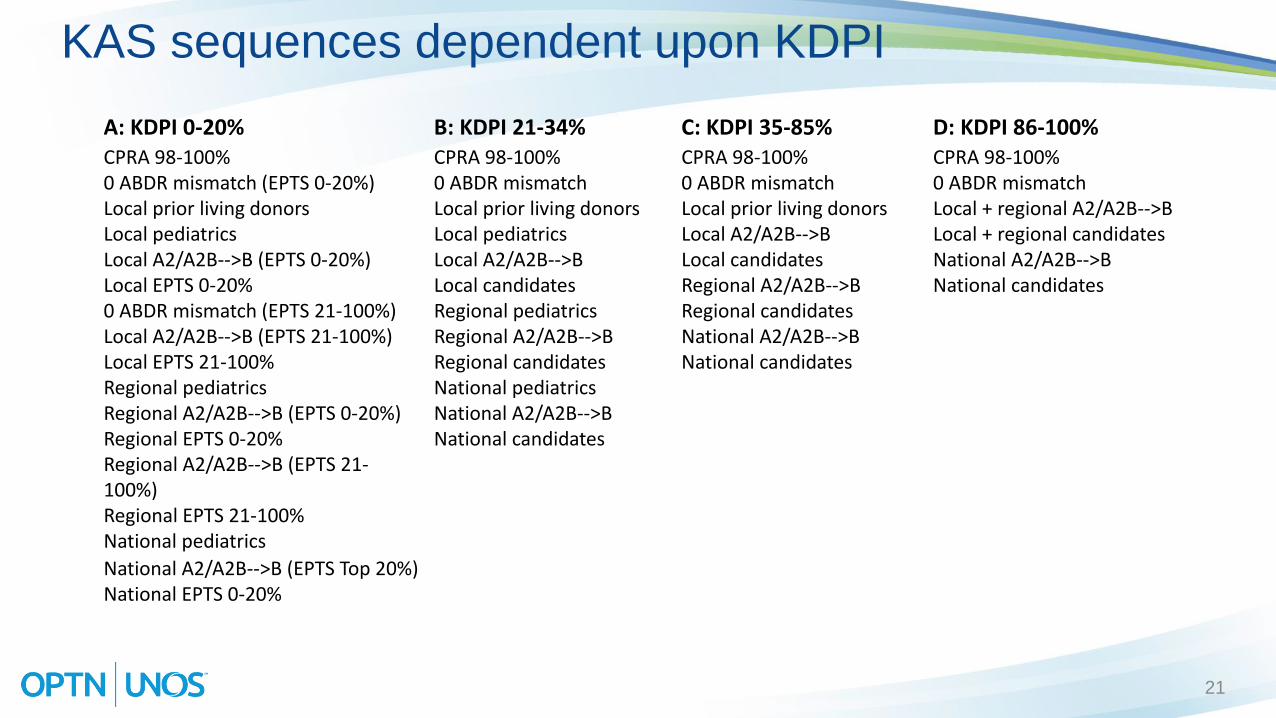
KAS sequences dependent upon KDPI
A: KDPI 0-20% B: KDPI 21-34% C: KDPI 35-85% D: KDPI 86-100%CPRA 98-100% CPRA 98-100% CPRA 98-100% CPRA 98-100%0 ABDR mismatch (EPTS 0-20%) 0 ABDR mismatch 0 ABDR mismatch 0 ABDR mismatch Local prior living donors Local prior living donors Local prior living donors Local + regional A2/A2B-->BLocal pediatrics Local pediatrics Local A2/A2B-->B Local + regional candidatesLocal A2/A2B-->B (EPTS 0-20%) Local A2/A2B-->B Local candidates National A2/A2B-->BLocal EPTS 0-20% Local candidates Regional A2/A2B-->B National candidates0 ABDR mismatch (EPTS 21-100%) Regional pediatrics Regional candidatesLocal A2/A2B-->B (EPTS 21-100%) Regional A2/A2B-->B National A2/A2B-->BLocal EPTS 21-100% Regional candidates National candidatesRegional pediatrics National pediatricsRegional A2/A2B-->B (EPTS 0-20%) National A2/A2B-->BRegional EPTS 0-20% National candidatesRegional A2/A2B-->B (EPTS 21-100%)Regional EPTS 21-100%National pediatrics
National A2/A2B-->B (EPTS Top 20%)National EPTS 0-20%
21
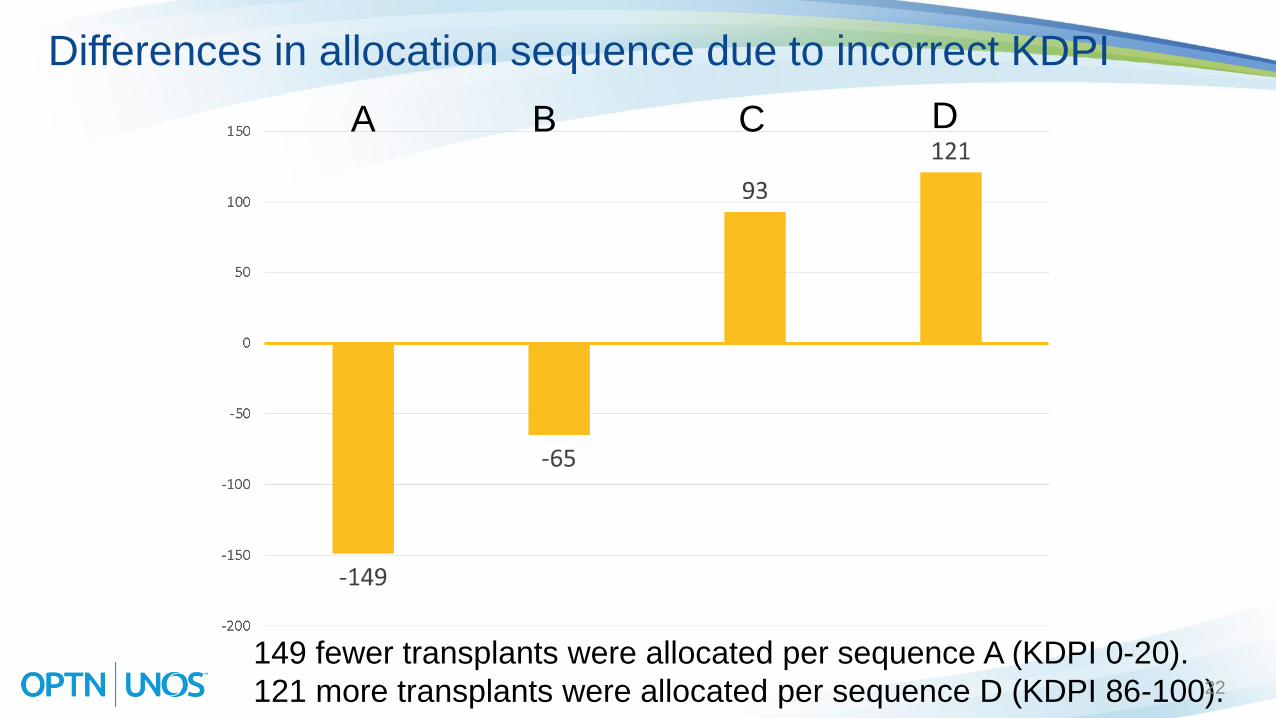
Differences in allocation sequence due to incorrect KDPI
149 fewer transplants were allocated per sequence A (KDPI 0-20).
121 more transplants were allocated per sequence D (KDPI 86-100).
A B C D
22
23.6%
26.8%
24.7%
27.4%
22.3%22.3%
25.8%25.5%25.0%
27.2%
28.9%
24.8%
26.7%26.2%
24.7%24.6%
26.8%
16.3%
27.6%
0.0%
5.0%
10.0%
15.0%
20.0%
25.0%
30.0%
09/18/14 12/27/14 04/06/15 07/15/15 10/23/15 01/31/16 05/10/16 08/18/16
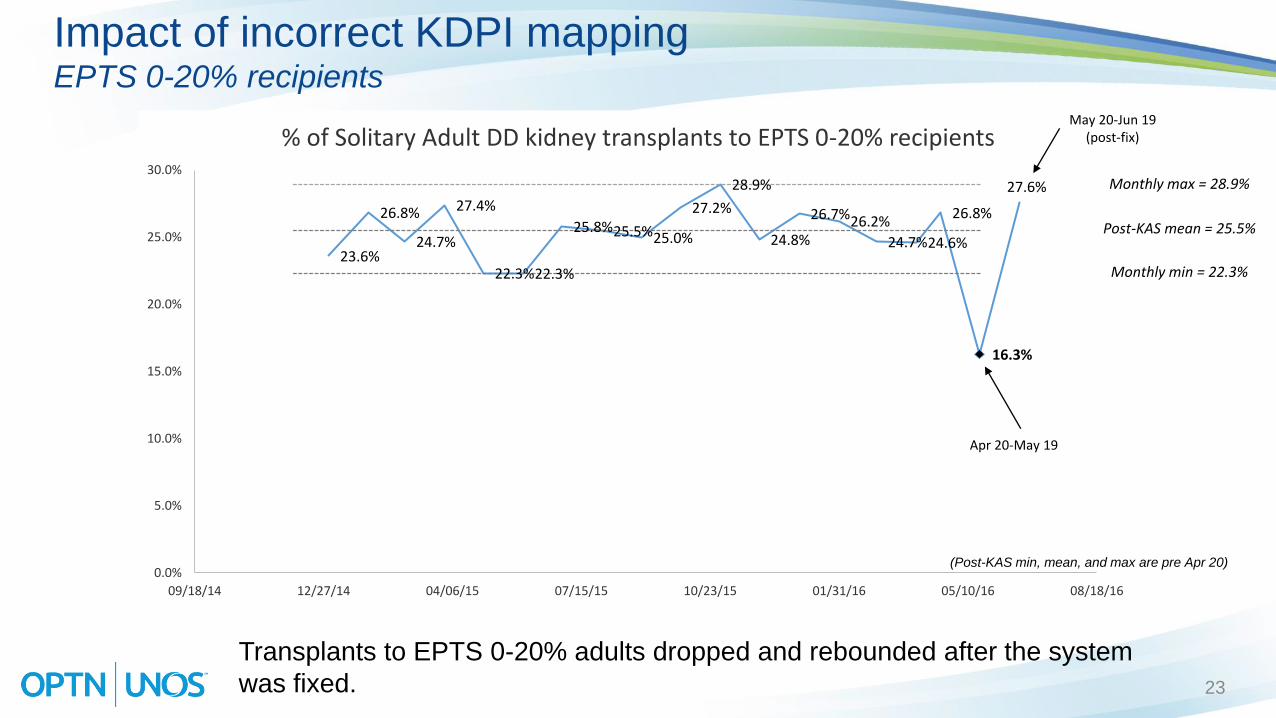
% of Solitary Adult DD kidney transplants to EPTS 0-20% recipients
Apr 20-May 19
Impact of incorrect KDPI mappingEPTS 0-20% recipients
Transplants to EPTS 0-20% adults dropped and rebounded after the system
was fixed.
Post-KAS mean = 25.5%
Monthly min = 22.3%
Monthly max = 28.9%
(Post-KAS min, mean, and max are pre Apr 20)
May 20-Jun 19 (post-fix)
23
76.1%
72.9%75.1%
72.5%
77.6%77.7%
74.2%74.5%75.0%72.8%
71.1%
75.1%73.3%73.8%
75.3%75.4%73.2%
83.7%
72.3%
50.0%
75.0%
100.0%
09/18/14 12/27/14 04/06/15 07/15/15 10/23/15 01/31/16 05/10/16 08/18/16
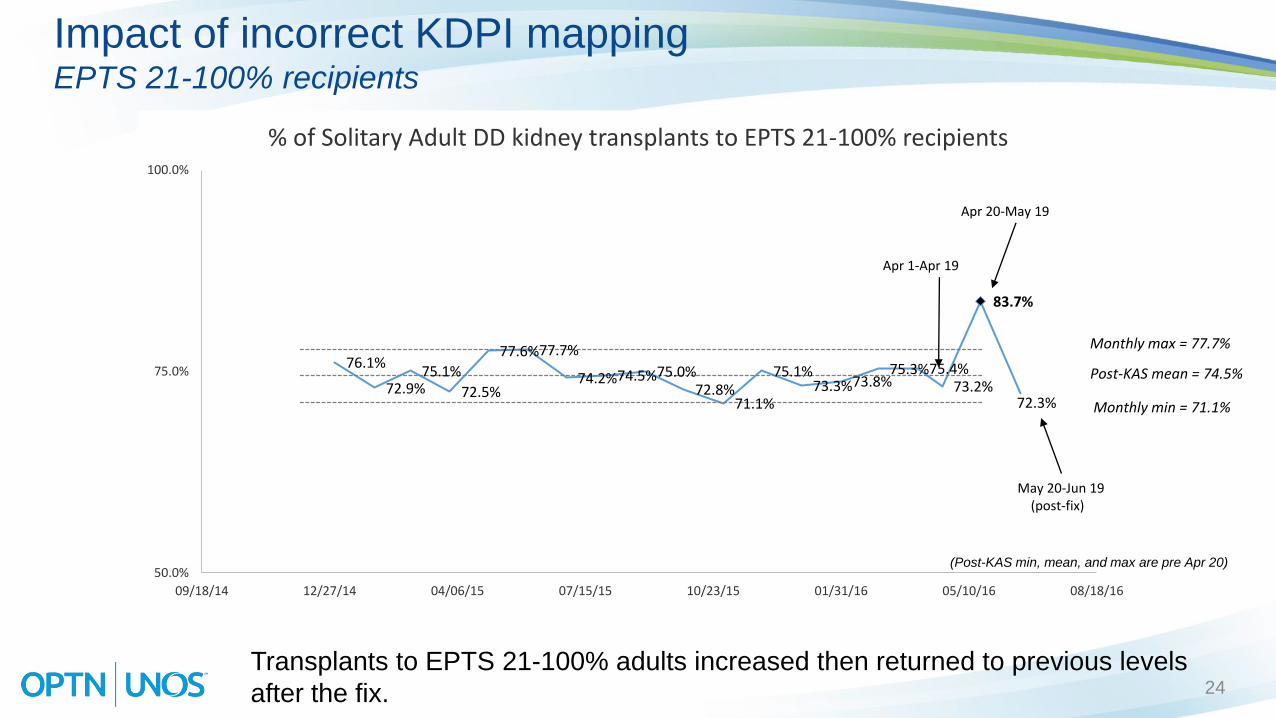
% of Solitary Adult DD kidney transplants to EPTS 21-100% recipients
Apr 20-May 19
Apr 1-Apr 19
Impact of incorrect KDPI mappingEPTS 21-100% recipients
Transplants to EPTS 21-100% adults increased then returned to previous levels
after the fix.
Post-KAS mean = 74.5%
Monthly min = 71.1%
Monthly max = 77.7%
(Post-KAS min, mean, and max are pre Apr 20)
May 20-Jun 19(post-fix)
24
The correct table was uploaded on May 19th, 2016
Tested by IT department and validated by Research department
Working as expected since May 19th, 2016
New processes put in place to prevent future problems of this nature
All programs that performed a transplant during this period were
informed of the correct (lower) KDPI value for each recipient.
Fixing the problem
25
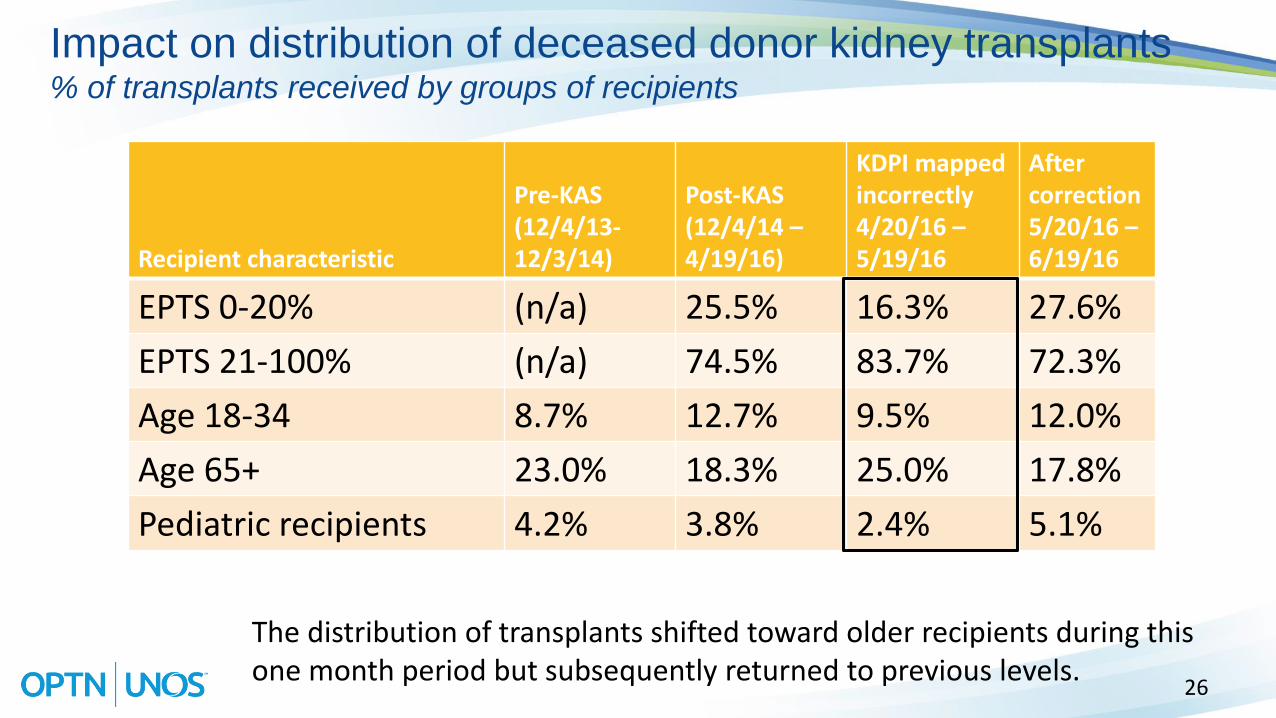
Recipient characteristic
Pre-KAS (12/4/13-12/3/14)
Post-KAS (12/4/14 –4/19/16)
KDPI mapped incorrectly 4/20/16 –5/19/16
After correction 5/20/16 –6/19/16
EPTS 0-20% (n/a) 25.5% 16.3% 27.6%
EPTS 21-100% (n/a) 74.5% 83.7% 72.3%
Age 18-34 8.7% 12.7% 9.5% 12.0%
Age 65+ 23.0% 18.3% 25.0% 17.8%
Pediatric recipients 4.2% 3.8% 2.4% 5.1%
Impact on distribution of deceased donor kidney transplants% of transplants received by groups of recipients
The distribution of transplants shifted toward older recipients during this one month period but subsequently returned to previous levels.
26
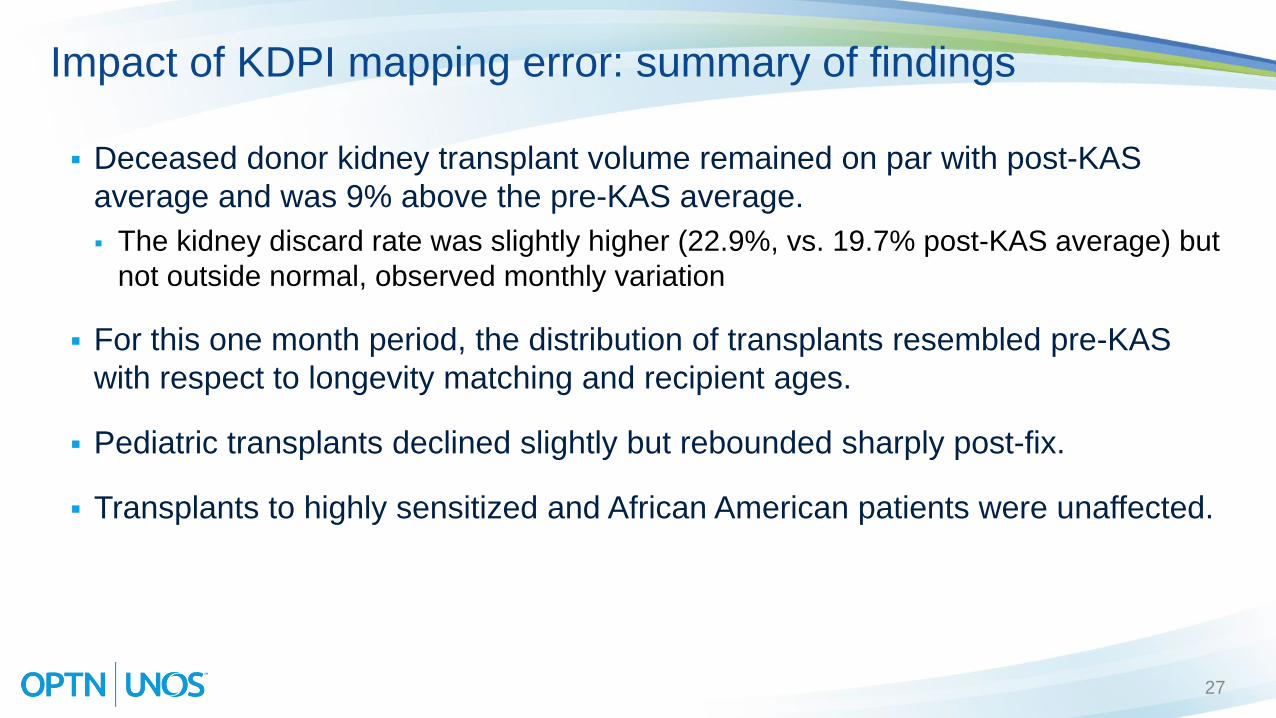
Deceased donor kidney transplant volume remained on par with post-KAS
average and was 9% above the pre-KAS average.
The kidney discard rate was slightly higher (22.9%, vs. 19.7% post-KAS average) but
not outside normal, observed monthly variation
For this one month period, the distribution of transplants resembled pre-KAS
with respect to longevity matching and recipient ages.
Pediatric transplants declined slightly but rebounded sharply post-fix.
Transplants to highly sensitized and African American patients were unaffected.
Impact of KDPI mapping error: summary of findings
27
UNOS Research DepartmentData Quality TeamCatherine Monstello, RRT, CPHQJohn Beck, MSMESherri WilliamsBrooke Chenault, CCRAJessie Maker, MSTammy SneadTenisha AtobrahPenny BrockSharon GravesClay McDonaldJo Smith
Data ScientistsHarris McGehee
Data Analytics TeamSarah TarantoTim BakerJude Maghirang, MSYulin ChengEric BeesonAlex GarzaHeather NeilDenise TrippAnn Harper, MPHJaime WilliamsonWes RossonAlice Toll
Scientists and AnalystsLeah Edwards, PhDErick Edwards, PhDWida Cherikh, PhDBob Carrico, PhDJohn Rosendale, MSDarren Stewart, MSJennifer Wainright, PhDMarissa Clark-Quimby, MSAmber Wilk, PhDAnna Kucheryavaya, MSMike Curry, MSRead Urban, MPHVictoria Garcia, MPHAmanda Robinson, MSLeadership
Ryan Ehrensberger, PhD, FACHEDavid Klassen, MDCherri Taylor


