38
The New Mexico Economy: Recent Developments and Outlook 18 th Annual Data Users Conference Jeffrey Mitchell, BBER Director

The New Mexico Economy: Recent Developments and Outlook
18th Annual Data Users Conference Jeffrey Mitchell, BBER Director
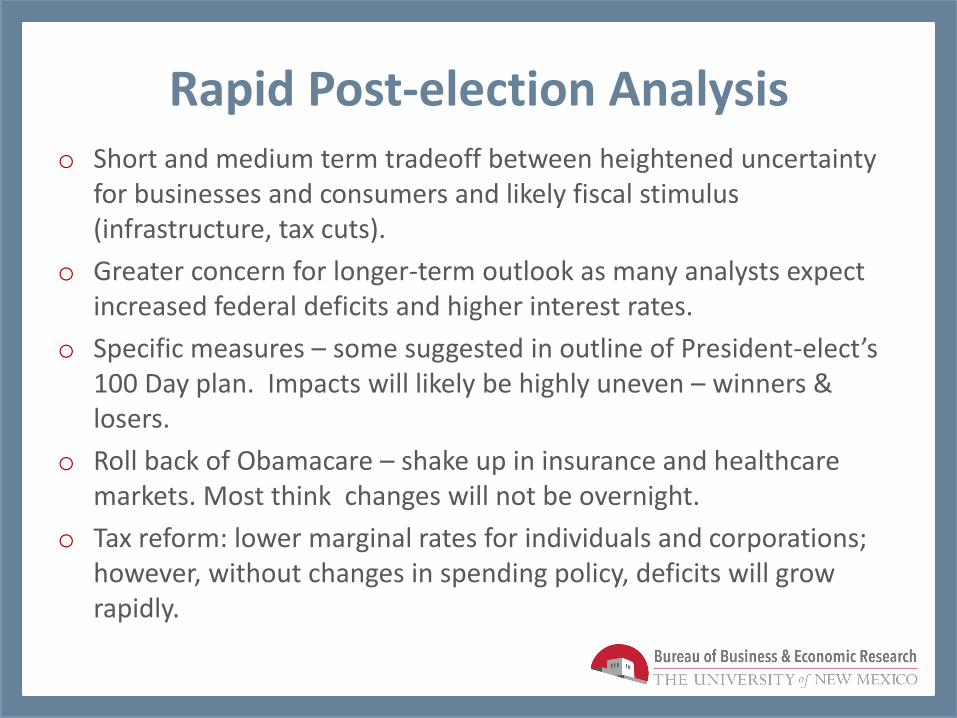
Rapid Post-election Analysis o Short and medium term tradeoff between heightened uncertainty
for businesses and consumers and likely fiscal stimulus (infrastructure, tax cuts).
o Greater concern for longer-term outlook as many analysts expect increased federal deficits and higher interest rates.
o Specific measures – some suggested in outline of President-elect’s 100 Day plan. Impacts will likely be highly uneven – winners & losers.
o Roll back of Obamacare – shake up in insurance and healthcare markets. Most think changes will not be overnight.
o Tax reform: lower marginal rates for individuals and corporations; however, without changes in spending policy, deficits will grow rapidly.
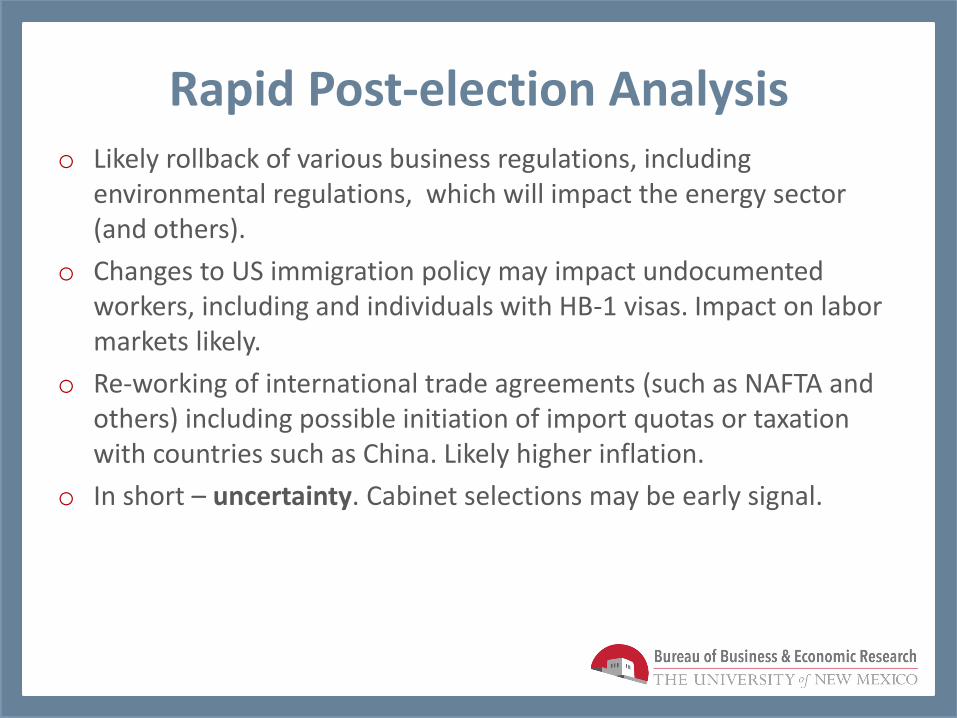
Rapid Post-election Analysis o Likely rollback of various business regulations, including
environmental regulations, which will impact the energy sector (and others).
o Changes to US immigration policy may impact undocumented workers, including and individuals with HB-1 visas. Impact on labor markets likely.
o Re-working of international trade agreements (such as NAFTA and others) including possible initiation of import quotas or taxation with countries such as China. Likely higher inflation.
o In short – uncertainty. Cabinet selections may be early signal.
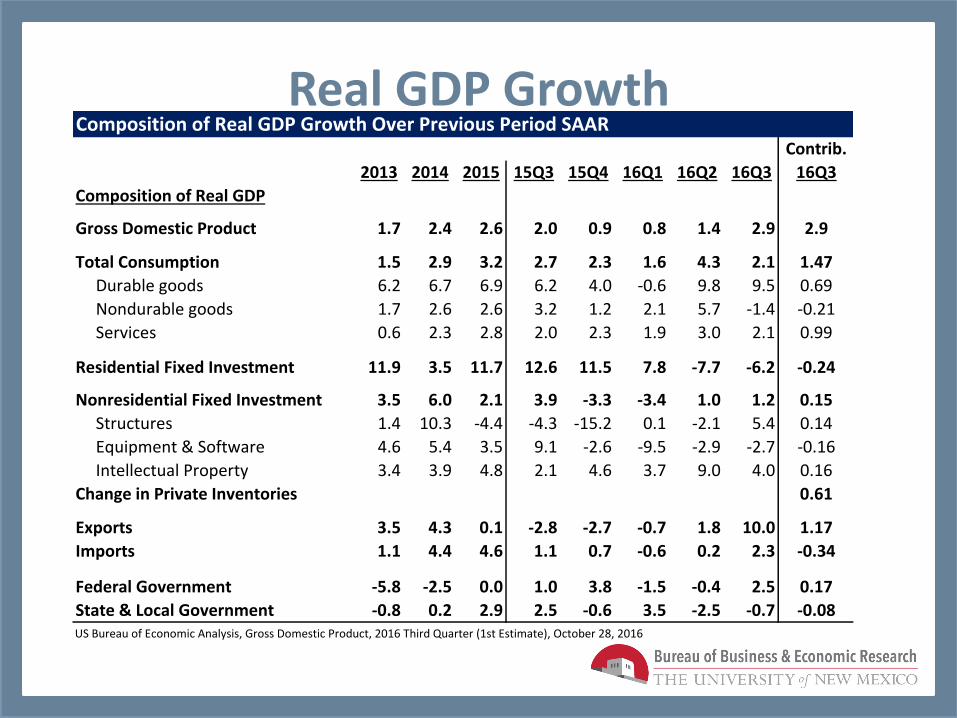
Real GDP Growth
Contrib.
2013 2014 2015 15Q3 15Q4 16Q1 16Q2 16Q3 16Q3
Composition of Real GDP
Gross Domestic Product 1.7 2.4 2.6 2.0 0.9 0.8 1.4 2.9 2.9
Total Consumption 1.5 2.9 3.2 2.7 2.3 1.6 4.3 2.1 1.47
Durable goods 6.2 6.7 6.9 6.2 4.0 -0.6 9.8 9.5 0.69
Nondurable goods 1.7 2.6 2.6 3.2 1.2 2.1 5.7 -1.4 -0.21
Services 0.6 2.3 2.8 2.0 2.3 1.9 3.0 2.1 0.99
Residential Fixed Investment 11.9 3.5 11.7 12.6 11.5 7.8 -7.7 -6.2 -0.24
Nonresidential Fixed Investment 3.5 6.0 2.1 3.9 -3.3 -3.4 1.0 1.2 0.15
Structures 1.4 10.3 -4.4 -4.3 -15.2 0.1 -2.1 5.4 0.14
Equipment & Software 4.6 5.4 3.5 9.1 -2.6 -9.5 -2.9 -2.7 -0.16
Intellectual Property 3.4 3.9 4.8 2.1 4.6 3.7 9.0 4.0 0.16
Change in Private Inventories 0.61
Exports 3.5 4.3 0.1 -2.8 -2.7 -0.7 1.8 10.0 1.17
Imports 1.1 4.4 4.6 1.1 0.7 -0.6 0.2 2.3 -0.34
Federal Government -5.8 -2.5 0.0 1.0 3.8 -1.5 -0.4 2.5 0.17
State & Local Government -0.8 0.2 2.9 2.5 -0.6 3.5 -2.5 -0.7 -0.08US Bureau of Economic Analysis, Gross Domestic Product, 2016 Third Quarter (1st Estimate), October 28, 2016
Composition of Real GDP Growth Over Previous Period SAAR
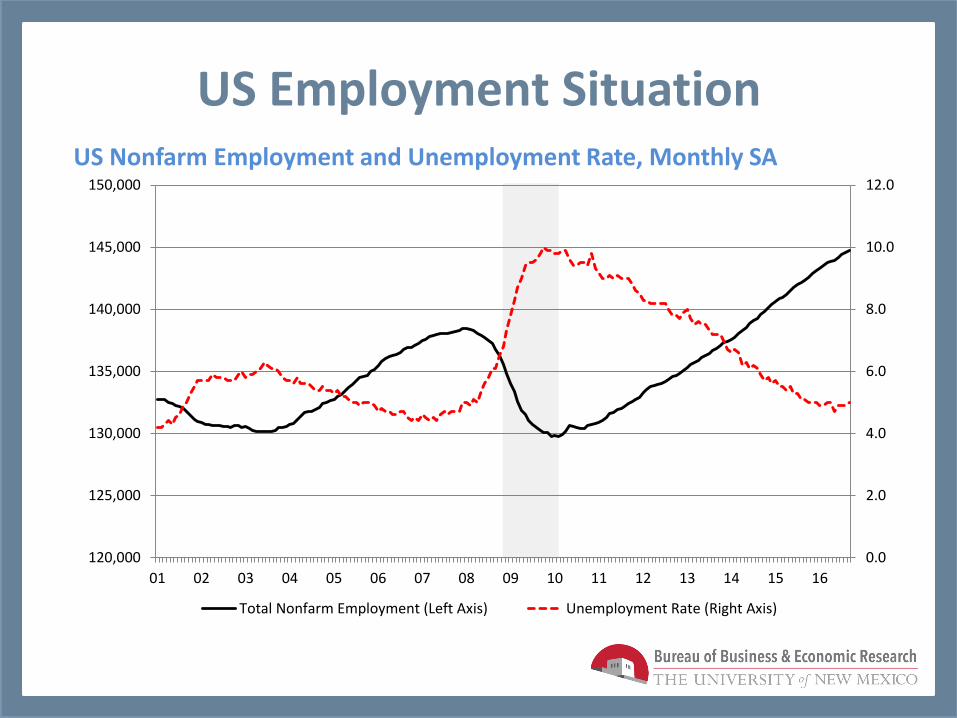
US Nonfarm Employment and Unemployment Rate, Monthly SA
US Employment Situation
0.0
2.0
4.0
6.0
8.0
10.0
12.0
120,000
125,000
130,000
135,000
140,000
145,000
150,000
01 02 03 04 05 06 07 08 09 10 11 12 13 14 15 16
Total Nonfarm Employment (Left Axis) Unemployment Rate (Right Axis)
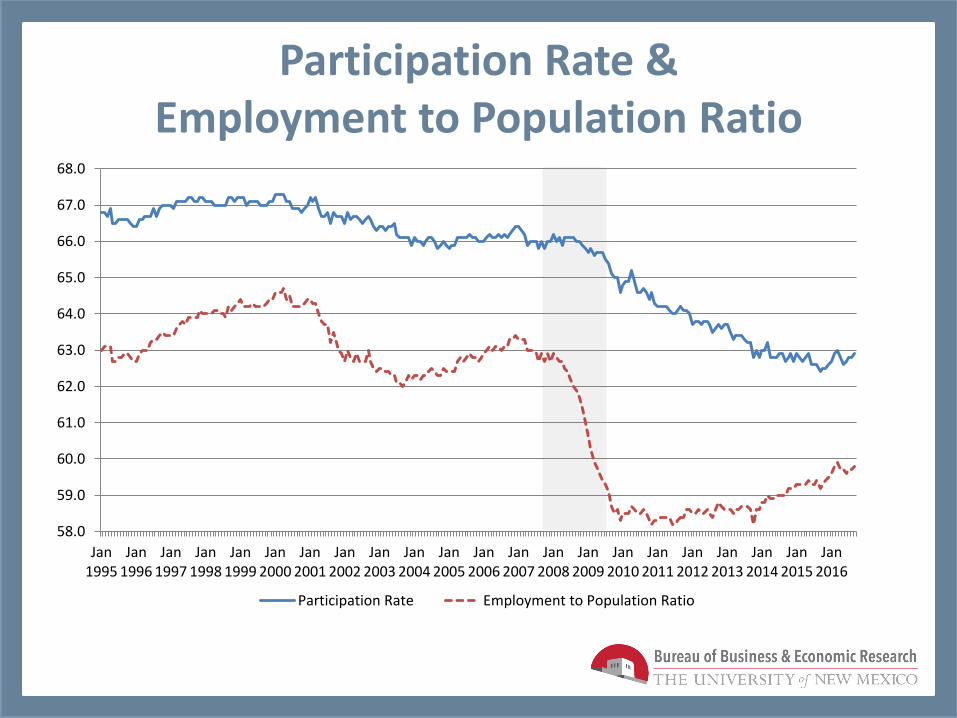
Participation Rate & Employment to Population Ratio
58.0
59.0
60.0
61.0
62.0
63.0
64.0
65.0
66.0
67.0
68.0
Jan1995
Jan1996
Jan1997
Jan1998
Jan1999
Jan2000
Jan2001
Jan2002
Jan2003
Jan2004
Jan2005
Jan2006
Jan2007
Jan2008
Jan2009
Jan2010
Jan2011
Jan2012
Jan2013
Jan2014
Jan2015
Jan2016
Participation Rate Employment to Population Ratio
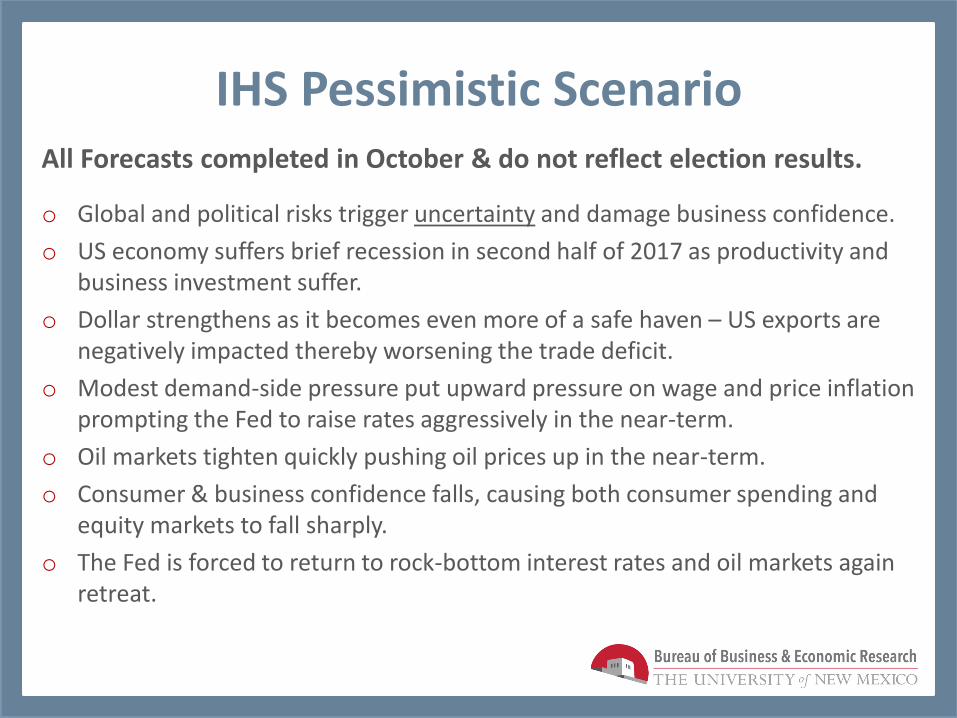
IHS Pessimistic Scenario All Forecasts completed in October & do not reflect election results.
o Global and political risks trigger uncertainty and damage business confidence.
o US economy suffers brief recession in second half of 2017 as productivity and business investment suffer.
o Dollar strengthens as it becomes even more of a safe haven – US exports are negatively impacted thereby worsening the trade deficit.
o Modest demand-side pressure put upward pressure on wage and price inflation prompting the Fed to raise rates aggressively in the near-term.
o Oil markets tighten quickly pushing oil prices up in the near-term.
o Consumer & business confidence falls, causing both consumer spending and equity markets to fall sharply.
o The Fed is forced to return to rock-bottom interest rates and oil markets again retreat.
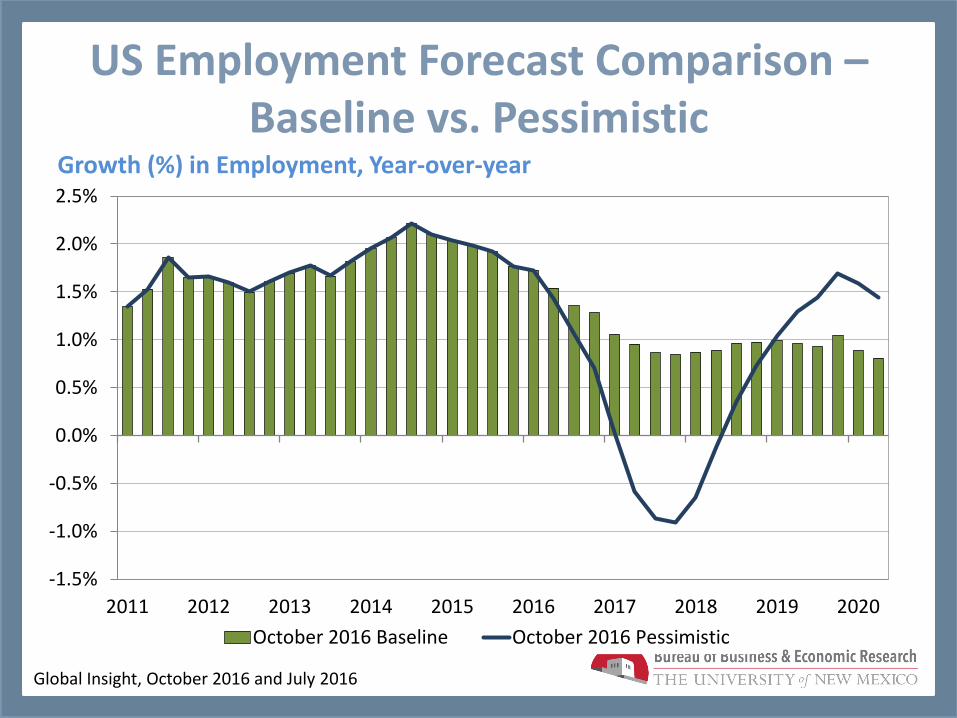
Growth (%) in Employment, Year-over-year
Global Insight, October 2016 and July 2016
US Employment Forecast Comparison – Baseline vs. Pessimistic
-1.5%
-1.0%
-0.5%
0.0%
0.5%
1.0%
1.5%
2.0%
2.5%
2011 2012 2013 2014 2015 2016 2017 2018 2019 2020
October 2016 Baseline October 2016 Pessimistic
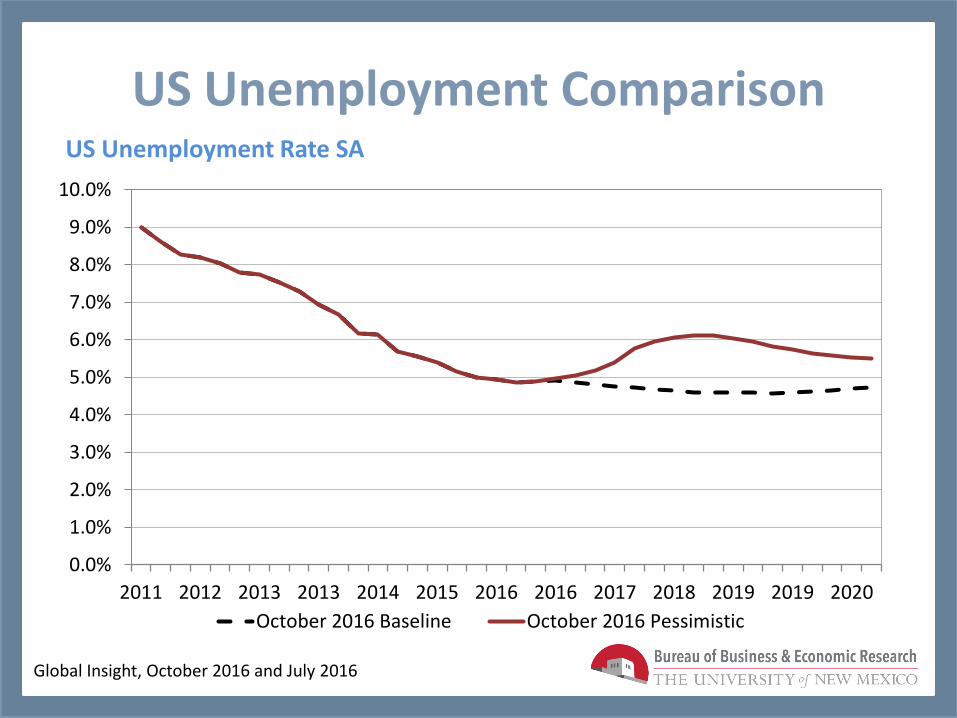
US Unemployment Rate SA
Global Insight, October 2016 and July 2016
US Unemployment Comparison
0.0%
1.0%
2.0%
3.0%
4.0%
5.0%
6.0%
7.0%
8.0%
9.0%
10.0%
2011 2012 2013 2013 2014 2015 2016 2016 2017 2018 2019 2019 2020
October 2016 Baseline October 2016 Pessimistic

Global Insight, October 2016
$ Per Barrel
WTI Price – Baseline vs. Pessimistic
$0
$20
$40
$60
$80
$100
$120
2011 2012 2013 2014 2015 2016 2017 2018 2019 2020
October 2016 Baseline October 2016 Pessimistic
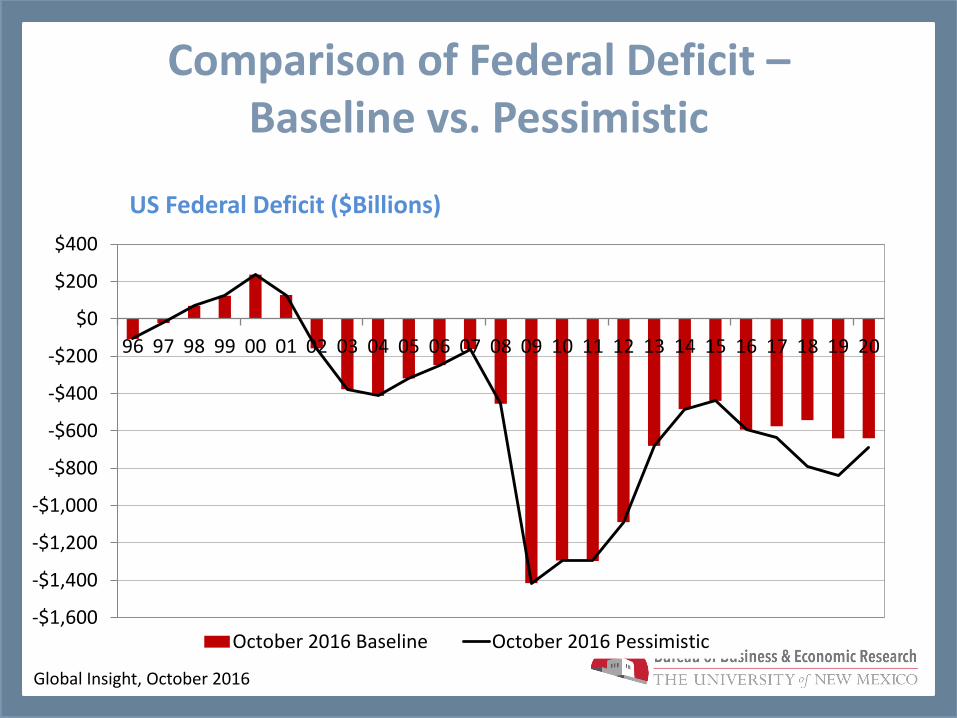
US Federal Deficit ($Billions)
Global Insight, October 2016
Comparison of Federal Deficit – Baseline vs. Pessimistic
-$1,600
-$1,400
-$1,200
-$1,000
-$800
-$600
-$400
-$200
$0
$200
$400
96 97 98 99 00 01 02 03 04 05 06 07 08 09 10 11 12 13 14 15 16 17 18 19 20
October 2016 Baseline October 2016 Pessimistic
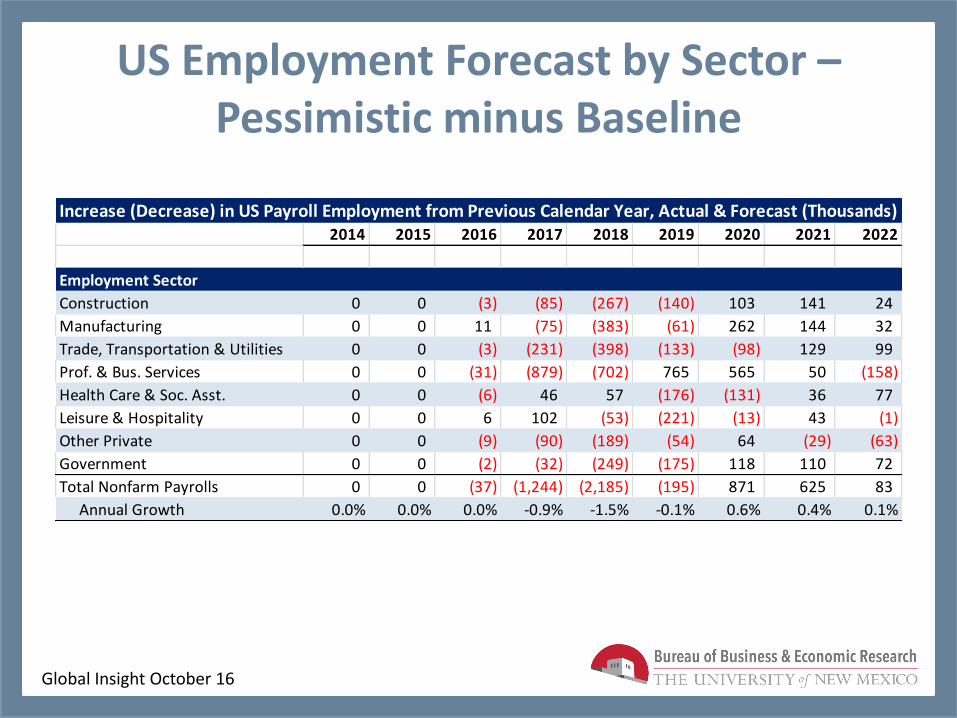
US Employment Forecast by Sector –Pessimistic minus Baseline
Global Insight October 16
2014 2015 2016 2017 2018 2019 2020 2021 2022
Employment Sector
Construction 0 0 (3) (85) (267) (140) 103 141 24
Manufacturing 0 0 11 (75) (383) (61) 262 144 32
Trade, Transportation & Utilities 0 0 (3) (231) (398) (133) (98) 129 99
Prof. & Bus. Services 0 0 (31) (879) (702) 765 565 50 (158)
Health Care & Soc. Asst. 0 0 (6) 46 57 (176) (131) 36 77
Leisure & Hospitality 0 0 6 102 (53) (221) (13) 43 (1)
Other Private 0 0 (9) (90) (189) (54) 64 (29) (63)
Government 0 0 (2) (32) (249) (175) 118 110 72
Total Nonfarm Payrolls 0 0 (37) (1,244) (2,185) (195) 871 625 83
Annual Growth 0.0% 0.0% 0.0% -0.9% -1.5% -0.1% 0.6% 0.4% 0.1%
Increase (Decrease) in US Payroll Employment from Previous Calendar Year, Actual & Forecast (Thousands)
New Mexico Review
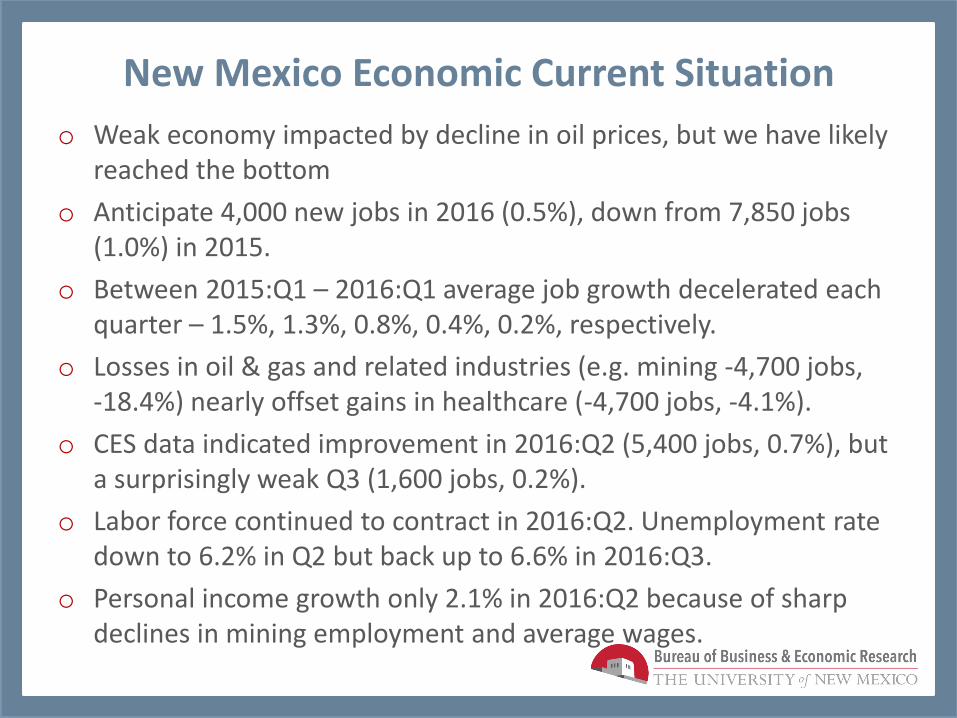
New Mexico Economic Current Situation
o Weak economy impacted by decline in oil prices, but we have likely reached the bottom
o Anticipate 4,000 new jobs in 2016 (0.5%), down from 7,850 jobs (1.0%) in 2015.
o Between 2015:Q1 – 2016:Q1 average job growth decelerated each quarter – 1.5%, 1.3%, 0.8%, 0.4%, 0.2%, respectively.
o Losses in oil & gas and related industries (e.g. mining -4,700 jobs, -18.4%) nearly offset gains in healthcare (-4,700 jobs, -4.1%).
o CES data indicated improvement in 2016:Q2 (5,400 jobs, 0.7%), but a surprisingly weak Q3 (1,600 jobs, 0.2%).
o Labor force continued to contract in 2016:Q2. Unemployment rate down to 6.2% in Q2 but back up to 6.6% in 2016:Q3.
o Personal income growth only 2.1% in 2016:Q2 because of sharp declines in mining employment and average wages.

Job Growth by Sector, 2016
Divergent Geographical Patterns of Growth
o Decline in oil prices is having uneven impact on New Mexico economy.
o In 2016Q1, Albuquerque MSA added >6,000 jobs (1.7%) while non-metro NM lost -5,380 jobs (-1.7%); state total (1,625 net jobs, 0.2%)
o Gross receipts in oil producing counties were down $3.0 billion (-15%) but up $670 million (1.9%) in the rest of the state in Jan-June timeframe.
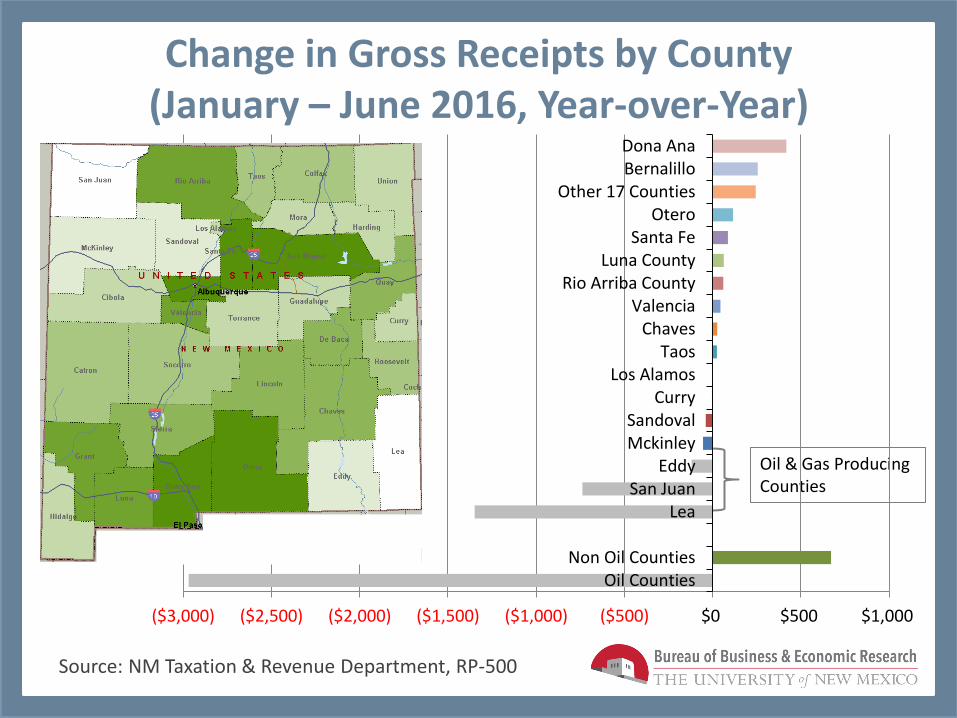
Change in Gross Receipts by County (January – June 2016, Year-over-Year)
Source: NM Taxation & Revenue Department, RP-500
Oil & Gas Producing Counties
($3,000) ($2,500) ($2,000) ($1,500) ($1,000) ($500) $0 $500 $1,000
Oil CountiesNon Oil Counties
LeaSan Juan
EddyMckinleySandoval
CurryLos Alamos
TaosChaves
ValenciaRio Arriba County
Luna CountySanta Fe
OteroOther 17 Counties
BernalilloDona Ana
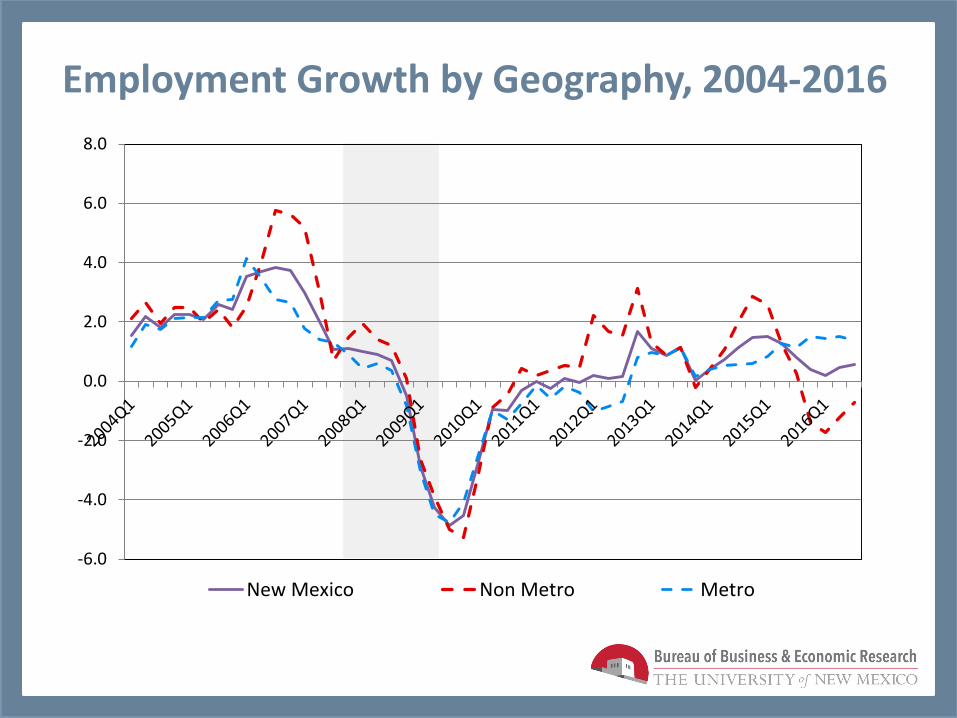
Employment Growth by Geography, 2004-2016
-6.0
-4.0
-2.0
0.0
2.0
4.0
6.0
8.0
New Mexico Non Metro Metro
Impact of Oil Price Collapse on State Finances
o Decline in oil prices continues to wreak havoc on State finances.
o In July alone recurring revenues down 11% from year earlier; Gross receipts collections down 8.5%; Oil & Gas related revenues down 36%.
o Special Session cut budget by 2.7%; further cuts likely in 2017 session.
o Oil production down 7.4% in 2016Q2 (vs. 2015Q2), value down 27.1%.
o Expect production losses to flatten by end-2017 but benefits to State finances will lag.

New Mexico State General Fund Revenues, by Source
Source: NMTRI
Oil & Gas (Direct & Indirect) = 31%
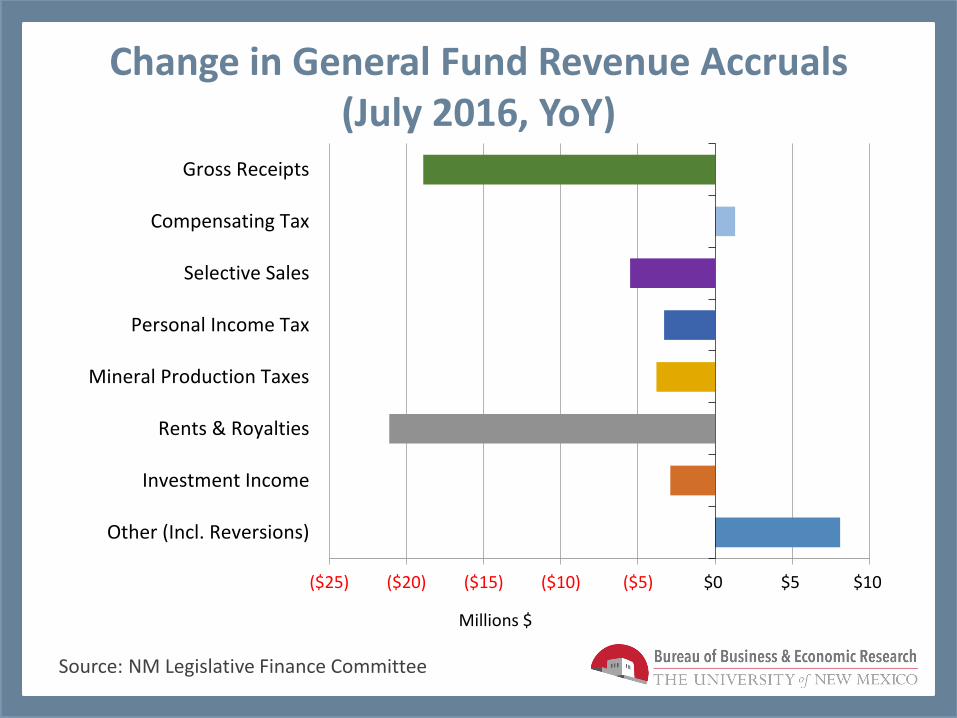
Change in General Fund Revenue Accruals (July 2016, YoY)
Source: NM Legislative Finance Committee
($25) ($20) ($15) ($10) ($5) $0 $5 $10
Other (Incl. Reversions)
Investment Income
Rents & Royalties
Mineral Production Taxes
Personal Income Tax
Selective Sales
Compensating Tax
Gross Receipts
Millions $
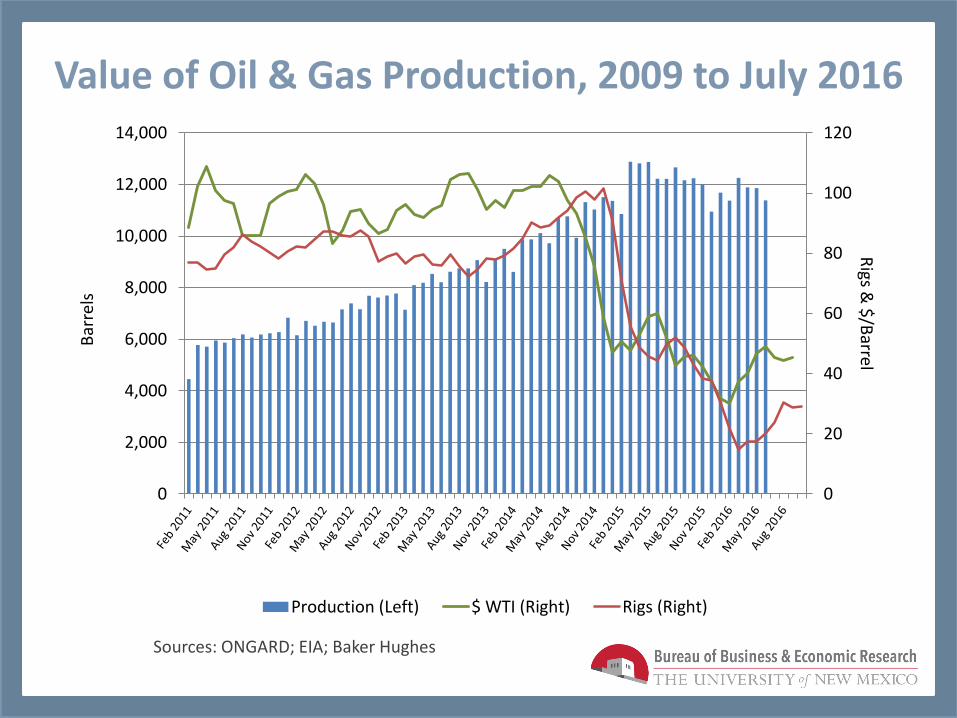
Value of Oil & Gas Production, 2009 to July 2016
Sources: ONGARD; EIA; Baker Hughes
0
20
40
60
80
100
120
0
2,000
4,000
6,000
8,000
10,000
12,000
14,000
Rigs &
$/B
arrel B
arre
ls
Production (Left) $ WTI (Right) Rigs (Right)
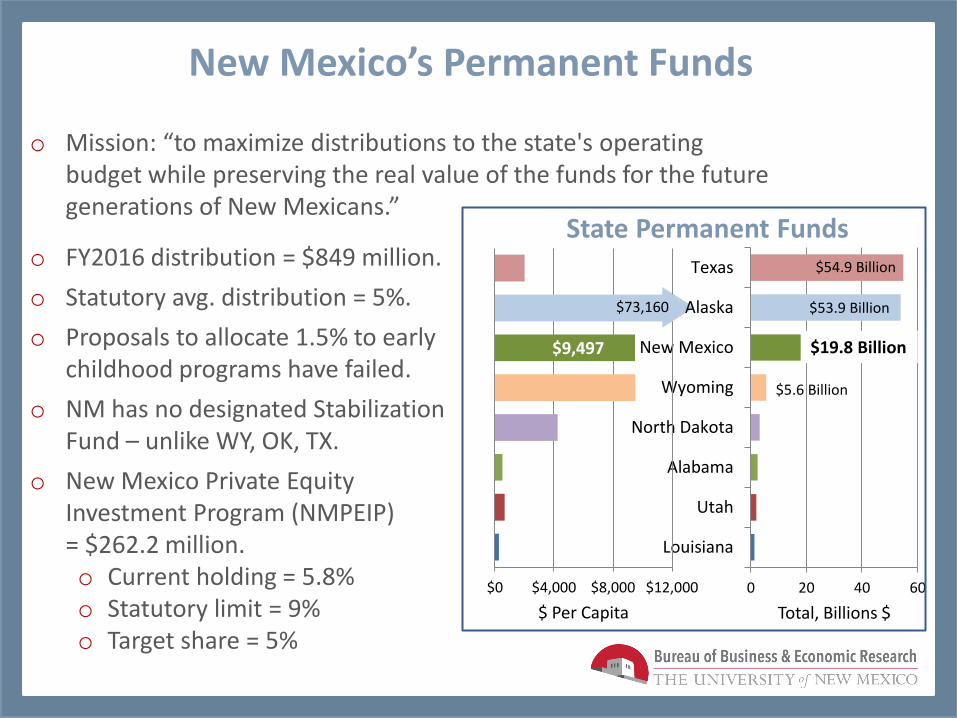
New Mexico’s Permanent Funds
o FY2016 distribution = $849 million.
o Statutory avg. distribution = 5%.
o Proposals to allocate 1.5% to early childhood programs have failed.
o NM has no designated Stabilization Fund – unlike WY, OK, TX.
o New Mexico Private Equity Investment Program (NMPEIP) = $262.2 million. o Current holding = 5.8% o Statutory limit = 9% o Target share = 5%
o Mission: “to maximize distributions to the state's operating budget while preserving the real value of the funds for the future generations of New Mexicans.”
State Permanent Funds
0 20 40 60
Louisiana
Utah
Alabama
North Dakota
Wyoming
New Mexico
Alaska
Texas
Total, Billions $
$0 $4,000 $8,000 $12,000
$ Per Capita
$73,160
$9,497
$53.9 Billion
$19.8 Billion
$5.6 Billion
$54.9 Billion

New Mexico Economic Outlook

New Mexico Economic Outlook: 2016-2022 o Economic impacts of oil collapse will lessen in second half of 2016, and reach
the bottom by mid-2017 – though fiscal impacts will linger.
o Employment growth: 5,300 jobs (0.7%) in second half of 2016, and 7,800 jobs (1.0%) in 2017 and 1.2% thereafter.
o Short-term job growth is in Metro areas, esp. Albuquerque, but slightly negative in non-metro areas. Stronger statewide mid- and longer-term growth occur when non-Metro moves positive.
o Composition of new jobs:
o 55% (2017)/38% (2018-2022) in education and healthcare & social assistance
o 36% (2017)/26% (2018-2022) in low-wage service sectors
o 12% (2017)/19% (2018-2022) in mining, utilities, construction, manufacturing, transportation
o 12% (2017)/9% (2018-2022) in financial and P&BS
o Outlook for government employment weak (-0.9% in 2017, 0.3% thereafter).
o Income outlook slow: 2.4% in 2016, rising to 3.6% in 2017, and 4.6% through 2022. Wage growth to private sector workers key variable.
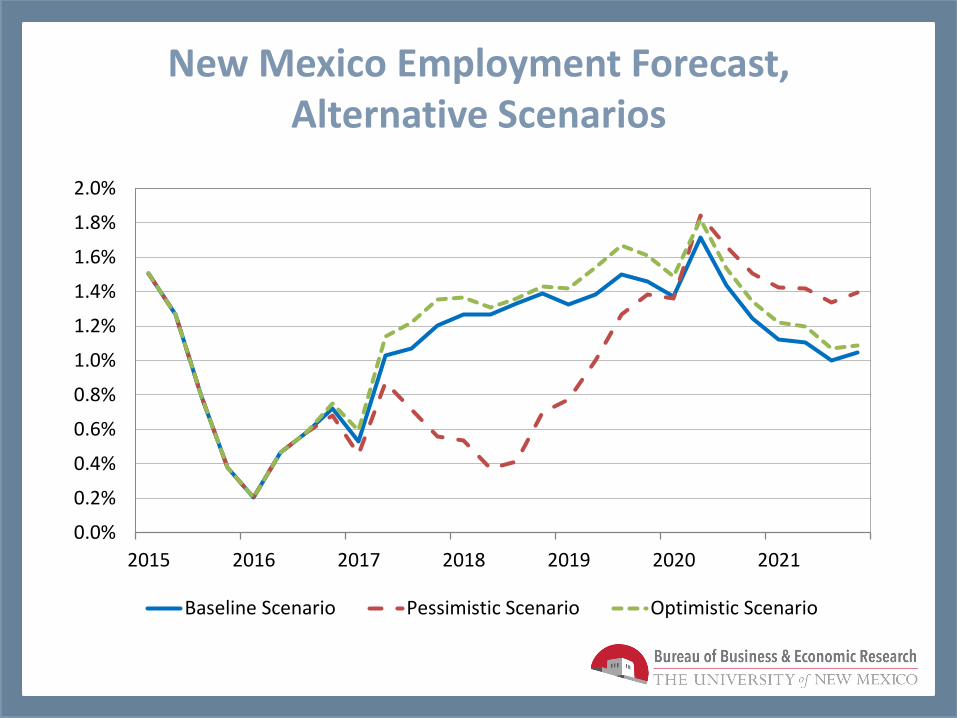
New Mexico Employment Forecast, Alternative Scenarios
0.0%
0.2%
0.4%
0.6%
0.8%
1.0%
1.2%
1.4%
1.6%
1.8%
2.0%
2015 2016 2017 2018 2019 2020 2021
Baseline Scenario Pessimistic Scenario Optimistic Scenario
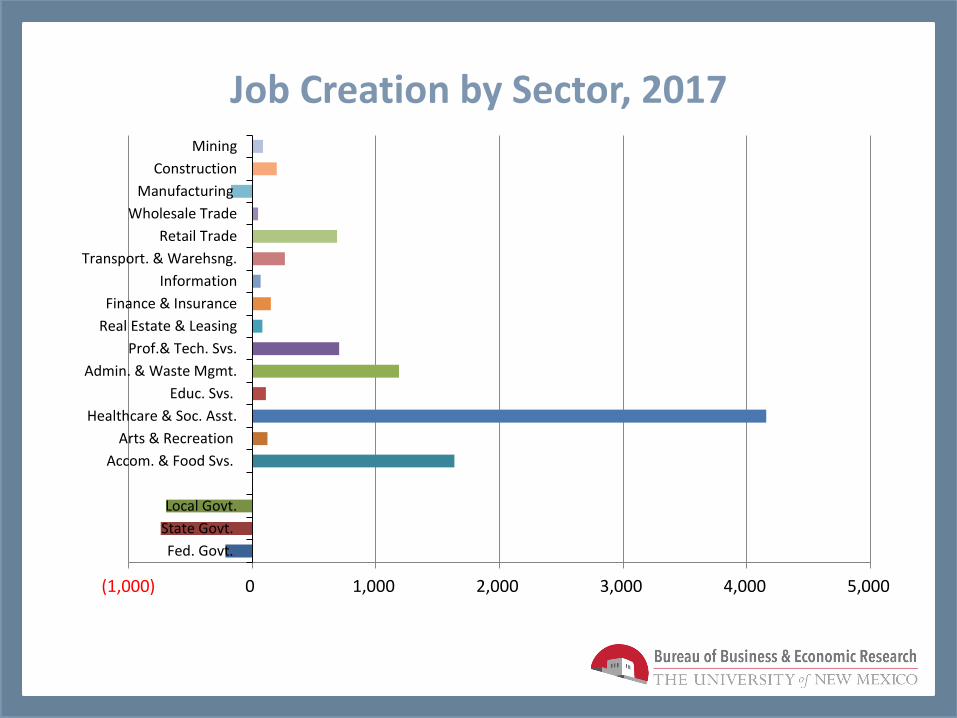
Job Creation by Sector, 2017
(1,000) 0 1,000 2,000 3,000 4,000 5,000
Fed. Govt.
State Govt.
Local Govt.
Accom. & Food Svs.
Arts & Recreation
Healthcare & Soc. Asst.
Educ. Svs.
Admin. & Waste Mgmt.
Prof.& Tech. Svs.
Real Estate & Leasing
Finance & Insurance
Information
Transport. & Warehsng.
Retail Trade
Wholesale Trade
Manufacturing
Construction
Mining
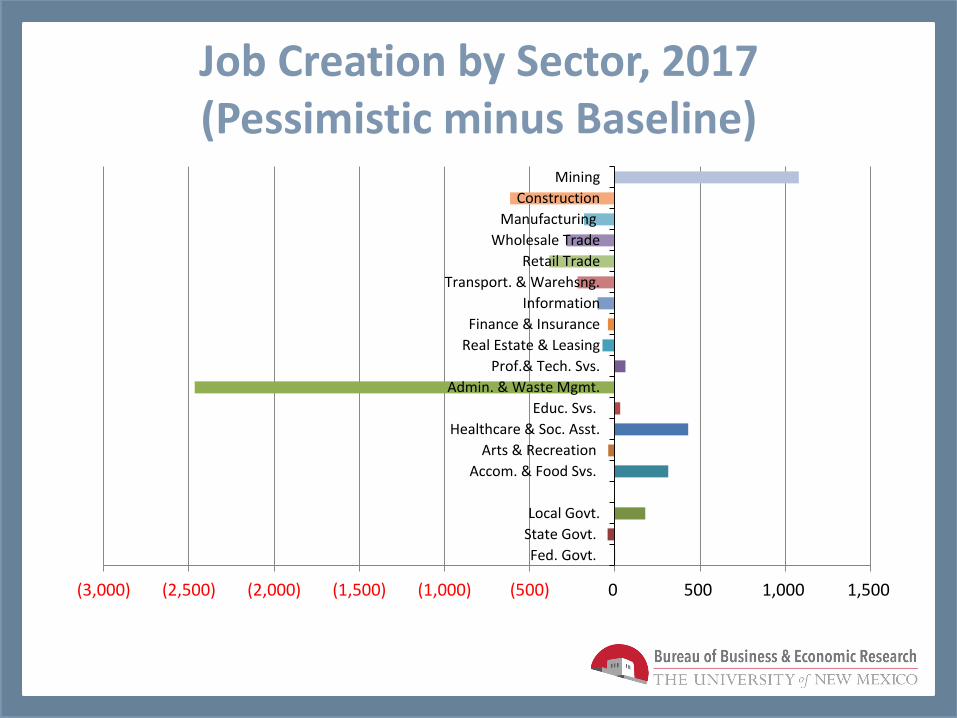
Job Creation by Sector, 2017 (Pessimistic minus Baseline)
(3,000) (2,500) (2,000) (1,500) (1,000) (500) 0 500 1,000 1,500
Fed. Govt.
State Govt.
Local Govt.
Accom. & Food Svs.
Arts & Recreation
Healthcare & Soc. Asst.
Educ. Svs.
Admin. & Waste Mgmt.
Prof.& Tech. Svs.
Real Estate & Leasing
Finance & Insurance
Information
Transport. & Warehsng.
Retail Trade
Wholesale Trade
Manufacturing
Construction
Mining
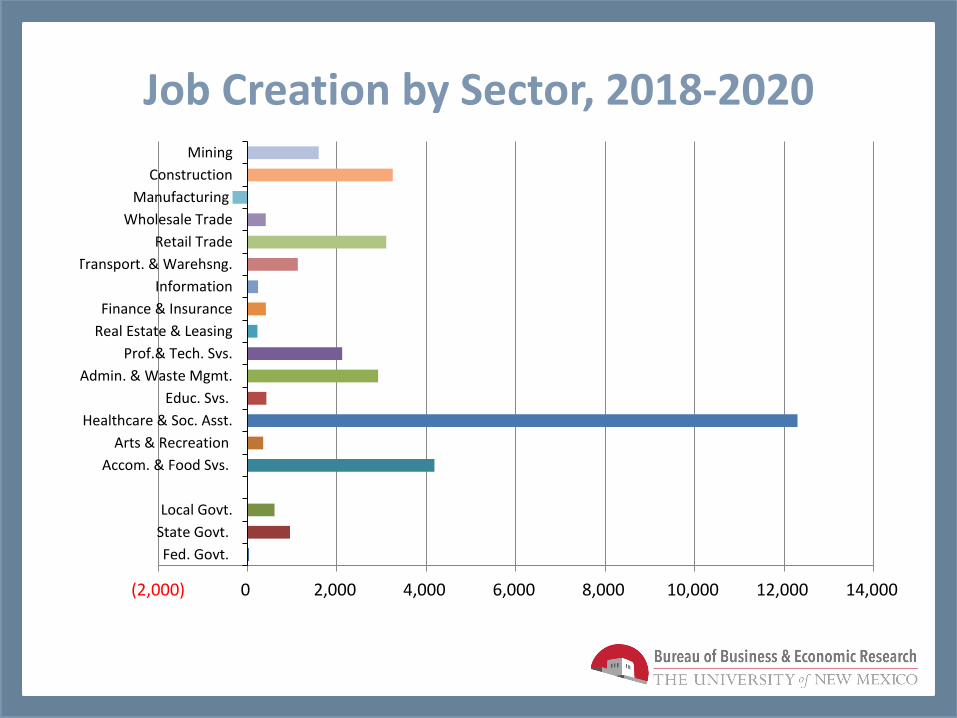
Job Creation by Sector, 2018-2020
(2,000) 0 2,000 4,000 6,000 8,000 10,000 12,000 14,000
Fed. Govt.
State Govt.
Local Govt.
Accom. & Food Svs.
Arts & Recreation
Healthcare & Soc. Asst.
Educ. Svs.
Admin. & Waste Mgmt.
Prof.& Tech. Svs.
Real Estate & Leasing
Finance & Insurance
Information
Transport. & Warehsng.
Retail Trade
Wholesale Trade
Manufacturing
Construction
Mining
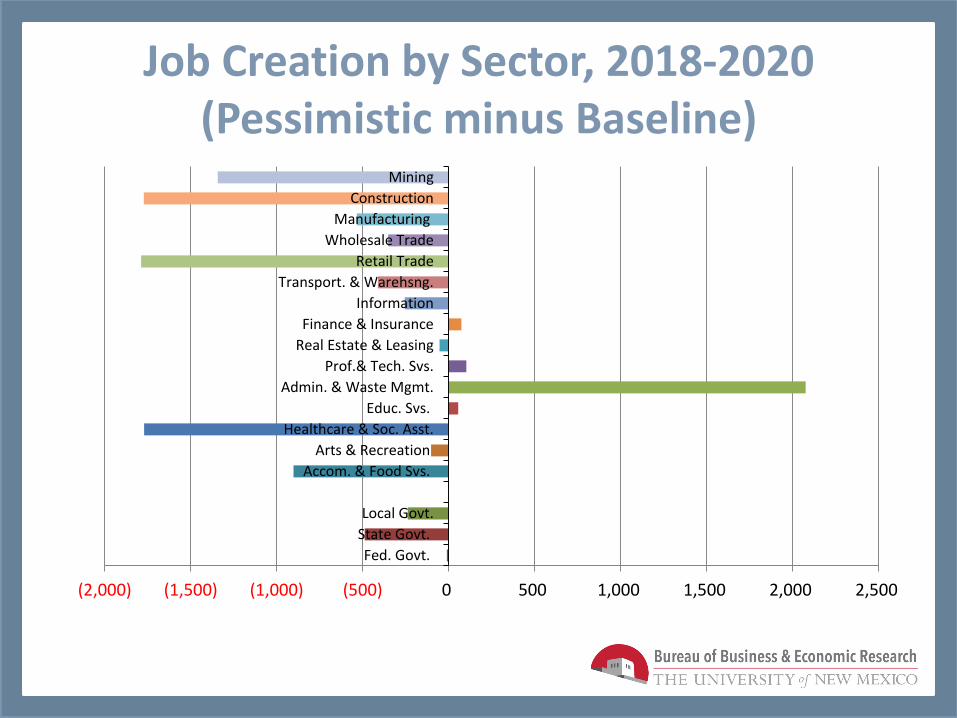
Job Creation by Sector, 2018-2020 (Pessimistic minus Baseline)
(2,000) (1,500) (1,000) (500) 0 500 1,000 1,500 2,000 2,500
Fed. Govt.
State Govt.
Local Govt.
Accom. & Food Svs.
Arts & Recreation
Healthcare & Soc. Asst.
Educ. Svs.
Admin. & Waste Mgmt.
Prof.& Tech. Svs.
Real Estate & Leasing
Finance & Insurance
Information
Transport. & Warehsng.
Retail Trade
Wholesale Trade
Manufacturing
Construction
Mining
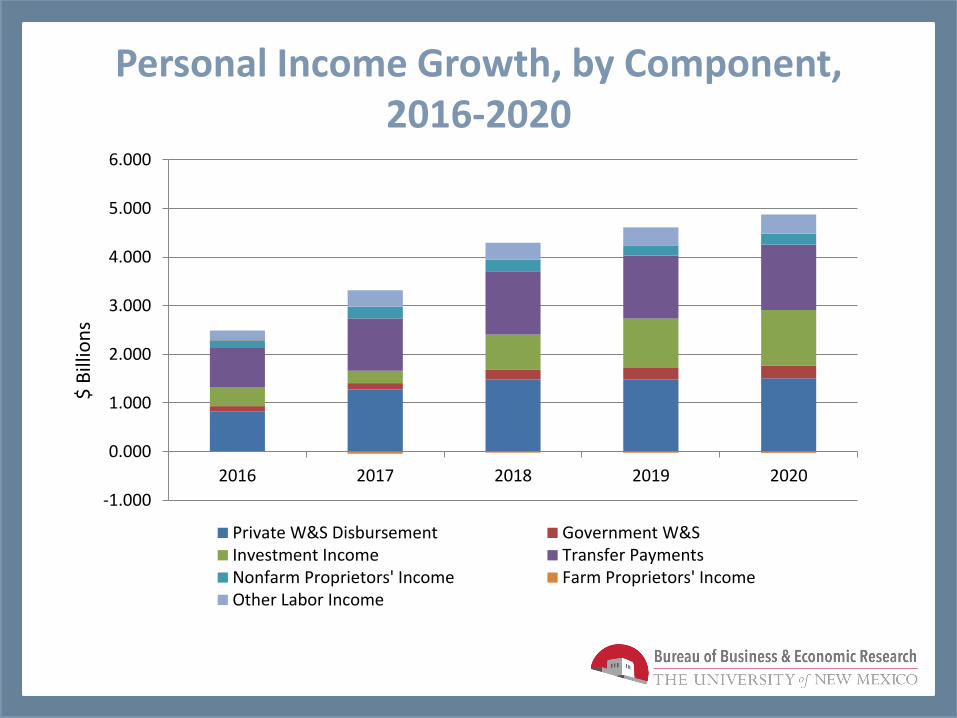
Personal Income Growth, by Component, 2016-2020
-1.000
0.000
1.000
2.000
3.000
4.000
5.000
6.000
2016 2017 2018 2019 2020
Private W&S Disbursement Government W&SInvestment Income Transfer PaymentsNonfarm Proprietors' Income Farm Proprietors' IncomeOther Labor Income
$ B
illio
ns
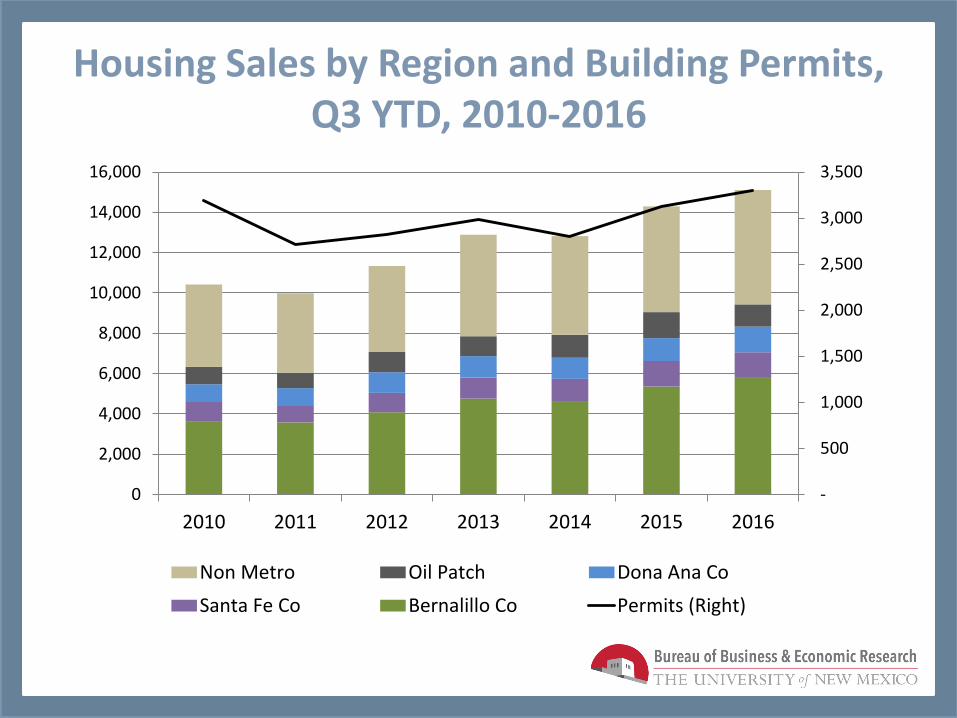
Housing Sales by Region and Building Permits, Q3 YTD, 2010-2016
-
500
1,000
1,500
2,000
2,500
3,000
3,500
0
2,000
4,000
6,000
8,000
10,000
12,000
14,000
16,000
2010 2011 2012 2013 2014 2015 2016
Non Metro Oil Patch Dona Ana Co
Santa Fe Co Bernalillo Co Permits (Right)

US & NM: Housing Starts & Permits
0.000
0.200
0.400
0.600
0.800
1.000
1.200
1.400
1.600
1.800
2.000
0.000
2.000
4.000
6.000
8.000
10.000
12.000
14.000
16.000
06 07 08 09 10 11 12 13 14 15 16 17 18 19 20
NM Housing Permits (Total) US Housing Start (Total)
Thousands, NM Millions, USA

Metro & Non-metro New Mexico
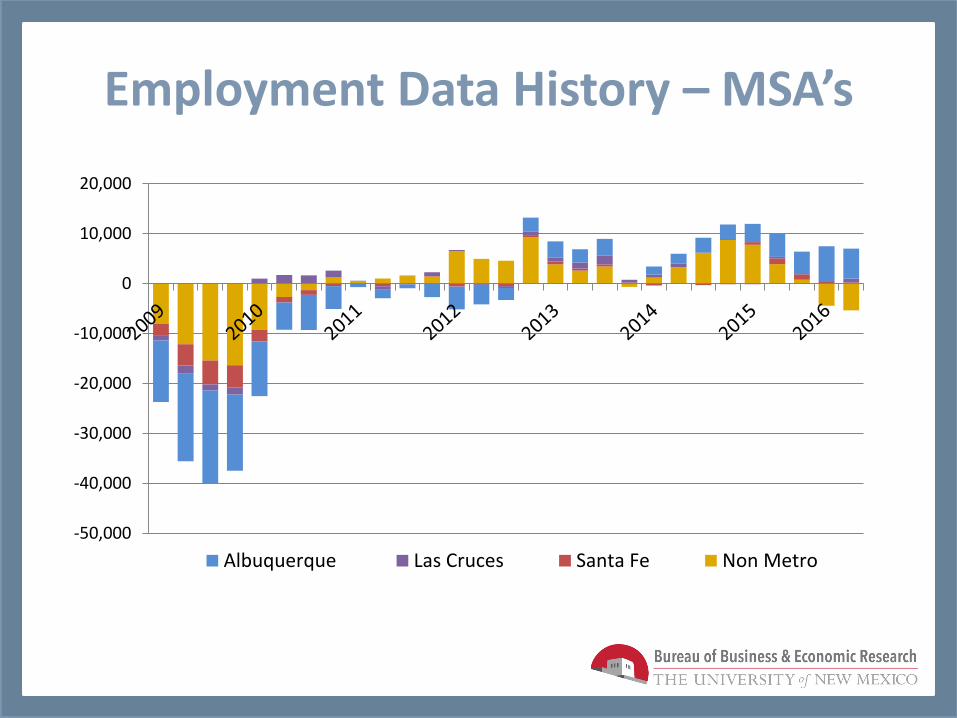
Employment Data History – MSA’s
-50,000
-40,000
-30,000
-20,000
-10,000
0
10,000
20,000
Albuquerque Las Cruces Santa Fe Non Metro

Job Creation by MSA, 2016-2020
-10,000
-5,000
0
5,000
10,000
15,000
20,000
25,000
30,000
35,000
Albuquerque Las Cruces Santa Fe Non Metro
Job
s
Government
Other Services
Leisure & Hospitality
Educ & Health Srvs
Prof & Business Srvs
Financial Services
Information
Trade, Transp, Utilities
Manufacturing
Construction
Agric & Resources
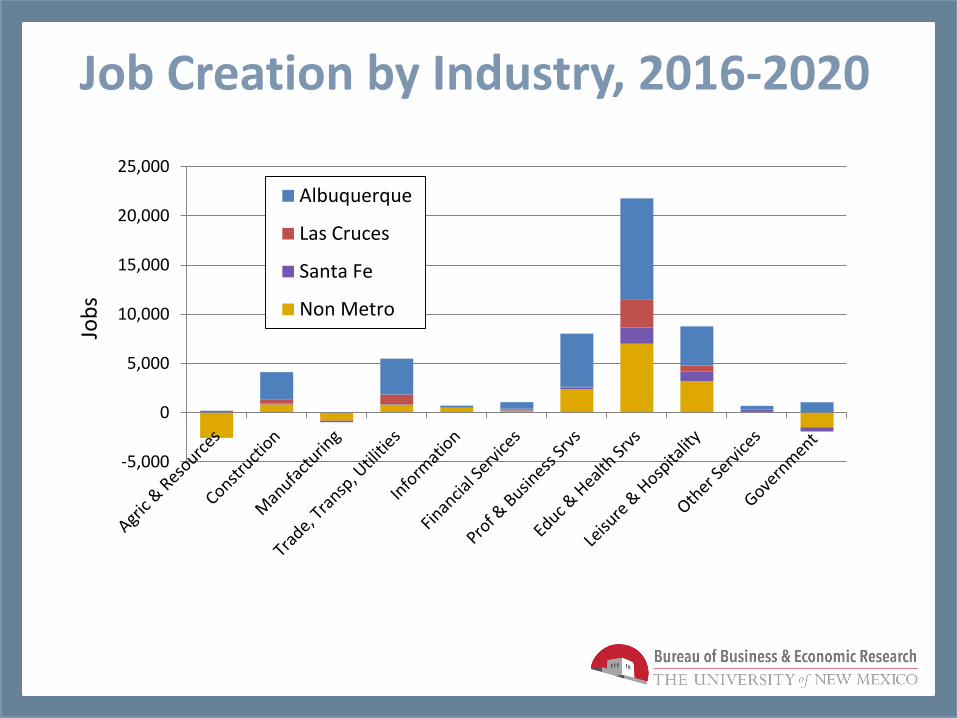
Job Creation by Industry, 2016-2020
-5,000
0
5,000
10,000
15,000
20,000
25,000
Job
s
Albuquerque
Las Cruces
Santa Fe
Non Metro

Questions / Comments?
18th Annual Data Users Conference Jeffrey Mitchell, BBER Director


