O ver the past two decades, institutions that make microloans to low-income borrowers in developing and transition economies have focused increasingly on making their lending operations financially sustainable by charging interest rates that are high enough to cover all their costs. They argue that doing so will best ensure the permanence and expansion of the services they provide. Sustainable (i.e., profitable) microfinance providers can continue to serve their clients without needing ongoing infusions of subsidies, and can fund exponential growth of services for new clients by tapping commercial sources, including deposits from the public. The problem is that administrative costs are inevitably higher for tiny microlending than for normal bank lending. For instance, lending $100,000 in 1,000 loans of $100 each will obviously require a lot more in staff salaries than making a single loan of $100,000. Consequently, interest rates in sustainable microfinance institutions (MFIs) have to be substantially higher than the rates charged on normal bank loans. As a result, MFIs that claim to be helping poor people nevertheless charge them interest rates that are considerably above the rates richer borrowers pay at banks. No wonder this seems wrong to observers who do not understand, or do not agree with, the argument that MFIs can usually serve their poor customers best by operating sustainably, rather than by generating losses that require constant infusions of undependable subsidies. In today’s microfinance industry, there is still some debate about whether and when long-term subsidies might be justified in order to reach particularly challenging groups of clients. But there is now widespread agreement, within the industry at least, that in most situations MFIs ought to pursue financial sustainability by being as efficient as they can and by charging interest rates and fees high enough to cover the costs of their lending and other services. 1,2 Nevertheless, accepting the importance of financial sustainability does not end the discussion of interest rates, and where to draw the line is a complex issue. An interest charge represents money taken out of clients’ pockets, and it is unreasonable if it not only covers the costs of lending but also deposits “excessive” profits into the pockets of an MFI’s private owners. Even an interest rate that only covers costs and includes no profit can still be unreasonable if the costs are excessively high because of avoidable inefficiencies. High microloan interest rates have been criticized since the beginning of the modern microfinance movement in the late 1970s. But the criticism has intensified in the past few years, and legislated interest rate caps are being discussed in a growing number of countries. Part of the reason for the increased concern about rates is simply that microfinance is drawing ever more public attention, including political attention. Another factor is that quite a few MFIs are now being transformed into private commercial corporations. In the early years most MFIs were ownerless not-for-profit associations, often referred to as nongovernmental organizations (NGOs). If an NGO generates a profit, the money normally stays in the institution and is used to fund additional services. But many NGO MFIs have eventually wanted to add deposit-taking to their activities, because they The New Moneylenders: Are the Poor Being Exploited by High Microcredit Interest Rates? 1 The term “microfinance” usually refers to the provision of financial services to poor and low-income clients who have little or no access to conventional banks. The term is often used in a more specific sense, referring to institutions that use new techniques developed over the past 30 years to deliver microcredit—tiny loans—to informal microentrepreneurs. The range of services can include not only microcredit but also savings, insurance, and money transfers. This paper focuses on interest rates charged on microcredit; it does not address other microfinance services. 2 Among borrowers who have loans from nongovernmental organizations and private MFIs, a majority are served by financially sustainable institutions (Gonzalez and Rosenberg 2006). No. 15 February 2009 Richard Rosenberg, Adrian Gonzalez, and Sushma Narain OCCASIONAL PAPER
Transcript
Over the past two decades, institutions that
make microloans to low-income borrowers in
developing and transition economies have focused
increasingly on making their lending operations
financially sustainable by charging interest rates that
are high enough to cover all their costs. They argue
that doing so will best ensure the permanence and
expansion of the services they provide. Sustainable
(i.e., profitable) microfinance providers can continue to
serve their clients without needing ongoing infusions
of subsidies, and can fund exponential growth of
services for new clients by tapping commercial
sources, including deposits from the public.
The problem is that administrative costs are inevitably
higher for tiny microlending than for normal bank
lending. For instance, lending $100,000 in 1,000
loans of $100 each will obviously require a lot
more in staff salaries than making a single loan of
$100,000. Consequently, interest rates in sustainable
microfinance institutions (MFIs) have to be substantially
higher than the rates charged on normal bank loans.
As a result, MFIs that claim to be helping poor people
nevertheless charge them interest rates that are
considerably above the rates richer borrowers pay
at banks. No wonder this seems wrong to observers
who do not understand, or do not agree with, the
argument that MFIs can usually serve their poor
customers best by operating sustainably, rather than
by generating losses that require constant infusions
of undependable subsidies.
In today’s microfinance industry, there is still some
debate about whether and when long-term subsidies
might be justified in order to reach particularly
challenging groups of clients. But there is now
widespread agreement, within the industry at least,
that in most situations MFIs ought to pursue financial
sustainability by being as efficient as they can and by
charging interest rates and fees high enough to cover
the costs of their lending and other services. 1, 2
Nevertheless, accepting the importance of financial
sustainability does not end the discussion of interest
rates, and where to draw the line is a complex
issue. An interest charge represents money taken
out of clients’ pockets, and it is unreasonable if it
not only covers the costs of lending but also deposits
“excessive” profits into the pockets of an MFI’s
private owners. Even an interest rate that only covers
costs and includes no profit can still be unreasonable
if the costs are excessively high because of avoidable
inefficiencies.
High microloan interest rates have been criticized
since the beginning of the modern microfinance
movement in the late 1970s. But the criticism has
intensified in the past few years, and legislated interest
rate caps are being discussed in a growing number
of countries. Part of the reason for the increased
concern about rates is simply that microfinance is
drawing ever more public attention, including political
attention. Another factor is that quite a few MFIs
are now being transformed into private commercial
corporations.
In the early years most MFIs were ownerless
not-for-profit associations, often referred to as
nongovernmental organizations (NGOs). If an NGO
generates a profit, the money normally stays in the
institution and is used to fund additional services.
But many NGO MFIs have eventually wanted to
add deposit-taking to their activities, because they
The New Moneylenders: Are the Poor Being Exploited by High Microcredit Interest Rates?
1 The term “microfinance” usually refers to the provision of financial services to poor and low-income clients who have little or no access to conventional banks. The term is often used in a more specific sense, referring to institutions that use new techniques developed over the past 30 years to deliver microcredit—tiny loans—to informal microentrepreneurs. The range of services can include not only microcredit but also savings, insurance, and money transfers. This paper focuses on interest rates charged on microcredit; it does not address other microfinance services.
2 Among borrowers who have loans from nongovernmental organizations and private MFIs, a majority are served by financially sustainable institutions (Gonzalez and Rosenberg 2006).
No. 15February 2009
Richard Rosenberg, Adrian Gonzalez, and Sushma Narain
OC
CA
SIO
NA
L PA
PER
2
see savings services as valuable for their clients
and because capturing deposits allows them to
fund expansion of their microlending. When NGOs
approach a government banking authority for a
license to take deposits, they are usually required to
reorganize their businesses into for-profit shareholder-
owned corporations. Once this happens, profits
can wind up in the pockets of private shareholders,
inevitably raising the specter of such owners making
extreme returns on their investment by charging
abusive interest rates to poor borrowers who have
little bargaining power because their other credit
options are limited.
A firestorm of controversy erupted in April 2007
when shareholders of Compartamos, a Mexican MFI
with a banking license, sold a part of their shares
in a public offering at an astonishingly high price,
which made some of the individual sellers instant
millionaires. One important reason for the high price
was that Compartamos was charging its clients very
high interest rates and making very high profits.
The annualized interest rate on loans was above
85 percent (not including a 15 percent tax paid by
clients), producing an annual return of 55 percent on
shareholders’ equity (Rosenberg 2007).
In fact, most MFIs charge interest rates well below
those that provoked controversy in the case of
Compartamos. But the story tapped into a deep well
of concern about high microcredit interest rates and
the trend toward commercialization of microfinance.
This paper asks whether microcredit rates are
abusively high. Obviously there can be no one-size-
fits-all answer to this question, not only because there
are huge variations in the interest rates and related
circumstances of individual MFIs around the world,
but also because there is no agreed standard for what
is abusive. There is an intense dispute about how high
interest rates and profits would have to be to qualify
as excessive, and indeed about whether terms like
this have any useful meaning, at least in the arena of
for-profit microfinance.
In this paper, the authors are not using any
theoretical framework or benchmark against which
to measure what is excessive or not. We present
available data, and then form our own admittedly
intuitive judgment about the reasonableness of the
general picture appearing from that data. Of course,
readers will apply their own criteria or intuition to
the data in judging whether rates or profits strike
them as “abusive,” “exploitative,” “excessive,”
“unreasonable,” etc.
Some MFIs are charging their clients rates that seem
hard to justify from a development perspective.
Rosenberg (2007) argues that this was the case at
Compartamos, at least after it became able to fund
expansion of its services from other sources besides
retained profits.3 But are these rare exceptions, or do
they represent a pervasive problem in the industry?
We approach the question from several perspectives.
In the first section, we report on how high microcredit
rates actually are around the world. Then we look
at how those rates compare with the cost of other
forms of credit often available to low-income people,
including consumer credit, credit unions, and informal
moneylenders. The section closes with a look at
trends: are microcredit rates moving up or down?
In the second section we “deconstruct” interest
rates by looking at what they fund. Mathematically,
an MFI’s interest yield is equal to the sum of costs
and profit on its loan portfolio. Most people would
agree that it is fair to criticize an MFI’s interest rates
as unreasonable only if its profit or some controllable
element of its costs is unreasonable. In addition to
profits, we analyze MFIs’ cost of funds, loan loss
expenses, and operating (i.e., administrative) costs.
3 On the other hand, some defenders of Compartamos argue that its example—including its high profits—have benefited potential borrowers by supercharging the expansion of microcredit services in Mexico.
3
The third section briefly considers the question of
interest rates generally seem quite reasonable and
that there is no evidence of any widespread pattern
of abuse.
A Note on MFI Data. Financial information on MFIs
is drawn from the databases of the Microfinance
Information Exchange (MIX). Not all MFIs report to
MIX, but those that do (currently over 1,400 MFIs)
account for over 58 million borrowers worldwide in
98 countries.4 MIX maintains two different, though
overlapping, MFI databases. The MicroBanking
Bulletin (MBB) dataset currently includes 890
institutions that report their data confidentially.
MBB adjusts the financial information of these MFIs
to compensate for the effect of any subsidies they
receive and, thus, tries to present a picture of what
the industry would look like if it had to pay market cost
for all of its resources. MBB organizes MFIs into “peer
groups” of institutions with similar characteristics, and
reports overall peer group performance. The other
dataset is MIX Market (www.mixmarket.org), which
publicly reports individual performance of over 1,300
MFIs, but does not adjust the reported data.5 Most
MFIs are included in both datasets.
MFIs that report to MBB but not to MIX Market are
guaranteed that individually identifiable data about
their institutions will not be disclosed publicly. Thus,
we report only aggregate results, and we generally
cannot discuss what is happening in particular MFIs.
When analyzing revenues, costs, and profits, we
usually use a large database that includes the 555
sustainable MFIs that reported their results to MIX
for 2006.6 Why only sustainable MFIs? The reason
is that much of the analysis in this paper depends
on relationships between interest rates and costs.
We usually exclude unsustainable MFIs because their
interest rates are not constrained by their costs—that
is, an unsustainable MFI can set its interest rates as
low as it wants no matter how high its costs are,
as long as some donor or government is willing to
provide the subsidy necessary to cover the losses.
Not surprisingly, sustainable MFIs tend to charge
higher interest rates than unsustainable MFIs. The
average interest yield (weighted by loan portfolio)
for MFIs reporting to MIX in 2006 was 28.1 percent
for sustainable MFIs, compared with 20.5 percent
for unsustainable MFIs.7 Thus, if we had included
unsustainable MFIs in our analysis, the interest rates
reported in the paper would have been substantially
lower.
One might assume that sustainable (i.e., profitable)
MFIs are typically for-profit commercial companies,
but this is not the case. In fact, almost two-thirds of
the 555 sustainable MFIs are NGOs, cooperatives,
public banks, or other not-for-profit organizations.
When tracking recent year-to-year trend lines, we
have had to use a smaller data set: all 175 sustainable
MFIs who reported their data both for 2003 and 2006.
These sustainable MFIs are a minority of the MFIs
reporting to MIX, but they account for about half of all
the borrowers and microloan portfolio amounts that
were reported by participating MFIs (both public and
private) each year. We believe this set is large enough
and representative enough to give a meaningful
picture of recent industry trends at a worldwide level.
For a snapshot of levels at a particular point in time,
the larger dataset—all 555 sustainable MFIs reporting
in 2006—is obviously more reliable.8
4 Our definition of “microfinance institution” here is somewhat circular: an institution that describes itself as providing “microfinance.” Almost all of these institutions make use of the new microcredit methods that have been developed in the past 30 years. It is important to recognize that poor and low-income clients get financial services from many other institutions that usually do not describe themselves, and are not described by others, as doing microfinance. See Christen, Rosenberg, and Jayadeva (2004).
5 In the rest of the paper, the term “MIX MFIs” includes those MFIs that report to MBB, MIX Market, or both.6 MFIs were classified as sustainable if their adjusted return on assets, or their unadjusted return when adjusted return was not available, was
positive.7 Includes all countries with three or more MFIs reporting.8 The paper is based on MIX data through 2006, updated as of April 2008. MIX data for 2007 became available in October 2008, too late for
inclusion in this paper.
4
In presenting data from these two sets, we do not
use simple averages or distributions, because doing
so would distort the picture of the industry by giving
as much weight to a tiny MFI with 1,000 clients as to
a huge one with a million clients. Instead, we give
more weight to larger MFIs. Usually we weight by the
size of the MFIs’ gross loan portfolio (GLP), because
most of the income, costs, and profits are analyzed
as percentages of loan portfolio. Occasionally we also
weight by numbers of clients.9
In looking at interest rates, we use interest yield on
GLP, which is the total amount of cash borrowers
pay the MFI during a period for interest and loan
fees divided by the average outstanding GLP over
the same period. As a measure of what clients are
actually paying, this is far more meaningful than an
MFI’s stated interest rate.10
Finally, readers may occasionally notice a seeming
disparity in data—for example, interest yields, costs,
or profits may be somewhat different in different
graphs or tables. There are several reasons for these
differences:
Point-in-time data are usually based on all 555 •
sustainable MFIs reporting to MIX for 2006, while
trend-line data are based on a different set—the
175 sustainable MFIs that reported for both 2003
and 2006.
Some figures present average values, which will •
differ from the median shown in a graph reporting
the distribution of individual values.
The ratios being reported may have different •
denominators. For instance, administrative costs
as a percentage of interest earnings will look
much higher than the same administrative costs
expressed as a percentage of GLP.
How High Are Microcredit Interest Rates? Where Are They Moving?
2006 Interest Rate Levels
Most MFIs charge interest rates far below those
that have provoked controversy in the case of
Compartamos. In 2006, the most recent year
available, the median interest income for sustainable
MFIs in MIX, weighted by GLP, was 26.4 percent of
loans outstanding.11 Figure 1 shows the distribution of
interest yields, worldwide and by region, compared
with Compartamos’ interest yield. The regional
breakdown consists of East Asia and the Pacific
(EAP), Eastern Europe and Central Asia (EECA),
Latin America and the Caribbean (LAC), Middle East
and North Africa (MENA), South Asia (SA), and Sub-
Saharan Africa (SSA).
The Compartamos case was striking and prompted a
lot of discussion. But it is a serious mistake to assume
that Compartamos’ interest rates were typical of
the industry, or even of a substantial part of the
industry. In fact, less than 1 percent of MFI borrowers
worldwide were paying rates as high as Compartamos
was charging.
Some MFIs require borrowers to make compulsory
deposits before they can receive a loan; borrowers
typically must maintain these deposits during the life
of the loan. The interest rates borrowers receive on
these deposits are well below the rates borrowers pay
on their loans. The effect of such deposit requirements
is to reduce the net additional cash borrowers realize
from their loans and, thus, to increase the effective
cost of the loan to them. About one-third of the
sustainable MFIs reporting to MIX for 2006 required
9 Weighted averages will be familiar to most readers, but perhaps not weighted distributions. The concept is that all MFIs are spread out along a line, in order of their interest yield (for example). In a normal unweighted distribution, each MFI occupies the same amount of space along the line, regardless of the MFI’s size. In a weighted distribution, each MFI occupies a space proportional to the size of its loan portfolio (for instance). Once this line is assembled, the median is a point halfway along its distance, and the 90th percentile (for instance) is a point one-tenth below the high end of the line.
10 Some MFIs offer multiple loan products that may entail varying levels of cost and profit. The interest yield calculated by MIX in such cases represents combined interest and fee income divided by the combined portfolio.
11 When the interest yields of the individual MFIs are weighted by number of borrowers, the median is 28.7 percent. The average yield weighted by GLP is 28.4 percent.
5
such savings deposits, and on average these MFIs
are smaller than the ones that do not use compulsory
savings. Data limitations prevent us from calculating
the additional cost due to compulsory savings in
individual institutions.
It is important to keep the interest and fees paid to
the MFI in context: they are only part of borrowers’
total loan costs. Transaction costs can be substantial,
including for instance the time borrowers have to
spend away from their businesses, their transportation
expenses, and the negative impact of delays in
receiving loan funds. Because interest charges can
be quantified easily, they tend to receive much more
attention than borrowers’ transaction costs. In fact,
these transaction costs often represent a greater
expense for the borrower than the interest being
charged on the loan. Sometimes borrowers with other
credit options are willing to pay a higher interest
rate to an MFI because the MFI loan entails lower
transaction costs (Adams, Graham, and von Pischke
1984; Meyer and Cuevas 1992; Robinson 2001; Tran
1998; and Cuevas 1989).
Microcredit Rates vs. Other Small-Loan Rates
How expensive is microcredit compared with other
credit available to poor and low-income borrowers?
Answering this question poses data challenges. From
MIX we have good country-by-country information on
interest rates for a large set of MFIs (using the most
recently reported year, as of March 2008). But it has
been much more difficult to assemble information
on rates for consumer credit or credit unions;
the challenges of determining rates for informal
moneylenders are even greater.
We found small amounts of published country data
and supplemented them by canvassing our contacts
in various countries.12 We cannot guarantee the
accuracy of each piece of information we were given.
And in some cases, it is hard to be precise about
the effective annual rate based on that information.
However, we think we have enough to start drawing
a rough general picture, at least with respect to
consumer credit and informal credit rates.
Figure 1: Interest Income as Percentage of Gross Loan Portfolio, 2006
Note: 555 sustainable MFIs reporting to MIX, distribution weighted by gross loan portfolio. The thick horizontal bars represent medians; the top and bottom of the white boxes represent the 75th and 25th percentiles, respectively; and the high and low short bars represent the 95th and 5th percentiles, respectively.
0
10
20
30
40
50
60
70
80
90
WORLD SSA EAP ECA LAC MENA CompartamosSouthAsia
% o
f G
ross
Lo
an P
ort
folio
12 The data permitted comparison of microlending rates to at least one form of alternative credit in 36 countries: Cambodia, Indonesia, the Philippines, and Thailand (EAP); Armenia, Bosnia and Herzegovina, Kyrgyzstan, Mongolia, Romania, Serbia/Montenegro, Tajikistan, and Uzbekistan (EECA); Bolivia, Colombia, Ecuador, Mexico, Peru, and Nicaragua (LAC); Morocco, Jordan, and Egypt (MENA); Nepal, Bangladesh, Sri Lanka, India, and Pakistan (SA); and Cameroon, Congo, Ghana, Ethiopia, Kenya, Madagascar, Senegal, Tanzania, Togo, and Zambia (SSA).
6
Consumer credit. Table 1 compares loan rates in
sustainable MFIs with consumer credit rates in 36
countries for which we had reports. Consumer credit
includes credit cards, installment loans for furniture or
appliances, and other similar loan products. MFI rates
appear lower than consumer credit rates in a majority
of these countries; they are higher than consumer
credit rates in less than one-fifth of the countries.13
In consumer lending, borrowers are typically salaried,
so assessing creditworthiness usually can be done
automatically, using computerized scoring algorithms.
By contrast, microlending tends to require a more
labor-intensive relationship between loan officer and
client. In light of this higher cost, one might expect
microcredit rates to average higher than consumer
credit rates, rather than lower, as appears to be the
actual case. On the other hand, credit cards may
involve more frequent transactions than microcredit,
which could offset their cost advantage in terms
of borrower evaluation. Installment financing of
merchandise would not seem more transaction-
intensive than microcredit, and these “hire-purchase”
lenders usually have collateral and the means to sell
it when repossessed. Notwithstanding these factors,
the general picture suggests that microcredit rates
Note: Latest available year; MIX data for sustainable MFIs, CGAP research for consumer lending rates.
13 Some of the consumer credit rates reported to us may be lower than the true effective cost of the loans once payment timing and fees—especially annual fees—are factored in. The rates used for MFIs are actual interest yield on portfolio, which is a more reliable index of actual cash cost to the client. None of the rates we analyzed includes clients’ transaction costs, such as time or travel.
7
Both informal credit and microcredit are generally
uncollateralized and are used by lower income
borrowers. But there are big differences, the most
important of which from the customer’s perspective
is that informal loans are usually available very quickly.
It is commonly assumed that the astronomical rates
found in informal lending reflect moneylenders’
exploitation of poor borrowers’ lack of options and
weak bargaining power. However, a body of research
suggests this characterization is only occasionally
accurate. Usually, the biggest driver of high informal
rates is the high cost of such lending.14
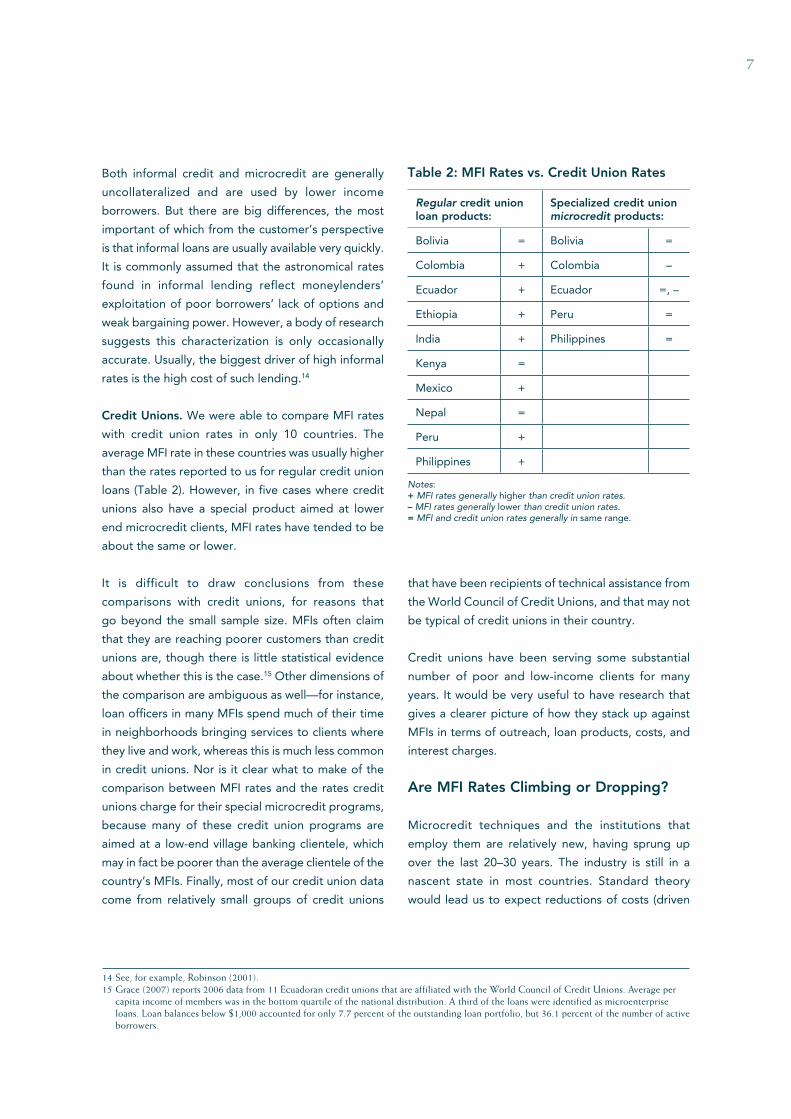
Credit Unions. We were able to compare MFI rates
with credit union rates in only 10 countries. The
average MFI rate in these countries was usually higher
than the rates reported to us for regular credit union
loans (Table 2). However, in five cases where credit
unions also have a special product aimed at lower
end microcredit clients, MFI rates have tended to be
about the same or lower.
It is difficult to draw conclusions from these
comparisons with credit unions, for reasons that
go beyond the small sample size. MFIs often claim
that they are reaching poorer customers than credit
unions are, though there is little statistical evidence
about whether this is the case.15 Other dimensions of
the comparison are ambiguous as well—for instance,
loan officers in many MFIs spend much of their time
in neighborhoods bringing services to clients where
they live and work, whereas this is much less common
in credit unions. Nor is it clear what to make of the
comparison between MFI rates and the rates credit
unions charge for their special microcredit programs,
because many of these credit union programs are
aimed at a low-end village banking clientele, which
may in fact be poorer than the average clientele of the
country’s MFIs. Finally, most of our credit union data
come from relatively small groups of credit unions
that have been recipients of technical assistance from
the World Council of Credit Unions, and that may not
be typical of credit unions in their country.
Credit unions have been serving some substantial
number of poor and low-income clients for many
years. It would be very useful to have research that
gives a clearer picture of how they stack up against
MFIs in terms of outreach, loan products, costs, and
interest charges.
Are MFI Rates Climbing or Dropping?
Microcredit techniques and the institutions that
employ them are relatively new, having sprung up
over the last 20–30 years. The industry is still in a
nascent state in most countries. Standard theory
would lead us to expect reductions of costs (driven
Table 2: MFI Rates vs. Credit Union Rates
Regular credit union loan products:
Specialized credit union microcredit products:
Bolivia = Bolivia =
Colombia + Colombia –
Ecuador + Ecuador =, –
Ethiopia + Peru =
India + Philippines =
Kenya =
Mexico +
Nepal =
Peru +
Philippines +
Notes:+ MFI rates generally higher than credit union rates. – MFI rates generally lower than credit union rates.= MFI and credit union rates generally in same range.
14 See, for example, Robinson (2001).15 Grace (2007) reports 2006 data from 11 Ecuadoran credit unions that are affiliated with the World Council of Credit Unions. Average per
capita income of members was in the bottom quartile of the national distribution. A third of the loans were identified as microenterprise loans. Loan balances below $1,000 accounted for only 7.7 percent of the outstanding loan portfolio, but 36.1 percent of the number of active borrowers.
8
by learning curve and economies of scale) and prices
(driven by competition). Have such reductions in fact
happened? Bolivia is a frequently cited case where the
answer is clearly yes: from 1992 to 2007, microcredit
interest rates dropped 43 percentage points, from
about 60 percent to about 17 percent (Figure 2).
During the same period, bank rates dropped only
about 12 percentage points.
But is the Bolivia case representative? In Bangladesh,
another microcredit pioneer, interest rates have not
dropped substantially (though rates there started out
quite low). What has been the worldwide pattern in
recent years?
To answer these questions, we used data from the set
of 175 sustainable MFIs that reported to MIX in both
2003 and 2006. Figure 3 shows that the interest yield
on their combined loan portfolio has been dropping
quite fast over the period everywhere except for South
Asia, averaging 2.3 percentage points each year.16
A separate analysis for 2000–2005, using a larger
dataset of MFIs, but a somewhat less rigorous
methodology, showed even steeper declines—3.4
percent per year. During the same period, loan rates
for commercial banks in developing and transition
economies fell by about 0.8 percent per year.17
Later in this paper we look more closely at the question
of whether competition is driving the decline in rates.
But regardless of how it is explained, the substantial
downward trend in rates is certainly encouraging.
16 If interest yield is calculated individually for each MFI and then weighted by number of borrowers, the 2003 worldwide average was 33.0 percent, dropping an average of 1.2 percent a year to 29.3 percent in 2006.
17 Calculated from International Financial Statistics (IMF).
Figure 2: Evolution of Bolivian Microcredit Rates, 1992–2007
MFIs
Banks
70
60
0
Dec-9
2
Jun-
93
Dec-9
3
Jun-
94
Dec-9
4
Jun-
95
Dec-9
5
Jun-
96
Dec-9
6
Jun-
97
Dec-9
7
Jun-
98
Dec-9
8
Jun-
99
Dec-9
9
Jun-
00
Dec-0
0
Jun-
01
Dec-0
1
Jun-
02
Dec-0
2
Jun-
03
Dec-0
3
Jun-
04
Dec-0
4
Jun-
05
Dec-0
5
Jun-
06
Dec-0
6
Jun-
07
10
20
30
40
50
Eff
ecti
ve In
tere
st R
ate
Year
Sources: Gonzalez-Vega, Claudio, and Villafani-Ibarnegaray (2007) and Banking Superintendency data.
9
The Components of Microcredit Interest Rates
Four main components are reflected in an MFI’s
interest rate: cost of funds, loan loss expenses,
operating expenses, and profits. In this section, we
break out these components and discuss how they
may affect interest rate trends.
MFIs use their interest income to cover costs, and
the difference between income and costs is profit (or
loss). A simplified version of the relevant formula is
Income from loans = Cost of funds + Loan loss
expense + Operating expense + Profit 18,19
Lowering interest rates would require lowering one
of the four components on the right side of the
equation. If we want to judge whether interest rates
are reasonable, the most direct approach is to look at
whether each of these components that are funded
from interest income is at a reasonable level.
Figure 4 shows the relative importance of each of
those elements, expressed as a percentage of after-
tax income. Worldwide, operating expenses consume
more than half of income, followed by funding costs,
profits, and loan losses.
Cost of Funds
The relatively high price MFIs have to pay for money
they borrow contributes substantially to the interest
they charge borrowers. As of 2006, total funding
cost (interest expense) for 554 sustainable MFIs was
equivalent to 8.3 percent of their total average GLP
for the year (Figure 5).
Figure 6 shows no downward trend in cost of funds
(here expressed as the ratio of interest expense to
loan portfolio) for MFIs worldwide.
Figure 3: Interest Yield Trends, 2003–2006
35.1
28.0
44.3
34.5
24.8
36.0
25.5 26.1
31.728.2
23.9
32.6
20.9
26.2
0
10
20
30
40
50
WORLD Africa EAP ECA LAC MENA South Asia
% o
f G
ross
Lo
an P
ort
folio
–1.4% –3.9% –1.5% –0.9% –3.7% +/–0%–2.3%
2003 Avg. change per year2006
Note: Total Interest and Fee Income/Average Total GLP: average of 175 sustainable MIX MFIs, weighted by loan portfolio.
18 “Operating expense” is the term used by MIX to describe personnel and administrative costs, such as salaries, depreciation, maintenance, etc.19 The full formula is
Income from loans + Other income = Cost of funds + Loan loss expense + Operating expense + Tax +Profit
We want to look at costs and profit as percentages of loan portfolio, but taxes and other income do not relate directly to the portfolio. In addition, the current MIX reporting structure does not allow us to derive taxes and other income as separate items: we can calculate them only as a single net figure (i.e., other income – taxes). To solve these problems for the purposes of Figure 6, below, we have netted out taxes against other income on the left side of the equation, leaving us with the formula
Income from loans + (Other income – Taxes) = Cost of funds + Loan loss expense + Operating expense + Profit
10
Compared with commercial banks, MFIs tend to be
less leveraged—that is, less of their portfolio and
other assets is funded by liabilities on which they
have to pay interest. Figure 7 compares MFIs’ interest
expense with their liabilities rather than with their
loan portfolio, and shows that their borrowings have
been relatively expensive—averaging 5.1 percent in
2006, compared with about 3 percent for commercial
banks in the same countries.20
Are MFI managers prejudicing their borrowers by
incurring unnecessarily high funding costs? In general,
it would seem unfair to criticize MFI managers much
on this score, because even though they can control
20 Commercial bank computation by Christoph Kneiding based on the most recent BankScope data for countries that have MFIs reporting to MIX, weighted by liabilities.
0
20
40
60
80
100
WORLD Africa EAP ECA LAC MENA South Asia
% o
f In
com
e
Op. Expense Cost of Funds Loan Losses Profit
Figure 4: Costs and Profits as Percentage of Income, 2006
Note: 554 sustainable MFIs reporting to MIX for 2006 weighted by GLP. The Unit Desa system of Bank Rakyat Indonesia is excluded from this calculation because its reported cost of funds reflects artificial pricing arrangements between Unit Desa and the rest of the bank. The income on which the percentages are based is interest yield plus other income minus taxes.
8.3
6.1
7.78.6 8.5
5.1
8.6
0
2
4
6
8
10
WORLD Africa EAP ECA LAC MENA South Asia
% o
f G
ross
Lo
an P
ort
folio
Figure 5: Average Cost of Funds (Interest Expense) as Percentage of GLP, 2006
Note: 554 sustainable MFIs (without BRI) reporting to MIX, weighted by GLP.
11
their own operations, they usually have little control
over their rate of borrowing/funding costs. Most of
them get funding where they can find it and tend
to be price takers rather than price makers when
it comes to the interest rates they pay. Increasing
reliance on deposit funding will lower costs over the
longer term, as regulators authorize more MFIs to
take savings. However, this option is unavailable to
managers of MFIs if their country does not have the
enabling regulation, or if their business is not yet solid
enough to meet the hurdle for depository licensing.
Loan Loss Expenses
Loan losses due to borrower default have relatively
little effect on MFI interest rates, for the simple reason
that such losses are quite low in most MFIs, especially
in large ones that account for most of the market.
Figure 8 shows the global and regional medians for
loan losses, weighted by portfolio.
As a point of reference, the general rule of thumb in
microcredit is that annual loan losses of more than
2003 Avg. change per year2006
7.5
3.3
5.96.5
8.9
3.3
7.68.0
4.4
6.8
8.4 8.2
4.8
9.4
0
2
4
6
8
10
WORLD Africa EAP ECA LAC MENA South Asia
% o
f G
LP
0.4% 0.3% 0.6% –0.2% 0.5% 0.6%0.2%
Figure 6: Trend in Funding Costs (Interest Expense as Percentage of GLP), 2003–2006
Note: MIX data for 174 sustainable MFIs reporting in both years. BRI has been excluded because its reported cost of funds is artificial.
5.1
2.6
4.8 5.05.5
3.1
5.7
0
1
2
3
4
5
6
WORLD Africa EAP ECA LAC MENA South Asia
% o
f Li
abili
ties
Figure 7: MFI Interest Expense as Percentage of Liabilities, 2006
Note: 554 sustainable MIX MFIs, weighted by liabilities
17286WBCGAP_Text_OP_15 ENG-R2.indd 1117286WBCGAP_Text_OP_15 ENG-R2.indd 11 3/26/09 3:33:18 AM3/26/09 3:33:18 AM
12
21 The 2006 distribution of loan losses, weighted by GLP, was
Region 5% 25% Median 75% 95%
Africa 0.3 0.7 2.3 3.9 22.4
EAP 0.1 0.9 0.9 0.9 1.1
ECA 0.3 0.8 1.6 2.0 2.7
LAC 0.8 1.2 2.2 3.6 10.0
MENA 0.0 0.2 1.8 1.8 2.0
SA 0.0 0.4 1.7 2.4 2.7
World 0.2 0.9 1.6 2.7 5.7
about 5 percent tend to become unsustainable.
Above that level, loan collection must be improved
quickly and substantially or it will spin out of control.
MFIs usually have delinquency and default rates well
below those of commercial banks in their countries.
(Interestingly, emerging evidence also suggests that
MFIs are more stable than banks when it comes to
the effect of general economic stress on their loan
collection [Gonzalez 2007].)
The high average loan loss rate for Africa (4.9 percent)
is driven by a few outliers.21
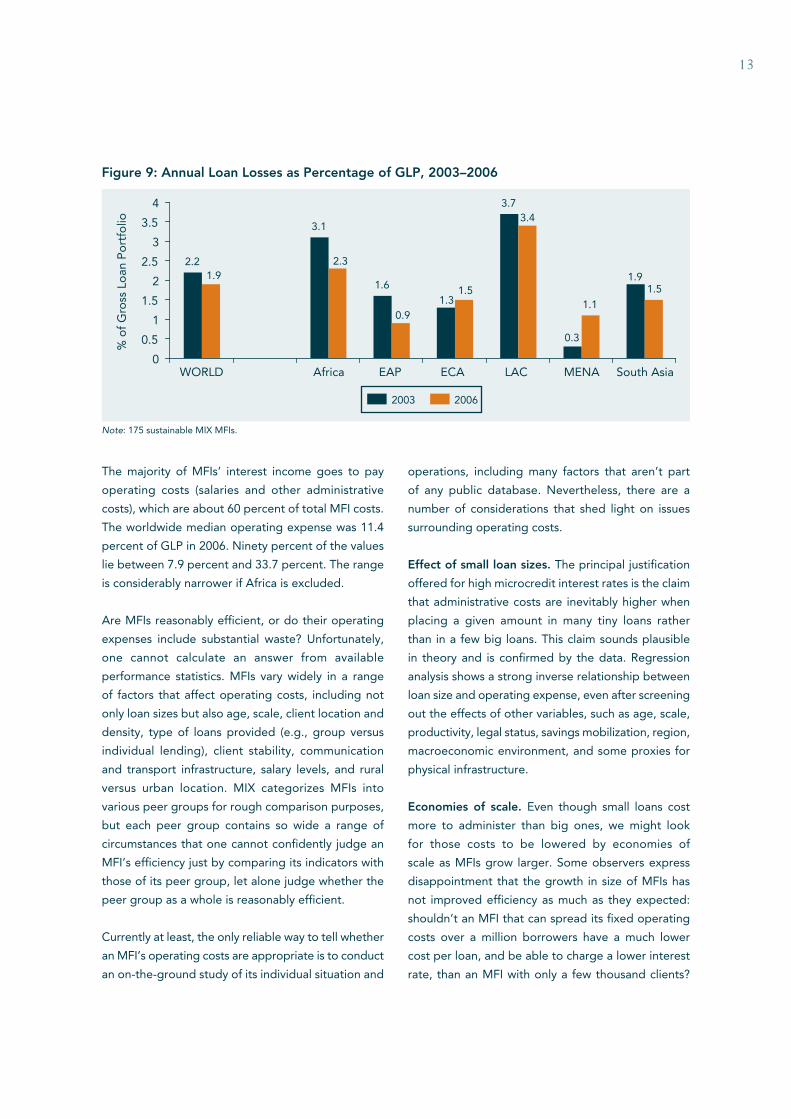
Figure 9 shows 2003–2006 trends in loan losses.
Regional trends vary, but loan losses measured
globally are down slightly. Further improvement
might be possible, but there seems to be little room
for an improvement big enough to have a substantial
effect on the interest rates clients have to pay. Indeed,
loan loss rates can go too low. An MFI that has no
loan losses at all is probably being too risk-averse
in its selection of borrowers, which hurts not only
the expansion of poor people’s access to finance
but also the MFI’s own profitability. If there is any
widespread abuse in microcredit interest rates today,
it certainly cannot be traced back to excessive loan
loss expense.
Operating Expenses (Efficiency)
[Compared to other topics in this paper, analysis of
whether MFI operating expenses are “reasonable” is
relatively complex. The following is a brief summary.
Readers who want a more detailed discussion,
including data and sources, should refer to the
Appendix at the back of this paper, and then return
to the section on profit beginning on page 15.]
2.3
4.9
1.01.5
3.0
1.21.5
0
1
2
3
4
5
6
WORLD Africa EAP ECA LAC MENA South Asia
% o
f G
ross
Lo
an P
ort
folio
Figure 8. Global and Regional Loan Losses as Percentage of GLP, Averages for 2006
Note: Data from 555 sustainable MFIs reporting to MIX for 2006, weighted by gross loan portfolio.
13
The majority of MFIs’ interest income goes to pay
operating costs (salaries and other administrative
costs), which are about 60 percent of total MFI costs.
The worldwide median operating expense was 11.4
percent of GLP in 2006. Ninety percent of the values
lie between 7.9 percent and 33.7 percent. The range
is considerably narrower if Africa is excluded.
Are MFIs reasonably efficient, or do their operating
expenses include substantial waste? Unfortunately,
one cannot calculate an answer from available
performance statistics. MFIs vary widely in a range
of factors that affect operating costs, including not
only loan sizes but also age, scale, client location and
density, type of loans provided (e.g., group versus
individual lending), client stability, communication
and transport infrastructure, salary levels, and rural
versus urban location. MIX categorizes MFIs into
various peer groups for rough comparison purposes,
but each peer group contains so wide a range of
circumstances that one cannot confidently judge an
MFI’s efficiency just by comparing its indicators with
those of its peer group, let alone judge whether the
peer group as a whole is reasonably efficient.
Currently at least, the only reliable way to tell whether
an MFI’s operating costs are appropriate is to conduct
an on-the-ground study of its individual situation and
operations, including many factors that aren’t part
of any public database. Nevertheless, there are a
number of considerations that shed light on issues
surrounding operating costs.
Effect of small loan sizes. The principal justification
offered for high microcredit interest rates is the claim
that administrative costs are inevitably higher when
placing a given amount in many tiny loans rather
than in a few big loans. This claim sounds plausible
in theory and is confirmed by the data. Regression
analysis shows a strong inverse relationship between
loan size and operating expense, even after screening
out the effects of other variables, such as age, scale,
have some level of correctable inefficiency, and it is
not easy to think of a reason why microfinance should
be any different. We know of no evidence suggesting
22 Some observers interpret growth in average loan sizes as a sign of “mission drift” away from poor clients, but it is far from clear how often this is valid. The link between loan size and client poverty is only a very rough one at best. Most MFIs have a sequential ladder of loan sizes for clients, and the very small loans at the beginning of that ladder often reflect the MFI’s risk management policy rather than the actual needs or repayment capacity of the borrowers. When borrowers move into later and larger loans, or when the MFI relaxes its size limits on initial loans, the MFI’s average loan size will climb even if there has been no change in the kind of client it is serving. And even where the MFI is adding better off clients (i.e., small business operators) as it grows, that does not necessarily mean restricting service for poorer customers. A much more reliable way to judge mission drift is to look at the character of the villages, towns, and neighborhoods where the MFI is opening its new branches.
15
that MFIs in general are out of line with the normal
evolution of efficiency for businesses in immature
markets. And the pronounced downward trend in
costs is highly encouraging.
Profit
Of the four components of microcredit interest rates,
profit is the one that is most obviously subject to
management control. It is also the most controversial.
Some observers are uncomfortable with the notion of
private parties making any profit from microlending,
which they view as a service to poor people, and not
as a business opportunity. Others accept the idea of
private profits in microlending, but are concerned that
MFIs will exploit the weak bargaining position of their
borrowers to extract abusive levels of profit. Still others
think that high profits in the early stages are a positive
good, because high returns will attract more investment
and more rapid outreach of services to people who need
them, and because they are confident that competition
will eventually moderate those profits.
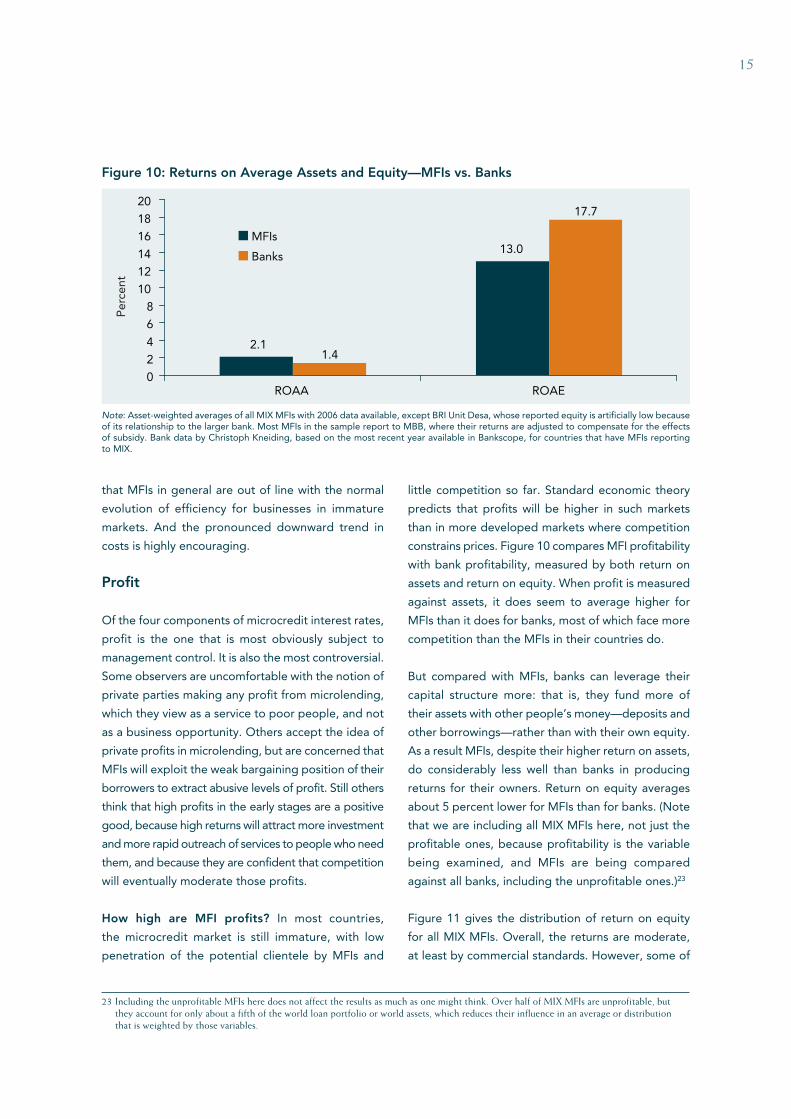
How high are MFI profits? In most countries,
the microcredit market is still immature, with low
penetration of the potential clientele by MFIs and
little competition so far. Standard economic theory
predicts that profits will be higher in such markets
with bank profitability, measured by both return on
assets and return on equity. When profit is measured
against assets, it does seem to average higher for
MFIs than it does for banks, most of which face more
competition than the MFIs in their countries do.
But compared with MFIs, banks can leverage their
capital structure more: that is, they fund more of
their assets with other people’s money—deposits and
other borrowings—rather than with their own equity.
As a result MFIs, despite their higher return on assets,
do considerably less well than banks in producing
returns for their owners. Return on equity averages
about 5 percent lower for MFIs than for banks. (Note
that we are including all MIX MFIs here, not just the
profitable ones, because profitability is the variable
being examined, and MFIs are being compared
against all banks, including the unprofitable ones.)23
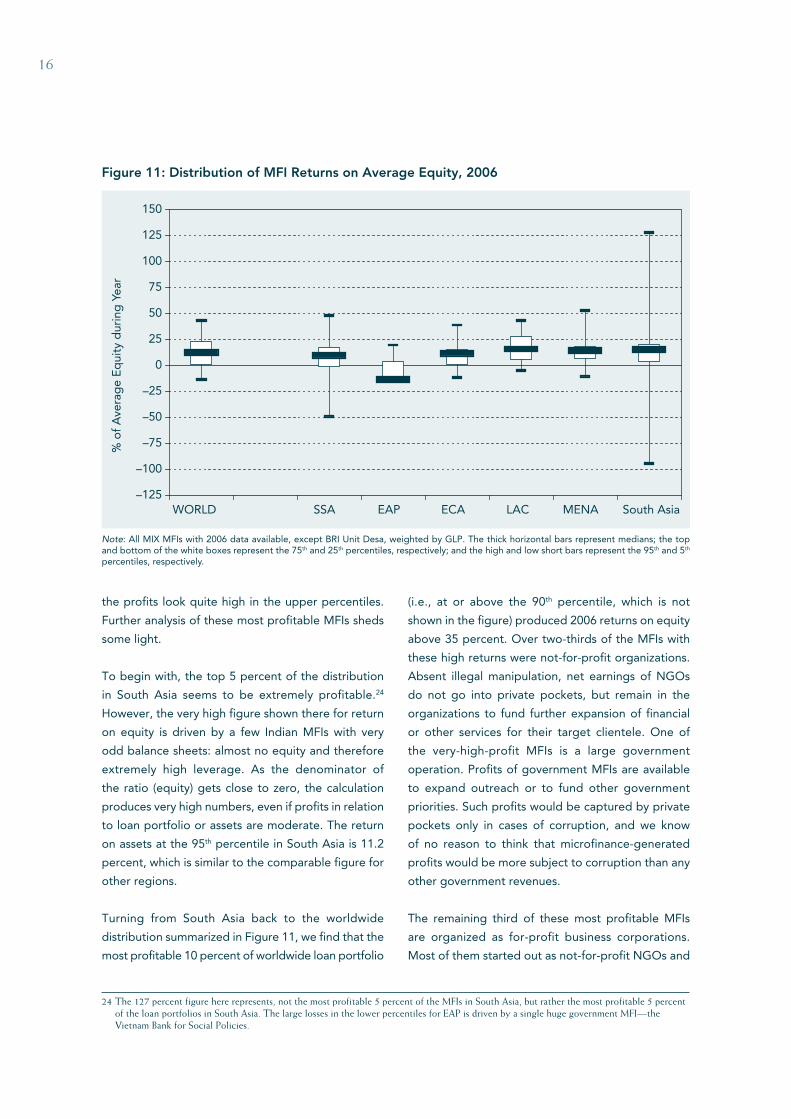
Figure 11 gives the distribution of return on equity
for all MIX MFIs. Overall, the returns are moderate,
at least by commercial standards. However, some of
2.1
13.0
1.4
17.7
0
2
4
6
8
10
12
14
16
18
20
ROAA ROAE
MFIs
Banks
Per
cent
Figure 10: Returns on Average Assets and Equity—MFIs vs. Banks
Note: Asset-weighted averages of all MIX MFIs with 2006 data available, except BRI Unit Desa, whose reported equity is artificially low because of its relationship to the larger bank. Most MFIs in the sample report to MBB, where their returns are adjusted to compensate for the effects of subsidy. Bank data by Christoph Kneiding, based on the most recent year available in Bankscope, for countries that have MFIs reporting to MIX.
23 Including the unprofitable MFIs here does not affect the results as much as one might think. Over half of MIX MFIs are unprofitable, but they account for only about a fifth of the world loan portfolio or world assets, which reduces their influence in an average or distribution that is weighted by those variables.
16
the profits look quite high in the upper percentiles.
Further analysis of these most profitable MFIs sheds
some light.
To begin with, the top 5 percent of the distribution
in South Asia seems to be extremely profitable.24
However, the very high figure shown there for return
on equity is driven by a few Indian MFIs with very
odd balance sheets: almost no equity and therefore
extremely high leverage. As the denominator of
the ratio (equity) gets close to zero, the calculation
produces very high numbers, even if profits in relation
to loan portfolio or assets are moderate. The return
on assets at the 95th percentile in South Asia is 11.2
percent, which is similar to the comparable figure for
other regions.
Turning from South Asia back to the worldwide
distribution summarized in Figure 11, we find that the
most profitable 10 percent of worldwide loan portfolio
(i.e., at or above the 90th percentile, which is not
shown in the figure) produced 2006 returns on equity
above 35 percent. Over two-thirds of the MFIs with
these high returns were not-for-profit organizations.
Absent illegal manipulation, net earnings of NGOs
do not go into private pockets, but remain in the
organizations to fund further expansion of financial
or other services for their target clientele. One of
the very-high-profit MFIs is a large government
operation. Profits of government MFIs are available
to expand outreach or to fund other government
priorities. Such profits would be captured by private
pockets only in cases of corruption, and we know
of no reason to think that microfinance-generated
profits would be more subject to corruption than any
other government revenues.
The remaining third of these most profitable MFIs
are organized as for-profit business corporations.
Most of them started out as not-for-profit NGOs and
24 The 127 percent figure here represents, not the most profitable 5 percent of the MFIs in South Asia, but rather the most profitable 5 percent of the loan portfolios in South Asia. The large losses in the lower percentiles for EAP is driven by a single huge government MFI—the Vietnam Bank for Social Policies.
–125
–100
–75
–50
–25
0
25
50
75
100
125
150
WORLD SSA EAP ECA LAC MENA South Asia
% o
f A
vera
ge
Eq
uity
dur
ing
Yea
r
Figure 11: Distribution of MFI Returns on Average Equity, 2006
Note: All MIX MFIs with 2006 data available, except BRI Unit Desa, weighted by GLP. The thick horizontal bars represent medians; the top and bottom of the white boxes represent the 75th and 25th percentiles, respectively; and the high and low short bars represent the 95th and 5th percentiles, respectively.
17
transformed to qualify for a deposit-taking license,
or for some other reason. In such cases, the NGO
usually retains some significant portion of the shares,
and the profits accruing to those shares stay in the
NGO to fund its work. Finally, some significant part of
the shares in the for-profit MFIs is owned by private
individuals or companies. Profits on those privately
owned shares—and only those profits—make their
way sooner or later into private pockets. Again, the
high profits accruing to private owners of MFIs in
the top 5 or 10 percent of the profit distribution are
exceptional rather than typical in the microfinance
industry. But they are not insignificant, and they do
raise a question of appropriateness.
Some observers think it is immoral for private parties
to take a profit, or anything but a minimal profit,
out of services to the poor (a view that has been
expressed by Nobel laureate Muhammad Yunus).
To them, those high profits going to private parties
are abusive by definition, as are most of the lower
profits reported in our data, at least to the extent that
they’re being captured privately.
Other observers think that commercial investment,
which requires returns at least as high as those found
in ordinary banks, will enable microfinance services to
reach a greater number of poor clients faster. From
this perspective, the appropriateness of high-end
profits in this minority of cases can be addressed only
by investigating individual circumstances, including
most importantly the risk investors took on when they
put in their capital without knowing what the results
would be. CGAP has published such a review for
Compartamos (Rosenberg 2007).
In the past few years there has been a proliferation
of international investment funds (microfinance
investment vehicles—MIVs) that lend to MFIs or invest
in their shares. The objectives of MIV investors cover a
spectrum. At one end are public development finance
institutions whose core objective is development, and
who typically are willing to accept higher risks or
lower returns than a commercial investor would. At
the other end are commercial actors who may like
the cachet of microfinance, but have no intention of
investing in any MFI whose risk-return profile is not
competitive from a purely commercial standpoint.
An unpublished 2008 CGAP study found that the
composition of MIV funding has been changing in
recent years. The majority of MIV money is now
coming from investors at or near the fully commercial
end of the spectrum. MIV investments are heavily
concentrated in the largest MFIs. Three quarters
of MIV money goes into loans to MFIs, which are,
of course, less risky than the other quarter that is
invested in equity.
What kind of profits are MIVs making? Assembling
data is not easy, but the CGAP study was able to
analyze returns for a set of MIVs that were organized
in 2002. The average annual return reported for debt
investments has been 6.3 percent. The reported return
on riskier equity investments has been 12.5 percent.
Both figures reflect gross returns; they do not include
the effect of the funds’ administrative costs, which
tend to range from 2 to 6 percent, mostly toward the
lower end. These returns are respectable but far from
spectacular, especially considering the relatively brief
track record of MFIs in most countries, and the fact
that most MIV investments face substantial country
risk, including currency and political risks.
Are MFI profits rising or falling? Figure 12 presents
weighted average after tax profits (interest yield +
other income – expenses – taxes) the same way that
earlier figures have shown funding costs, loan losses,
and operating costs—namely, as a percentage of loan
portfolio for the 175 sustainable MFIs that reported
their performance to MIX Market/MBB for both 2003
and 2006. There has been a substantial downward
trend—0.6 percentage points (about one-tenth of
their value) each year.
What is the impact of profits on interest rates? It
is axiomatic that if MFIs were to shrink their profits,
they could charge their clients lower interest rates.
But how much lower? Figure 13 looks at net MFI
profits (including profits from other activities besides
lending) in relation to the interest they collect from
18
borrowers. It tells us how much an MFI could reduce
the interest it charges if it completely eliminated
all profit. This is, of course, a drastic and unrealistic
scenario. The MFI would be forgoing not only returns
to its owners but also growth in equity capital to
expand the business.
Figure 13 shows that an MFI at the median could
reduce its interest rate by 17 percent of the interest
rate (not 17 percent of the loan amount). In other
words, completely eliminating all profit would reduce
the median MFI’s interest rate by only about one-
sixth, an effect that is smaller than many people might
expect. By way of comparison, the hypothetical interest
reduction by eliminating all profit is less than the drop
in rates that actually happened from 2003 to 2006. If
all sustainable MFIs swore off profits tomorrow, they
would still have to charge interest rates that might look
abusive to those who don’t understand the high costs
that tiny lending inevitably entails.
Cutting out profit would have more substantial
effects at the upper percentiles, especially the top
5 percent, where interest rates could be shaved by
almost two-thirds. One of the things going on here is
that MFIs above the 75th percentile get a lot more of
their income from sources other than lending. Over
20 percent of their income comes from nonlending
activities (mainly other financial services and returns
on investments), compared with 7.5 percent for the
other three quartiles. Lowering interest rates enough
to eliminate all profit would mean that these MFIs
would be subsidizing losses on their loan portfolio
with the net income from other activities.
Competition
People who are enthusiastic about the
commercialization of microfinance have sometimes
taken it as an article of faith that markets will eventually
approach saturation, at which point competition will
put downward pressure on interest rates, forcing MFIs
to lower their profits and become more efficient. But
it is not guaranteed that such effects will always occur.
For instance, credit card rates in the oversaturated
U.S. market have proved stickier than other credit
rates, probably due in considerable part to the
substantial time investment required for a customer to
search for and switch to a new card with better terms
(Calem and Mester 1995 and Ausubel 1991). Also,
lenders might compete for customers by increasing
their advertising, or enhancing service quality, instead
of lowering their interest rates (Bertrand et al. 2005
and Wright and Alamgir 2004).
It is widely thought that microloan customers are
not very sensitive to interest rate changes. If true,
this would reduce competition’s downward effect on
% o
f av
erag
e G
ross
Loan
Po
rtfo
lio
WORLD Africa EAP ECA LAC MENA South Asia
–0.1% –0.5% –0.4% –0.3% –1.7% +/–0%–0.6%
2003 Avg. change per year2006
7.7
5.2
11.4
5.9
10.3
5.1
4.0
6.36.0
5.0
9.8
2.9
5.0
6.3
0
2
4
6
8
10
12
Figure 12: After-Tax Profit as Percentage of Average GLP, 2003–2006
Note: GLP-weighted average of 175 sustainable MIX MFIs.
19
rates, profits, and costs. But two recent studies have
found considerable price sensitivity among customers
of a Bangladesh microlender and a South African
consumer finance provider (Dehejia, Montgomery,
and Morduch 2005 and Karlan and Zinman 2007).
Three other CGAP-commissioned studies are testing
interest rate sensitivity in other markets. The Gates
Foundation is also investing in such research.
David Porteous (2006) has analyzed microcredit
competition and its effects in Boliva, Uganda, and
Bangladesh. At the time of his study (2005), interest
rates had not yet declined much in Uganda, but
Porteous judged that the microcredit industry was
still in a consolidation phase there and thus that
classical competition theory would not yet predict
price competition. Markets in Bolivia and Bangladesh
were more highly saturated. Interest rates had
indeed declined steeply in Bolivia, but considerably
less in Bangladesh. Porteous reported that the rate
reductions that had occurred there resulted more
from political pressure than from competition.
Interest rates, profits, and operating costs started out
much lower in Bangladesh than was typical elsewhere
in the world, probably mainly due to the attitudes of
pioneers there toward the business. Thus, there was
less room for reductions than in some other places.
Nevertheless, some large Bangladesh MFIs are now
generating profits that are high enough to suggest
room for further interest rate reduction.25
It is unclear why competition isn’t squeezing profits
in Bangladesh more seriously. One possibility is
that many or even most borrowers with more than
one option may want to borrow more than any
single MFI will lend them, and so they take multiple
loans wherever they can get them, even if one of
the providers is more expensive than another. MFI
managers in Bangladesh report high levels of multiple
indebtedness. Another theoretical explanation would
be implicit collusion among the few MFIs that occupy
most of the market.
Blaine Stephens (2007) reviewed 2003–2005 trends in
four competitive microcredit markets—Bolivia, Bosnia,
Morocco, and Peru—and found interest rates and
operating expenses had dropped in parallel each year
in all four markets. As the market in Cambodia has
become more competitive, interest rates there have
dropped by about a half between 2000 and 2007,
according to Eric Duflos, a senior microfinance analyst
from CGAP.26 A forthcoming MIX Benchmarking
report for Mexico, where competition has set in quite
recently, shows modest declines in interest rates and
profits during 2007. Knowledgeable observers tell
us that microfinance is becoming competitive in
important markets in India and that it has resulted in
downward pressure on interest rates.
Figure 13: MFI Net Income as Percentage of Interest Yield, 2006
Note: 555 sustainable MIX MFIs, weighted by loan portfolio. The thick horizontal bar represents medians; the top and bottom of the white box represent the 75th and 25th percentiles, respectively; and the high and low short bars represent the 95th and 5th percentiles, respectively.
WORLD
Tota
l Net
Inte
rest
Inco
me/
Inte
rest
Yie
ld
0
10
20
30
40
50
60
70
25 Return on average equity for 2006 was 26.1 percent at ASA, 23.3 percent at BRAC, and 22.2 percent at Grameen. Return on average assets was 14.4 percent for ASA, 6.9 percent for BRAC, and 2.4 percent for the more heavily leveraged Grameen (MIX Market data). ASA and BRAC are launching major efforts to move into other countries, and we speculate that they are probably using their profits to finance this major expansion of services.
26 According to unweighted MIX data, median MFI interest rates in Cambodia dropped from 42 percent in 2003 to 32 percent in 2006.
20
Taken together, these data points suggest that
competition may not inevitably produce lower interest
rates, profits, and operating expenses in all markets,
but that such effects do appear to be happening in
most of the markets now regarded as competitive.
Present data suggest an optimistic picture, but it is
still too soon for any robust prediction about how
universal the lower-interest-rates-through-competition
scenario will be. Perhaps the more relevant fact is
the substantial worldwide decline in interest rates,
administrative costs, and profits that we observed
earlier in the paper. All this is distinctly positive for
borrowers, who may not care very much whether we
attribute it to competition or some other factor.
Summary and Conclusions
The question we have tried to address is whether
microcredit borrowers are being abused by
unreasonably high interest rates. Here are what
we see as the highlights of the evidence we have
assembled.
Level of Interest Rates
Using the best data available, the median interest •
rate for sustainable (i.e., profitable) MFIs was about
26 percent in 2006. The 85 percent interest rates
that drew so much attention to the Mexican MFI
Compartamos are truly exceptional, rather than
representative of the industry.
MFI interest rates have been declining by 2.3 •
percentage points a year since 2003, much faster
than bank rates.
Comparison with Other Rates Paid by Low-Income Borrowers
MFI rates are significantly lower than consumer and •
credit card rates in most of the 36 countries for which
we had rate indications, and significantly higher
than those rates in only a fifth of the countries.
Based on 34 reports from 21 countries, MFI rates •
were almost always lower—usually vastly lower—
than rates charged by informal lenders.
MFI rates were typically higher than credit union rates •
in the 10 countries for which we found data. In the
cases where the credit unions offered a specialized
microcredit product, their interest charges tended
to be the same as, or higher than, prevailing MFI
rates. However, it is hard to make much of this
information, not only because the sample size is so
small, but also because we know so little about the
comparability of customers and products.
Cost of Funds
MFIs have to pay more than banks pay when they •
leverage their equity with liabilities, and their cost
of funds as a percentage of loan portfolio showed
no sign of dropping 2003–2006. But MFI managers
don’t usually have much control over these costs,
in the medium term at least.
Loan Losses
MFI interest rates are not being inflated by •
unreasonable loan losses. In fact, default rates are
of scale. On the other hand, the learning curve of
MFIs as they age produces substantial reductions.
Administrative costs are the largest single •
contributor to interest rates, but they have been
declining by 1 percentage point per year since 2003.
This decline appears to be a true improvement
in the cost of serving each borrower, not just the
result of expanding loan sizes.
We have no statistical way to quantify how much •
avoidable fat remains to be trimmed from MFI
operating costs. Given the finding that the level of
these costs is strongly related to the age of the MFI,
it would be unrealistic not to expect substantial
inefficiency at a time when most MFIs are relatively
young, and when most national microfinance
markets are immature and noncompetitive. We are
21
unaware of any evidence to suggest that MFIs in
general are out of line with the normal evolution of
efficiency for businesses in such markets.
Profits
MFIs on average have higher returns on assets •
than commercial banks do, but MFIs produce
considerably lower returns on equity for their
owners. The average return on MFI owners’ equity
in 2006 was moderate—12.3 percent, compared
with 17.7 percent for banks. The very high profits
that have drawn so much attention to Compartamos
are outliers, not at all typical of the industry.
At the same time, the most profitable 10 percent •
of the worldwide microcredit portfolio produced
returns on equity above 34 percent in 2006, a level
that is no doubt high enough to raise concerns
about appropriateness for some observers. Much
of this profit is captured by NGOs and never
reaches private pockets. But some of it does go to
private investors. A judgment about whether such
profits are “abusive” would depend not only on
the observer’s standard for what is a reasonable
profit but also on investigation of individual MFI
circumstances, including the risk levels faced by
investors when they committed their funds.
The burgeoning volume of money passing through •
international microfinance investment funds is
coming mainly from investors who are not willing
to accept higher risks or lower returns for the sake
of social objectives. Yet the profits generated by
these funds seem unimpressive so far.
Profits of sustainable MFIs, measured as a •
percentage of loan portfolio, have been dropping
by about one-tenth (0.6 percentage points) per
year since 2003.
Profits are not a predominant driver of interest •
rates. For the median MFI, the extreme and
unrealistic scenario of complete elimination of
all profit would cause its interest rate to drop by
only about one-sixth. Such an interest reduction
would not be insignificant, but it would still leave
microcredit rates at levels that might look abusive
to politicians and the public, neither of whom
usually understand the high costs that tiny lending
inevitably entails.
Competition
One cannot assume that competition will always •
lower interest rates. Interest rates appear to have
dropped in the markets where microcredit has
already become competitive, except for Bangladesh.
But it is still too early to make any robust prediction
about how universal the lower-interest-rates-
through-competition scenario will be.
Whatever the role that competition plays, the •
important fact is that interest rates, profits,
and administrative costs have shown a marked
downward trend in recent years.
How all this information is put together is up to each
reader. We approach the issue from a development
perspective, where the main concern is not financial
results but rather client benefit—including, of course,
those future clients who will get access to financial
services as new investment expands the outreach
of MFIs. A few MFIs have charged their borrowers
interest rates that may be considerably higher than
what would make sense from this perspective. Indeed,
it would be astonishing if this were not the case,
given the diversity of the industry and the scarcity of
competitive markets.
The real question is whether unreasonable MFI
lending rates are more than occasional exceptions.
We do not find evidence suggesting any widespread
pattern of borrower exploitation by abusive MFI
interest rates. We do find strong empirical support
for the proposition that operating costs are much
higher for tiny microloans than for normal bank loans,
so sustainable interest rates for microloans have to be
significantly higher than normal bank interest rates.
We are encouraged by the rapid decline in interest
rates, operating costs, and profits in recent years,
and we would expect this trend to continue in the
medium-term future.
22
Appendix. Operating Expenses
Operating expenses constitute the majority of MFI
costs. As shown in Figure A-1, the worldwide median
for operating expense ratio (OER—salaries and other
administrative costs divided by GLP) was 11.4 percent
for 2006.27
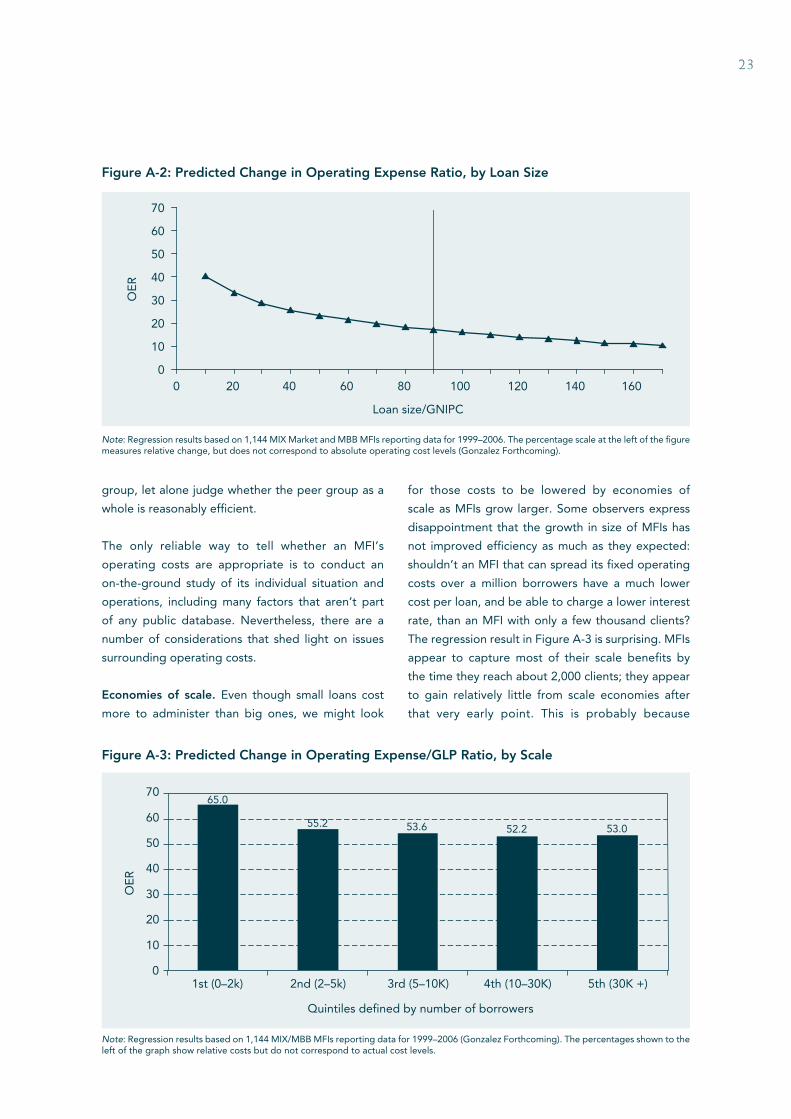
Effect of small loan sizes. The principal justification
offered for high microcredit interest rates is the claim
that administrative costs are inevitably higher when
placing a given amount in many tiny loans rather than
a few big loans. This claim sounds plausible enough
in theory, and Figure A-2 suggests that it stands up
empirically. This figure shows the results of a regression
analysis testing the relationship between average
loan size and OER, both measured as percentage
of gross national income per capita (GNIPC). The
regression screened out the effect of other variables,
such as age, scale, productivity, legal status, savings
mobilization, region, macroeconomic environment,
and some proxies for physical infrastructure.
It is clear that loan administration will cost MFIs more
than it costs banks that make much larger loans. But
is the actual level of operating costs for most MFIs
the inevitable result of loan size, or does it reflect
unreasonable inefficiency? One cannot calculate an
answer to this question from available performance
statistics. MFIs vary widely in a range of factors that
affect operating costs, including not only loan sizes
but also age, scale, client location and density, type
of loans provided (e.g., group versus individual
lending), client stability, communication and transport
infrastructure, salary levels, and rural versus urban
location. MIX categorizes MFIs into various peer
groups for rough comparison purposes, but each
peer group contains so wide a range of circumstances
that one cannot confidently judge an MFI’s efficiency
just by comparing its indicators with those of its peer
27 This paper’s version of the operating expense ratio (operating expense/GLP) is different from the one used by MIX (operating expense/total assets).
0
10
20
30
40
50
60
70
80
90
WORLD SSA EAP ECA LAC MENA South Asia
% o
f G
ross
Lo
an P
ort
folio
Figure A-1: Distribution of Operating Expense Ratio, 2006
Note: 555 Sustainable MIX MFIs, weighted by GLP. The thick horizontal bars represent medians; the top and bottom of the white boxes represent the 75th and 25th percentiles, respectively; and the high and low short bars represent the 95th and 5th percentiles, respectively.
23
0
10
20
30
40
50
60
70
0 20 40 60 80 100 120 140 160
Loan size/GNIPC
OE
R
Figure A-2: Predicted Change in Operating Expense Ratio, by Loan Size
Note: Regression results based on 1,144 MIX Market and MBB MFIs reporting data for 1999–2006. The percentage scale at the left of the figure measures relative change, but does not correspond to absolute operating cost levels (Gonzalez Forthcoming).
group, let alone judge whether the peer group as a
whole is reasonably efficient.
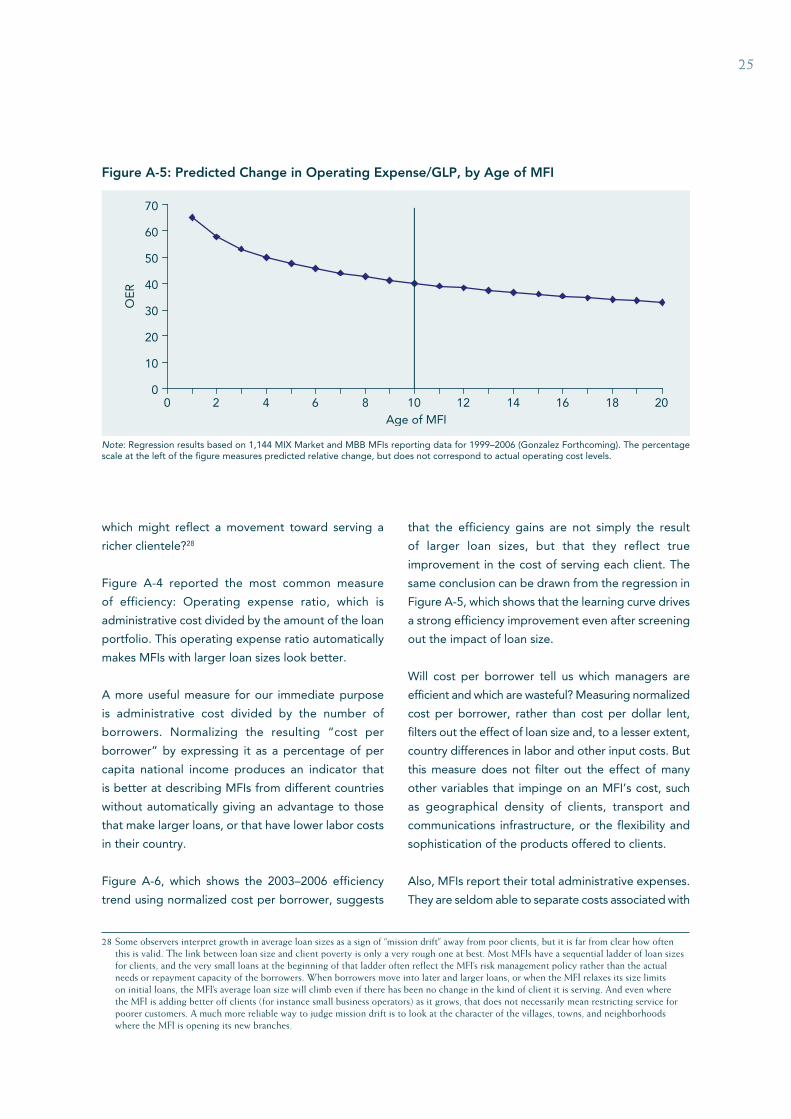
The only reliable way to tell whether an MFI’s
operating costs are appropriate is to conduct an
on-the-ground study of its individual situation and
operations, including many factors that aren’t part
of any public database. Nevertheless, there are a
number of considerations that shed light on issues
surrounding operating costs.
Economies of scale. Even though small loans cost
more to administer than big ones, we might look
for those costs to be lowered by economies of
scale as MFIs grow larger. Some observers express
disappointment that the growth in size of MFIs has
not improved efficiency as much as they expected:
shouldn’t an MFI that can spread its fixed operating
costs over a million borrowers have a much lower
cost per loan, and be able to charge a lower interest
rate, than an MFI with only a few thousand clients?
The regression result in Figure A-3 is surprising. MFIs
appear to capture most of their scale benefits by
the time they reach about 2,000 clients; they appear
to gain relatively little from scale economies after
Figure A-3: Predicted Change in Operating Expense/GLP Ratio, by Scale
Note: Regression results based on 1,144 MIX/MBB MFIs reporting data for 1999–2006 (Gonzalez Forthcoming). The percentages shown to the left of the graph show relative costs but do not correspond to actual cost levels.
24
microcredit is so labor intensive: salaries make up
the majority of most MFIs’ operating expenses,
and fixed costs are relatively low compared with
variable costs. MFIs that are still small enough to
reap major economies of scale account for only a
tiny percentage of microcredit loans and customers.
In short, economies of scale cannot do much to
offset the added expense that comes from making
very small microcredit loans.
Trend of operating costs. Figure A-4 shows good
news. MFI efficiency has improved substantially—i.e.,
operating costs have declined—in recent years in all
regions except South Asia, where operating costs
were already quite low.
Why are operating cost ratios dropping: learning
curve, loan size, or competition? The decline in
operating costs is a major contributor to the decline
in interest rates that borrowers are paying. What is
causing this improvement in efficiency, and can we
expect it to continue?
Learning curve. One driver—perhaps the most
important driver—of improved MFI efficiency seems
to be the increasing age of large MFIs as the industry
develops. As institutions mature, they learn their
business better and are able to control costs more
that the age of an MFI is strongly associated with
lower operating costs, even after separating out the
effects of loan size, scale, and other relevant variables.
Not surprisingly, the effect weakens over time, but it
continues for quite a while. The operating expense
ratio tends to drop by 2–8 percentage points for
each of the first six years, 1–2 points for each of the
next five years, and less than 1 point for each year
thereafter.
We do not have a good statistical proxy for the
competitiveness of an MFI’s market, so we cannot
quantify how much of this age effect can be attributed
to competition. However, it’s likely that most of the
effect is due to the learning curve, because relatively
few MFI markets are competitive yet.
Loan size and mission drift. Since smaller loans are
associated with higher operating expenses, an MFI
could reduce its operating expense ratio by simply
making larger loans. If an MFI whose borrowers
all have $100 loans suddenly lets these borrowers
double their loan size, or finds new borrowers who
want larger loans, the MFI does not need to double
its staff or other administrative expenses. Are the
improvements in efficiency shown in Figure A-4
nothing more than the result of increasing loan sizes,
15.6
21.9
14.0
18.5
13.8
23.2
15.9
11.3
16.7
12.7
18.8
9.011.1 11.9
0
5
10
15
20
25
WORLD Africa EAP ECA LAC MENA South Asia
–1.0% –1.7% –1.6% –0.6% –3.1% 0.2%–1.0%
2003 Avg. change per year2006
% o
f av
erag
e G
ross
Loan
Po
rtfo
lio
Figure A-4: Operating Costs as Percentage of GLP, 2003–2006
Note: 175 sustainable MFIs reporting to MIX for both 2003 and 2006.
25
which might reflect a movement toward serving a
richer clientele?28
Figure A-4 reported the most common measure
of efficiency: Operating expense ratio, which is
administrative cost divided by the amount of the loan
portfolio. This operating expense ratio automatically
makes MFIs with larger loan sizes look better.
A more useful measure for our immediate purpose
is administrative cost divided by the number of
borrowers. Normalizing the resulting “cost per
borrower” by expressing it as a percentage of per
capita national income produces an indicator that
is better at describing MFIs from different countries
without automatically giving an advantage to those
that make larger loans, or that have lower labor costs
in their country.
Figure A-6, which shows the 2003–2006 efficiency
trend using normalized cost per borrower, suggests
that the efficiency gains are not simply the result
of larger loan sizes, but that they reflect true
improvement in the cost of serving each client. The
same conclusion can be drawn from the regression in
Figure A-5, which shows that the learning curve drives
a strong efficiency improvement even after screening
out the impact of loan size.
Will cost per borrower tell us which managers are
efficient and which are wasteful? Measuring normalized
cost per borrower, rather than cost per dollar lent,
filters out the effect of loan size and, to a lesser extent,
country differences in labor and other input costs. But
this measure does not filter out the effect of many
other variables that impinge on an MFI’s cost, such
as geographical density of clients, transport and
communications infrastructure, or the flexibility and
sophistication of the products offered to clients.
Also, MFIs report their total administrative expenses.
They are seldom able to separate costs associated with
0
10
20
30
40
50
60
70
0 2 4 6 8 10 12 14 16 18 20Age of MFI
OE
R
Figure A-5: Predicted Change in Operating Expense/GLP, by Age of MFI
Note: Regression results based on 1,144 MIX Market and MBB MFIs reporting data for 1999–2006 (Gonzalez Forthcoming). The percentage scale at the left of the figure measures predicted relative change, but does not correspond to actual operating cost levels.
28 Some observers interpret growth in average loan sizes as a sign of “mission drift” away from poor clients, but it is far from clear how often this is valid. The link between loan size and client poverty is only a very rough one at best. Most MFIs have a sequential ladder of loan sizes for clients, and the very small loans at the beginning of that ladder often reflect the MFI’s risk management policy rather than the actual needs or repayment capacity of the borrowers. When borrowers move into later and larger loans, or when the MFI relaxes its size limits on initial loans, the MFI’s average loan size will climb even if there has been no change in the kind of client it is serving. And even where the MFI is adding better off clients (for instance small business operators) as it grows, that does not necessarily mean restricting service for poorer customers. A much more reliable way to judge mission drift is to look at the character of the villages, towns, and neighborhoods where the MFI is opening its new branches.
26
lending from costs associated with other products,
like savings. So if an MFI adds savings services, its
reported cost per borrower will rise, but this doesn’t
signal deterioration in efficiency.
Finally, at a certain level, larger loan sizes do translate
into larger administrative expenses per borrower—for
instance, small business loans need more sophisticated
and expensive analysis than microloans, so one would
not expect to see cost per borrower as low in Eastern
Europe as it is in South Asia. As a result of all these
factors, one cannot automatically conclude, for
example, that managers of East Asian MFIs are more
efficient than managers in Latin America, just because
the former have a lower cost per borrower.
The various factors that impinge on cost per borrower
affect individual MFIs differently. However, they stay
more or less the same for a given MFI from one
year to the next, so the overall decline in cost per
borrower shown in Figure A-6 very probably reflects
true efficiency improvement.
We know of no statistical approach that can directly
measure whether MFI administrative costs are
abusively high today. But the data have permitted us
to make some relevant observations. The plausible
argument that costs need to be higher when smaller
loans are being delivered is supported by regression
analysis of a large set of MFIs. MFI operating cost
levels have dropped substantially in recent years,
and we have seen that this represents real operating
improvements, not just the effect of increasing loan
sizes. Regression analysis suggests that much of this
improvement reflects the learning curve as MFIs gain
experience.
This still doesn’t tell us how much avoidable “fat”
is built into MFI operating expenses. Because most
microfinance markets are so young and because most
are not yet competitive, it would be unrealistic to
expect MFIs in those markets to be operating at the
most efficient levels possible. Immature industries
always have some level of correctable inefficiency.
We know of no evidence suggesting that MFIs in
general are out of line with the normal evolution of
efficiency for businesses in immature markets. Finally,
the year-to-year cost of operating expenses shows an
encouraging decline, however we measure it.
–4.1% –0.6% –4.1% –1.5% –0.5% –0.1%–1.0%
2003 Avg. change per year2006
15.4
49.8
7.8
14.0
2.74.2
37.9
2.2
9.412.5
37.4
5.9
25.7
1.90
10
20
30
40
50
60
WORLD Africa EAP ECA LAC MENA South Asia
% o
f p
er c
apit
a G
NI
Figure A-6: Operating Expenses Per Borrower as Percentage of Per Capita Gross National Income
Note: 175 sustainable MFIs reporting to MIX for both years, weighted by GLP.
27
References
Adams, Dale, Douglas Graham, and J. D. Von Pischke.
1984. Undermining Rural Development with Cheap
Credit. Westview.
Ausubel, Lawrence. 1991. “The Failure of Competition
in Credit Card Markets.” American Economic Review,
vol. 81 (1).
Bertrand, Marianne, et al. 2005. What’s Psychology
Worth? A Field Experiment in the Consumer Credit
Market. Yale University Economic Growth Center.
New Haven, Conn.: Yale University Press.
Calem, Paul S., and Loretta J. Mester. 1995.
“Consumer Behavior and the Stickiness of Credit-
Card Interest Rates.” American Economic Review,
vol. 85 (5): 1327–36.
Christen, Robert, Richard Rosenberg, and Veena
Jayadeva. 2004. “Financial Institutions with a
‘Double Bottom Line’: Implications for the Future
of Microfinance.” Occasional Paper 8. Washington,
D.C.: CGAP, July.
Cuevas, Carlos E. 1989. “Loan Transactions and
Borrowing Costs in Developing Countries.” American
Journal of Agricultural Economics 71: 1356.
Dehejia, Rajeev, Heather Montgomery, and Jonathan
Morduch. 2005. Do Interest Rates Matter? Credit
demand in the Dhaka slums. Financial Access
Initiative.
Gonzalez, Adrian. 2007. “Resilience of Microfinance
to Local Macroeconomic Events: An Econometric
Analysis of MFIs Asset Quality. MIX Discussion Paper
No. 1. Washington, D.C.: MIX, July.
———. Forthcoming. “Efficiency Drivers of
Microfinance Institutions (MFIs): The Case of
Operating Expenses.” MIX Discussion Paper No. 2.
Washington, D.C.: MIX, forthcoming.
Gonzalez, Adrian, and Richard Rosenberg. 2006.
“The State of Microcredit—Outreach, Profitability,
and Poverty Findings from a Database of 2600
Microfinance Institutions. Presentation at World Bank
Conference, “Access to Finance,” May 30.
Gonzalez-Vega, Claudio, and Villafani-Ibarnegaray.
2007. “Las Microfinanzas en la Profundización del
Sistema Financiero. El Caso de Bolivia.” El Trimestre
Economico, Vol. 74, No. 293.
Grace, David. 2007. “Middle Is Not a Four-Letter
Word.” MicroBanking Bulletin, No. 14 (Spring): 3.
Karlan, Dean, and Jonathan Zinman. 2007. Observing
Unobservables: Identifying Information Asymmetries
with a Consumer Credit Field Experiment. Yale
University Economic Growth Center Working Paper
no. 911. New Haven, Conn.: Yale University Press.
Meyer, Richard L., and Carlos E. Cuevas. 1992.
“Reduction of Transaction Costs of Financial
Intermediation: Theory and Innovations.” In
Savinqs and Credit for Development. Report of the
International Conference on Savings and Credit for
Development, Klarskovgard, Denmark, 28–31 May
1990. New York: United Nations, 285–317.
Porteous, David. 2006. “Competition and Microcredit
Interest Rates.” Focus Note 33. Washington, D.C.:
CGAP.
Robinson, Marguerite. 2001. The Microfinance
Revolution, vol. 1. Washington, D.C.: World Bank.
Rosenberg, Richard. 2007. “CGAP Reflections on the
Compartamos Initial Public Offering: A Case Study on
Microfinance Interest Rates and Profits.” Focus Note
Rural Credit Market in Vietnam.” Canberra, Australia:
Australia National University, National Center for
Development Studies.
Wright, David, and Dewan Alamgir. 2004. “Microcredit
Interest Rate in Bangladesh: Capping vs. Competition.”
Unpublished. http://www.microfinancegateway.org/
content/article/detail/23259.
The authors of this Occasional Paper are Richard Rosenberg, a senior consultant for CGAP; Adrian Gonzalez, lead researcher at the Microfinance Information eXchange; and Sushma Narain, an independent consultant. (Views expressed in this paper are not necessarily those of MIX.) The authors have made use of an
unpublished paper by Brigit Helms, Xavier Reille, Samer Badawi, and Adrian Gonzalez and are grateful for useful comments from Blaine Stephens, Elizabeth Littlefield, Ignacio Mas, and Jeanette Thomas, as well as analysis of BankScope data by Christoph Kneiding and patient and skillful editing by Anna Nunan.
The following is a suggested citation for this Occasional Paper:Rosenberg, Richard, Adrian Gonzalez, and Sushma Narain. 2009. “The New Moneylenders: Are the Poor Being Exploited by High Microcredit Interest Rates?” Occasional Paper 15. Washington, D.C.: CGAP.