46
The New Process Validation Paradigm Overview & ISPE Resources

The New Process Validation Paradigm
Overview & ISPE Resources
ISPE Boston Chapter Meeting June 20, 2013 Presenter: Peter Levy Principal PL Consulting, LLC [email protected] With Thanks to Joanne Barrick (Eli Lilly)

© 2012 © 2012
Presentation Outline
• FDA Process Validation Guidance (2011) • Specific ISPE Initiatives
• ISPE Discussion Paper Efforts on PV • Papers posted on ISPE Web-Site • Papers in progress
• Other Available Resources • A-Mab Case Study • PDA Technical Reports
3

© 2012 © 2012 4
Guidance for Industry Process Validation: General Principles and Practices
U.S. Department of Health and Human Services Food and Drug Administration Center for Drug Evaluation and Research (CDER) Center for Biologics Evaluation and Research (CBER) Center for Veterinary Medicine (CVM) January 2011 Current Good Manufacturing Practices (CGMP) Revision 1

© 2012 © 2012
What is Process Validation? Shift in Emphasis
• … “process validation is defined as the collection and evaluation of data, from the process design stage throughout production, which establishes scientific evidence that a process is capable of consistently delivering quality products.”*
• Objective – understand and control input variability & its impact to the process to assure consistent product quality and reliable supply
5
* Reference: FDA Guidance for Industry, Process Validation: General Principles and Practices, January, 2011
Slide used with permission of J. Barrick

© 2012 © 2012
11FDA PV Guidance Stages Added
How does Lifecycle Approach to Validation Integrate with ICH ?
6
8
9
10Drug Substance
Slide used with permission of J. Barrick
Stage 1 Process Design
Scope & Extent Design Sampling Monitoring and frequency
Life Cycle Approach Control Strategy & Robustness Statistical Control
Stage 3 Continued Process Verification
Stage 2 Process Qualification

© 2012 © 2012
FDA Guidance Process Validation - Three Stages
• Defines the commercial process
7
FDA Product Life Cycle - Process Validation
• Confirms the process design capable, in commercial production. Control strategy adequacy
• Ongoing assurance process remains in a state of control
3a 3b Heightened Sampling & Testing until variability understood
Routine Monitoring Program
Commercial Mfg
Slide used with permission of J. Barrick

© 2012 © 2012
What is “New” - Challenges? • Science and Risk based PV/PPQ - product and process
understanding, good science, statistical confidence • Statistically based sampling plans and acceptance
criteria • PPQ/PV and routine release
• Justification of the number of PPQ/PV batches • Acceptance criteria across batches (Process Capability /
Consistency) • Enhanced sampling and testing beyond PPQ exercise • Application beyond DS & DP process?
• Cleaning • Shipping
8 Slide used with permission of J. Barrick

© 2012 © 2012
ISPE INITIATIVES RELATED TO PROCESS VALIDATION
9
© 2012 © 2012
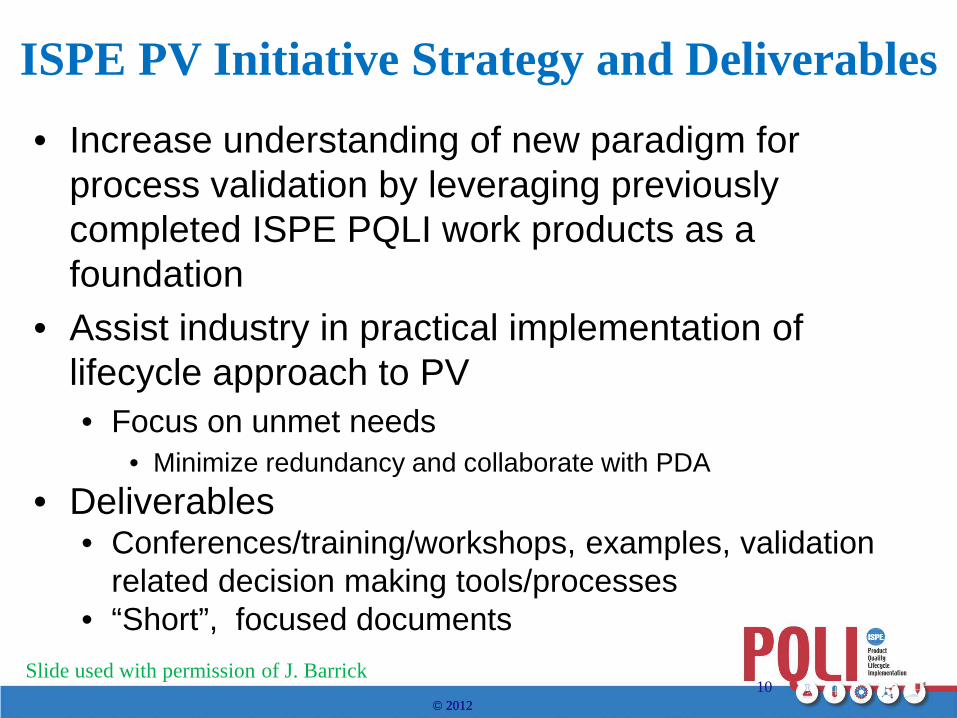
• Increase understanding of new paradigm for process validation by leveraging previously completed ISPE PQLI work products as a foundation
• Assist industry in practical implementation of lifecycle approach to PV • Focus on unmet needs
• Minimize redundancy and collaborate with PDA • Deliverables
• Conferences/training/workshops, examples, validation related decision making tools/processes
• “Short”, focused documents
10
ISPE PV Initiative Strategy and Deliverables
Slide used with permission of J. Barrick

© 2012 © 2012
ISPE PV Discussion Papers on Significant Implementation Challenges • Topic 1 – Determining and Justifying the Number of
PPQ Batches • Topic 2 – Applying Continued Process Verification
Expectations to New and Legacy Products • 460 comments received from limited distribution to ISPE
Communities of Practice • Topic 1
• 37 respondents (10+ companies) • Topic 2
• 30 respondents (10+ companies)
• Posted on ISPE website August 2012
11 Slide used with permission of J. Barrick

© 2012 © 2012
PV Documents
12 Slide used with permission of J. Barrick

© 2012 © 2012
Access & Availability
13
•Papers are available on ISPE website (http://ispe.org/)
•Access – Free access to all (members and non-members)
•Publications •Discussion documents
13
Slide used with permission of J. Barrick

© 2012 © 2012
ISPE Discussion Papers in Progress
• Acceptance Criteria and Sampling During PPQ • Case Study: Applying Different Statistical
Techniques to the Same Data Set – Impact on Results/Conclusions
• Impact of Lifecycle Approach to PV for Biotech Processes
• Working with Contract Manufacturers (for PV Studies)
14

© 2012 © 2012
Upcoming ISPE Conferences with PV Sessions
• cGMP Conference: June 11-13, Baltimore, MD • 2013 Biotechnology Conference: Looking Ahead
to the 4th Decade, August 27-28, Durham, NC • Proactive Compliance Conference, October 7-8,
New Brunswick, NJ • 2013 Annual Meeting: Quality Throughout the
Product Lifecycle, November 3-6, Washington, DC
15

© 2012 © 2012
OTHER RESOURCES
16
© 2012 © 2012
Biotech Process Validation Documents of Interest
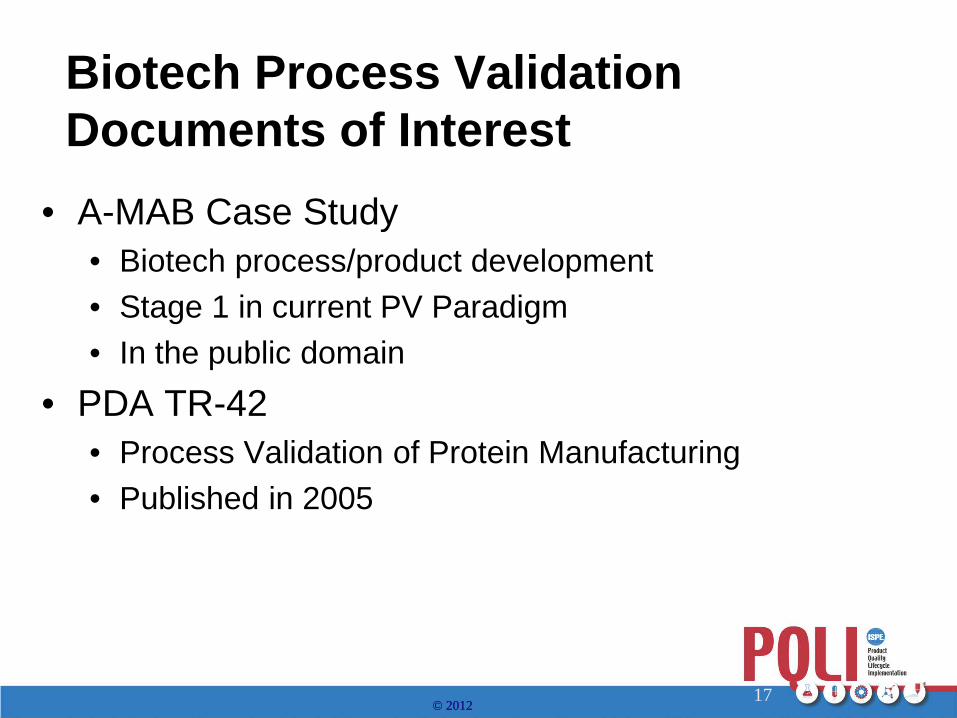
• A-MAB Case Study • Biotech process/product development • Stage 1 in current PV Paradigm • In the public domain
• PDA TR-42 • Process Validation of Protein Manufacturing • Published in 2005
17

© 2012 © 2012
Biotech Process Validation Documents of Interest
• PDA TR-60 • Process Validation – A Lifecycle Approach • Published in 2013
• PDA TR-14 • Validation of Chromatography Processes • Initially published in 1992, updated in 2009
• PDA TR-15 • Validation of TFF Processes • Initially published in 1992, updated in 2009
18

© 2012 © 2012
QUESTIONS ???
19

Kurtis Epp BioTechLogic, Inc. Lessons from 483s Process Validation Track February 27-28, 2012
Stage 3 – Post PPQ Monitoring

Sub-Team & White Paper Authors
oDafni Bika – BMS (Sub-Team Leader) oPenny Butterell – Pfizer oKurtis Epp – BioTechLogic o Joane Barrick – Eli Lilly o Jennifer Walsh – BMS oGert Molgaard – NNE Pharmaplan
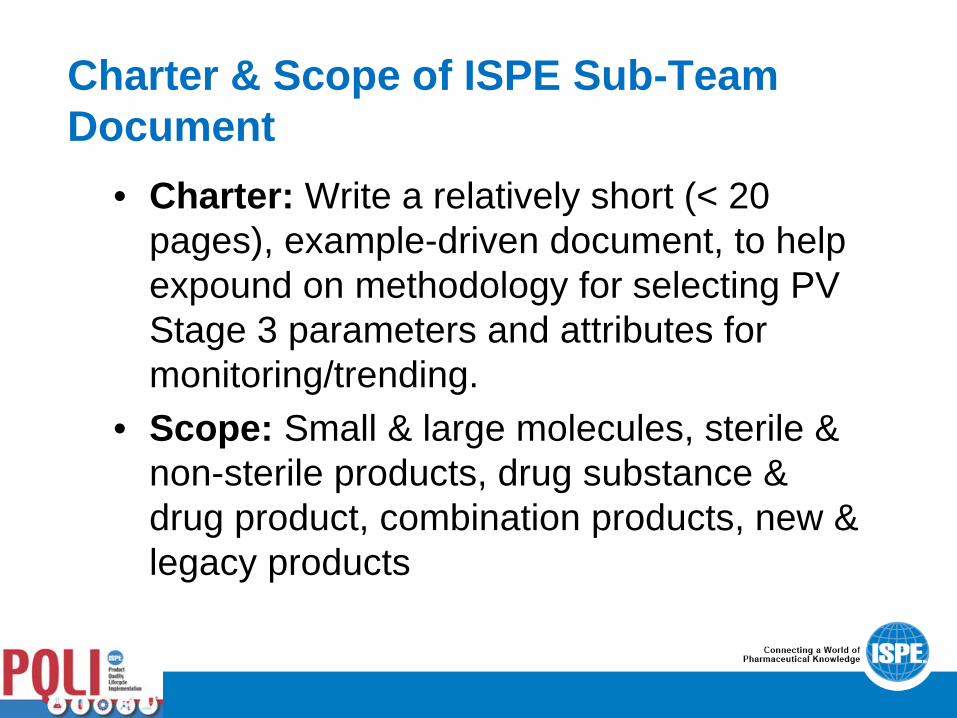
Charter & Scope of ISPE Sub-Team Document
• Charter: Write a relatively short (< 20 pages), example-driven document, to help expound on methodology for selecting PV Stage 3 parameters and attributes for monitoring/trending.
• Scope: Small & large molecules, sterile & non-sterile products, drug substance & drug product, combination products, new & legacy products

The Essence of Stage 3 Validation
• Goal: Assurance that the process remains in a state of control
• Activity: Ongoing analysis of product and process data to identify and assess sources of process variability and impact to product quality

Major Challenges for CPV Implementation
1. How to select the appropriate parameters and attributes for CPV assessment.
2. How to analyze CPV data, once collected.
3. How to respond to process variability.
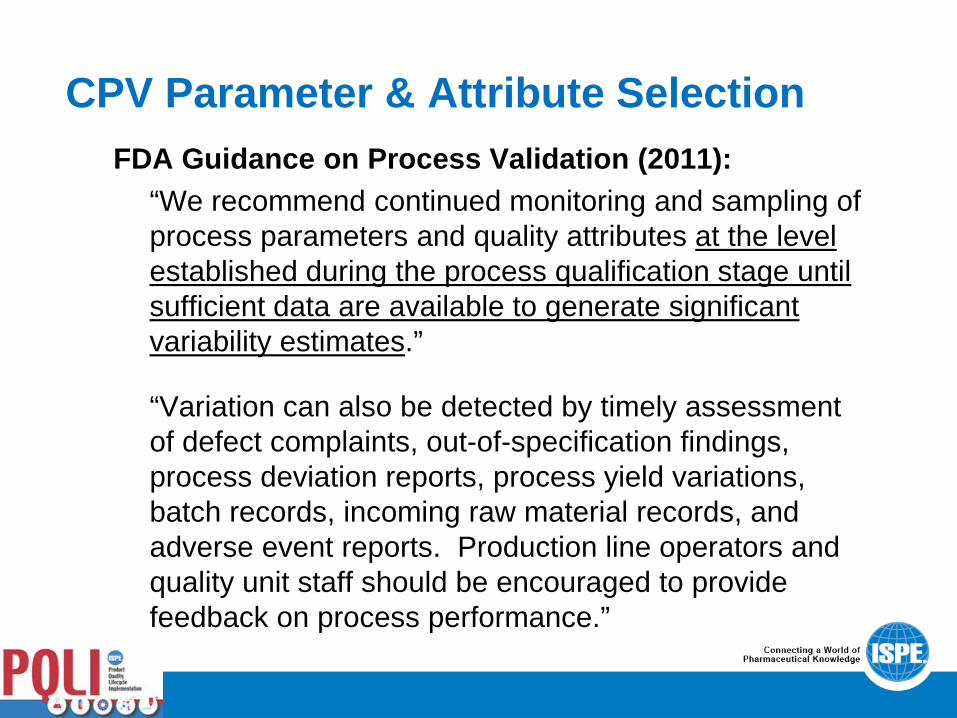
CPV Parameter & Attribute Selection FDA Guidance on Process Validation (2011):
“We recommend continued monitoring and sampling of process parameters and quality attributes at the level established during the process qualification stage until sufficient data are available to generate significant variability estimates.”
“Variation can also be detected by timely assessment of defect complaints, out-of-specification findings, process deviation reports, process yield variations, batch records, incoming raw material records, and adverse event reports. Production line operators and quality unit staff should be encouraged to provide feedback on process performance.”

CPV Starting Point
Start with the qualified control strategy, then…
• Determine whether risk assessment needs to be performed (legacy product) or updated following PPQ (new product) to document understanding of correlation between process parameters and CQAs (assumes inclusion of CQA severity ranking).
• Assess current process capability.
• Assess potential impact of raw material variability.
• Assess knowledge of operational risks.
• Assess robustness of predictive models.
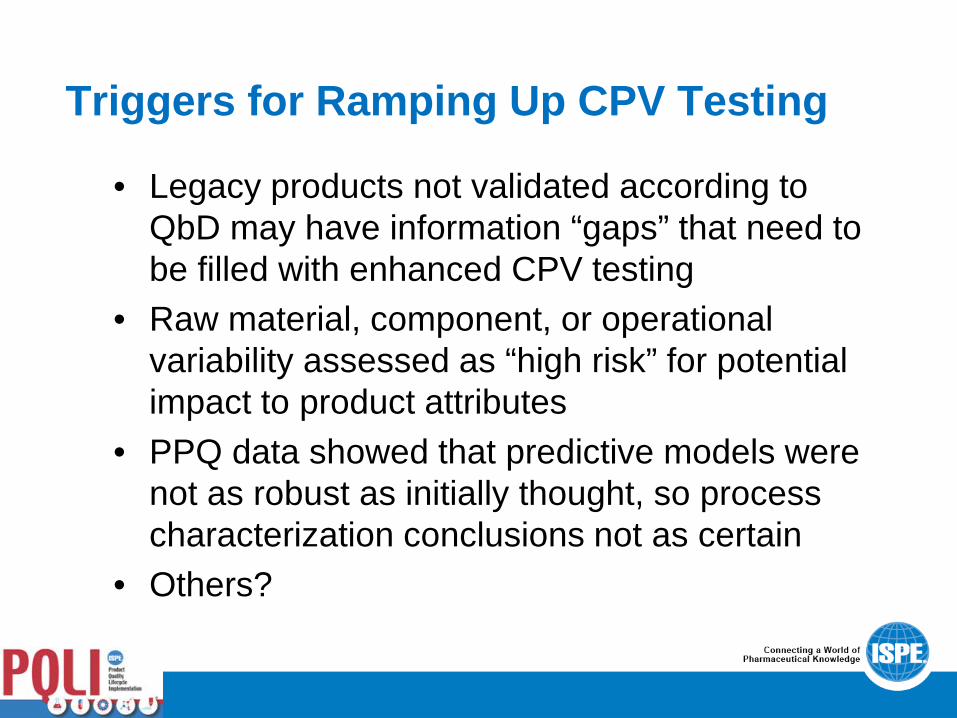
Triggers for Ramping Up CPV Testing
• Legacy products not validated according to QbD may have information “gaps” that need to be filled with enhanced CPV testing
• Raw material, component, or operational variability assessed as “high risk” for potential impact to product attributes
• PPQ data showed that predictive models were not as robust as initially thought, so process characterization conclusions not as certain
• Others?
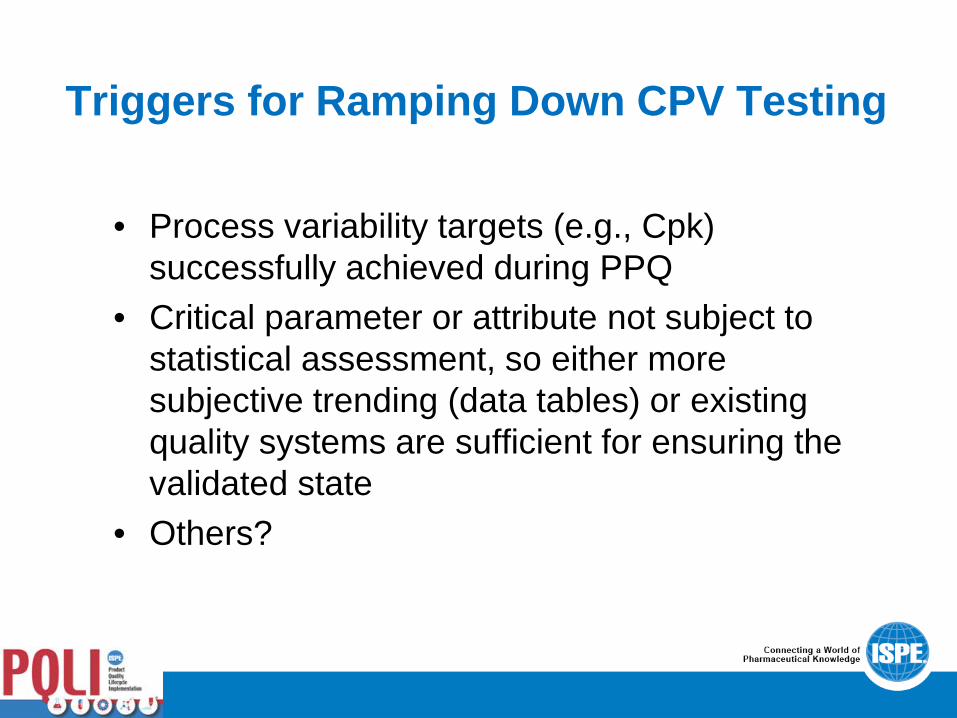
Triggers for Ramping Down CPV Testing
• Process variability targets (e.g., Cpk) successfully achieved during PPQ
• Critical parameter or attribute not subject to statistical assessment, so either more subjective trending (data tables) or existing quality systems are sufficient for ensuring the validated state
• Others?

Data Analysis • Statistical control limits – using calculated upper
and lower control limits as well as SPC rules to trend data
• Capability analysis – measuring how well the process satisfies/meets CQAs and customer requirements using Cp/Cpk (short-term) and Pp/Ppk (long-term)
• Certain parameters (e.g., bioburden & endotoxin) may not be subject to statistical analysis, but could be “trended” by a more subjective data assessment (rather than waiting for a failure before taking action)

Data Analysis • Statistical control limits
o Strength: ease of interpretation
o Strength: well defined rules for assessing various OOT results
o Weakness: cannot formally apply rules (e.g., Western Electric) until a statistically appropriate number of data points (e.g., n ≥ 25)
• Process Capability o Strength: applicable with fewer data points, depending on
assigned CQA risk level and desired confidence level (e.g., n ≥ 7)
o Strength: defines “control” against established acceptance criteria
o Weakness: not as easy to observe slight trend shifts

Process Impact
• Statistical limits should not be confused with routine acceptance criteria. An “out-of-control” or “out-of-trend” result should trigger an investigation to understand source of variability, but does not necessarily constitute batch failure or loss of the validated state
• CPV Plan should prescribe what actions are taken to correct/control variability identified via CPV assessment

Real Biologics Example - Challenges 1. Limited amount of data at the commercial scale prior to PPQ
(e.g., two representative engineering batches for the current large molecule example)
2. Intra-batch sampling is not typically relevant to biologics unit operations, outside of bulk drug substance and drug product filling due to one large pool being progressed downstream.
3. There are typically a considerable number of parameters assessed during the PPQ exercise that are not subject to variability estimates (e.g., data are below a method’s LOQ/LOD, data are not subject to normal distribution, Pass/Fail results).
4. High cost associated with many enhanced testing procedures (e.g., residuals testing)
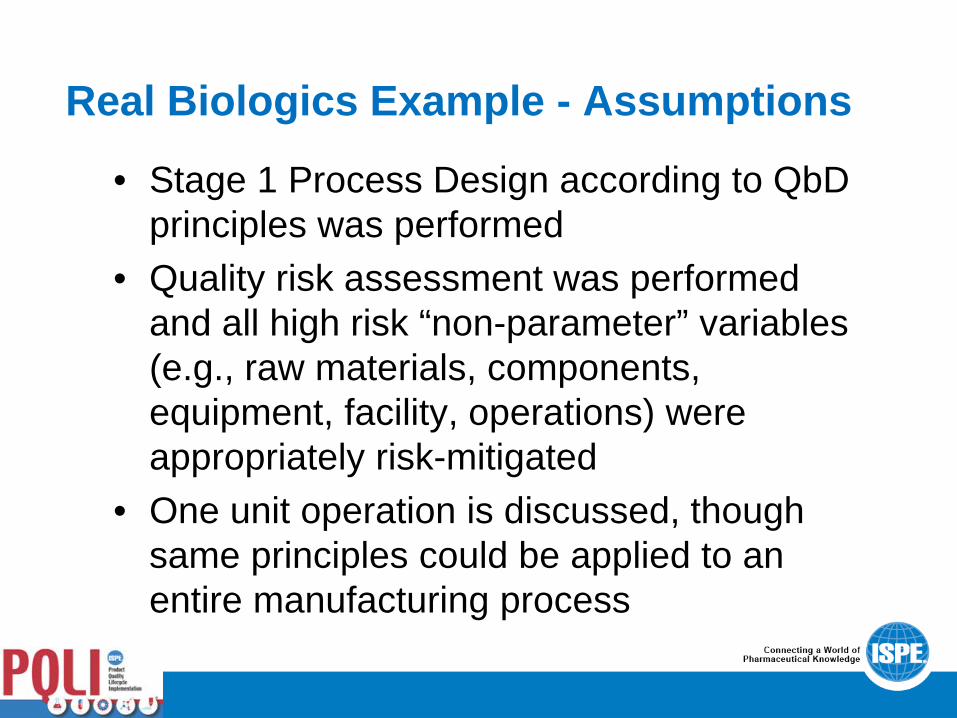
Real Biologics Example - Assumptions
• Stage 1 Process Design according to QbD principles was performed
• Quality risk assessment was performed and all high risk “non-parameter” variables (e.g., raw materials, components, equipment, facility, operations) were appropriately risk-mitigated
• One unit operation is discussed, though same principles could be applied to an entire manufacturing process

Real Biologics Example – Parameter & Attribute Selection
Critical Operating Parameter Normal Operating Range
None In-Process Control Limit(s)
Packed Bed Height 32.0 ± 2.0 cm Number of cycles since last passing HETP test < 5
Total Number of Previous Uses on Resin < 32
Column Backpressure during Equilibration, Load, Wash, and Elution
≤ 25 psig
Outlet pH (offline) at End of Equilibration 5.0 ± 0.2
Protein Load per Volume of Resin ≤ 20 g/L

Real Biologics Example – Parameter & Attribute Selection
Critical Operating Parameter
Normal Operating
Range Include in CPV Action/Rationale
None
In-Process Control Limit(s) Include in CPV Action/Rationale
Packed Bed Height 32.0 ± 2.0 cm No
Not subject to normal distribution; failure cannot be predicted by data; failures addressed under existing quality system (i.e., deviation investigation)
Number of cycles since last passing HETP test < 5 No
Total Number of Previous Uses on Resin < 32 No
Column Backpressure during Equilibration, Load, Wash, and Elution
≤ 25 psig No
Outlet pH (offline) at End of Equilibration 5.0 ± 0.2 No
Protein Load per Volume of Resin ≤ 20 g/L No

Real Biologics Example – Parameter & Attribute Selection
In-Process Acceptance Criteria Acceptance Criteria
Eluate Endotoxin Alert Limit: ≥ 5 EU/mL Action Limit: ≥ 10 EU/mL
Eluate Bioburden Alert Limit: ≥ 10 CFU/10 mL Action Limit: ≥ 50 CFU/10 mL
Step Yield (A280) ≥ 75% Eluate Purity (RP-HPLC) ≥ 85%
Additional Sampling Acceptance Criteria Eluate Host Cell Protein Content < 500 ng/mL
Eluate DNA Content < LOQ

Real Biologics Example – Parameter & Attribute Selection
In-Process Acceptance Criteria Acceptance Criteria Include in
CPV Rationale
Eluate Endotoxin Alert Limit: ≥ 5 EU/mL Action Limit: ≥ 10 EU/mL Yes
Compare to historical commercial data for assurance of consistency of environmental, water, and equipment microbial control
Eluate Bioburden Alert Limit: ≥ 10 CFU/10 mL Action Limit: ≥ 50 CFU/10 mL Yes
Compare to historical commercial data for assurance of consistency of environmental, water, and equipment microbial control
Step Yield (A280)* ≥ 75% Yes Control chart to continuously verify that desired unit operation output is consistently met.
Eluate Purity (RP-HPLC) ≥ 85% Yes Control chart to continuously verify that desired unit operation output is consistently met since PV batches had downward trend.
Additional Sampling Acceptance Criteria Include in CPV Rationale
Eluate Host Cell Protein Content < 500 ng/mL No
Adequately demonstrated removal during PV batches; consecutive PPQ batches were all > 10x lower than the acceptance criterion
Eluate DNA Content < LOQ No Adequately demonstrated removal during PV batches; consecutive PPQ batches were all < LOQ

Real Biologics Example – Parameter & Attribute Selection
• Four parameters identified for inclusion in the formal CPV exercise were eluate endotoxin, eluate bioburden, step yield, and eluate purity by RP-HPLC.
• Compile and trend data from twenty-five commercial scale batches (including two representative pre-PPQ engineering batch as well as the three PPQ batches) and assess on an ongoing basis.
• CPV strategy to be re-assessed after twenty-five batches.

Real Biologics Example – Data Analysis
AEX Eluate Endotoxin Data Lot Number Result (EU/mL) Lot Number Result (EU/mL)
Engineering #1 < 0.5 004 2 Engineering #2 1 005 < 0.5 001 (PPQ #1) 2 006 1 002 (PPQ #2) < 0.5 007 1 003 (PPQ #3) < 0.5 008 < 0.5
AEX Eluate Bioburden Data
Lot Number Result (CFU/10mL) Lot Number Result (CFU/10mL) Engineering #1 4 004 0 Engineering #2 0 005 1 001 (PPQ #1) 1 006 2 002 (PPQ #2) 0 007 1 003 (PPQ #3) 0 008 0
Real Biologics Example – Data Analysis
• Neither eluate endotoxin or bioburden are subject to normal distribution since results are frequently at or near the Limit of Detection for the respective analytical methods.
• Data cannot be control-charted or subjected to Cpk, but they can be tabulated and subjectively assessed for observable trends.

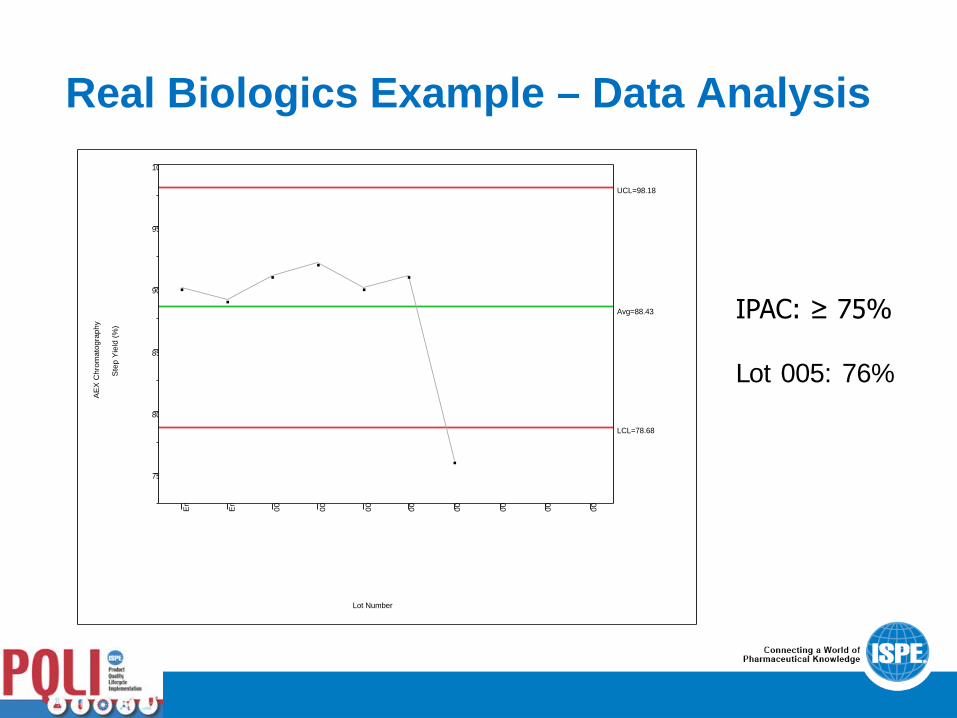
Real Biologics Example – Data Analysis • While step yield does not impact the defined Critical
Quality Attributes for this process, it is considered a performance indicator and important for maintenance of the validated state.
• As CPV data were collected and control-charted, a value was obtained for lot 005 that prompted an investigation. The control chart showed a clear out-of-control result, although the defined in-process acceptance criterion was met. This result was investigated to ensure that it wasn’t caused by an unknown source of process variability.
Real Biologics Example – Data Analysis
75
80
85
90
95
10
AE
X C
hrom
atog
raph
y
Ste
p Y
ield
(%)
En
En
001
002
003
004
005
006
007
008
Lot Number
Avg=88.43
LCL=78.68
UCL=98.18
IPAC: ≥ 75% Lot 005: 76%

Real Biologics Example – OOT Investigation • Lot 005 was investigated immediately to assess the out-of-control
limit result. While the step yield met the pre-defined in-process acceptance criterion of ≥ 75%, the result of 76% was below the calculated lower control limit.
• Upon investigation, it was determined that an operator had switched over to the waste fraction prematurely on the back side of the main peak collection (Target: 0.2 AU; Actual: 0.5 AU).
• Out-of-control value explained by operator error, resulting step yield value met the defined in-process acceptance criterion, and out-of-control result is not attributable to inherent process variability, so no impact to the validated state.
• Possible outcome (risk mitigation): implement automation to reduce likelihood of this failure mode

Real Biologics Example – Data Analysis
70
75
80
85
90
95
10
10
AE
X C
hrom
atog
raph
y
Ste
p Y
ield
(%)
En
En
001
002
003
004
005
006
007
008
Lot Number
Avg=89.30
LCL=76.89
UCL=101.71
IPAC: ≥ 75%

Real Biologics Example – Data Analysis
82
85
87
90
92
95
97
AEX
Chr
omat
ogra
phy
Elua
te P
urity
(%)
En
En
001
002
003
004
005
006
007
008
Lot Number
Avg=90.600
LCL=84.396
UCL=96.804
IPAC: ≥ 85%

Summary - Realized Benefits of CPV 1. Batch-by-batch data analysis (i.e., control charts
updated after every batch) enables real-time confidence in the validated state.
2. Trending (OOT result) triggered an investigation that may not otherwise have been performed, leading to a potential control strategy improvement.
3. CPV data package will become the basis for the Annual Product Review.


