32
Speakers: Dan Basile, Director, BlackRock Bryan White, CIO, BlackRock Alternative Advisors The New World of Retirement: Alternative Thinking for DC
| Date post: | 29-May-2019 |
| Category: |
Documents |
| Upload: | vuongtuyen |
| View: | 213 times |
| Download: | 0 times |

Speakers:
Dan Basile, Director, BlackRock
Bryan White, CIO, BlackRock Alternative Advisors
The New World of Retirement:Alternative Thinking for DC
Discussion Outline
For professional clients / qualified investors only
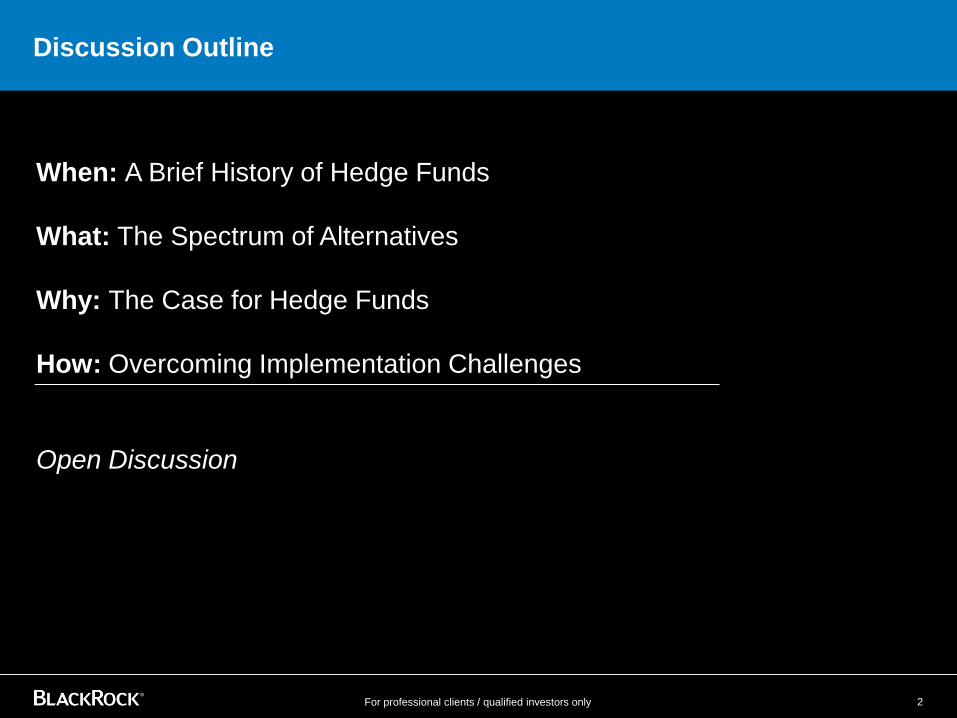
When: A Brief History of Hedge Funds
What: The Spectrum of Alternatives
Why: The Case for Hedge Funds
How: Overcoming Implementation Challenges
Open Discussion
2

When: A Brief History of Hedge Funds
What: The Spectrum of Alternatives
Why: The Case for Hedge Funds
How: Overcoming Implementation Challenges

Hedge Fund Origins
4For use with institutional and professional investors only — proprietary and confidential
When were hedge fund strategies first implemented?
1.600 BC: Thales’ purchase of options on olive presses?
2.1880s: Robber Baron’s distressed investment in bankrupt railroads?
3.1929: Ben Graham’s launch of his long-short fund with incentive fees?
4.1949: Alfred Wilfred Jones’ launch of market neutral multi-manager
funds?

Institutional Adoption of Hedge Funds
5For use with institutional and professional investors only — proprietary and confidential
Defined Benefit
(76%)
Percentages represent the portion of each type of investor (endowments, pensions, and defined contribution plans) with some portion of assets allocated to hedge funds as of the labeled dates.
1990 - Endowments
Source: McKinsey, CitiGroup, Barclays, BlackRock, (as of 1 Mar 2015)
2000 - Defined Benefit
2010s - Defined Contribution?
Early Adopters
Endowments (1990s)
• Duke
• Harvard
• Yale
Defined Benefit (2000s)
• Eli Lilly
• Eastman Kodak
• Weyerhaeuser
Defined Contribution (2010s?)
• Intel
• McKinsey
Endowment
(97%)
Early Adoption Broader Acceptance Maturation

Meaningful Hedge Fund Allocations Today
Source: Barclays Capital Solutions, Preqin January 2015.
Institutional Hedge Fund Allocations
6For use with institutional and professional investors only — proprietary and confidential
Percentages represent the average portfolio allocation to hedge funds for endowments & foundations and pension funds as of 12/31/2014.
24%
12%8%
0%
5%
10%
15%
20%
25%
Endowments &Foundations
Private Pension Public Pension

When: A Brief History of Hedge Funds
What: The Spectrum of Alternatives
Why: The Case for Hedge Funds
How: Overcoming Implementation Challenges

Not All Hedge Funds are Equal
Investments in a wide variety of investment strategies focused on inefficient sectors of the capital markets
Long/short, arbitrage and event strategies
Significant universe of managers (active HFs >8,000)
Bona fide
Hedge Funds
Marketable Alternatives
(Monthly to annual
liquidity)
Illiquid Alternatives
(Multi-year liquidity
profiles)
Private Equity
Private Real
Estate
Infrastructure
• Long equity and debt in private companies
• Venture capital and buy outs
• Long exposure to residential and commercial real estate
• Physical systems of a business or nation
Liquid Alternatives(Daily liquidity)
REITS
Commodities
Daily Valued
Hedge Fund
Investments
• 1940 Act hedge funds
• 130/30 funds
• Real Estate Investment Trust owns and often operates income producing real estate
• Long exposure to goods traded on commodity exchanges
Liquid Alternatives
(Daily liquidity)
REITS
Commodities
Daily Valued
Funds
1940 Act hedge funds
130/30 funds
Real Estate Investment Trust owns and often operates income producing real estate
Long exposure to goods traded on commodity exchanges
Private Equity
Private Real
Estate
Infrastructure
Long equity and debt in private companies
Venture capital and buy outs
Long exposure to residential and commercial real estate
Physical systems of a business or nation
8For use with institutional and professional investors only — proprietary and confidential

9For use with institutional and professional investors only — proprietary and confidential
Liquid vs. Marketable Alternatives
How does the size of the opportunity set of liquid alternatives
compare to traditional hedge funds (for those funds with 5-year track
records)?
1.About the same number
2.About ½
3.About 1/10th
4.About 1/75th

An Important Distinction
Source: Morningstar, BAA, HFR, Inc., Preqin Alternative Assets, SEC. As of July 2014
The Investment Universe (with 5-year track record) graphic shows the percentage of funds that were active in July 2014 and reporting historical performance under the intervals above.
Liquid Alternatives Traditional Hedge Funds
98.7%
1.3%
Investment Universe
with 5-year Track RecordAs of July 31, 2014
10For use with institutional and professional investors only — proprietary and confidential

A Big Difference in Results
Q-BLK Appreciation Composite Morningstar US Open End Liquid Alternatives Equally-Weighted Aggregate1
2.9%
7.5%
Liquid Alternative Composite
Traditional Hedge Fund Composite
Investment ReturnsFive years ended July 31, 2014
Source: Morningstar, BlackRock, Wilshire. The Wilshire Liquid Alternative IndexSM is unmanaged and used for illustrative purposes only and is not intended to be indicative of any fund’s performance. It is not
possible to invest directly in an index. Q-BLK Appreciation Composite is used as a proxy for Marketable Alternatives. See the definitions and disclosures appearing at the end of the document for source and other
information related to the Dispersion of Hedge Fund Strategies. There are significant differences between the S&P 500 Index and QAC. The S&P 500 Index is unmanaged and represents a fixed group of equity
securities. The figures for the index reflect the reinvestment of dividends but do not reflect the deduction of any fees or expenses. QAC does not invest in all or necessarily any of the securities that comprise the
index. In addition, QAC may have different and higher levels of risk, including through the use of leverage and concentrated positions, and volatility. Reference to the index does not imply similarities in returns,
volatility or other results between QAC and the index.1 Morningstar US Open End "liquid" alternatives Equally-Weighted Aggregate is composed of the entire Morningstar US Open End Alternatives universes
of managed futures, long/short equity, multialternative and market neutral disciplines. The returns are calculated as an equally-weighted average of the funds’ returns during the monthly period. Funds that do not
have at least 6 months of performance were not included. Past performance is not an indication of future results.
Double the return
Half the risk
Investment ReturnsFive years ended July 31, 2014
6.5%
2.7%
Liquid Alternative Composite
Traditional Hedge Fund Composite
Investment Risk (Standard Deviation)Five years ended July 31, 2014
Investment Risk (Standard Deviation)Five years ended July 31, 2014
11For use with institutional and professional investors only — proprietary and confidential

When: A Brief History of Hedge Funds
What: The Spectrum of Alternatives
Why: The Case for Hedge Funds
How: Overcoming Implementation Challenges

How Risky are Hedge Funds?
13For use with institutional and professional investors only — proprietary and confidential
A portfolio of hedge funds is approximately
of a portfolio of stocks.
1.Twice the risk
2.Equivalent the risk
3.Half the risk
4.One-third the risk

Protecting in Down Markets Can Help Participants Stay the Course
-4.0%
-3.0%
-2.0%
-1.0%
0.0%
1.0%
2.0%
3.0%
4.0%
Average monthly return during 148 positivemonths
Average monthly return during 82 negativemonths
BAA Equity
0.0%
-3.9%
3.4%
1.1%
19 years ended December 31, 2014. As of 1/1/2015
1 BAA refers to BAA’s Q-BLK Appreciation Composite (“QAC”) vs. S&P 500 Index and HFRI FoF Conservative Index. QAC is a proxy for BAA’s record investing in hedge funds, the S&P 500 is a proxy for
equity markets and the HFRI a proxy for FoFs. The underlying risks may differ substantially.
Past performance is not an indication of future results. The definitions and disclosures appearing at the end of this document are an integral part of this presentation and should be read in their entirety for a
complete understanding of the information contained herein.
Extremely low participation
in down equity markets
Portfolio of Hedge Funds vs. Equities1
14For use with institutional and professional investors only — proprietary and confidential

-0.09%
0.77%
-0.54%
-0.88%
-1.14%
Increasingly Difficult to Diversify with Traditional Assets
15For use with institutional and professional investors only — proprietary and confidential
Greatest risk reduction by adding a 10% allocation to
60% Equity / 40% Fixed Income portfolio
Calculated by replacing 10% of traditional equity allocation over a 10-year period.
International
Equities
Emerging
Markets Equities
Emerging
Markets Debt
Liquid
Alternatives
Traditional
Hedge Funds
Percentages represent the difference in standard deviation between a 60% equity and 40% fixed income allocated portfolio with a portfolio comprised of 10% of the relevant index, 50% equities and 40% fixed
income. The following indices were used: Traditional Equities: S&P 500 Index, US Fixed Income: Barclays U.S. Aggregate Index, International Equities: MSCI World Index (USD Hedged), Emerging Markets
Equities: MSCI Emerging Markets Index, Emerging Markets Debt: JP Morgan Emerging Markets Bond Index Plus, Liquid Alternatives: Wilshire Liquid Alternative Index, Traditional Hedge Funds: HFRI Hedge
Fund of Funds Conservative. Indexes are unmanaged and used for illustrative purposes only and are not intended to be indicative of any fund’s performance. It is not possible to invest directly in an index.

Traditional Asset Classes Face Headwinds
Fixed Income Interest Rates at Historic Low Levels Equity Markets Are at All Time Highs
16For use with institutional and professional investors only — proprietary and confidential
0
1
2
3
4
5
6
7
8
9
10
1/1
/19
90
1/1
/19
92
1/1
/19
94
1/1
/19
96
1/1
/19
98
1/1
/20
00
1/1
/20
02
1/1
/20
04
1/1
/20
06
1/1
/20
08
1/1
/20
10
1/1
/20
12
1/1
/20
14
Inte
res
t R
ate
(%
)
10-Year US Treasury Interest Rate
0
600
1,200
1,800
2,400
5/1
/90
5/1
/92
5/1
/94
5/1
/96
5/1
/98
5/1
/00
5/1
/02
5/1
/04
5/1
/06
5/1
/08
5/1
/10
5/1
/12
5/1
/14
S&P 500 Index Total Return
Pri
ce
Source: FRED Database. As of February 2015 Source: Bloomberg. As February 2015
When: A Brief History of Hedge Funds
What: The Spectrum of Alternatives
Why: The Case for Hedge Funds
How: Overcoming Implementation Challenges
Implementation Challenges
18For use with institutional and professional investors only — proprietary and confidential
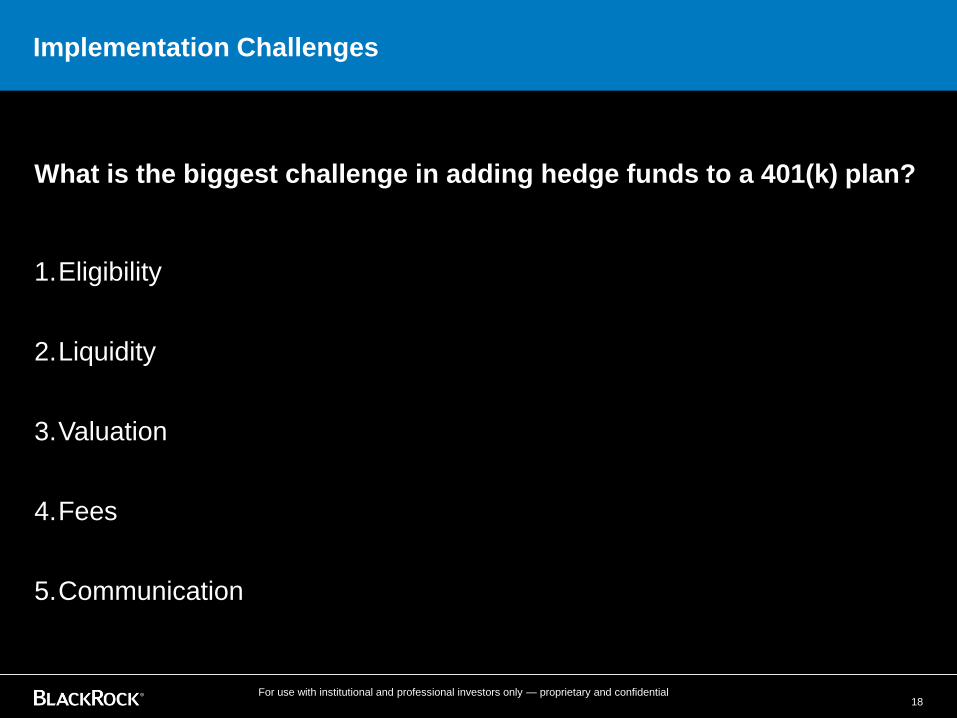
What is the biggest challenge in adding hedge funds to a 401(k) plan?
1.Eligibility
2.Liquidity
3.Valuation
4.Fees
5.Communication

Eligibility and “Private Fund” Restrictions
50%
30%20%
20%
Passive Fixed
Income
Passive
Equities
Diversified
Hedge
Funds
Among other requirements
Must reference “generic” investment strategy
Cannot allocate more than 50% to a single underlying fund
20%
25%30%
20%
Long/Short
Equity
Long/Short
Credit
Event Driven
Relative
Value
Direct Sourcing
5%
19For use with institutional and professional investors only — proprietary and confidential
The fund allocations are for illustrative purposes. The custom target date fund represents a target date fund with potential proposed allocations, including diversified hedge funds. The diversified
hedge fund is a visualization representation of a hedge fund portfolio with diversified discipline allocations.
The above is not definitive for all requirements related to private fund restrictions and nothing herein is intended to be construed as legal advice.
Custom Target Date Fund

Addressing Liquidity
50%
30%20%
20%
Passive Fixed
Income
Passive
Equities
Diversified
Hedge
Funds
Custom Target Date Fund
Modestly increased
tolerance bands
Consistent with Defined
Benefit, Endowments &
Foundations and other
institutional approaches
Liquidity sourced from equity and fixed income sleeves daily
Target Date Fund (“TDF”) rebalanced monthly
20For use with institutional and professional investors only — proprietary and confidential
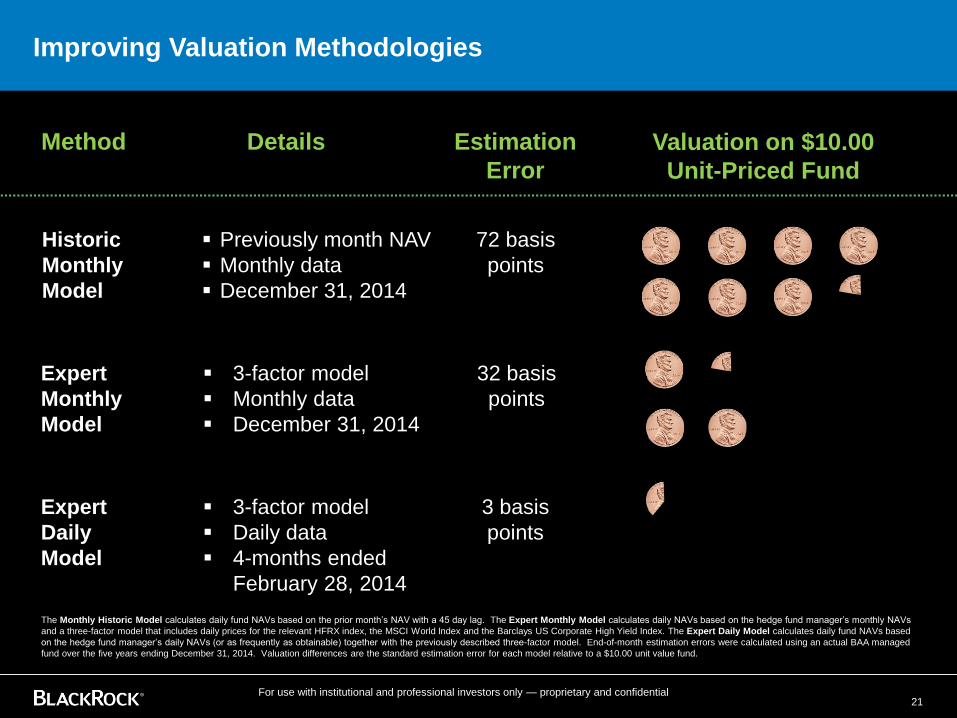
Improving Valuation Methodologies
Historic
Monthly
Model
Previously month NAV
Monthly data
December 31, 2014
72 basis
points
Expert
Monthly
Model
3-factor model
Monthly data
December 31, 2014
32 basis
points
Expert
Daily
Model
3-factor model
Daily data
4-months ended
February 28, 2014
3 basis
points
The Monthly Historic Model calculates daily fund NAVs based on the prior month’s NAV with a 45 day lag. The Expert Monthly Model calculates daily NAVs based on the hedge fund manager’s monthly NAVs
and a three-factor model that includes daily prices for the relevant HFRX index, the MSCI World Index and the Barclays US Corporate High Yield Index. The Expert Daily Model calculates daily fund NAVs based
on the hedge fund manager’s daily NAVs (or as frequently as obtainable) together with the previously described three-factor model. End-of-month estimation errors were calculated using an actual BAA managed
fund over the five years ending December 31, 2014. Valuation differences are the standard estimation error for each model relative to a $10.00 unit value fund.
21For use with institutional and professional investors only — proprietary and confidential
Method Details Estimation
Error
Valuation on $10.00
Unit-Priced Fund

Comparative Fees
50%
30% 20%
20%
Passive Fixed
Income
Diversified
Hedge
FundsPassive
Equities
Fees: 63 basis points
60%40%
Fees: 70 basis points
Active
Fixed Income
Active
Equities
22For use with institutional and professional investors only — proprietary and confidential
Average active TDF fees represent the average expense ratio (fees paid) across active TDF funds as of 1 March 2015. Source: Morningstar.
A fee calculation was conducted to estimate the custom target date funds fees. This does not represent a fund that is offered by BlackRock and does not guarantee a fee of any amount. The fee calculation
is a blended calculation based on the proposed custom target date allocations. The passive equity is based on an investment in BlackRock S&P 500 Stock Fund Institutional Shares. The passive fixed income
fee is based on an investment in BlackRock Bond Index Fund Institutional Shares. The diversified hedge fund fee is based on a representative composite of BlackRock Alternative Advisors’ (BAA's) core
appreciation strategy funds (weighted average of total fees paid across BAA's core appreciation strategy funds). The fees were combined based on the proposed allocations of 50% to passive equity, 30% to
passive fixed income and 20% to diversified hedge funds.
Representative Custom
TDFAverage Active TDF

Questions?

Implementing Alternatives
24For use with institutional and professional investors only — proprietary and confidential
Over what time horizon would you consider further evaluating the
merits of adding alternatives to your DC plan?
1. Over the next 12 months
2. In the next 1-2 years
3. Not for the foreseeable future

Appendix

0
1,000
2,000
3,000
4,000
5,000
6,000
7,000
8,000
9,000
$0
$500
$1,000
$1,500
$2,000
$2,500
$3,000
19
90
19
92
19
94
19
96
19
98
20
00
20
02
20
04
20
06
20
08
20
10
20
12
Q42
014
Estimated assets ($B) Number of hedge funds
Hedge Fund Universe
26For use with institutional and professional investors only — proprietary and confidential
The hedge fund universe has increased more than sevenfold in the
past twenty years
Given the proliferation of hedge funds, manager selection involves a
high level of devoted resources
Growth of the hedge fund industry, 1990 – Q4 20141 Comparison of market breadth1
1 Publicly Traded Stocks includes the S&P Global BMI (Broad Market Index), which is comprised of the S&P Developed BMI and the S&P Emerging BMI as of 12/31/2014. Hedge
Funds includes Source: HFR Global Hedge Fund Industry Report as of 4Q14.
BAA inception
11,474
8,377
0
2,000
4,000
6,000
8,000
10,000
12,000
Publicly Traded Stocks Hedge Funds

Strong Rationale for Including Alternative Investments in DC Plans
27For use with institutional and professional investors only — proprietary and confidential
2.6%
2.1% 2.1%
1.4%1.2%
0.9%
1.2%
0.7%
2.7%
(5.4)%
1.0%
3.0%
'00 '01 '02 '03 '04 '05 '06 '07 '08 '09 '10 '11
Average: 1.1% DB
outperformance per annum
Δ between DB and DC performance (DB less DC)
Source: Towers Watson. As of YE 2011
Difference in DB and DC asset allocation
Source: BNY Mellon. As of YE 2011.
DB Plans
DC Plans
US Eq
Dev Eq
EM Eq
US FI
Non US FI
Cash
REHF
PE
US Eq
Dev EqEM Eq
US FI
Non US FI
Cash TIPS Commodities RE
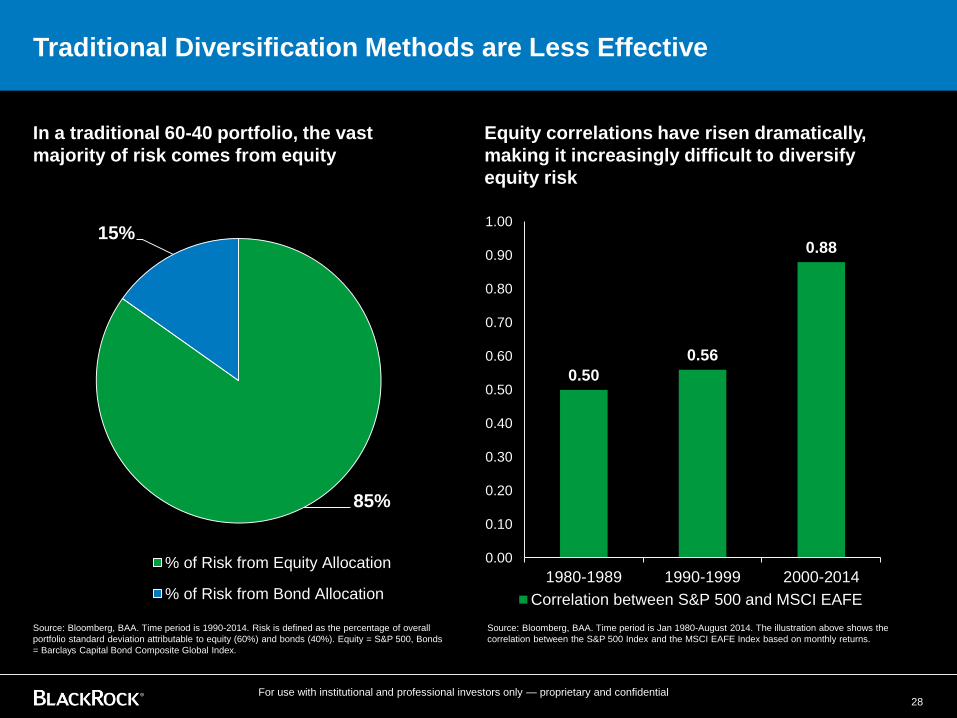
Traditional Diversification Methods are Less Effective
28For use with institutional and professional investors only — proprietary and confidential
In a traditional 60-40 portfolio, the vast
majority of risk comes from equity
85%
15%
% of Risk from Equity Allocation
% of Risk from Bond Allocation
Equity correlations have risen dramatically,
making it increasingly difficult to diversify
equity risk
0.50
0.56
0.88
0.00
0.10
0.20
0.30
0.40
0.50
0.60
0.70
0.80
0.90
1.00
1980-1989 1990-1999 2000-2014
Correlation between S&P 500 and MSCI EAFE
Source: Bloomberg, BAA. Time period is Jan 1980-August 2014. The illustration above shows the
correlation between the S&P 500 Index and the MSCI EAFE Index based on monthly returns.
Source: Bloomberg, BAA. Time period is 1990-2014. Risk is defined as the percentage of overall
portfolio standard deviation attributable to equity (60%) and bonds (40%). Equity = S&P 500, Bonds
= Barclays Capital Bond Composite Global Index.

Hedge Funds May Provide Superior Risk-adjusted Returns with
Low Beta
29For use with institutional and professional investors only — proprietary and confidential
(0.05)
-
0.05
0.10
0.15
0.20
0.25
0.30
0.35
0.40
0.45
0.50
19
98
20
00
20
02
20
04
20
06
20
08
20
10
20
12
20
14
Beta
to
S&
P 5
00 I
nd
ex
Beta of Q-BLK Appreciation Composite to the S&P 500
Average
3-year rolling risk-adjusted returns (Sharpe) 3-year rolling beta to the S&P 500 Index
Source: Bloomberg, BAA. As of the period 9/1998– 10/2014. The blue area denotes the differential
between the Sharpe ratio of Q-BLK Appreciation Composite and the S&P 500 Index.
Average Beta = 0.16
-2
-1
0
1
2
3
4
5
19
98
20
00
20
02
20
04
20
06
20
08
20
10
20
12
20
14
Sh
arp
e R
ati
o
Q-BLK Appreciation Composite S&P 500 Index
Source: Bloomberg, BAA. As of October 2014. Average denotes the average correlation of Q-
BLK Appreciation Composite to the S&P 500 Index over the period 9/1998 – 10/2014.

Important Information
Important Information
31For use with institutional and professional investors only — proprietary and confidential
This confidential document is for informational purposes only and does not constitute an offer to sell or a solicitation of an offer to buy any securities described herein. Potential investors are urged to consult a professional advisor
regarding the possible economic, tax, legal or other consequences of entering into any investments or transactions described herein. All investments risk the loss of capital and there is no guarantee or assurance that an investment in a
fund will achieve its investment objective. An investment in a fund is speculative and should form only part of a complete investment program, and an investor must be able to bear the loss of its entire investment. This discussion has
been prepared solely for the use of the intended recipient (the “Recipient”) and is not to be distributed, except to the Recipient’s professional experts for purposes of advising the Recipient, without the prior written consent of the
BlackRock Alternative Advisors business unit of BlackRock, Inc. (“BAA”). No recipient is permitted to use this information in any way that would violate the securities-related laws, rules or regulations of any jurisdiction.
The information contained herein is proprietary and confidential and may contain commercial or financial information, trade secrets and/or intellectual property of BAA and/or its affiliates (together with BAA,
“BlackRock”). If this information is provided to an entity or agency that has, or is subject to, open records or open meeting laws or similar or related laws, rules, regulations or policies that do or may permit
disclosure of any portion of this information to any person or entity other than the entity to which it was provided by BlackRock (collectively, “Sunshine Laws”), BlackRock hereby asserts any and all available
exemption, exception, procedures, rights to prior consultation or other protection from disclosure which may be available to it under the applicable Sunshine Laws.
Performance Record
QAC (net) performance numbers are net of the fees actually paid by the relevant class, with the exception of classes for which actual fees are calculated in non-USD, in which case a 1% management fee and 10% performance fee is applied to the USD
denominated gross performance (net of expenses) of the relevant class. QAC performance numbers are estimates calculated on an accrual basis during the accounting close process for funds in the Composite and are based on estimated returns
provided by each underlying fund manager. These calculations are based on estimated returns rather than final reported information in order to provide timely performance return information to investors. As a result, the performance numbers shown may
differ from performance numbers based on the final financial information for each underlying fund and adjustments are made prospectively unless the Investment Manager determines the difference was material. Estimated performance numbers are
particularly susceptible to inaccuracies during periods of market volatility or uncertainty, and additional information may become available subsequently that materially alters these estimates. The Composite is denominated in US dollars
and does not reflect currency hedging activities and related costs that would be applicable to non-USD denominated classes. Risk is computed as the annualized standard deviation of monthly returns. The Sharpe Ratio measures the return earned over
T-bills per unit of risk taken.
This performance information is an estimate that is subject to change and based in part on estimates received from the underlying funds’ administrator or investment advisor, in some cases using assumptions that may be complex and susceptible to
significant uncertainty, and may prove incorrect. Estimated valuations are particularly susceptible to inaccuracies during periods of market volatility or uncertainty, and additional information may become available subsequently which materially alters
assumptions or other inputs to the estimates. This may result in a material change to the Fund’s estimated reported net asset value and performance estimate. Should the net asset value materially change, the Fund will retroactively revise all capital
transactions of impacted investors as appropriate.
Minor variances in column, row and sectional totals are the result of rounding and have been allowed to maintain the integrity of the underlying financial data. Information relating to the Fund’s performance and its underlying managers’ qualifications,
strategy exposure or portfolio composition was prepared by BAA based on information believed to be reliable; however, no assurance of its completeness or accuracy can be made. In some cases, the Fund’s underlying managers may manage more than
one investment program. The performance information presented herein relates only to the described investment program. BlackRock also advises other portfolios whose historical risk/return characteristics may be significantly different.
Certain Risk Factors
Past results are not necessarily indicative of future results. Historically, funds of funds and hedge funds have produced gains and losses due to changes within the equity, interest rate, credit, currency, commodity and related
derivative markets. Additionally, gains and losses are impacted to varying degrees by investment acumen, market volatility, corporate activity, securities selections, regulatory oversight, trading volume and money flows. These
elements and/or their rate of change may not be present in the future, and thus future performance may be impacted. Any investment in a fund involves a high degree of risk. Investments in funds of funds and hedge funds can be
highly illiquid.
The performance of funds of hedge funds will depend on the performance of the underlying fund investments. There can be no assurance that a multi-manager approach will be successful or diversified, or that the collective
performance of underlying fund investments will be profitable. Underlying fund managers may be subject to limited regulation (or may not be registered with any regulatory body), may experience potential conflicts of interest with
respect to their management of allocated fund assets and from time to time, vis-à-vis other underlying managers, may take opposing positions with respect to particular securities or investments. The funds within a Fund will rely on
information provided to it by the underlying fund managers and there may be limited ability to confirm or verify such information.
Underlying fund managers may implement a variety of investment strategies and techniques, including short selling, leverage, hedging (such as derivatives, swaps, forwards, futures and options) and securities lending. Underlying fund
managers may invest in a wide array of investments, including non-US investments, non-US currencies, distressed assets, illiquid investments (such as those subject to legal or regulatory restrictions on transfer), and commodities and
futures, each of which may have diverse associated risks, including counterparty risk, credit risk and liquidity risk.
The secondary market for investments in the funds within a fund or its underlying fund investments is a recent development and as such may exhibit illiquidity, wide or non-existent bid-offer spreads, and brokerage charges. In addition,
there may be restrictions on transferring fund investments. A fund may be leveraged, which may increase the risk of investment loss, and its performance may be volatile. Funds of funds and hedge funds may involve complex tax
structures; therefore, there may be delays in distributing important tax information. Funds of funds and hedge funds are not subject to the same regulatory requirements as SEC registered funds or mutual funds and are not required to
provide periodic pricing or valuation information to investors. The funds within a fund and its underlying fund investments may have significant fees and expenses that would reduce returns.

Important Information
Indices
Index performance is taken from Bloomberg Financial Markets or the index’s proprietary website and is included for comparison only and, although useful for general observations, differences between the composition and construction
of such indices and a fund’s portfolio may limit their usefulness for direct comparisons. For example, it should be noted that hedge fund indices will vary, in some cases significantly, from the composition of a fund’s portfolio in terms of
the number of positions, types of hedge fund strategies included and distribution within such hedge fund strategies and other characteristics. Comparison of e’s results to indices that represent asset classes other than hedge funds or
funds of hedge funds are further limited by the significant inherent differences between such asset classes, for example in terms of risk/return, correlations and other characteristics. A fund may have higher levels of risk and volatility,
including through the use of leverage and concentrated positions. Moreover, index information may or may not reflect the deduction of fees and expenses (refer to specific definitions), which could further limit the comparative value of
such information relative to a fund. A fund might not invest in all or necessarily any of the securities that comprise any of the indices. Reference to the indices does not imply that a fund will achieve returns, volatility or other results
similar to such indices.
Characteristics of securities included within the indices are subject to change between rebalancing periods. These characteristics are applicable when securities are evaluated at rebalancing points but may be higher or lower during
interim periods. Additionally, index providers may have varying methodologies for measuring and implementing constituent changes and differing rebalancing periods.
Morningstar US Open End "liquid" alternatives Equally-Weighted Aggregate is composed of the entire Morningstar US Open End Alternatives universes of managed futures, long/short equity, multialternative and market neutral
disciplines. The returns are calculated as an equally-weighted average of the funds’ returns during the monthly period. Funds that do not have at least 6 months of performance were not included. Past performance is not an
indication of future results.
HFRI Fund Weighted Composite Index (“HFRI Fund Weighted Composite Index”) is an equal-weighted index representing investment funds focused on absolute return strategies. The index includes hedge funds tracked by
Hedge Fund Research, Inc. and is revised several times each month to reflect updated fund return information. For performance presented as of any given month, estimated values of underlying funds are used to build the index until
valuations are finalized (generally on a 5-month lag although the time period may vary). The index is a proxy for the performance of the universe of hedge funds focused on absolute return strategies. Returns are net of fees and are
denominated in USD. Source: Hedge Fund Research, Inc., © HFR, Inc. 15 March 2014, www.hedgefundresearch.com.
The Wilshire Liquid Alternative IndexSM is unmanaged and used for illustrative purposes only and is not intended to be indicative of any fund’s performance. It is not possible to invest directly in a index. Q-BLK Appreciation
Composite is used as a proxy for Marketable Alternatives. See the definitions and disclosures appearing at the end of the document for source and other information related to the Dispersion of Hedge Fund Strategies. Past
performance is not an indication of future results.
S&P 500 Total Return Index (“S&P 500 Index”) is a capital-weighted index that includes 500 stocks representing all major industries. Returns are denominated in USD and include dividends. The index is a proxy of the performance
of the broad US economy through changes in aggregate market value.Barclays Global Aggregate Index (“Barclays Global Aggregate”) is a market value-weighted index comprised of all nonconvertible fixed income securities with a minimum investment-grade of Baa3, at least one year to maturity, and a minimum
outstanding of USD 300 million. Mortgage-backed securities, asset-backed securities, and commercial mortgage-backed securities are included. Returns are denominated in USD. The index is a proxy for the performance of the broad global fixed income
market.
MSCI World Index (USD Hedged) (“MSCI World Index (USD Hedged)”) is a free float-adjusted market capitalization weighted index that is designed to measure the equity market performance of developed markets. Returns are denominated in and
hedged to USD and include dividends. Prior to June 2007, returns are the sum of the USD hedged price index and dividends. The index is a proxy for the performance of the world’s developed equity markets.
MSCI Emerging Markets Index (“MSCI Emerging Markets”) is a free float-adjusted market capitalization index that is designed to measure equity market performance of emerging markets. Returns are denominated in USD and include dividends.
The index is a proxy for global emerging markets.
JP Morgan Global EMBI Index (“JP Morgan Global EMBI Index”) is market value-weighted index that includes Brady Bonds, loans, Eurobonds and traded external debt instruments in emerging markets that have a minimum face value of $500 million.
The index serves as a proxy for emerging market debt.
32For use with institutional and professional investors only — proprietary and confidential


