22
The New World Order’s Perspective and Impact on the Global Market 1 September 2017 Anita Yadav Head of Fixed Income Research Emirates NBD
| Date post: | 01-Jul-2018 |
| Category: |
Documents |
| Upload: | hoangduong |
| View: | 222 times |
| Download: | 0 times |

The New World Order’s Perspective
and Impact on the Global Market
1September 2017
Anita YadavHead of Fixed Income Research
Emirates NBD

2
•An estimated four billion people live in cities, which is up by 23% on a decade
ago. In most of the global cities, supply is not keeping pace with demand for
both commercial and residential properties.
•Also continued technology innovation has increased the demand for business
hubs.
•As at 1Q this year, 490 million people reside in countries with negative interest
rates.
•Investment landscape has become volatile and therefore safe haven assets
are well bid.
•Beside oil prices, the factor that weighs on ME investor is the risk of the Trump
administration intervening in Syria, North Korea and Iran.
•Global real estate market peaked in 2015 and many cities now look over
valued.
Property Landscape
Emirates NBD, Global property guide

3
Flashback
Risks and uncertainty in 1H 2017….
Conservatives lose ground after snap election backfires….
Globally, the threat of a trade war becomes more real…
…. Weakening Brexit negotiating position.
• President Trump continued to accuse multiple countries of currency manipulation and unfair trade practices.
• FED raised interest rates twice (50 bps total), while BOC performed one hike (25bps).
• Despite market expectations, rhetoric from other central banks remains accommodating.
• Despite being regarded as a foregone conclusion, Prime Minister May’s snap election ended up in failure with the conservatives losing ground.
• This had a counter productive effect and weakened the UK’s Brexit negotiating position.
Emirates NBD, Bloomberg

The geopolitical environment remains unstable
4
5
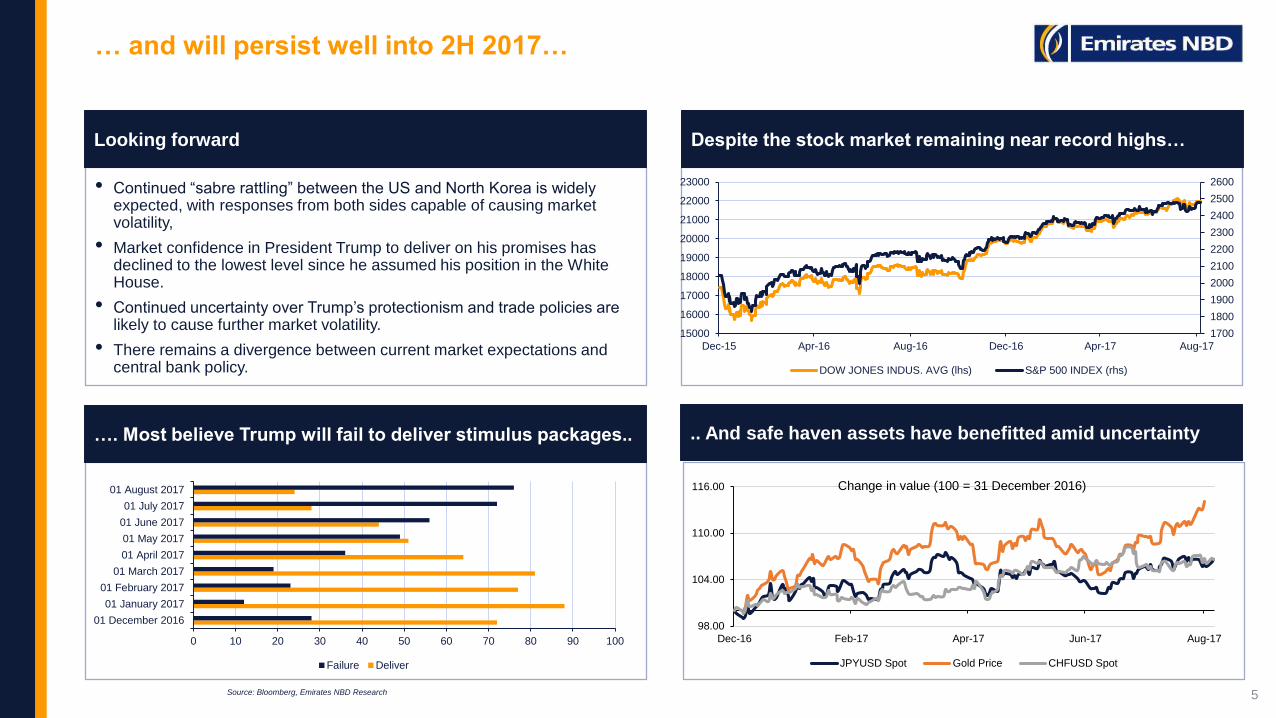
Looking forward
… and will persist well into 2H 2017…
• Continued “sabre rattling” between the US and North Korea is widely expected, with responses from both sides capable of causing market volatility,
• Market confidence in President Trump to deliver on his promises has declined to the lowest level since he assumed his position in the White House.
• Continued uncertainty over Trump’s protectionism and trade policies are likely to cause further market volatility.
• There remains a divergence between current market expectations and central bank policy.
…. Most believe Trump will fail to deliver stimulus packages..
Despite the stock market remaining near record highs…
.. And safe haven assets have benefitted amid uncertainty
Source: Bloomberg, Emirates NBD Research
0 10 20 30 40 50 60 70 80 90 100
01 December 2016
01 January 2017
01 February 2017
01 March 2017
01 April 2017
01 May 2017
01 June 2017
01 July 2017
01 August 2017
Failure Deliver
98.00
104.00
110.00
116.00
Dec-16 Feb-17 Apr-17 Jun-17 Aug-17
Change in value (100 = 31 December 2016)
JPYUSD Spot Gold Price CHFUSD Spot
1700
1800
1900
2000
2100
2200
2300
2400
2500
2600
15000
16000
17000
18000
19000
20000
21000
22000
23000
Dec-15 Apr-16 Aug-16 Dec-16 Apr-17 Aug-17
DOW JONES INDUS. AVG (lhs) S&P 500 INDEX (rhs)

6
• North Korean standoff continues to escalate
– Provocative rhetoric from all sides involved.
– Missile development and nuclear weapon tests continuing at unprecedented rate.
– Trump declaring “fire and fury” await further provocation.
• Brexit outcome continues to fog the horizon
– Snap UK general election backfired with the incumbent Conservative Party losing ground .
– Lack of progress with Brexit negotiations leaves much uncertainty.
– Labour party MPs likely to vote against the Repeal Bill at its second reading next week.
• Europe braces for populism
– 24 September: Germany election. Chancellor Angela Merkel’s CDU/CSU drops 0.5 pp to 36.5% with SPD also losing 0.5 pp to 23.5%, according to latest
poll commissioned by Bild newspaper (4th September 2017).
– 1 October: Catalan independence referendum.
– 20-21 October: Czech Republic election. Centre-left social democrats lagging in polls.
…as 2017 still has many risk events ahead.
7
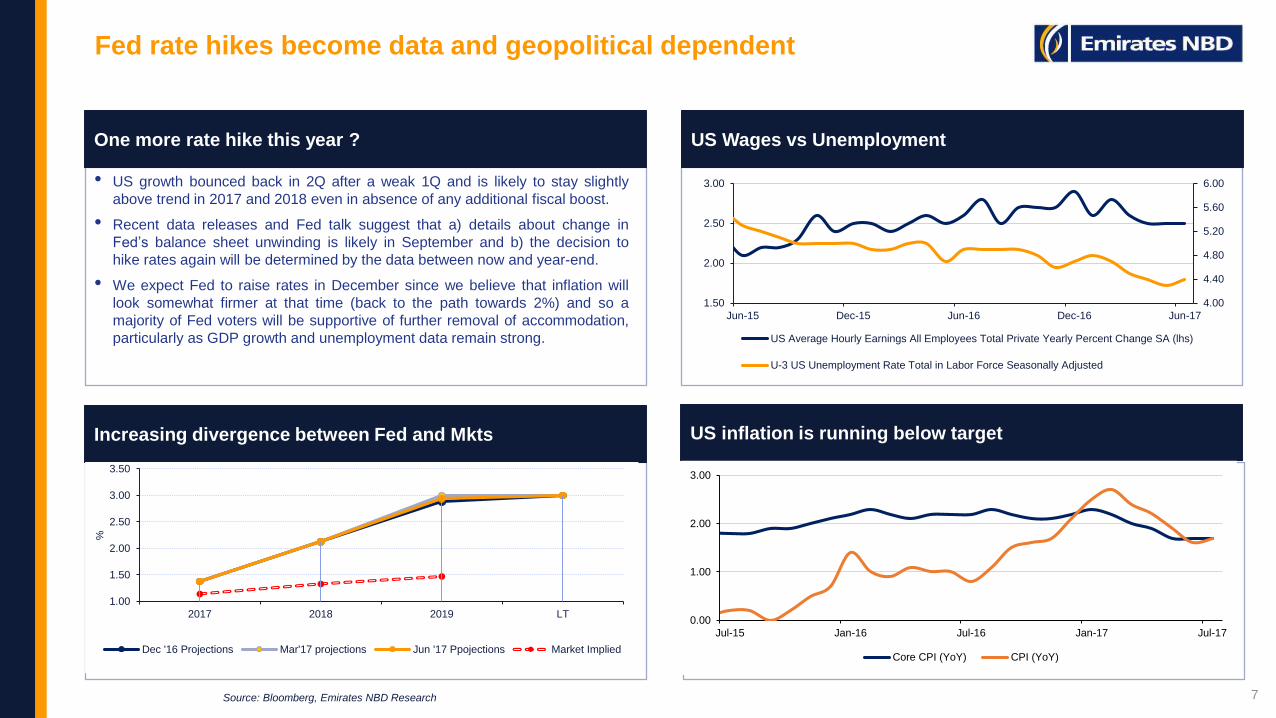
One more rate hike this year ?
Fed rate hikes become data and geopolitical dependent
• US growth bounced back in 2Q after a weak 1Q and is likely to stay slightly
above trend in 2017 and 2018 even in absence of any additional fiscal boost.
• Recent data releases and Fed talk suggest that a) details about change in
Fed’s balance sheet unwinding is likely in September and b) the decision to
hike rates again will be determined by the data between now and year-end.
• We expect Fed to raise rates in December since we believe that inflation will
look somewhat firmer at that time (back to the path towards 2%) and so a
majority of Fed voters will be supportive of further removal of accommodation,
particularly as GDP growth and unemployment data remain strong.
Increasing divergence between Fed and Mkts
US Wages vs Unemployment
US inflation is running below target
Source: Bloomberg, Emirates NBD Research
0.00
1.00
2.00
3.00
Jul-15 Jan-16 Jul-16 Jan-17 Jul-17
Core CPI (YoY) CPI (YoY)
4.00
4.40
4.80
5.20
5.60
6.00
1.50
2.00
2.50
3.00
Jun-15 Dec-15 Jun-16 Dec-16 Jun-17
US Average Hourly Earnings All Employees Total Private Yearly Percent Change SA (lhs)
U-3 US Unemployment Rate Total in Labor Force Seasonally Adjusted
1.00
1.50
2.00
2.50
3.00
3.50
2017 2018 2019 LT
%
Dec '16 Projections Mar'17 projections Jun '17 Ppojections Market Implied

8
Highlights
BoE and ECB stand unchanged
• In the UK, the currency-related inflation spike appears to have passed its peak
with July data showing drop in core inflation to 2.4% from 2.6% in May. GDP
growth also moderated from 2.0% in 1Q to 1.7% in 2Q. Softer data has given
breathing room to BoE and focus is now on Brexit process.
• The Eurozone’s economic growth is synchronised across the region with not
only the core doing well but also previously-struggling countries like Italy and
Portugal growing again. This in turn increases the likelihood that the ECB will
taper its asset purchases next year assuming no material negative impact on
growth from stronger currency. It is most likely to make this announcement in
October.
EUR appreciation lowers investor confidence
Eurozone inflation eases
UK real wages squeezed by higher prices
Source: Bloomberg, Emirates NBD Research Source: Bloomberg, Emirates NBD Research
Source: Bloomberg, Emirates NBD Research
-0.30
0.20
0.70
1.20
1.70
2.20
Jul-16 Oct-16 Jan-17 Apr-17 Jul-17
Eurozone CPI (YoY)
-1.0
0.0
1.0
2.0
3.0
4.0
Jun-13 Dec-13 Jun-14 Dec-14 Jun-15 Dec-15 Jun-16 Dec-16 Jun-17
UK CPI (y/y) Avg Weekly Earnings (3m, y/y)
1.00
1.05
1.10
1.15
1.20
0
20
40
60
80
100
Aug-16 Nov-16 Feb-17 May-17 Aug-17
ZEW Germany Assessment of Current Situation ZEW Germany Expectation of Economic Growth
ZEW Eurozone Expectation of Economic Growth EURUSD Spot (rhs)
9
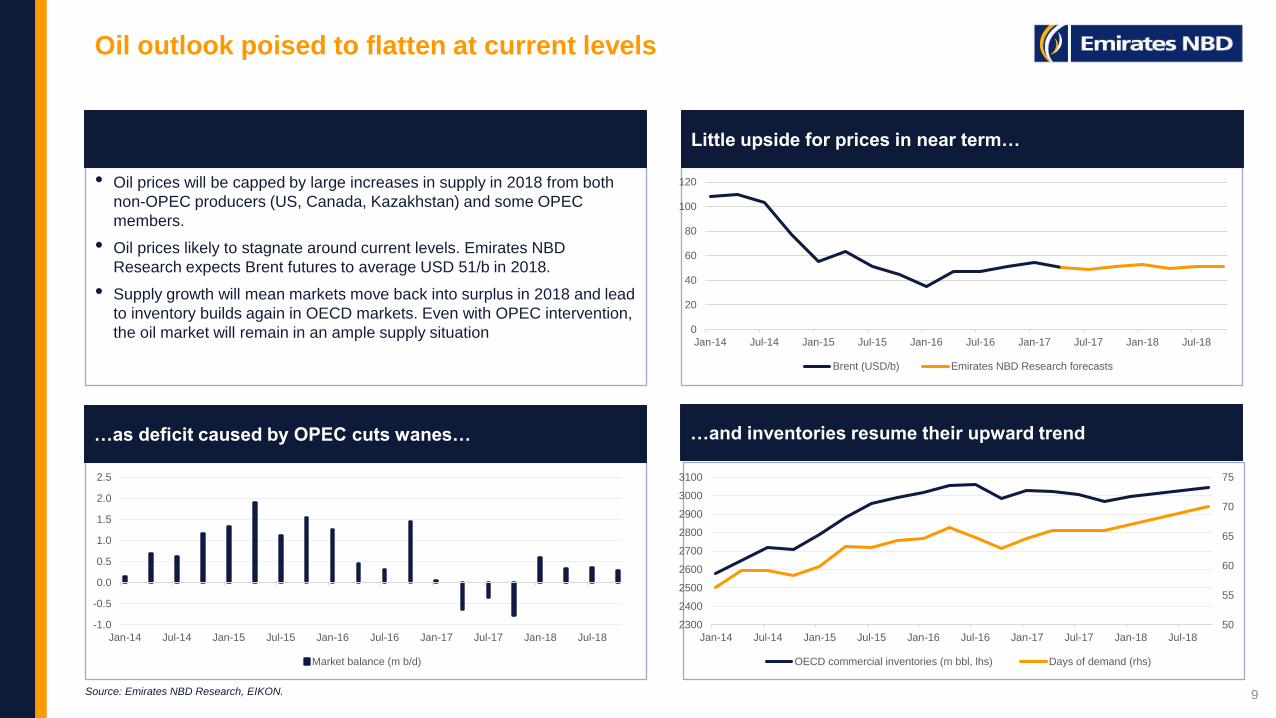
Oil outlook poised to flatten at current levels
• Oil prices will be capped by large increases in supply in 2018 from both
non-OPEC producers (US, Canada, Kazakhstan) and some OPEC
members.
• Oil prices likely to stagnate around current levels. Emirates NBD
Research expects Brent futures to average USD 51/b in 2018.
• Supply growth will mean markets move back into surplus in 2018 and lead
to inventory builds again in OECD markets. Even with OPEC intervention,
the oil market will remain in an ample supply situation
…as deficit caused by OPEC cuts wanes…
Little upside for prices in near term…
…and inventories resume their upward trend
Source: Emirates NBD Research, EIKON.
0
20
40
60
80
100
120
Jan-14 Jul-14 Jan-15 Jul-15 Jan-16 Jul-16 Jan-17 Jul-17 Jan-18 Jul-18
Brent (USD/b) Emirates NBD Research forecasts
-1.0
-0.5
0.0
0.5
1.0
1.5
2.0
2.5
Jan-14 Jul-14 Jan-15 Jul-15 Jan-16 Jul-16 Jan-17 Jul-17 Jan-18 Jul-18
Market balance (m b/d)
50
55
60
65
70
75
2300
2400
2500
2600
2700
2800
2900
3000
3100
Jan-14 Jul-14 Jan-15 Jul-15 Jan-16 Jul-16 Jan-17 Jul-17 Jan-18 Jul-18
OECD commercial inventories (m bbl, lhs) Days of demand (rhs)

10
Highlights
GCC Outlook: Growth to accelerate in 2018 on oil, infrastructure
GCC infrastructure projects by country, % of USD 1tn as of
August 2017
GCC real GDP growth (average)
Top 10 GCC projects (in execution), % of total
Source: MEED Projects, Emirates NBD Research Source : MEED Projects, Emirates NBD Research
• Headline GDP growth across the GCC is expected to slow in 2017,
largely on the back of OPEC production cuts. These are have been
extended through Q1 2018. However, from Q2 2018 we expect oil
production to recover in the GCC oil exporting countries, supporting
faster overall GDP growth
• Non-oil sector growth is also likely to accelerate in 2018, supported by
infrastructure and other investment.
• The total value of GCC projects (either in planning, execution and on
hold) reached USD 2tn in H1 2017. More than 50% of this is channeled in
infrastructure with UAE accounting for roughly half of total GCC spending
in the sector. Source: Bloomberg, Emirates NBD Research
3.2
3.8
2.3
1.1
2.8
1.0
1.5
2.0
2.5
3.0
3.5
4.0
2014 2015 2016e 2017f 2018f
% y
/y
Dubailand18.9%
King Abdullah Economic City (KAEC) - SA
17.7%Housing Project - SA
16.7%
Capital District11.1%
Jeddah Economic City -SA8.3%
Mohammed Bin Rashid (MBR) City7.5%
Lusail Development -Qatar5.3%
Duqm New Town -Oman5.0%
Yas Island Development
4.8%
Mecca Gate - SA4.7%
UAE46.7%
Saudi Arabia31.8%
Qatar6.7%
Kuwait6.6%
Oman5.1%
Bahrain3.1%

11
Highlights
Saudi Arabia: Extended OPEC cuts mean lower growth
Saudi PMI signals faster non oil growth
Oil output to remain lower in H2 2017
Monthly change in SAMA’s net foreign assets
Source: Haver Analytics, Emirates NBD Research
• We have revised our 2017 GDP growth forecast down to 0.5% as OPEC cuts have been
extended through Q1 2018. Growth is expected to accelerate to 2.5% in 2018 as oil output
rises next year.
• PMI data shows the non-oil sector has expanded at a faster rate ytd 2017 compared with the
same period in 2016.
• SAMAs net foreign assets have declined by nearly -USD 42bn in the year to July, signaling a
deficit in the Balance of Payments, despite higher oil prices and a successful sukuk issue.
BoP data for Q1 2017 shows a large negative ‘net errors and omissions’ figure, pointing to
capital flight.
• The Finance Ministry resumed domestic debt issuance from July.
Source: Bloomberg, Emirates NBD Research
-16.0
-14.0
-12.0
-10.0
-8.0
-6.0
-4.0
-2.0
0.0
2.0
4.0
Jan-16 Apr-16 Jul-16 Oct-16 Jan-17 Apr-17 Jul-17
US
D b
n
47
49
51
53
55
57
59
61
63
65
Jan-16 Apr-16 Jul-16 Oct-16 Jan-17 Apr-17 Jul-17
Headline KSA PMI New Orders Employment
9.4
9.6
9.8
10.0
10.2
10.4
10.6
10.8
Jan-16 Apr-16 Jul-16 Oct-16 Jan-17 Apr-17 Jul-17
mn b
/d
Saudi Arabia oil output KSA production target

12
Highlights
UAE: Growth should rebound in 2018
UAE bank loan and deposit growth
Oil output still a touch above agreed limit
UAE PMI shows faster non-oil growth
Source : Haver Analytics, Emirates NBD Research Source : Bloomberg, Emirates NBD Research
• GDP growth of 3% in 2016 exactly in line with our forecast. Key drivers
were oil & gas (3.8% y/y), transport & storage (7.4% y/y), manufacturing
(6.0% y/y) and construction (3.0% y/y).
• Oil production finally fell to the target agreed with OPEC in May but has
increased slightly since then. We have assumed full compliance in H2
2017 and Q1 2018, but expect oil production to rise through the rest of
2018. We forecast 2.0% GDP growth in 2017, rising to 3.4% in 2018.
• Non-oil sector growth remains robust, with PMI averaging 55.9 in Jan-
Aug, up from 53.8 in the same period 2016. However, employment
growth remains weak as firms’ margins remain under pressure.
Source: Bloomberg, Emirates NBD Research
2.4
2.6
2.8
3.0
3.2
Jan-16 Apr-16 Jul-16 Oct-16 Jan-17 Apr-17 Jul-17
mn b
/d
UAE oil output UAE production target
50
52
54
56
58
60
62
64
66
68
70
Jan-15 Jun-15 Nov-15 Apr-16 Sep-16 Feb-17 Jul-17
Output New Orders Employment
0
2
4
6
8
10
12
Jan-15 Jul-15 Jan-16 Jul-16 Jan-17 Jul-17
% y
/y
Loans and Advances Bank deposits
13
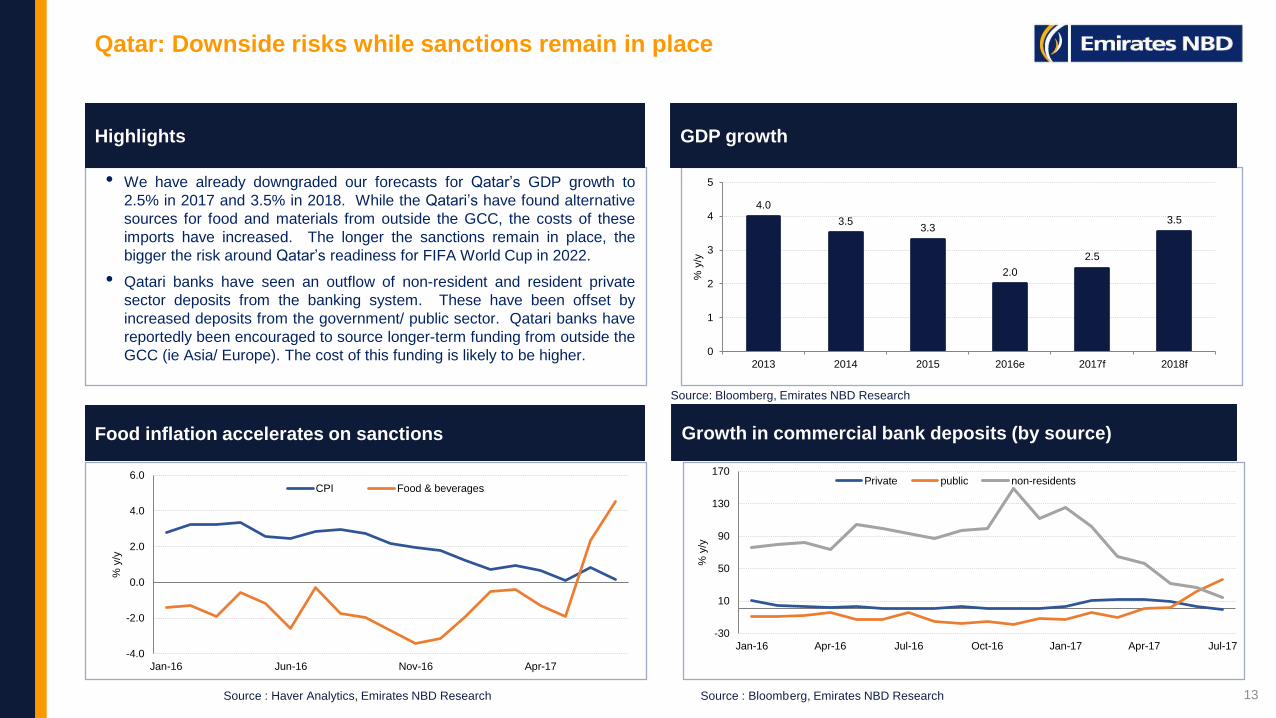
Highlights
Qatar: Downside risks while sanctions remain in place
Food inflation accelerates on sanctions
GDP growth
Growth in commercial bank deposits (by source)
Source : Haver Analytics, Emirates NBD Research Source : Bloomberg, Emirates NBD Research
• We have already downgraded our forecasts for Qatar’s GDP growth to
2.5% in 2017 and 3.5% in 2018. While the Qatari’s have found alternative
sources for food and materials from outside the GCC, the costs of these
imports have increased. The longer the sanctions remain in place, the
bigger the risk around Qatar’s readiness for FIFA World Cup in 2022.
• Qatari banks have seen an outflow of non-resident and resident private
sector deposits from the banking system. These have been offset by
increased deposits from the government/ public sector. Qatari banks have
reportedly been encouraged to source longer-term funding from outside the
GCC (ie Asia/ Europe). The cost of this funding is likely to be higher.
Source: Bloomberg, Emirates NBD Research
4.0
3.53.3
2.0
2.5
3.5
0
1
2
3
4
5
2013 2014 2015 2016e 2017f 2018f
% y
/y
-4.0
-2.0
0.0
2.0
4.0
6.0
Jan-16 Jun-16 Nov-16 Apr-17
% y
/y
CPI Food & beverages
-30
10
50
90
130
170
Jan-16 Apr-16 Jul-16 Oct-16 Jan-17 Apr-17 Jul-17
% y
/y
Private public non-residents

14
Highlights
Egypt
Egyptian Pound
FX Reserves
Source : IHS Markit, Emirates NBD Research Source : Haver Analytics, Emirates NBD Research
• IMF has disbursement a total of USD 4bn to date. IMF program has underpinned
fiscal and other reforms including subsidy cuts, VAT, fx devaluation. This,
together with high interest rates have attracted significant foreign portfolio
inflows.
• Headline PMI rose to 48.9 in August, its highest reading in over a year. While the
index still shows deteriorating conditions in the non-oil economy, the severity of
the contraction has eased significantly since Q4 2016.
• Inflation remains high at 33% y/y in July on weaker EGP and higher energy,
utility costs, but should ease in 2018 off a high base. .
Source: Bloomberg, Emirates NBD Research
Egypt Purchasing Managers’ Index
35.0
40.0
45.0
50.0
55.0
60.0
Jan-16 Apr-16 Jul-16 Oct-16 Jan-17 Apr-17 Jul-17
PMI Index New Export Orders
6.0
8.0
10.0
12.0
14.0
16.0
18.0
20.0
Jan-16 Apr-16 Jul-16 Oct-16 Jan-17 Apr-17 Jul-17
5
10
15
20
25
30
35
Jan-11 Jul-12 Jan-14 Jul-15 Jan-17
US
D b
n
15
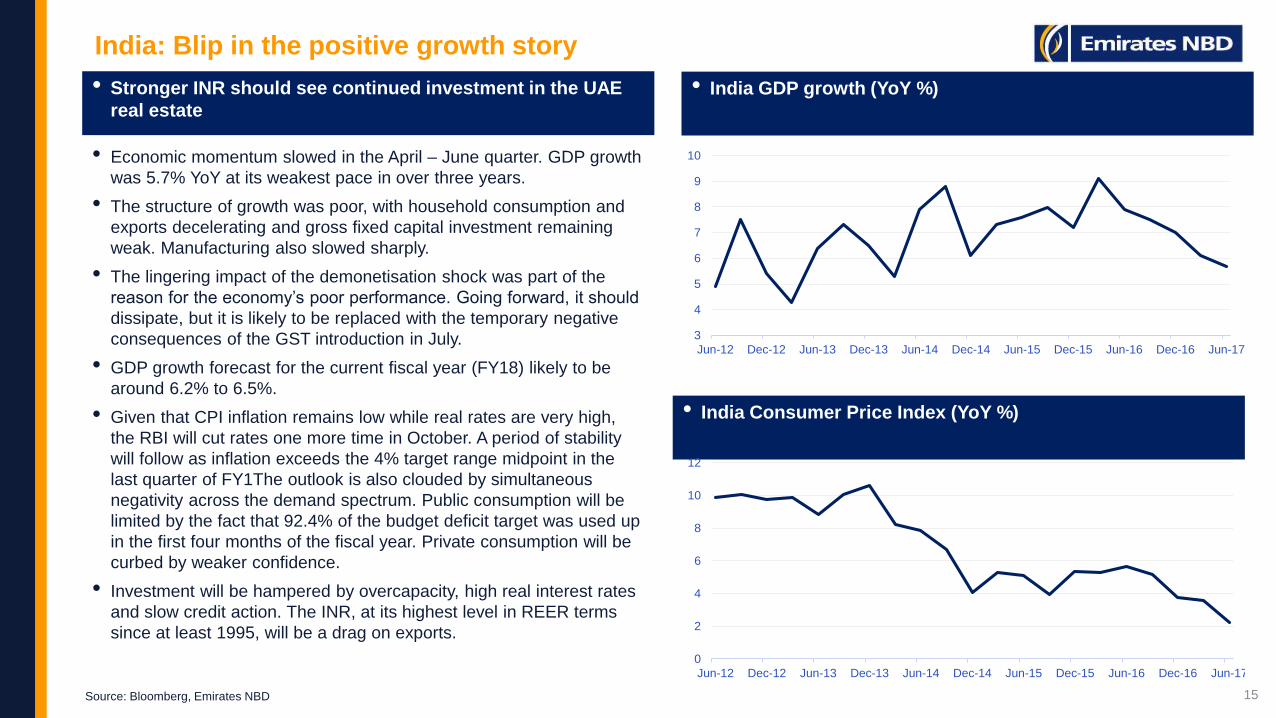
• Economic momentum slowed in the April – June quarter. GDP growth
was 5.7% YoY at its weakest pace in over three years.
• The structure of growth was poor, with household consumption and
exports decelerating and gross fixed capital investment remaining
weak. Manufacturing also slowed sharply.
• The lingering impact of the demonetisation shock was part of the
reason for the economy’s poor performance. Going forward, it should
dissipate, but it is likely to be replaced with the temporary negative
consequences of the GST introduction in July.
• GDP growth forecast for the current fiscal year (FY18) likely to be
around 6.2% to 6.5%.
• Given that CPI inflation remains low while real rates are very high,
the RBI will cut rates one more time in October. A period of stability
will follow as inflation exceeds the 4% target range midpoint in the
last quarter of FY1The outlook is also clouded by simultaneous
negativity across the demand spectrum. Public consumption will be
limited by the fact that 92.4% of the budget deficit target was used up
in the first four months of the fiscal year. Private consumption will be
curbed by weaker confidence.
• Investment will be hampered by overcapacity, high real interest rates
and slow credit action. The INR, at its highest level in REER terms
since at least 1995, will be a drag on exports.
India: Blip in the positive growth story
Source: Bloomberg, Emirates NBD
• India GDP growth (YoY %)
• India Consumer Price Index (YoY %)
3
4
5
6
7
8
9
10
Jun-12 Dec-12 Jun-13 Dec-13 Jun-14 Dec-14 Jun-15 Dec-15 Jun-16 Dec-16 Jun-17
0
2
4
6
8
10
12
Jun-12 Dec-12 Jun-13 Dec-13 Jun-14 Dec-14 Jun-15 Dec-15 Jun-16 Dec-16 Jun-17
• Stronger INR should see continued investment in the UAE
real estate

16
Interest Rates impact Real estate
Bloomberg
0
1
2
3
4
5
6
7
0
50
100
150
200
250
300
350
400
DJUSRE Index (R1) FDTRMID Index (L1)

17
UAE: Lending to Construction and Real Estate
Source: Phidar Advisory, UAECB
204.4
212.6
235.0
264.7 267.0
-40
-20
0
20
40
60
80
50
100
150
200
250
300
2013 2014 2015 2016 Q1 2017
Construction and Real Estate, AED bn (LHS) Construction and Real Estate, y/y growth (RHS)
y/y growthAED bn

18
Dubai apt prices (per sqft)
Global house prices
Euro area House Price Index
US House Price Index
UK House Price Index
Bloomberg, Emirates NBD
300
310
320
330
340
350
360
370
380
390
400
94
96
98
100
102
104
106
Mar-12 Sep-12 Mar-13 Sep-13 Mar-14 Sep-14 Mar-15 Sep-15 Mar-16 Sep-16 Mar-17
300
320
340
360
380
400
420
440
500.0
800.0
1100.0
1400.0
1700.0
2000.0
Q1
Q2
Q3
Q4
Q1
Q2
Q3
Q4
Q1
Q2
Q3
Q4
Q1
Q2
Q3
Q4
Q1
Q2
Q3
Q4
Q1
Q2
Q3
Q4
Q1
Q2
Q3
Q4
Q1
Q2
Q3
Q4
Q1
Q2
Q3
Q4
Q1
Q2
2008 2009 2010 2011 2012 2013 2014 2015 2016 2017

19
Investment in Dubai Real Estate, USD bn.
Bloomberg, Emirates NBD, JLL
7.1
5.4
4.4
2.72.5 2.4
2.2
10.1
5.7
3.3 3.3
1.6
2.2
1.6
1.2
5.9
0
2
4
6
8
10
12
UAE Indian Non-GCC UK Saudi Arabian Other GCCMENA
Pakistani Rest
2015 2016

20
Dubai Real Estate Investment by Nationality
Bloomberg, JLL
UAE24.6%
India13.4%
Saudi Arabia8.2%
UK5.9%Pakistan
4.6%
Jordan2.8%
Egypt2.7%
China2.1%
USA1.9%
Lebanon1.8%
Rest32.0%

Phidar 9/5 House Price index
Dubai: Softness in residential real estate prices continues in Jan-Aug 2017
with apartment prices faring better than villas
Rents declined at a slower rate
With transaction volumes easing (9/5 Index)
While yields remain high in August 2017
Source: Phidar Advisory, Emirates NBD Research
-18
-15
-12
-9
-6
-3
0
3
6
Jan-15 Jun-15 Nov-15 Apr-16 Sep-16 Feb-17 Jul-17
% y
/y
Apartments Villas
-13
-11
-9
-7
-5
-3
-12
-10
-8
-6
-4
-2
0
2
Jan-15 Jun-15 Nov-15 Apr-16 Sep-16 Feb-17 Jul-17
% y
/y
Apartments (LHS) Villas (RHS)
4.0
4.2
4.4
4.6
4.8
5.0
5.2
5.4
6.4
6.8
7.2
7.6
8.0
8.4
Jan-15 Jun-15 Nov-15 Apr-16 Sep-16 Feb-17 Jul-17
Apts Yields (LHS) Villas Yields (RHS)%
0
20
40
60
80
100
120
140
0
100
200
300
400
500
600
Jan-14 Aug-14 Mar-15 Oct-15 May-16 Dec-16 Jul-17
Apartments (LHS) Villas (RHS)
DisclaimerThe material in this presentation is general background information about Emirates NBD's activities current at the date of the presentation. It is information given
in summary form and does not purport to be complete. It is not intended to be relied upon as advice to investors or potential investors and does not take in to
account the investment objectives, financial situation or needs of any particular investor. These should be considered, with or without professional advice when
deciding if an investment is appropriate.
The information contained here in has been prepared by Emirates NBD. Some of the information relied on by Emirates NBD is obtained from sources believed to
be reliable but does not guarantee its accuracy or completeness.
Forward Looking StatementsIt is possible that this presentation could or may contain forward-looking statements that are based on current expectations or beliefs, as well as assumptions
about future events. These forward-looking statements can be identified by the fact that they do not relate only to historical or current facts. Forward-looking
statements often use words such as anticipate, target, expect, estimate, intend, plan, goal, believe, will, may, should, would, could or other words of similar
meaning. Undue reliance should not be placed on any such statements because, by their very nature, they are subject to known and unknown risks and
uncertainties and can be affected by other factors that could cause actual results, and the Group’s plans and objectives, to differ materially from those expressed
or implied in the forward-looking statements.
There are several factors which could cause actual results to differ materially from those expressed or implied in forward looking statements. Among the factors
that could cause actual results to differ materially from those described in the forward-looking statements are changes in the global, political, economic, business,
competitive, market and regulatory forces, future exchange and interest rates, changes in tax rates and future business combinations or dispositions.
Emirates NBD undertakes no obligation to revise or update any forward looking statement contained within this presentation, regardless of whether those
statements are affected as a result of new information, future events or otherwise.
Important Information
22


