GIVING GRADED RECOMMENDATIONS – CHALLENGES AND SOLUTIONS The New York Academy of Medicine Teaching Evidence Assimilation for Collaborative Healthcare New York, August 8, 2013 Yngve Falck-Ytter, MD, AGAF for the GRADE team Associate Professor, Case Western Reserve University, Case & VA Medical Center Chief, Gastroenterology & Hepatology, VA Medical Center, Cleveland 1
Transcript
GIVING GRADED RECOMMENDATIONS –
CHALLENGES AND SOLUTIONS The New York Academy of Medicine
Teaching Evidence Assimilation for Collaborative Healthcare
New York, August 8, 2013
Yngve Falck-Ytter, MD, AGAF for the GRADE teamAssociate Professor, Case Western Reserve University, Case & VA
Medical CenterChief, Gastroenterology & Hepatology, VA Medical Center,
Cleveland
1
How did we make clinical decision?
If the basis was not evidence – what was it? Expert recommendations
2
Institute of Medicine
March 2011 report: “Clinical Practice Guidelines We Can Trust”1. Establishing transparency2. Management of conflict of interest3. Guideline development group
composition4. Evidence based on systematic reviews5. Method for rating strength of
recommendations6. Articulation of recommendations7. External review8. Updating
3
Quality of CPG based on IOM criteria
169 oncology CPGs evaluated (2005-2010)
60% published after 2007
Not a single CPG met all 8 IOM criteria
4Reams et al. Journal of Clinical Oncology 2013
Quality of CPG based on IOM criteria
5
2. C
OI
1. T
rans
pare
ncy
3. G
roup
com
posi
tion
4. B
ased
on
SR
5. R
atin
g re
cs
7. E
xt.
revi
ew
8. U
pdat
ing
6. W
ordi
ng
6
Before GRADE
Level of evidence
I
II
III
IV
V
Source of evidence
SR, RCTs
Cohort studies
Case-control studies
Case series
Expert opinion
A
Grades of recomend.
B
C
D
7
Before GRADE
Level of evidence
Ia
Ib
II
III
IV
V
Source of evidence
Meta-analysis
RCTs
Cohort studies
Case-control studies
Case series
Expert opinion
A
Grades of recomend.
B
C
D
So what is quality of evidence?
Confidence in evidence Confidence in the evidence of benefits Confidence in the evidence of downsides Confidence in the evidence in the
balance
Recognizing that not all outcomes are equal
8
Importance of outcomes
9
Intermediate outcomesPositive hepatitis B core antibody
Amnestic response to re-challenge
Loss of protective surface antibody
Question (PICO)
Should health care worker receive booster vaccination vs. not?
Final health outcomesMortalityLiver cancerLiver cirrhosis
Chronic hepatitis B infection
Acute symptom. infection
I B II V III
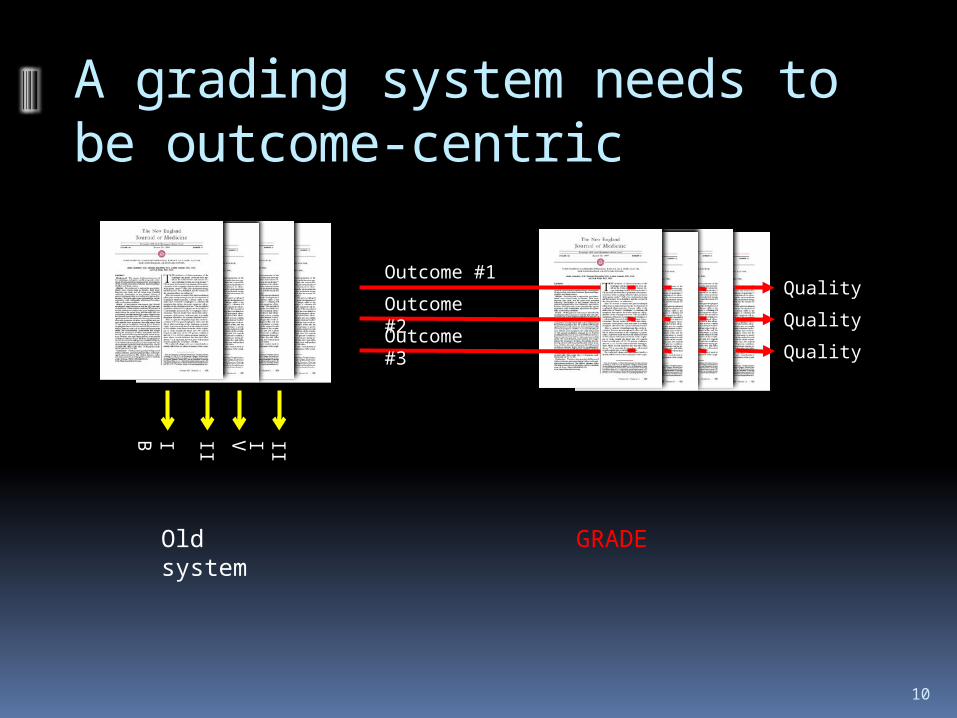
A grading system needs to be outcome-centric
Quality
Quality
Quality
Old system
Outcome #1Outcome #2Outcome #3
GRADE
10
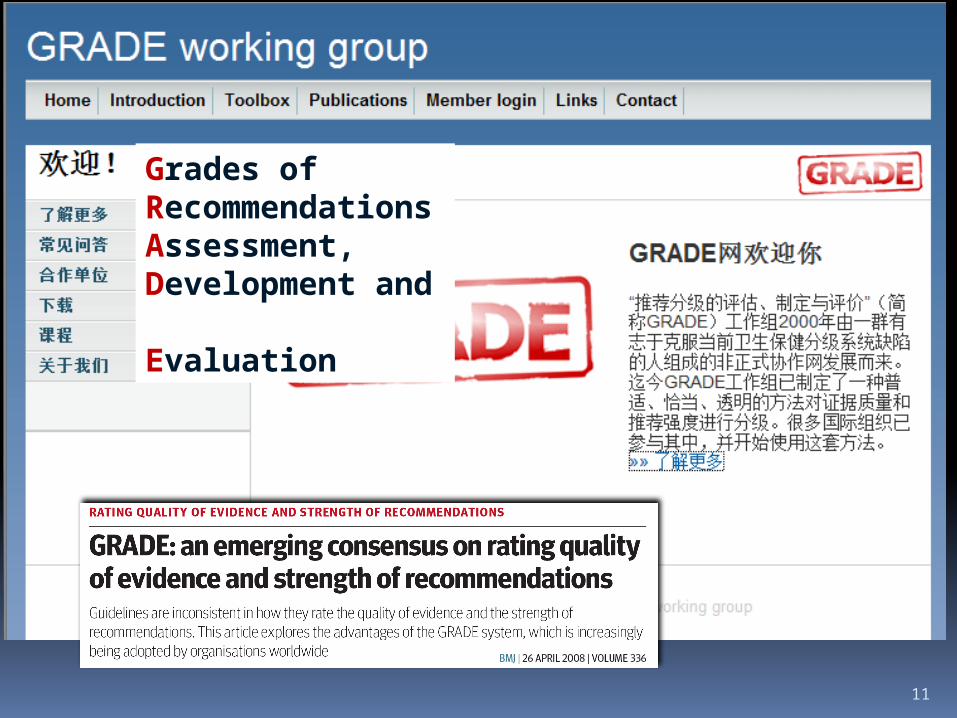
Grades of Recommendations Assessment, Development and Evaluation
Where GRADE fits inPrioritize problems, establish panel
Find/appraise or prepare: Systematic review
Searches, selection of studies, data collection and analysis
(Re-) Assess the relative importance of outcomes
Prepare evidence profile: Quality of evidence for each outcome and summary
of findingsGuidelines: Assess overall quality of evidence
Decide direction and strength of recommendation
Draft guideline
Consult with stakeholders and / or external peer reviewer
Disseminate guideline
Implement the guideline and evaluate
GR
AD
E
13
GRADE expands quality of evidence determinants
Methodological limitations
Inconsistency of results
14
Risk of bias
Allocation concealment
Failure of blinding
Losses to follow-up
Incomplete reporting Indirectness
of evidence
Imprecision of results
Publication bias
15
GRADE: Quality of evidence
Although quality of evidence is a continuum, we suggest using 4 categories:
High Moderate Low Very low
For guidelines: The extent to which our confidence in an estimate of the treatment effect is adequate to support a particular recommendation.
Determinants of quality
RCTs start high
Observational studies start low
16
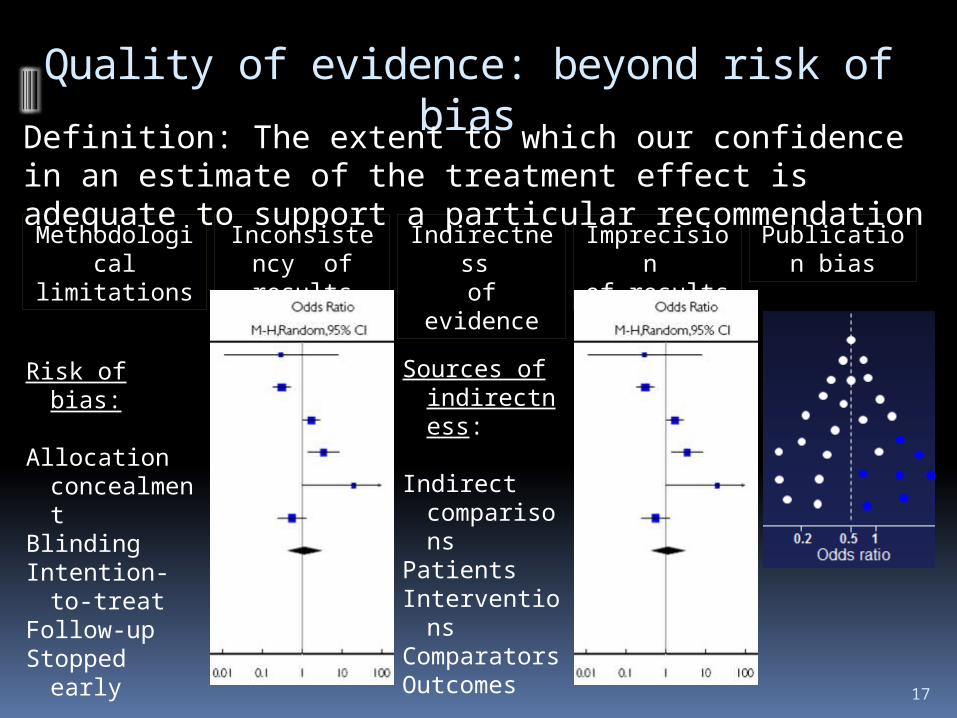
Quality of evidence: beyond risk of biasDefinition: The extent to which our confidence in an
estimate of the treatment effect is adequate to support a particular recommendationMethodological
limitationsInconsistency
of resultsIndirectness of evidence
Imprecision of results
Publication bias
Risk of bias:
Allocation concealment
BlindingIntention-to-treatFollow-upStopped early
Sources of indirectness:
Indirect comparisons
PatientsInterventionsComparatorsOutcomes
17
18
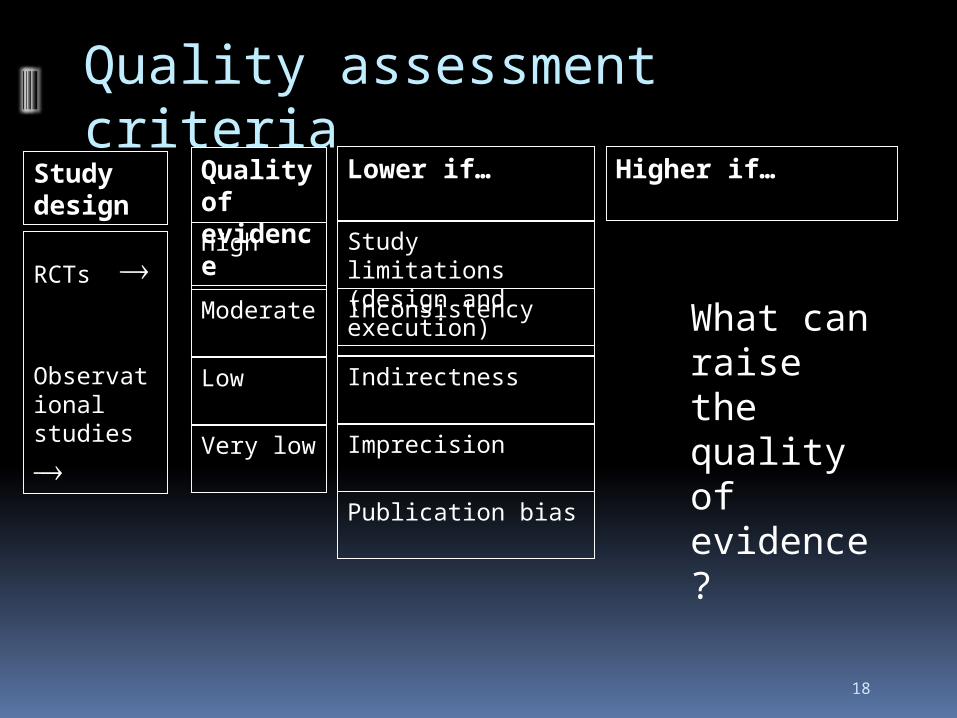
Quality assessment criteria
Lower if…Quality of evidence
High
Moderate
Low
Very low
Study limitations(design and execution)
Inconsistency
Indirectness
Imprecision
Publication bias
Higher if…
What can raise the quality of evidence?
Study design
RCTs
Observational
studies
BMJ 2003;327:1459–61 19
2020
Question to the audience
A. High B. Moderate C. LowD. Very low
You review all colonoscopies for average risk colon cancer screening in your health system and document a percentage of patient who developed a perforation after the procedure (evidence of free air on imaging). No comparison group without colonoscopy available. Rate the quality of evidence for the outcome perforation:
21
22
Quality assessment criteria
Lower if…Quality of evidence
High
Moderate
Low
Very low
Study limitations(design and execution)
Inconsistency
Indirectness
Imprecision
Publication bias
Higher if…Study design
RCTs
Observational
studies
Large effect (e.g., RR 0.5)Very large effect (e.g., RR 0.2)
Evidence of dose-response gradient
All plausible confounding… …would reduce a demonstrated effect
…would suggest a spurious effect when results show no effect
23
GRADE evidence profile: HCC associated with HCV eradication
Morgan R, Baack B, Smith B, Yartel A, Pitasi M, Falck-Ytter Y. Ann Intern Med. 2013;158:329-337.
Summary of findings Anticipated absolute effects
Studies (N)
Issues Non-response
Viral eradication
Relative effects
HCCs with no Rx
HCCs after viral eradication
Quality of evidence
Outcome: Hepatocellular carcinoma (importance: critical for decision making)
12 obs. studies (25,906)
No serious* risks of bias; large effect
990/16,3126.1%
145/9,1851.6%
RR 0.24
95% CI: 0.18 – o.31
All stages of fibrosis:17 HCCs per 1,000
14 fewer HCCs per 1,000[-12; -15]
due to large effect
* Most studies controlled for baseline liver disease severity (for example, presence of cirrhosis) and other important confounders, such as hepatitis B virus infection.
Advanced fibrosis:33 HCCs per 1,000
23 fewer HCCs per 1,000[-18; -26]
From evidence to recommendations
24
RCTObser-vational study
High level recommen-
dation
Lower level recommen-
dation
Old system
Quality of evidence
Balance between benefits, harms & burdens
Patients’ values &
preferences
GRADE
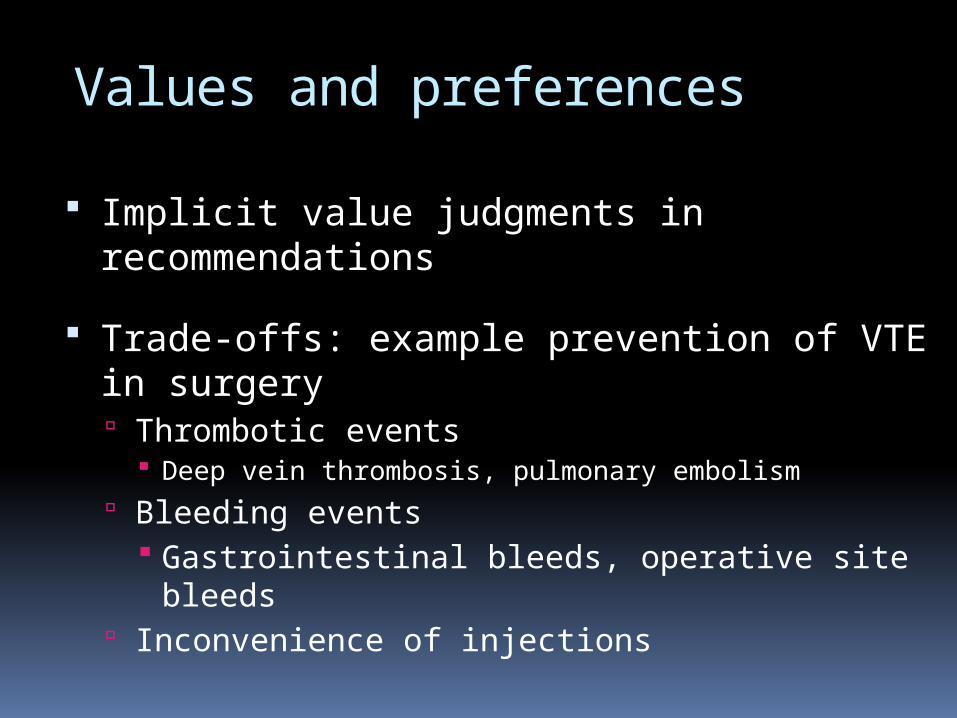
Values and preferences
Implicit value judgments in recommendations
Trade-offs: example prevention of VTE in surgery Thrombotic events
Deep vein thrombosis, pulmonary embolism Bleeding events
Gastrointestinal bleeds, operative site bleeds Inconvenience of injections
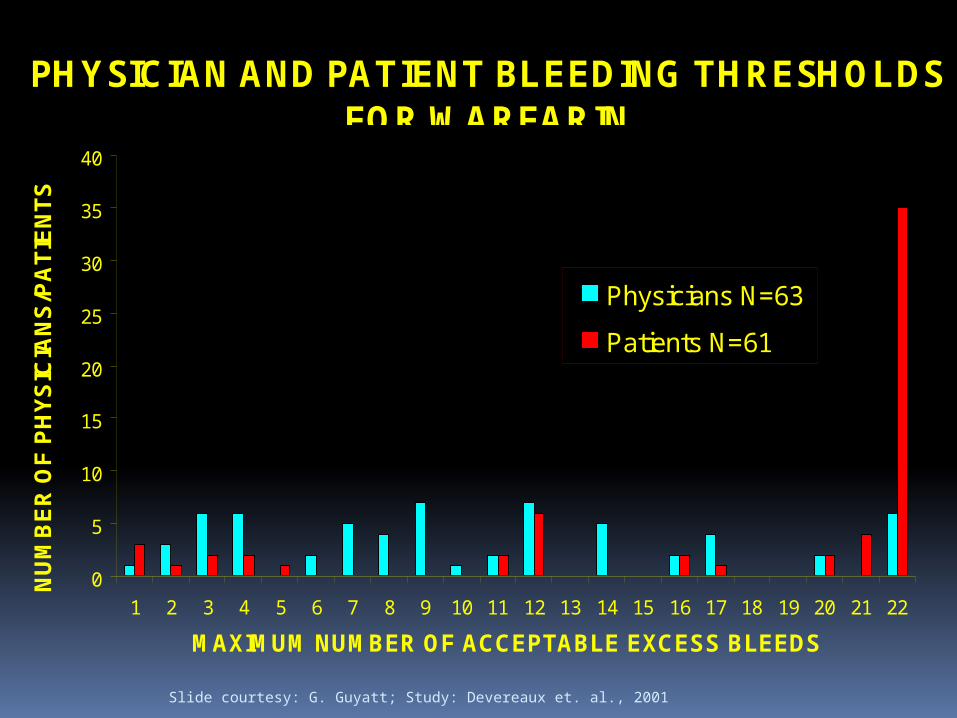
Variability in values and preferences
Case
77 y/o patient with atrial fibrillation, mild CHF, HTN, DM and history of stroke (fully recovered)
PHYSICIAN AND PATIENT BLEEDING THRESHOLDS FOR WARFARIN
Slide courtesy: G. Guyatt; Study: Devereaux et. al., 2001
Strength of recommendation“The strength of a recommendation reflects the extent to which we can,
across the range of patients for whom the recommendations are intended,
be confident that desirable effects of a management strategy outweigh undesirable effects.”
Understanding values & preferences necessary to trade-off benefits and downsides
Values and preferences should ideally be informed by systematic reviews, but evidence is often sparse
30
Example recommendation
ACCP AT9 recommendation:In patients undergoing major orthopedic surgery (e.g., total hip replacement), we suggest the use of LMWH in preference to the other agents.Patients who place a high value on avoiding bleeding complications and a low value on its inconvenience are likely to choose a compression device (IPCD) over the drug options.
31
4 determinants of the strength of recommendation
Factors that can weaken the strength of a recommendation
Explanation
Lower quality evidence The higher the quality of evidence, the more likely is a strong recommendation.
Uncertainty about the balance of benefits versus harms and burdens
The larger the difference between the desirable and undesirable consequences, the more likely a strong recommendation warranted. The smaller the net benefit and the lower certainty for that benefit, the more likely is a weak recommendation warranted.
Uncertainty or differences in patients’ values
The greater the variability in values and preferences, or uncertainty in values and preferences, the more likely weak recommendation warranted.
Uncertainty about whether the net benefits are worth the costs
The higher the costs of an intervention – that is, the more resources consumed – the less likely is a strong recommendation warranted.
32
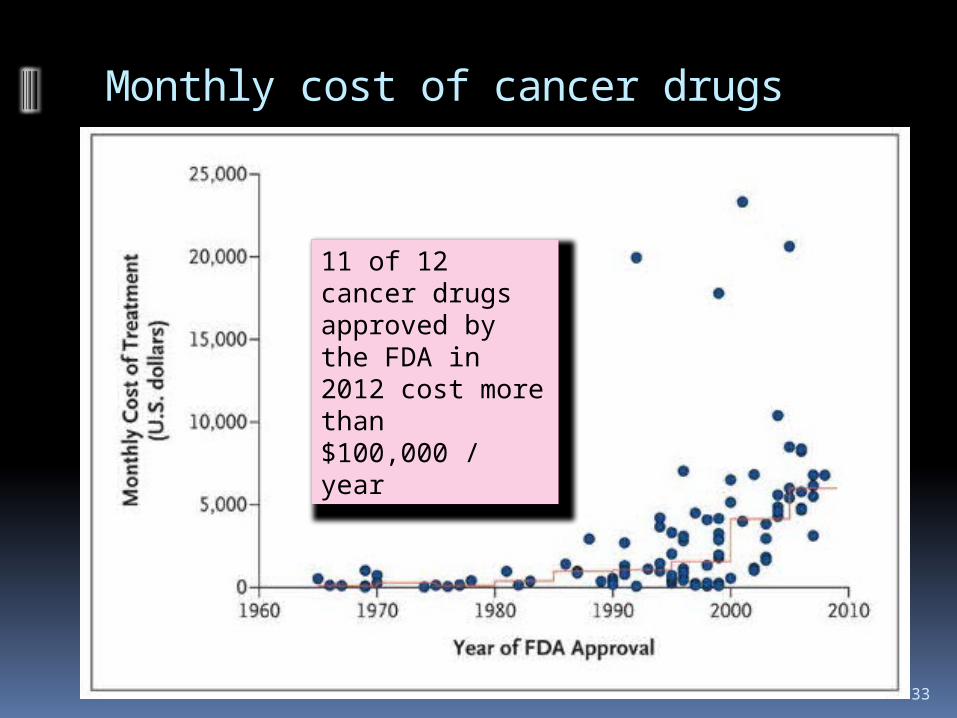
Monthly cost of cancer drugs
33
11 of 12 cancer drugs approved by the FDA in 2012 cost more than $100,000 / year
Example: ipilimumab (metastatic melanoma)
Estimated absolute effects at 2 years
Outcome Relative effect
(95% CI)
control(per
1000)
ipilimumab
(per 1000)
Difference(per 1000)
Certainty of the effect
Death HR 0.68(0.55 to
0.85)850 725
125 fewer deaths
(49 to 202 fewer)
High
Serious immune-related
AEs
RR 7.37(4.42 to
12.3)39 289
249 more SAEs
(134 to 441 more)
High
Quality of life
Resource use
Ipilimumab: $120,000 (12 weeks induction (4 injections)); Dacarbazine: $400Increase in median survival: 3.6 moIncremental cost-effectiveness: ~$400,000.00 per life year; $ per QALY????
34
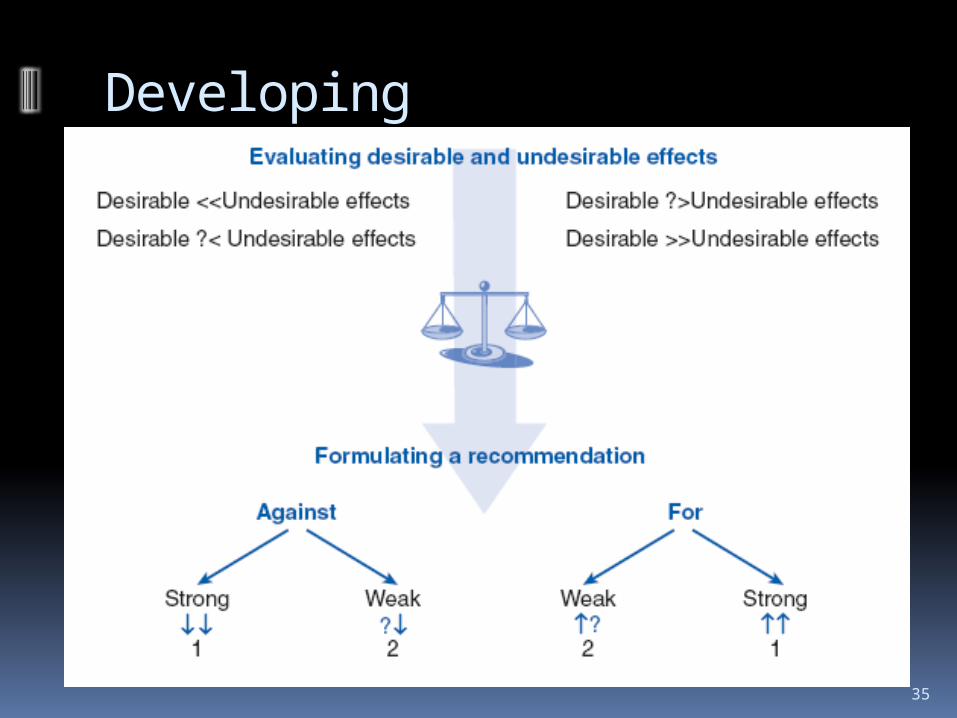
Developing recommendations
35
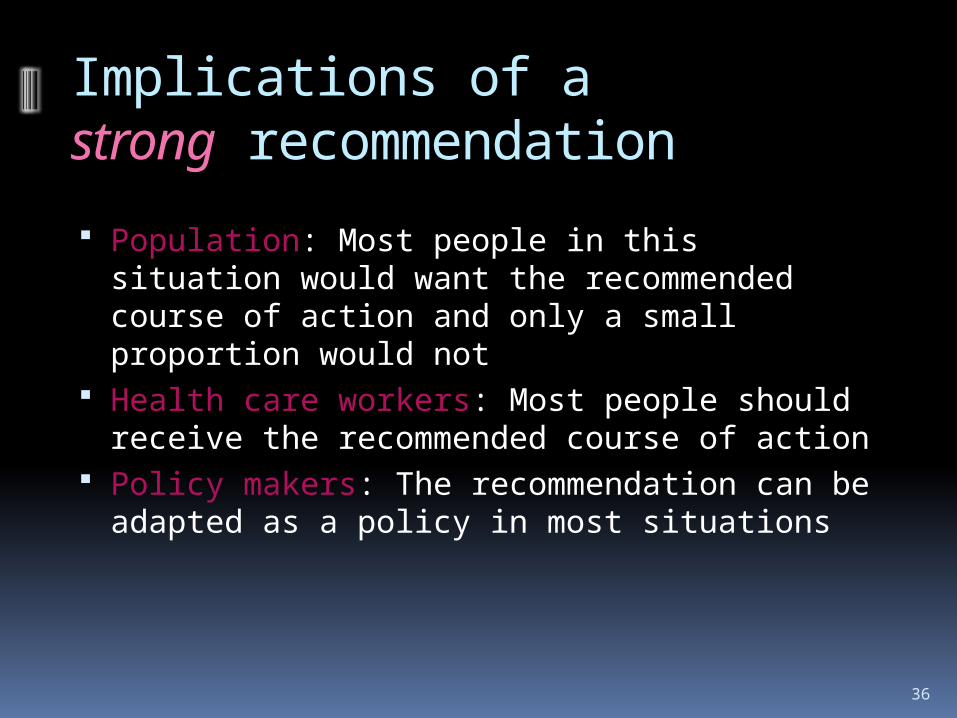
Implications of a strong recommendation
Population: Most people in this situation would want the recommended course of action and only a small proportion would not
Health care workers: Most people should receive the recommended course of action
Policy makers: The recommendation can be adapted as a policy in most situations
36
Implications of a conditional recommendation
Population: The majority of people in this situation would want the recommended course of action, but many would not
Health care workers: Be prepared to help people to make a decision that is consistent with their own values/decision aids and shared decision making
Policy makers: There is a need for substantial debate and involvement of stakeholders
37
Systematic review
Guideline development
PICO
OutcomeOutcomeOutcomeOutcome
Formulate
question
Rate
importa
nce
Critical
Important
Critical
Lessimportant
Create
evidence
profile with
GRADEpro
Summary of findings & estimate of effect for each outcome
Rate overall quality of
evidence across outcomes based
on lowest quality of critical outcomes
Panel
RCT start high, obs. data start
low1. Risk of bias2. Inconsisten
cy3. Indirectnes
s4. Imprecision5. Publication
bias
Gra
de
dow
nG
rad
e
up
1. Large effect
2. Dose response
3. Confounders
Rate quality
of evidence
for each
outcomeSelect
outcomes
Very low
LowModerate
High
Formulate recommendations:
• For or against (direction)• Strong or weak (strength)
By considering: Quality of evidence Balance
benefits/harms Values and
preferences
Revise if necessary by considering:
Resource use (cost)
• “We recommend using…”• “We suggest using…”• “We recommend against using…”• “We suggest against using…”
Outcomes
across
studies
38
What GRADE isn’t
Not another “risk of bias” tool Not a quantitative system (no scoring
required) Not eliminate COI, but able to minimize Not “expensive”
Builds on well established principles of EBM Some degree of training is needed for any
system Proportionally adds minimal amount of
extra time to a systematic review
40
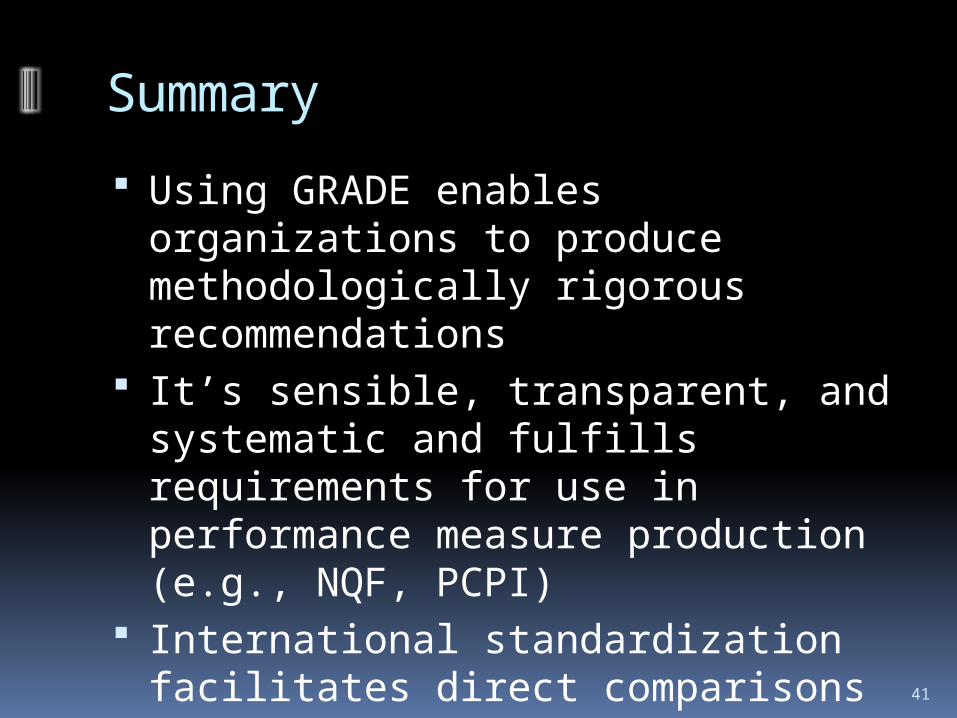
Summary
Using GRADE enables organizations to produce methodologically rigorous recommendations
It’s sensible, transparent, and systematic and fulfills requirements for use in performance measure production (e.g., NQF, PCPI)
International standardization facilitates direct comparisons across organizations and has the potential to reduce redundancy in efforts 41