17
The Next Big Growth Idea COMPANIES IN AN M&A RACE TO FIND GROWTH THROUGH DATA-DRIVEN INNOVATION CROSS SECTOR WHITE PAPER JANUARY 2018

The Next Big Growth IdeaCOMPANIES IN AN M&A RACE TO FIND GROWTH THROUGH DATA-DRIVEN INNOVATION
CROSS SECTOR WHITE PAPER JANUARY 2018

Contents
1. DILUTION OF NATURAL GROWTH FACTORS AND M&A 41.1. Deals we thought were dead nevertheless materialized 4 1.2. Historically low interest rates are not the main reason behind these deals 6 1.3. The main motivations are the search for and protection of growth 7
2. WHEN THE RACE FOR SCALE AND COST-CUTTING IS OVER, INNOVATION IS AGAIN AT THE HEART OF GROWTH 9
2.1. Phase 1: the race for scale and cost-cutting 9 2.2. Phase 2: from the race for scale to a welcome streamlining 12 2.3. Phase 3: from streamlining to specialization via innovation 14
3. INNOVATION AND CHERRY PICKING AT ALL COSTS 18 3.1. The end to standardized mass consumption at the heart of innovation 18 3.2. Valuation review: record-high transaction multiples for innovative
growth vehicles 21
Innovation is driving an expensive wave of M&A aimed at picking up niche players. At the heart of this trend is Big Data, which is making individualized healthcare and personalized retail experiences possible. We are leaving the era of standardized, ‘mass’ consumption behind.
Current M&A deals are driven by more than just an advantageous financing environment. They are about finding and protecting growth, which is declining. In the healthcare, FMCG and technology sectors, deals have followed a similar sequence, albeit with different timing:
1 Initially, companies indulged in a sometimes hazardous race for scale, followed by cost-cutting, to compensate for lack of growth. At the same time, efforts to create immediate stock market value (spin-offs and buybacks etc.) caused them to lose sight of their core purpose and came at the expense of innovation.
2 Companies then made a welcome return to their core businesses (through disposals/asset swaps etc.) and by searching for critical mass. Against a backdrop of disruption caused by Amazon, integrating and protecting the value chain then became a priority.
3 Innovation, which is the best way to achieve this, therefore returned to the limelight. This third phase is feeding a wave of targeted acquisitions, as companies vie to buy niche businesses with the expertise to help create personalized services that will build value and protect growth.
ANTOINE PARISONEquity Research AnalystRetail & [email protected]
OLIVIER PAUCHAUTHead of [email protected]

1. Dilution of natural growth factors and M&A
1.1 DEALS WE THOUGHT WERE DEAD NEVERTHELESS MATERIALIZED
Against the backdrop of their first aborted merger attempt in 2007 – and the experience of people such as Pierre Bouchut, the former Casino and Carrefour executive who suffered the fall-out of the Carrefour-Promodes merger before joining Delhaize as CFO – it was only natural to fear the 2016 Ahold-Delhaize tie-up. The deal had already stumbled in 2007 and the two groups had shown no particular ability to integrate acquisitions. Nonetheless, the two groups took the plunge.
The same question applies to the Danone-Whitewave deal (2016) in the organic food sector. As well as bitter memories of the Numico acquisition in 2007, investors were still conscious of the message from the group’s CEO in November 2015 when he stated that a sizeable deal was useless and growth in ROCE secured. Nevertheless, the transaction took place and the operation will reduce the 2017 ratio by an estimated 200bp. Furthermore, the price offered by Danone showed a high valuation (i.e. EBITDA multiple of 21x or 14x including synergies vs. a 2017 sector average of 13x). Again, the two groups went ahead.
Finally, investors in technology, media and telecoms will remember the fallout from AOL’s failed 2000 acquisition of Time Warner and Vivendi’s media convergence strategy that resulted in the ousting of then-CEO Jean-Marie Messier, who concluded that “being right too early could also mean being wrong”. Fifteen years later, ATT is effectively on the verge of acquiring Time Warner. And in France, SFR has already got its hands on Next Radio TV.
In all these cases – retail, food, TMT – the question is the same: why have these major deals come back?
32 | THE NEXT BIG GROWTH IDEA

SECTOR DATE NATURE OF THE DEAL RATIONALE BEHIND THE DEAL TRANSACTION MULTIPLE
FOOD RETAIL Jun 2016 Merger between Ahold and Delhaize (EUR24bn)
Cost-sharing in a highly mature sector which is suffering a lack of lack of growth
EBITDA multiple of 7.1x (incl. RSS) and 6.1x respectively for Ahold and Delhaize
FOOD RETAIL Jan 2017 Tesco acquires Booker Searching for more profitable and growing niche segments
EBITDA multiple of 16x vs 7x on average for the panel!
FOOD Apr 2017 Acquisition of Whitewave by Danone (EUR11bn)
Searching for more profitable and growing niche segments
EBITDA multiple of 21x (14x incl. synergies) vs 13x for the sector
BEERS Jul 2016 Acquisition of SABmiller by AB InBev (EV of EUR117bn)
Adding growth in Africa and Latin America and cost savings
17.7x EBITDA 2016e and 21.3x EBIT
UTILITIES Mar 2017 Acquisition of GE Water by Suez (EUR3.2bn)
Offsetting tepid growth in mature European municipal water markets
EBITDA multiple of 12.5x (10x incl. synergies)
OPTICS Jan 2017 Merger between Essilor and Luxottica (EUR50bn)
Full control of the value chain to erect barriers to entry
EBITDA multiple of 13.5x and 11.9x respectively for Essilor and Luxottica
SOFTWARE & IT SERVICES
Jul 2015 Acquisition of Igate by Capgemini (EUR4bn)
Strengthening presence in north America, financial services and offshore
2015 EV/EBIT multiple of 17x
HEALTHCARE Jan 2016 Shire acquires Baxalta Reinforcing footprint in rare diseases USD32bn (38% premium)
HEALTHCARE Feb 2016 + Dec 2016
Ipsen acquires Cabozantinib from Exelixis
EU rights for the Oncology product candidate. Deal amended to add rights for Canada
USD855m (incl. USD200m upfront) + royalties (up to 26%)
HEALTHCARE Aug 2016 Pfizer acquires Medivation
Best-in-class product of a new promising oncology class (PARP inhibitor) + pipeline
USD14bn (118% premium)
HEALTHCARE Sep 2016 Fresenius SE acquires Quirónsalud
Complementing portfolio and broadening pipeline in Pulmonary Arterial Hypertension primarily
USD30bn (12.3x EV/sales)
HEALTHCARE Sep 2016 Bayer acquires Monsanto
Reinforcing agro-chemical business USD66bn (5.0x EV/sales)
HEALTHCARE Jan 2017 Johnson & Johnson acquires Actelion
Complementing portfolio and broadening pipeline in Pulmonary Arterial Hypertension primarily
USD30bn (12.3x EV/sales)
HEALTHCARE Jan 2017 Ipsen acquires Onyvide from Merrimack
One molecule in Oncology to increase the focus of the company and leverage US presence
USD1.025bn (incl. USD575 upfront)
HEALTHCARE Mar 2017 Boston Scientific acquires Symetis
Best-in-class product on a fast-growing market (transaortic valve implants)
USD435m (8.25x EV/sales)
HEALTHCARE Apr 2017 Fresenius SE from Akorn Pharmaceuticals
Reinforcing footprint in the US generic space
USD4.3bn (EV/Sales 4.6x, EV/EBITDA 12.4x)
CEMENT Jul 2015 Acquisition of Lafarge by Holcim. Exchange offer presented as a EUR40bn merger.
Streamlining the footprint (less Europe, more EM)
EBITDA ratio of 8,6x current year excl. synergies
BUILDING MATERIALS
Pending Pending acquisition of SWH/Sika by Saint-Gobain (EUR2.4bn)
Accelerate growth with stronger exposure to construction technologies / specialty chemical
EBITDA multiple of 10x when announced, excluding the EUR1.1bn premium offered for voting rights
Source: company data; stocks covered by Bryan, Garnier & Co
KEY M&A DEALS FROM BRYAN, GARNIER & CO’S COVERAGE REFLECTING THE SEARCH FOR COST EFFICIENCIES AND/OR THE PROTECTION OF GROWTH DURING THE LAST THREE YEARS
54 | THE NEXT BIG GROWTH IDEA
1.2 HISTORICALLY LOW INTEREST RATES ARE NOT THE MAIN REASON BEHIND THESE DEALS
Issues with execution, cultural fit and egos – as seen in the aborted Ahold-Delhaize merger in 2007 and Publicis-Omnicom in 2014 – can make major deals very risky. In the food retailing sector for example, we don’t recall any value-creating deals, until now, but instead remember the difficulties encountered in the 1999 Carrefour-Promodes merger. Retailing is also a local business that puts local suppliers and brands in contact with consumers who have very specific requirements. Any gains from a merger therefore rarely extend beyond a region, and transcontinental synergies are unlikely. Despite this, Ahold and Delhaize finally took the plunge in 2016 after sizing each other up for a long time.
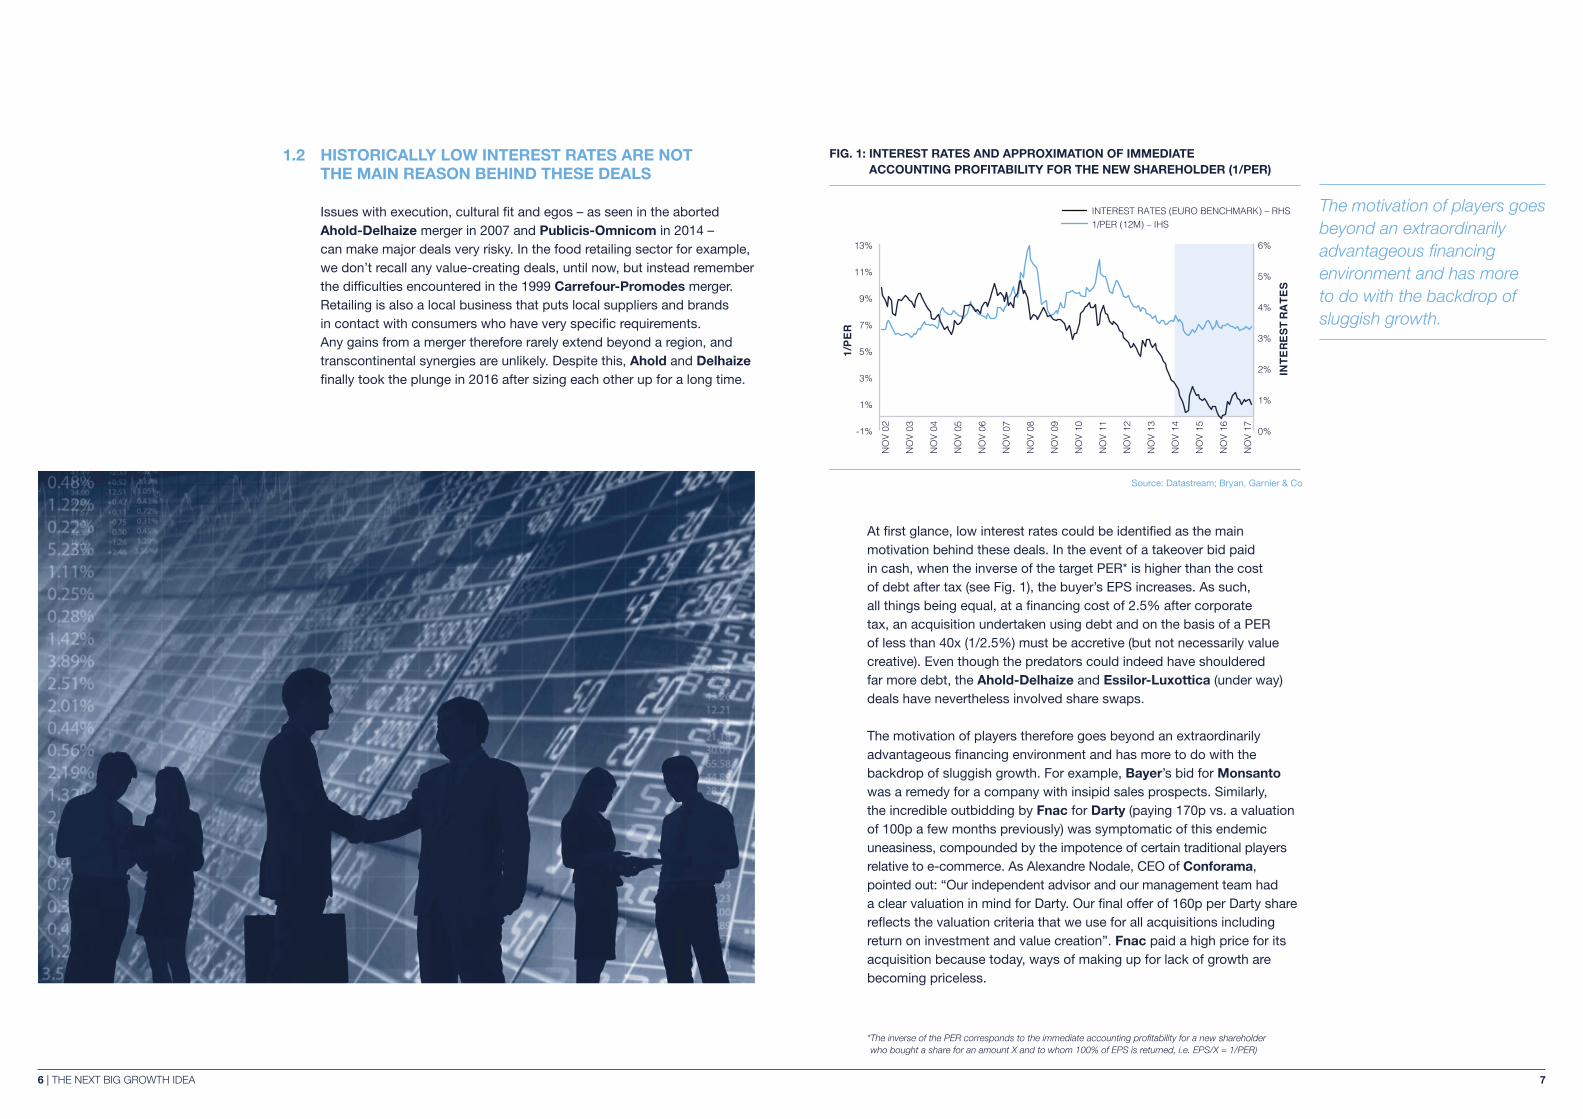
At first glance, low interest rates could be identified as the main motivation behind these deals. In the event of a takeover bid paid in cash, when the inverse of the target PER* is higher than the cost of debt after tax (see Fig. 1), the buyer’s EPS increases. As such, all things being equal, at a financing cost of 2.5% after corporate tax, an acquisition undertaken using debt and on the basis of a PER of less than 40x (1/2.5%) must be accretive (but not necessarily value creative). Even though the predators could indeed have shouldered far more debt, the Ahold-Delhaize and Essilor-Luxottica (under way) deals have nevertheless involved share swaps.
The motivation of players therefore goes beyond an extraordinarily advantageous financing environment and has more to do with the backdrop of sluggish growth. For example, Bayer’s bid for Monsanto was a remedy for a company with insipid sales prospects. Similarly, the incredible outbidding by Fnac for Darty (paying 170p vs. a valuation of 100p a few months previously) was symptomatic of this endemic uneasiness, compounded by the impotence of certain traditional players relative to e-commerce. As Alexandre Nodale, CEO of Conforama, pointed out: “Our independent advisor and our management team had a clear valuation in mind for Darty. Our final offer of 160p per Darty share reflects the valuation criteria that we use for all acquisitions including return on investment and value creation”. Fnac paid a high price for its acquisition because today, ways of making up for lack of growth are becoming priceless.
0%
1%
2%
3%
4%
5%
6%
INTE
REST
RA
TES
1/PE
R
1/PER (12M) – IHS INTEREST RATES (EURO BENCHMARK) – RHS
NO
V 02
NO
V 03
NO
V 04
NO
V 05
NO
V 06
NO
V 07
NO
V 08
NO
V 09
NO
V 10
NO
V 11
NO
V 12
NO
V 13
NO
V 14
NO
V 15
NO
V 16
NO
V 17-1%
1%
3%
5%
7%
9%
11%
13%
FIG. 1: INTEREST RATES AND APPROXIMATION OF IMMEDIATE ACCOUNTING PROFITABILITY FOR THE NEW SHAREHOLDER (1/PER)
Source: Datastream; Bryan, Garnier & Co
* The inverse of the PER corresponds to the immediate accounting profitability for a new shareholder who bought a share for an amount X and to whom 100% of EPS is returned, i.e. EPS/X = 1/PER)
76 | THE NEXT BIG GROWTH IDEA
The motivation of players goes beyond an extraordinarily advantageous financing environment and has more to do with the backdrop of sluggish growth.

1.3 THE MAIN MOTIVATIONS ARE THE SEARCH FOR AND PROTECTION OF GROWTH1
To dilute their fixed costs, groups in the consumer, technology and healthcare sectors are naturally governed by the same imperative of sales growth. However, commercial catalysts are tending to run out of steam, which impacts upon the financial equation and weighing on the financial equation and stock market performances of listed players. This is the dominant factor that has motivated many M&A operations in recent years and heightened valuation multiples on transactions (see section 3.2). As we see in section 2.1, attempts to make up for slim growth – for example the spin-offs carried out by retailer Metro AG, hotel group Hilton, the printer manufacturer Xerox and animal health specialist Pfizer – suggest that company financial equations have been undermined in a hitherto unseen way.
Fixed costs that evolve independently of business volumes represent a large share of the industrial P&L account. So with all other factors remaining equal, sales must increase in order for the contribution margin to cover not only these fixed costs, but also natural cost inflation. The recurring nature of this imperative growth is essentially driven by demographics and inflation.
However, many sectors are suffering sluggish demographic factors, deflation (or disinflation) and a saturation of the competitive space combined with a rise in capital intensity and a dilution in pricing power. Against a backdrop of disruption caused by Amazon, the persistent attitude of the small French group Fnac up against Steinhoff (owner of Conforama) therefore reflected a defensive strategy that consists of sharing costs with Darty instead of diluting them via growth. The same goes for Ahold and Delhaize, whose sales prospects are clearly limited in a very mature sector.
2009 2010 2011 2012 2013 2014 2015 20163
1023 23 27
36 36 31
FIG. 2: ANNUAL, NON-EXHAUSTIVE NUMBER OF SIZEABLE SPIN-OFF OPERATIONS
Source: Stockspinoffs.com; Bryan, Garnier & Co
98 | THE NEXT BIG GROWTH IDEA

2. When the race for scale and cost-cutting is over, innovation is again at the heart of growth
2.1. PHASE 1: THE RACE FOR SCALE AND COST-CUTTING
Faced with the dilution in their growth potential, companies initially looked for sales growth by diversifying their businesses and geographical locations. Axa’s move into the financial protection market resulted in an inflation in its goodwill that reached EUR17bn in 2008, or 55% of equity (vs. EUR1.8bn in 1998 or 13% of equity). In 2011, Carrefour’s geographical portfolio (See Fig. 3) included no less than 24 integrated countries (vs 10 in 2017). Its skills, capex and scale effects were diluted to such an extent that ROCE plummeted. The retailer also increased its exposure to non-food retailing, which is cyclical by nature, diluting its defensive status. Today, the opportunity cost can be seen in the group’s lag in e-commerce (2000 saw the birth and take-off of Amazon, whereas Carrefour was expanding geographically) and an ambivalent stock market status (i.e. neither totally defensive nor genuinely cyclical).
Controlling costs then became a popular pastime, as shown by the drastic reduction in SG&A costs at IT services companies, which suffered a hefty deflation in sales following competition from Indian companies (growth levels struggled to reach 2-3% in the 2000s vs. around 10% the previous decade). Groups also drifted away from their core purpose when they aimed to create immediate stock market value, either from the ground up, for example using spin-offs to maintain the myth that the value of the
whole is systematically enhanced by separating the parts, or by serving the short-term interests of shareholders through share buyback programmes and exceptional dividend payments (See Fig. 4).
Cost control and financial engineering have not always been fruitful, especially when they come at the expense of the business base or innovation. Carrefour, Casino and Tesco have under-invested in stores and the big pharma groups struggle to compensate for the ‘patent cliff’. Pfizer, for example, clearly suffered from the loss of very lucrative patents such as Lipitor, an anti-cholesterol drug that generated almost USD12-13bn during its peak years. Combined with low productivity in internal R&D, this motivated Pfizer to acquire the biotech group Medivation from under the nose of Sanofi, with an offer of USD14bn vs. USD9.3bn offered by the French group.
The consequences of all-out diversification and cost-cutting were so significant that they brought some groups close to collapse. Following the difficulties at Carrefour, this was reflected in the stock market misery that in 2012 saw Tesco tumble from its pedestal, with shares having dropped since 2007. Its troubles were also manifest in a GBP4.7bn depreciation in property, the value of which was irremediably associated with the waning quality of a business base that had long suffered under-investment. To generate the funds necessary to turn round its domestic activities, the UK retailer had no choice but to sell off its “crown jewel” South Korean business, sold in 2015 for GBP4.2bn.
0
10
20
30
40
50
60
2003 2004 2005 2006 2007 2008 2009 2010 2011 2012 2013 2014 2015 2016
CASH DIVIDEND STOCK DIVIDEND SHAREBUYBACK
FIG. 4: DIVIDENDS AND SHARE BUYBACKS AT CAC 40 COMPANIES (EUR BN)
Source: Vernimmen, Bryan, Garnier & Co
GALLAND LAWIFRS
DUTREIL LAW LME
0% 1% 2% 3% 4% 5% 6% 7%
0
5
10
15
20
25
30
35
1989
1990
1991
1992
1993
1994
1995
1996
1997
1998
1999
2000
2001
2002
2003
2004
2005
2006
2007
2008
2009
2010
2011
2012
2013
2014
2015
2016
2017
MA
RG
IN R
ATE
CO
UN
TRIE
S (O
WN
STO
RES
)
MARGIN RATE
FIG. 3: NO. OF COUNTRIES IN CARREFOUR’S PORTFOLIO AND EBIT MARGIN IN THE DOMESTIC MARKET
Source: company data; Bryan, Garnier & Co
1110 | THE NEXT BIG GROWTH IDEA
The consequences of all-out diversification and cost-cutting were so significant that they brought some groups close to collapse.

SECTOR COMPANIES / DEAL YEAR
BEVERAGES Grand Met / Guinness => Diageo 1997
BUILDING MATERIALS Holcim / Lafarge => LafargeHolcim 2015
BUILDING MATERIALS HeidelbergCement / Italcementi 2016
BUSINESS SERVICES Edenred / UTA + Embratec 2014-2016
BUSINESS SERVICES Marriott / Starwood 2016
BUSINESS SERVICES Eurofins / EAG Laboratories Ongoing
FINANCIALS Credit Suisse / Winterthur 1997
FOOD RETAIL Carrefour / Promodes 1999
FOOD RETAIL Ahold / Delhaize 2016
HEALTHCARE Astra / Zeneca 1999
HEALTHCARE Pfizer/Wyeth 2009
HEALTHCARE Merck&Co / Schering Plough 2009
HEALTHCARE Pfizer / Wyeth 2009
HEALTHCARE Allergan / Actavis 2014
HEALTHCARE/MEDTECH Novartis / Alcon 2010
INSURANCE AXA/UAP 1997
INTERNET America Online / Netscape 1998
IT HARDWARE Compaq / Digital Equipment 1998
IT HARDWARE Hewlett-Packard / Compaq 2002
IT HARDWARE Oracle / Sun Microsystems 2010
IT HARDWARE Dell / EMC 2015
MEDTECH Fresenius / Akorn 2017
MEDTECH Becton Dickinson / CR Bard 2017
MOTOR Renault / Nissan 1999
MOTOR Geely / Volvo 2010
MOTOR PSA / DongFeng 2014
MOTOR Plastic Omnium / FAE / Faurecia 2015
MOTOR PSA / Opel 2017
NON-FOOD RETAIL Fnac / Darty 2016
OIL&GAS Total / Elf 2000
PAYMENTS Worldpay / Vantiv 2018e
SEMICONDUCTORS Broadcom / Qualcomm 2018e
SEMICONDUCTORS Qualcomm / NXP 2017
SOFTWARE & IT SERVICES Cap Gemini / Ernst & Young Consulting LLC 2000
SOFTWARE & IT SERVICES Oracle / PeopleSoft 2004
SOFTWARE & IT SERVICES Hewlett-Packard / EDS 2008
UTILITIES E.ON / PowerGen 2001
UTILITIES Suez / Electrabel 2005
UTILITIES Iberdrola / Scottish Power 2006
UTILITIES EDF / British Energy 2008
UTILITIES Gaz de France / Suez 2008
UTILITIES GDF Suez / International Power 2010
FIG. 5: A FEW DEALS MOTIVATED MAINLY BY SIZE, SYNERGIES AND DIVERSIFICATION
Source: company data; Bryan, Garnier & Co
1312 | THE NEXT BIG GROWTH IDEA

2.2. PHASE 2: FROM THE RACE FOR SCALE TO A WELCOME STREAMLINING2
After the distractions of the drives for size and cost-cutting, companies made a welcome return to their core businesses. A wave of disposals/asset swaps (e.g. the IPO of Covestro by Bayer, the sale of Novartis’ animal health activities, Carrefour’s spin-off of Dia and Sopra’s of Axway, the asset swap between Novartis and Glaxo) marked an end to all-out diversification. The issue of critical mass in essential segments therefore became more important – as shown by Fnac-Darty (the merger strengthened their market position in the face of Amazon) – as did control and protection of the value chain for players disrupted by Amazon.
In fact, one of the dominant concerns of groups is whether Amazon and its peers can disrupt any consumer segment they like, especially in light of the online giant’s bid for Whole Foods Market. For example, the announcement by Macy’s that it is to axe 10,000 jobs was the result of a wide-scale trend that has seen US department store sales collapse, primarily in favour of Amazon. If the US giant maintains its trajectory, it is set to generate sales of more than USD50bn in the US fashion segment in 2020 (i.e. c. 45% market share vs. c.25% in 2015), or more than the no. 2 and no. 3 groups (Macy’s and TJX) combined. Apart from innovation, on which range positioning and pricing power is based (See section 2.3), integration of the value chain seems to be a good defence against Amazon.
SECTOR COMPANIES / DEAL YEAR
BUSINESS SERVICES Accor / Edenred 2010
BUSINESS SERVICES Accor => Edenred 2010
BUSINESS SERVICES AccorHotels => Spin-off of AccorInvest Ongoing (initiated in 2016)
FINANCIALS Fortis and ING tore apart 2008-2009
FINANCIALS Dredsner Bank sold by Allianz to Commerzbank 2009
HEALTHCARE Shire / Baxalta 2016
IT HARDWARE IBM: PC business sold to Lenovo 2005
IT HARDWARE HP / HP Enterprise split 2015
IT SOFTWARE Atos / Worldline 2014
MOTOR Faurecia / FAE / Plastic Omnium 2015
MOTOR Delphi Spinoff 2017
MOTOR GM / Opel 2017
MOTOR Plastic Omnium/Environment business 2017
SOFTWARE & IT SERVICES Dell EMC: Dell Services sold to NTT Data 2016
SOFTWARE & IT SERVICES HP Enterprise: HPE Enterprise Services sold to CSC 2017
SOFTWARE & IT SERVICES HP Enterprise: HPE Software sold to Micro Focus 2017
UTILITIES E.ON => end of conglomerate following Via / Vega merger Early 2000's
UTILITIES RWE => disposals of water-related activities 2006-2008
UTILITIES Engie / Suez 2008
UTILITIES GDF-Suez / Suez Environnement 2008
UTILITIES E.ON => spin-off of Uniper 2016
UTILITIES RWE => spin-off of innogy 2016
UTILITIES Veolia / Transdev Ongoing (initiated in 2016)
This is probably what Essilor and Luxottica focused on with their strategic partnership. The optical groups saw what happened to US apparel players, just as Amazon is probably eyeing their margin levels (around 15% in terms of EBIT in eyewear retailing). On top of owning store networks, controlling the manufacture of innovative lenses and the making and distribution of frames (i.e. the integration of the value chain) allows brick-and-mortar players to manage entry barriers (this also motivated internet-only US group Warby Parker to open its first store in 2013). Without this, who knows whether Amazon would have managed to get its hands on Luxottica at the last moment as it apparently intended to also do with American Apparel (which finally did not go ahead).
A FEW DEALS MOTIVATED MAINLY BY STRATEGIC STREAMLINING
Source: company data; Bryan, Garnier & Co
1514 | THE NEXT BIG GROWTH IDEA
One of the dominant concerns of groups is whether Amazon and its peers can disrupt any consumer segment they like.

2.3. PHASE 3: FROM STREAMLINING TO SPECIALIZATION VIA INNOVATION
Sluggish growth is now obliging companies to build their top-line rather than “receive it” i.e. through natural revenue drivers such as demographic change and inflation. They need to fight, and beg consumers for a modest increase in their sales by fine-tuning their offers. In France, for example, FMCG growth is now exclusively driven by a beneficial mix-innovation effect (see Fig. 6), which offsets deflation. The pricing power that stems from innovation and trading-up in niche segments (i.e. fresh, local and organic products which now represent virtually all growth in FMCGs in France) is therefore favoured as an endogenous growth factor (we believe the Danone-Whitewave deal is partly based on this logic). According to Bain, nothing influences profits more than pricing (see Fig. 7).
Innovation is currently at the heart of the alternative growth strategies of companies that are facing a breakdown in their commercial engines. A generic product with little innovation, affected by an approximate range positioning and sharp competition in supply, is by nature replaceable. It is therefore exposed to high price elasticity and stunted margin potential. In contrast, upscale products, which are more specific and have a high innovative or image content, combine low price elasticity with solid profitability. This reality is at the heart of a decade-long trend that has seen Germany pull away from France, especially in the manufacturing industry. The case of France is symptomatic as it shows an increase in wage costs in recent years together with the deflation of value added (see Fig. 8). This situation clearly contrasts with that of Germany (see Fig. 9)3.
~3% ~4% ~4%
~8%
0% 1% 2% 3% 4% 5% 6% 7% 8% 9%
FIXED COSTS VARIABLE COSTS MARKET SHARE REALIZED PRICE
FIG. 7: NOTHING AFFECTS PROFITS MORE THAN PRICING
60
70
80
90
100
VALUE ADDED PRICE INDEX SALARY COST PER UNIT BASE 100 = 1997
1997
1998
1999
2000
2001
2002
2003
2004
2005
2006
2007
2008
2009
2010
2011
2012
2013
2014
2015
2016
2017
FIG. 8: UNIT WAGE COSTS AND PRICE INDEX (IMPLICIT DEFLATOR) OF VALUE ADDED IN THE FRENCH MANUFACTURING INDUSTRY
Source: Eurostat, Bryan, Garnier & Co
80
100
120
140
160
VALUE ADDED PRICE INDEX SALARY COST PER UNIT BASE 100 = 1997
1997
1998
1999
2000
2001
2002
2003
2004
2005
2006
2007
2008
2009
2010
2011
2012
2013
2014
2015
2016
2017
FIG. 9: UNIT WAGE COSTS AND PRICE INDEX (IMPLICIT DEFLATOR) OF VALUE ADDED IN THE GERMAN MANUFACTURING INDUSTRY
Source: Eurostat, Bryan, Garnier & Co
-2%-1%0%1% 2%3%4%5%
OC
T 08
DEC
08
FEB
09AP
R 09
JUN
09
AUG
09
OC
T 09
DEC
09
FEB
10AP
R 10
JUN
10
AUG
10
OC
T 10
DEC
10
FEB
11AP
R 11
JUN
11
AUG
11
OC
T 11
DEC
11
FEB
12AP
R 12
JUN
12
AUG
12
OC
T 12
DEC
12
FEB
13AP
R 13
JUN
13
AUG
13
OC
T 13
DEC
13
FEB
14AP
R 14
JUN
14
AUG
14
OC
T 14
DEC
14
FEB
15AP
R 15
JUN
15
AUG
15
OC
T 15
DEC
15
FEB
16AP
R 16
JUN
16
AUG
16
OC
T 16
DEC
16
FEB
17AP
R 17
JUN
17
AUG
17
OC
T 17
(1) DEMAND INFLATION (2) MIX + INNOVATION (3)VOLUMES (1)+(2)+(3) = SALES AVERAGE GROWTH RATE (SEMESTRIAL MOVING AVERAGE)
FIG. 6: BREAKDOWN OF GROWTH (HALF-YEARLY MOVING AVERAGE) AT FRENCH SUPERMARKETS AND HYPERMARKETS
Source: IRI; Bryan, Garnier & Co
For each variable, percentage increase in EBIT for every 1% of improvement
* Average impact measured across B2B industries Source: Bain
1716 | THE NEXT BIG GROWTH IDEA
Innovation is currently at the heart of the alternative growth strategies of companies that are facing a breakdown in their commercial engines.
- 1.5%
- 1.0%
- 0.5%
0.0%
0.5%
1.0%
1.5%
EURO ZONE GERMANY SPAIN FRANCE ITALY
PRIC
E C
OM
PETI
TIVE
NES
S G
AIN
S
FOREX EFFECT UNIT LABOR COST MARGIN EFFORT PRICE COMPETITIVENESS
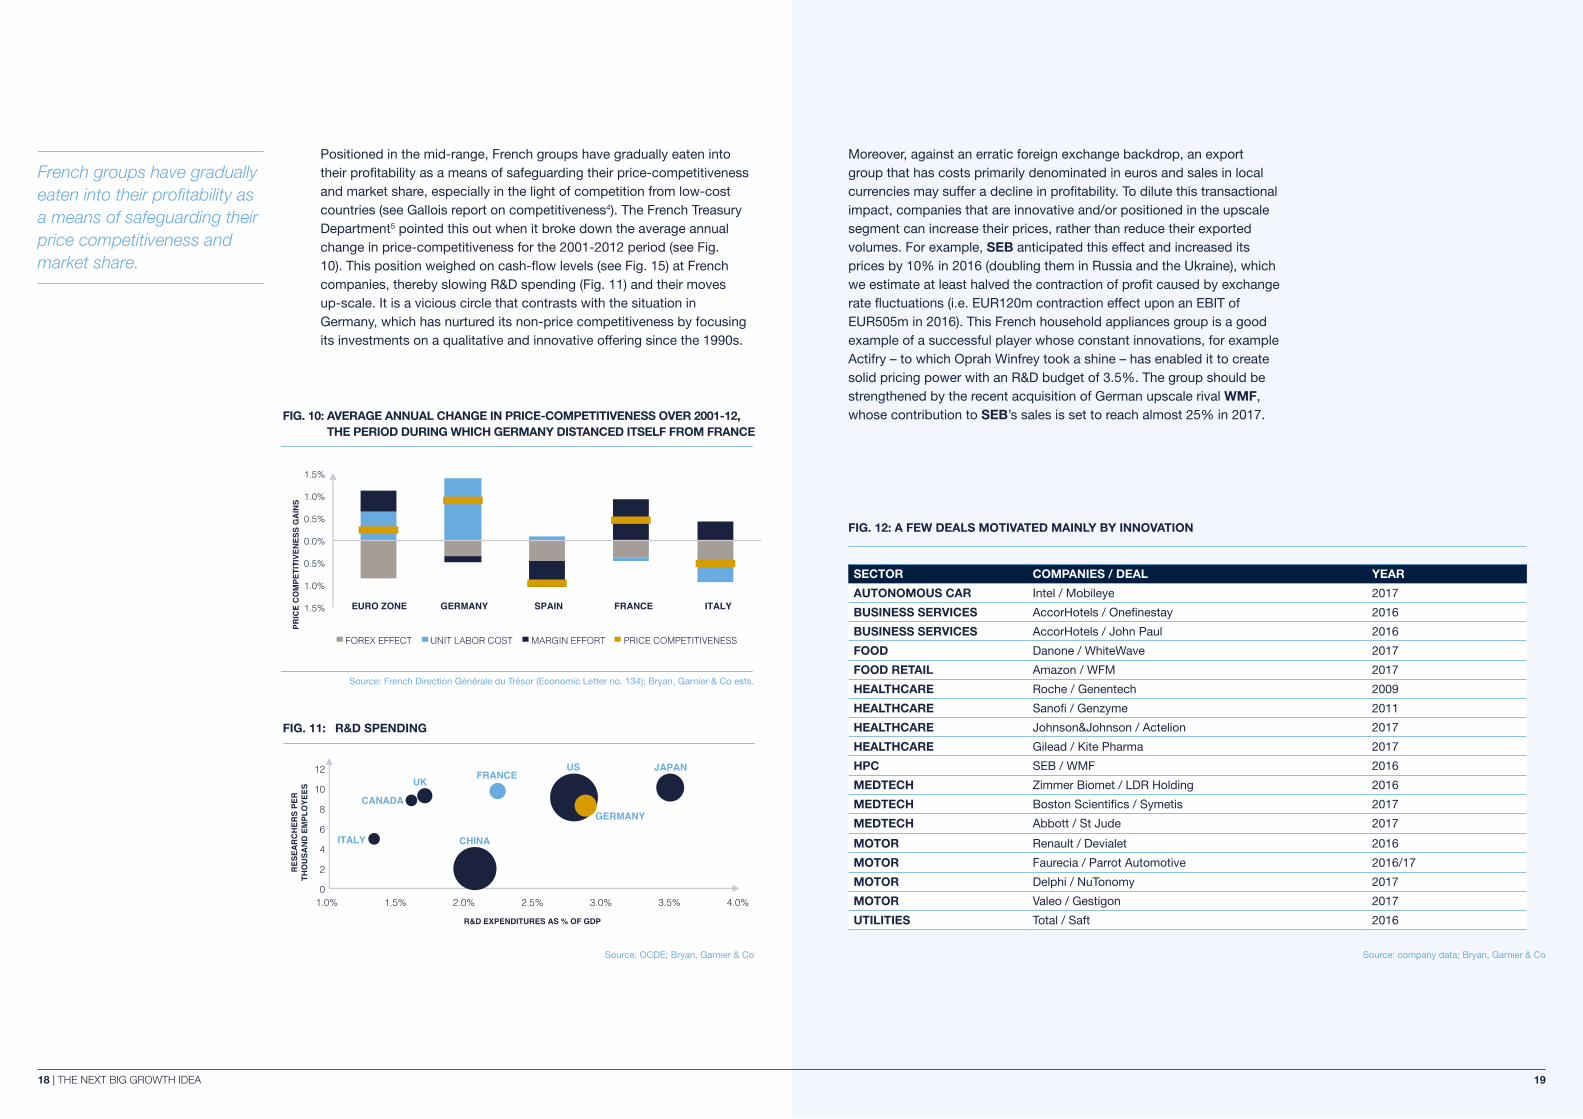
FIG. 10: AVERAGE ANNUAL CHANGE IN PRICE-COMPETITIVENESS OVER 2001-12, THE PERIOD DURING WHICH GERMANY DISTANCED ITSELF FROM FRANCE
Source: French Direction Générale du Trésor (Economic Letter no. 134); Bryan, Garnier & Co ests.
US
GERMANY
FRANCEJAPAN
UK
CANADA
CHINAITALY
0
2
4
6
8
10
12
1.0% 1.5% 2.0% 2.5% 3.0% 3.5% 4.0%
RES
EAR
CH
ERS
PER
TH
OU
SAN
D E
MPL
OYE
ES
R&D EXPENDITURES AS % OF GDP
FIG. 11: R&D SPENDING
Source: OCDE; Bryan, Garnier & Co
Positioned in the mid-range, French groups have gradually eaten into their profitability as a means of safeguarding their price-competitiveness and market share, especially in the light of competition from low-cost countries (see Gallois report on competitiveness4). The French Treasury Department5 pointed this out when it broke down the average annual change in price-competitiveness for the 2001-2012 period (see Fig. 10). This position weighed on cash-flow levels (see Fig. 15) at French companies, thereby slowing R&D spending (Fig. 11) and their moves up-scale. It is a vicious circle that contrasts with the situation in Germany, which has nurtured its non-price competitiveness by focusing its investments on a qualitative and innovative offering since the 1990s.
Moreover, against an erratic foreign exchange backdrop, an export group that has costs primarily denominated in euros and sales in local currencies may suffer a decline in profitability. To dilute this transactional impact, companies that are innovative and/or positioned in the upscale segment can increase their prices, rather than reduce their exported volumes. For example, SEB anticipated this effect and increased its prices by 10% in 2016 (doubling them in Russia and the Ukraine), which we estimate at least halved the contraction of profit caused by exchange rate fluctuations (i.e. EUR120m contraction effect upon an EBIT of EUR505m in 2016). This French household appliances group is a good example of a successful player whose constant innovations, for example Actifry – to which Oprah Winfrey took a shine – has enabled it to create solid pricing power with an R&D budget of 3.5%. The group should be strengthened by the recent acquisition of German upscale rival WMF, whose contribution to SEB’s sales is set to reach almost 25% in 2017.
SECTOR COMPANIES / DEAL YEAR
AUTONOMOUS CAR Intel / Mobileye 2017
BUSINESS SERVICES AccorHotels / Onefinestay 2016
BUSINESS SERVICES AccorHotels / John Paul 2016
FOOD Danone / WhiteWave 2017
FOOD RETAIL Amazon / WFM 2017
HEALTHCARE Roche / Genentech 2009
HEALTHCARE Sanofi / Genzyme 2011
HEALTHCARE Johnson&Johnson / Actelion 2017
HEALTHCARE Gilead / Kite Pharma 2017
HPC SEB / WMF 2016
MEDTECH Zimmer Biomet / LDR Holding 2016
MEDTECH Boston Scientifics / Symetis 2017
MEDTECH Abbott / St Jude 2017
MOTOR Renault / Devialet 2016
MOTOR Faurecia / Parrot Automotive 2016/17
MOTOR Delphi / NuTonomy 2017
MOTOR Valeo / Gestigon 2017
UTILITIES Total / Saft 2016
FIG. 12: A FEW DEALS MOTIVATED MAINLY BY INNOVATION
Source: company data; Bryan, Garnier & Co
1918 | THE NEXT BIG GROWTH IDEA
French groups have gradually eaten into their profitability as a means of safeguarding their price competitiveness and market share.

3. Innovation and cherry picking at all costs
3.1 THE END TO STANDARDIZED MASS CONSUMPTION AT THE HEART OF INNOVATION
BIG DATA AND ARTIFICIAL INTELLIGENCE
Gartner estimates that 20.4bn connected objects will be in use by 2020, compared with 6.4bn in 2016. This will enable the collection of a colossal amount of information and make it possible to serve consumers and patients in a predictive manner. The 2.5 terabytes of data that we generate every day (it’s estimated to be 22.5 by 2020) already feed databases with ever-increasing capacity that is bolstered by cloud computing.
In the consumer segment, retailers want to evolve towards an increasingly predictive way of trading. They have massive, well-established databases that have been unused for way too long. Interpreting this data is now an efficient way to estimate customer needs and offer personalized recommendations, limiting returns that weigh on profitability (in apparel, 50% of purchases are returned). The main players see artificial intelligence as the major challenge they must deal with in coming years6.
2016 SPENDING
GROWTH 2017 SPENDING
GROWTH 2018 SPENDING
GROWTH
DATA CENTRE SYSTEMS 170 -0.3% 171 0.3% 173 1.2%
ENTERPRISE SOFTWARE 326 5.3% 351 7.6% 381 8.6%
DEVICES 630 -2.4% 654 3.8% 677 3.6%
IT SERVICES 894 3.2% 922 3.1% 966 4.7%
COMMUNICATION SERVICES 1,374 -1.3% 1,378 0.3% 1,400 1.6%
OVERALL IT 3,396 0.3% 3,477 2.4% 3,598 3.5%
FIG. 13: ESTIMATED IT SPENDING GLOBALLY
Source: Gartner
2120 | THE NEXT BIG GROWTH IDEA

In health, Orange Healthcare7 sees data from Big Data and genomics multiplying 50x between now and 2020. Non-observance of treatments, estimated by the Montaigne Institute8 in 2015 to cost up to EUR9bn a year, could be reduced by 80% by 2025. Big Data holds out the promise of more efficient medicine that could become more predictive, preventive, personalized and participative. This prospect has been behind several large mergers, for example the agreement made in January 2016 between Novartis and Qualcomm (to develop an inhaler connected to the Life’s2net platform), or even the acquisition by IBM of Truven Health Analytics (cloud platform for medical analysis and data) in February 2016.
PERSONALIZING PRODUCTS, COUPLED WITH CONCERN FOR HEALTH, ETHICS AND ECOLOGY, ARE BECOMING DOMINANT FEATURES OF CONSUMPTION
Today’s younger generations question traditional brands, which until recently have only offered mass produced standardized goods, in favour of niche products that reflect local, individualized know-how. Traditional companies can no longer just sit back and offer generic products. Like groups such as L’Oréal, they need to adopt a dynamic strategy to build relations with their customers, for example using social networks and online channels like YouTube, while offering a personalized purchase experience no matter which channel a customer uses. The physical network needs to be at the heart of this “omnichannel strategy”, as illustrated by Amazon’s recent bid for Whole Foods Markets.
This personalization goes hand in hand with rising consumer demands for products that are ethically produced, healthy and environmentally friendly. At a time when consumers are concerned about ecological issues as well as financial debt, a general trend to get “back to nature” is at the heart of major financial opportunities driving the development of
new eco services and products (organic products represent around 6-7% of the FMCG market in France and are posting growth of more than 20%). Against this backdrop, we believe a quality war (product, health, ethics and ecology) could replace the price war and prompt a reassessment of mass consumption (e.g. the tremendous success of the sustainable milk brand in France, “C’est qui le Patron!”).
IN HEALTHCARE, THE PERSONALIZATION TREND IS GROWING TOO9
This goal of individualized know-how is also relevant in the healthcare segment. As research into the human genome progresses, it seems that there is neither a unique pathology, nor any single remedy common to all patients. On the contrary, when a threat is identified, healthcare staff can dig into a therapeutic arsenal and carry out a “surgical strike” – an individualized intervention – rather than a “mass bombardment”.10 Multifactor diseases therefore imply the use of a therapeutic cocktail, and ownership of the ingredients is becoming key.
This trend towards individualizing healthcare is feeding a wave of acquisitions that favors the most innovative niche-market players, at the price of stratospheric multiples. This is exactly what happened in the case of Symetis (a Swiss medtech specialized in transcatheter aortic valve implants – TAVI), ultimately bought by Boston Scientific at the end of March 2017 for c. EUR400m, just before the company’s IPO for an estimated value of c. EUR250m. Nine clinical studies, some of which explicitly aimed to prove the efficacy of Symetis products relative to rivals, ended up disturbing the market dominance of an oligopoly made up of Abbott, Edwards Life Science, Medtronics and Boston Scientific. On the basis of this experience, we estimate that many companies could also be particularly attractive prey, with extremely high multiples.
2322 | THE NEXT BIG GROWTH IDEA
5.5
6.5
7.5
8.5
9.5
2007 2008 2009 2010 2011 2012 2013 2014 2015 2016 2017
STOXX 600 (MEDIAN MULTIPLE) ARGOS SODITIC (MEDIAN TRANSACTION MULTIPLE)
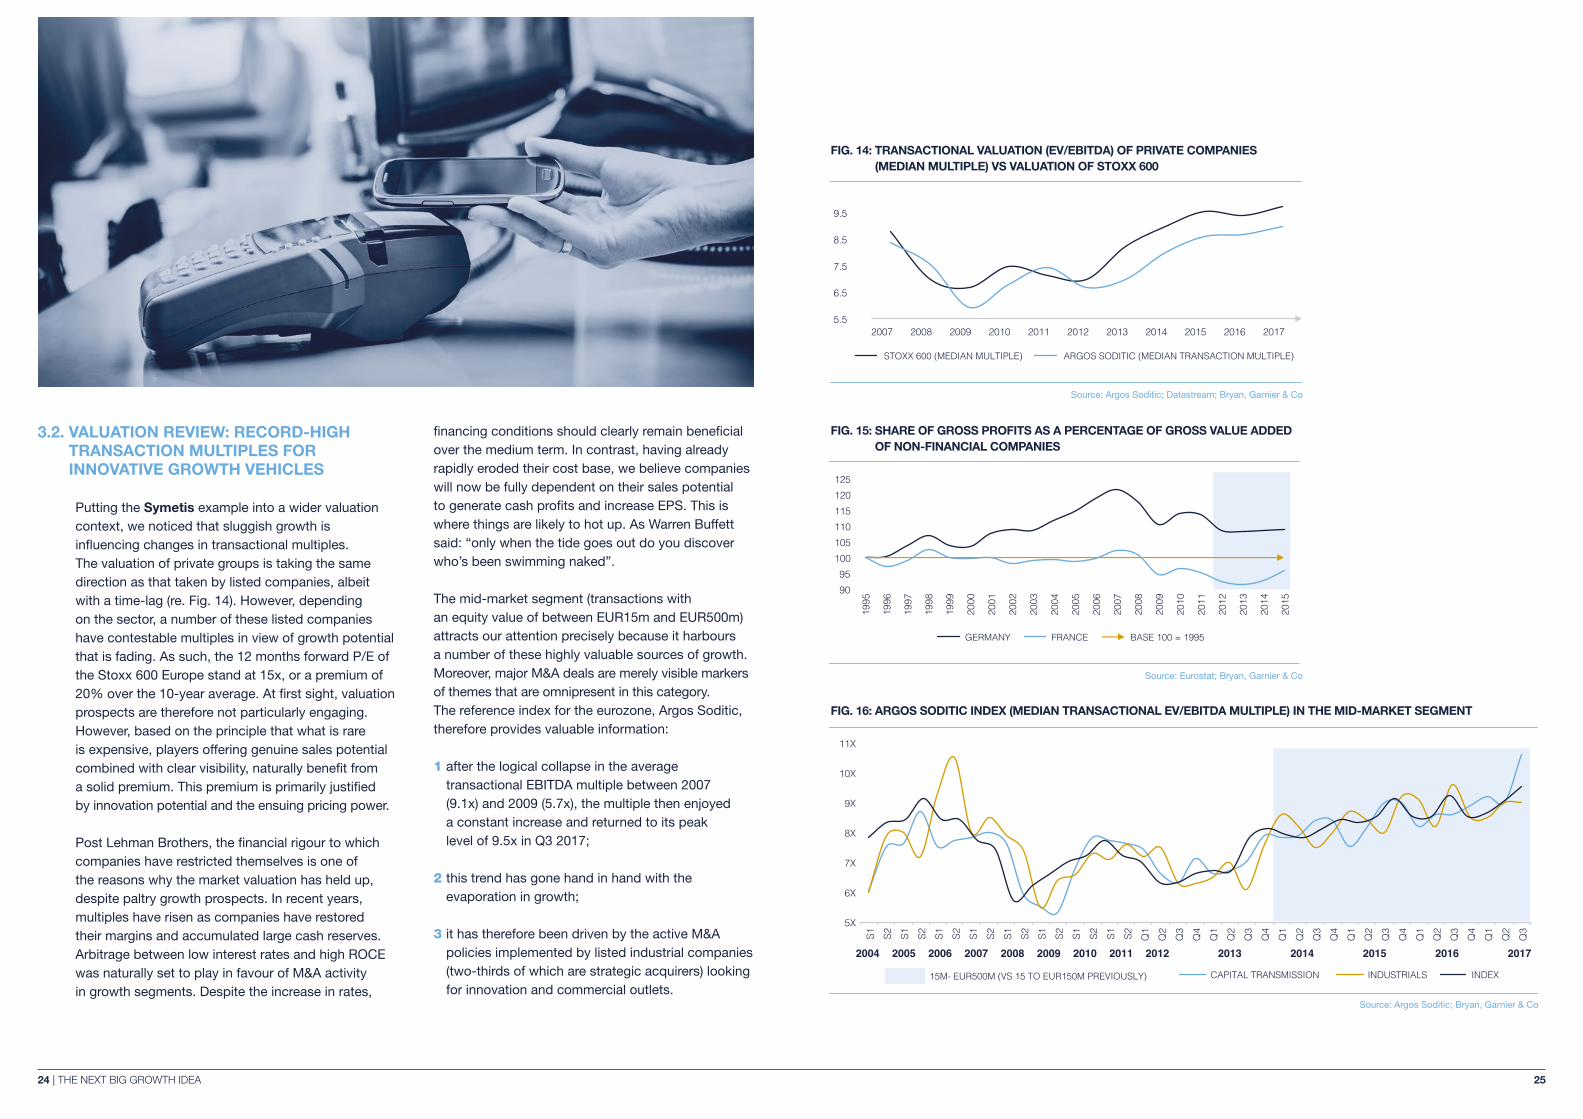
FIG. 14: TRANSACTIONAL VALUATION (EV/EBITDA) OF PRIVATE COMPANIES (MEDIAN MULTIPLE) VS VALUATION OF STOXX 600
Source: Argos Soditic; Datastream; Bryan, Garnier & Co
1995
1996
1997
1998
1999
2000
2001
2002
2003
2004
2005
2006
2007
2008
2009
2010
2011
2012
2013
2014
2015
GERMANY FRANCE BASE 100 = 1995
9095
100105110115120125
FIG. 15: SHARE OF GROSS PROFITS AS A PERCENTAGE OF GROSS VALUE ADDED OF NON-FINANCIAL COMPANIES
Source: Eurostat; Bryan, Garnier & Co
2004 2005 2006 2007 2008 2009 2010 2011 2012 2013 2014 2015 2016 2017
5X
6X
7X
8X
9X
10X
11X
S1 S2 S1 S2 S1 S2 S1 S2 S1 S2 S1 S2 S1 S2 S1 S2 Q1
Q2
Q3
Q4
Q1
Q2
Q3
Q4
Q1
Q2
Q3
Q4
Q1
Q2
Q3
Q4
Q1
Q2
Q3
Q4
Q1
Q2
Q3
15M- EUR500M (VS 15 TO EUR150M PREVIOUSLY) CAPITAL TRANSMISSION INDUSTRIALS INDEX
FIG. 16: ARGOS SODITIC INDEX (MEDIAN TRANSACTIONAL EV/EBITDA MULTIPLE) IN THE MID-MARKET SEGMENT
Source: Argos Soditic; Bryan, Garnier & Co
3.2. VALUATION REVIEW: RECORD-HIGH TRANSACTION MULTIPLES FOR INNOVATIVE GROWTH VEHICLES
Putting the Symetis example into a wider valuation context, we noticed that sluggish growth is influencing changes in transactional multiples. The valuation of private groups is taking the same direction as that taken by listed companies, albeit with a time-lag (re. Fig. 14). However, depending on the sector, a number of these listed companies have contestable multiples in view of growth potential that is fading. As such, the 12 months forward P/E of the Stoxx 600 Europe stand at 15x, or a premium of 20% over the 10-year average. At first sight, valuation prospects are therefore not particularly engaging. However, based on the principle that what is rare is expensive, players offering genuine sales potential combined with clear visibility, naturally benefit from a solid premium. This premium is primarily justified by innovation potential and the ensuing pricing power.
Post Lehman Brothers, the financial rigour to which companies have restricted themselves is one of the reasons why the market valuation has held up, despite paltry growth prospects. In recent years, multiples have risen as companies have restored their margins and accumulated large cash reserves. Arbitrage between low interest rates and high ROCE was naturally set to play in favour of M&A activity in growth segments. Despite the increase in rates,
financing conditions should clearly remain beneficial over the medium term. In contrast, having already rapidly eroded their cost base, we believe companies will now be fully dependent on their sales potential to generate cash profits and increase EPS. This is where things are likely to hot up. As Warren Buffett said: “only when the tide goes out do you discover who’s been swimming naked”.
The mid-market segment (transactions with an equity value of between EUR15m and EUR500m) attracts our attention precisely because it harbours a number of these highly valuable sources of growth. Moreover, major M&A deals are merely visible markers of themes that are omnipresent in this category. The reference index for the eurozone, Argos Soditic, therefore provides valuable information:
1 after the logical collapse in the average transactional EBITDA multiple between 2007 (9.1x) and 2009 (5.7x), the multiple then enjoyed a constant increase and returned to its peak level of 9.5x in Q3 2017;
2 this trend has gone hand in hand with the evaporation in growth;
3 it has therefore been driven by the active M&A policies implemented by listed industrial companies (two-thirds of which are strategic acquirers) looking for innovation and commercial outlets.
2524 | THE NEXT BIG GROWTH IDEA

Conclusion
Across the FMCG, healthcare and technology sectors, innovation has emerged as the important spur for growth – and targeted M&A is seen as the way to achieve it.
Groups are sensing a profound change in their markets. The decades-old model of ‘mass consumption’ – in which huge volumes of similar products and services are pushed out to broadly segmented audiences – is coming to an end. In its place is a new world of individualization and personalization, where custom products and offers are precision-targeted to tightly defined audiences.
This new paradigm is not what incumbents are accustomed to. Adapting to it will require a great shift in the way established companies think and operate. Growing this capacity organically is difficult, especially when competing against a giant like Amazon that has this super-personalized capability built in to its operating model.
M&A is one way to find the innovation that will drive growth. The groups that succeed will either be those that have shown a proven ability to innovate in the past, or those with a balance sheet strong enough to allow them to cherry-pick the best acquisitions. Whichever route they choose, data-driven innovation is essential if companies are to adapt to the new model of personalized consumption. 1: In a Bryan, Garnier & Co research report
published November 2015 (“Anorexic growth… the bigger the better!”), we questioned the rationale behind recent M&A deals in the food retail sector, where large mergers have often turned out to be a nightmare. Antoine Parison, Equity Research Analyst, wrote: “Why the flirting between Ahold and Delhaize or Auchan and Système U? Because we are witnessing a change in paradigm, which for a large number of mature retailers has meant that solid and recurring growth has sunk to a spasmodic pace limited to just a few points (a disruptive factor in a fixed-cost industry). Against this backdrop, size provides a key asset for large players who can dilute fixed costs over a far denser store network and obtain additional ammunition for nurturing their price and non-price competitiveness”.
2: In a Bryan, Garnier & Co research report published July 2016 (“Semiconductors Looking for lost growth”), Dorian Terral, our Semiconductors Equity Research Analyst focused precisely on the evaporation of growth potential within the industry and the subsequent wave of M&A. He wrote: “While many observers consider that the record number of M&A operations seen in 2015 reflect a search for critical mass (and hence operating leverage), we are convinced
that in the majority of cases, acquisitions are above all motivated by an aim to deliver short-term growth forecasts. We believe that, for the semiconductors industry, the preconceived idea that size is a success factor is no longer true. In contrast, we are convinced that in today’s market focusing on unique expertise and a strong positioning in a small number of verticals is preferable”.
3: See the industrial economy review no° 114, 4th quarter 2013
4: Pacte pour la compétitivité de l’industrie française (Pact for French industry competitiveness) | The Gallois Report | 2012
5: L’industrie: quels défis pour l’economie française? (Industry: what challenges for the French economy?) | Letter no. 134 | The French Treasury Department |September 2014
6: In our white paper published November 2017 (The Future of Retail is Now - Today, success means mixing “phygital” and “retailtainment”), we focused on the technological dimension of digital transformation. We wrote: « As traditional retailers rush to keep up with the revolution started by Amazon, they are initiating a wave of M&A activity that may see many retailers transform themselves, in effect, into technology companies ».
7: Big Data et santé: la révolution inéluctable | Orange Healthcare | 2016
8: Institut Montaigne | Faire de la France un champion de la révolution numérique | 2015
9: “The organisation of our healthcare system needs to evolve to improve the patient care-path and access to care, by using innovative organisational projects. Indeed, our healthcare system is characterised by a partitioned care offer, whereas patients are increasingly suffering from complex pathologies that require a coordinated care response. In addition, current financing models prevent us from moving towards an efficient and coordinated organisation of care”. Ministry of Health, France, September 2017
10: In a recent Bryan, Ganier & Co research report (“Our key take-aways from ESMO 2017”), our healthcare team highlighted the need to find biomarkers to develop targeted treatments, while referring to ‘payment on performance’, which is becoming more widespread and aims just to remunerate the effective outcome of a treatment. We are moving further and further away from a “one size fits all” stance in all fields (i.e. detection, treatment and reimbursement).
For the reports cited in the footnotes 1, 2 and 10, please write to your Bryan, Garnier & Co contact directly.
3.3. EXAMPLE OF COMPANIES LEADING THE INNOVATION CHALLENGE
SECTOR STOCK MARKET CAP (M).
BUSINESS SERVICES Accor 11 999
CONSUMER GOODS SEB 7 894
FOOD PRODUCERS Danone 46 608
HEALTHCARE AstraZeneca 63 386
HEALTHCARE Ipsen 8 675
HPC L’Oréal 104 160
LUXURY LVMH 125 252
TECH SAP 118 637
TECH STMicroelectronics 18 623
UTILITIES ENGIE 35 117
Footnotes
Source: Bryan, Garnier & Co
2726 | THE NEXT BIG GROWTH IDEA

White Paper Contributors
GREG REVENUManaging Partner
Investment Banking
ANTOINE PARISONEquity Research Analyst
Retail & E-commerce
HERVE RONINPartner
Healthcare
OLIVIER PAUCHAUTHead of Research
CHARLES TELLIERManaging Director
Consumer, Brands & Retail
Equity Research Analyst Team
MANAGING PARTNER
Eric Le Berrigaud | Healthcare
MANAGING DIRECTORS
Olivier Pauchaut | Head of Research | Insurance
Gary Waanders | Healthcare
ANALYSTS & RESEARCH ASSOCIATES
Richard-Maxime Beaudoux | Video Games & Payments
Dr Jamila El Bougrini | Healthcare
Xavier Caroen | Automotive Technologies
Pierre Antoine Chazal | Smart Energy
Thomas Coudry | Telecoms
Nikolaas Faes | Beverages
Clement Genelot | Consumer, Brands & Retail
Eric Lemarié | Construction & Infrastructure
Marion Levi | Healthcare
Loïc Morvan | Luxury & Cosmetics
Antoine Parison | Retail & E-commerce
Gregory Ramirez | Software & IT Services
Bruno de la Rochebrochard | Hotels & Business Services
Cédric Rossi | Consumer Goods & E-commerce
Virgine Roumage | Food & Beverages
Hugo Solvet | Healthcare
Dorian Terral | Semiconductors
Fréderic Yoboué | Technology, Media & Telecoms
With seasoned research methodology and fundamental bottom-up approach, Bryan, Garnier’s analysts provide opinionated investment insights with leading perspective across the most dynamic Technology sectors in Europe. Bryan Garnier & Co developed the most dedicated Technology research platform in Europe, with more than 150 stocks covered.
Investment Banking Team
Since 1996, more than 300 companies have trusted us to deliver more than €10 billion in investment banking transactions, raising private and public financing, as well as advising on mergers and acquisitions.
DIRECTORS & VICE PRESIDENTS
Jonathan Bohbot
Lars Dürschlag
Romain Ellul
Jonathan Foiret-Hurbin
Dr Nicholas Hanser
Marc-Antoine Janny
Berk Kirca
Pierre Lafitte
Frans-Matthis Pleie
Charlie Pujo
Dr Anne Moore
Cosme Rosellini
ASSOCIATES & ANALYSTS
Priyanshu Bhattacharya
Alexandre Brestin
Alberto Bravo
Pierre Cuer
Clement Decante
Mickael Dubourd
Guillaume Lallouet
Rémi Negre
Jean de Pracomtal
Marc-Antoine Serfaty
Jakub Simon
Awa Sow
PARTNERS & SENIOR ADVISORS
Jean Cailliau | Consumer, Brands & Retail
Olivier Beaudouin | Technology & Smart Industries
Hermann Eul | Technology
Olivier Garnier | Healthcare
Falk Müller-Veerse | Technology
Guillaume Nathan | Digital Media & Business Services
Eckhart Ortwein | Software & Mobile Payment
Marc Picard | Business Services
Olivier Perraudin | Telecoms
Greg Revenu | Technology
Hervé Ronin | Healthcare
Thibaut De Smedt | Application Software
MANAGING DIRECTORS
Sandrine Cailleteau | Healthcare
Dan Dysli | Healthcare
Stanislas de Gmeline | Business Services
Pierre Kiecolt-Wahl | Equity Capital Markets
Jay Marathe | Technology & Smart Industries
Philippe Patricot | Technology
Charles Tellier | Consumer, Brands & Retail
Phil Walker | Healthcare
Dominic Wilson | Healthcare
Private PlacementInvestors including
€ 100 000 000Sole Placement Manager
About Bryan, Garnier & Co
Bryan, Garnier & Co is a European, full service growth-focused independent investment banking partnership founded in 1996. The firm provides equity research, sales and trading, private and public capital raising as well as M&A services to growth companies and their investors. It focuses on key growth sectors of the economy including Technology, Media, Telecoms, Healthcare, Smart Industries and Energy, Consumer, Brands & Retail and Business Services. Bryan, Garnier & Co Ltd is a fully registered broker dealer authorized by the FCA in Europe and the FINRA in the U.S. Bryan, Garnier & Co is headquartered in London, with additional offices in Paris, Munich and New York. The firm is a member of the London Stock Exchange and Euronext.
Corporate Transactions
Bryan, Garnier & Co leverage in-depth sector expertise to create fruitful and long lasting relationships between investors and European growth companies.
Strategic Investment
UndisclosedSole Advisor to the Sellers
Acquired by
UndisclosedSole Advisor to the Sellers
Euronext IPO € 61 900 000 and Subsequent Sale to
€ 435 000 000Sole Global Coordinator & Joint Bookrunner
Sole Advisor to the Company
Nasdaq 100
€ 230 000 000Co-Manager
2928 | THE NEXT BIG GROWTH IDEA
LONDON
Beaufort House
15 St. Botolph Street
London, EC3A 7BB
UK
T: +44 (0) 20 7332 2500
F: +44 (0) 20 7332 2559
Authorized and regulated by the Financial Conduct Authority (FCA)
PARIS
26 Avenue des Champs Elysées
75008 Paris
France
T: +33 (0) 1 56 68 75 00
F: +33 (0) 1 56 68 75 01
Regulated by the Financial Conduct Authority (FCA) and the Autorité de Contrôle prudential et de resolution (ACPR)
MUNICH
Widenmayerstrasse 29
80538 Munich
Germany
T: +49 89 2422 62 11
NEW YORK
750 Lexington Avenue
New York, NY 10022
USA
T: +1 (0) 212 337 7000
F: +1 (0) 212 337 7002
FINRA and SIPC member
This document is classified under the FCA Handbook
as being investment research (independent research).
Bryan Garnier & Co Limited has in place the measures
and arrangements required for investment research
as set out in the FCA’s Conduct of Business Sourcebook.
This report is prepared by Bryan Garnier & Co Limited,
registered in England Number 03034095 and its MIFID
branch registered in France Number 452 605 512.
Bryan Garnier & Co Limited is authorized and
regulated by the Financial Conduct Authority (Firm
Reference Number 178733) and is a member of the
London Stock Exchange. Registered address:
Beaufort House 15 St. Botolph Street, London EC3A 7BB,
United Kingdom.
This Report is provided for information purposes only
and does not constitute an offer, or a solicitation of an
offer, to buy or sell relevant securities, including securities
mentioned in this Report and options, warrants or rights
to or interests in any such securities. This Report is for
general circulation to clients of the Firm and as such is
not, and should not be construed as, investment advice or
a personal recommendation. No account is taken of the
investment objectives, financial situation or particular needs
of any person.
The information and opinions contained in this Report
have been compiled from and are based upon generally
available information which the Firm believes to be
reliable but the accuracy of which cannot be guaranteed.
All components and estimates given are statements
of the Firm, or an associated company’s, opinion only
and no express representation or warranty is given or
should be implied from such statements. All opinions
expressed in this Report are subject to change without
notice. To the fullest extent permitted by law neither the
Firm nor any associated company accept any liability
whatsoever for any direct or consequential loss arising
from the use of this Report. Information may be available
to the Firm and/or associated companies which are
not reflected in this Report. The Firm or an associated
company may have a consulting relationship with a
company which is the subject of this Report.
This Report may not be reproduced, distributed
or published by you for any purpose except with the
Firm’s prior written permission. The Firm reserves all
rights in relation to this Report.
Past performance information contained in this Report
is not an indication of future performance. The information
in this report has not been audited or verified by an
independent party and should not be seen as an
indication of returns which might be received by investors.
Similarly, where projections, forecasts, targeted or
illustrative returns or related statements or expressions
of opinion are given (“Forward Looking Information”)
they should not be regarded as a guarantee, prediction
or definitive statement of fact or probability. Actual events
and circumstances are difficult or impossible to predict
and will differ from assumptions. A number of factors,
in addition to the risk factors stated in this Report, could
cause actual results to differ materially from those in any
Forward Looking Information.
Disclosures specific to clients in the United Kingdom
This Report has not been approved by Bryan Garnier
& Co Limited for the purposes of section 21 of the
Financial Services and Markets Act 2000 because it is
being distributed in the United Kingdom only to persons
who have been classified by Bryan Garnier & Co Limited
as professional clients or eligible counterparties. Any
recipient who is not such a person should return the
Report to Bryan Garnier & Co Limited immediately
and should not rely on it for any purposes whatsoever.
NOTICE TO US INVESTORS
This research report (the “Report”) was prepared
by Bryan Garnier & Co Limited for information purposes
only. The Report is intended for distribution in the
United States to “Major US Institutional Investors”
as defined in SEC Rule 15a-6 and may not be furnished
to any other person in the United States. Each Major
US Institutional Investor which receives a copy of this
Report by its acceptance hereof represents and agrees
that it shall not distribute or provide this Report to any other
person. Any US person that desires to effect transactions
in any security discussed in this Report should call or write
to our US affiliated broker, Bryan Garnier Securities, LLC.
750 Lexington Avenue, New York NY 10022.
Telephone: 1-212-337-7000.
This Report is based on information obtained from
sources that Bryan Garnier & Co Limited believes to
be reliable and, to the best of its knowledge, contains
no misleading, untrue or false statements but which it has
not independently verified. Neither Bryan Garnier & Co
Limited and/or Bryan Garnier Securities LLC make
no guarantee, representation or warranty as to its
accuracy or completeness. Expressions of opinion
herein are subject to change without notice. This Report
is not an offer to buy or sell any security.
Bryan Garnier Securities, LLC and/or its affiliate, Bryan
Garnier & Co Limited may own more than 1% of the
securities of the company(ies) which is (are) the subject
matter of this Report, may act as a market maker in the
securities of the company(ies) discussed herein, may
manage or co-manage a public offering of securities for
the subject company(ies), may sell such securities to
or buy them from customers on a principal basis and
may also perform or seek to perform investment banking
services for the company(ies).
Bryan Garnier Securities, LLC and/or Bryan Garnier & Co
Limited are unaware of any actual, material conflict
of interest of the research analyst who prepared this
Report and are also not aware that the research analyst
knew or had reason to know of any actual, material
conflict of interest at the time this Report is distributed
or made available.
IMPORTANT INFORMATION


