76


The Nova Scotia Seniors’ SecretariatThe Secretariat facilitates the planning, development, and coordination of policies, programs, and services for seniors in partnership with government departments, seniors,and voluntary seniors groups. It also serves as a single entry point to Government, providing information on programs and services for seniors and responding to seniors’issues and concerns.
The Nova Scotia Seniors’ Secretariat consists of the Minister of Health, Minister ofCommunity Services, Minister of Education, Minister of Service Nova Scotia andMunicipal Relations, and Minister of Health Promotion. The Minister of Health serves asthe Chairperson of the Secretariat and is Nova Scotia’s Minister Responsible for Seniors.The Secretariat is staffed by an Executive Director and six permanent staff.
Contact Information:Toll-free: 1-800–670-0065Phone: (902) 424–6322E-Mail: [email protected]: www.gov.ns.ca/scs
© Crown copyright, Province of Nova Scotia, 2005
ISBN: 0-88871-953-1
Published in conventional and electronic form by Communications Nova Scotia.
Cover designed by Laura Graham
This publication is available on the Internet at <www.gov.ns.ca/scs/publications.htm>.
Foreword ............................................................. 1
Highlights ........................................................... 3
Population Characteristics ........................ 9
Current Population .................................. 9
Population Projections ........................ 10
Population by County ......................... 18
Population by Townand Regional Municipality ............... 20
Health ................................................................. 23
Life Expectancy ........................................ 23
Smoking ....................................................... 25
Physician Visits ......................................... 26
Emergency, Outpatient,and Surgery Services ............................ 27
Day Surgery ............................................... 28
Hospitalization ........................................ 30
Cause of Death ........................................ 32
Mental Health .......................................... 34
Seniors’ Pharmacare ............................. 35
Adult Protection ..................................... 36
Diversity ............................................................ 37
Mi’kmaq Population ............................ 37
Language .................................................... 39
Living Arrangements ................................. 41
Family and Marital Status ................. 41
Housing Arrangements ...................... 44
Education and Literacy ............................ 45
Education .................................................... 45
Literacy ......................................................... 47
Employment ................................................... 49
Finances ............................................................. 51
Household Income ................................ 51
Sources of Income ................................. 53
Low Income ............................................... 56
Home Ownership ................................... 59
Family Expenditures ............................. 62
Income Security ............................................ 65
Old Age Security ..................................... 65
Guaranteed Income Supplement 66
Caring ................................................................. 69
Receiving Care ......................................... 69
Providing Child Care ............................ 72
Generosity .................................................. 74
Disability ........................................................... 75
Leisure ................................................................ 77
Travel ............................................................. 77
Pet Ownership ......................................... 78
CONTENTS

As the title suggests, Seniors’ Statistical Profile 2005 provides clear and accurate informationabout older Nova Scotians. The report enables Nova Scotians of all ages to develop a better understanding of the characteristics of the province’s older population and promotes a realistic picture of later years. The report will be of interest to anyone wantingto learn more about Nova Scotia seniors. This includes seniors, seniors’ organizations andclubs, educators, researchers, planners, and entrepreneurs. The publication will also raiseawareness and understanding of seniors’ issues.
The data is drawn from a variety of sources, including Statistics Canada, Social DevelopmentCanada, the Nova Scotia Department of Health, and the Nova Scotia Department ofFinance. The efforts of the Department of Health’s Health Economics Division andPerformance Measurement and Health Informatics Division and the Department ofFinance’s Nova Scotia Statistical Agency deserve a special note of appreciation for producingcustomized data for this report.
The report covers the following 10 topics: population characteristics, health, diversity, living arrangements, education and literacy, employment, finances, income security, caring,and leisure. The Highlights section provides an overview of the key findings in the report.
For the purpose of this report, seniors are defined as anyone 65 years of age or older.Generally, the basis for comparison is other age groups. Since seniors are not a homogenousgroup, they are subdivided into more specific age groups when possible. Also, where practical and possible, statistics for women and men are separated.
Seniors’ Statistical Profile will be updated regularly to incorporate the most current information.
1
Seniors’ Statistical Profile 2005
FOREWORD
POPULATION CHARACTERISTICS
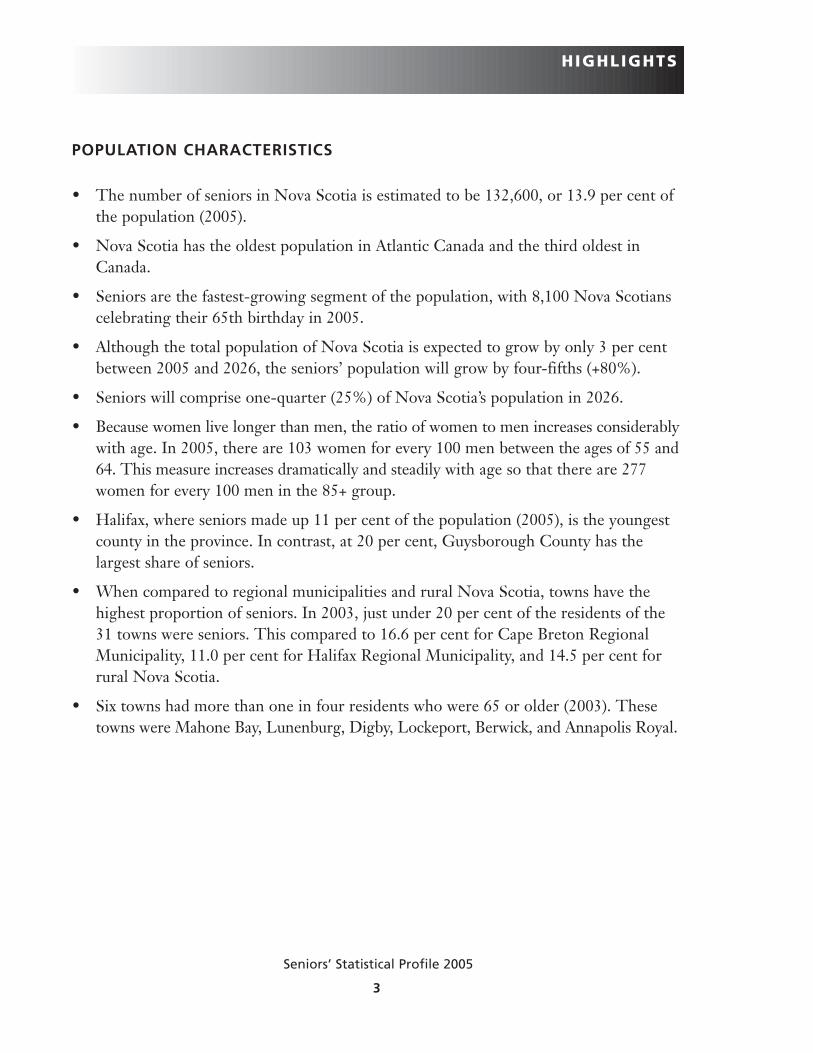
• The number of seniors in Nova Scotia is estimated to be 132,600, or 13.9 per cent ofthe population (2005).
• Nova Scotia has the oldest population in Atlantic Canada and the third oldest inCanada.
• Seniors are the fastest-growing segment of the population, with 8,100 Nova Scotianscelebrating their 65th birthday in 2005.
• Although the total population of Nova Scotia is expected to grow by only 3 per centbetween 2005 and 2026, the seniors’ population will grow by four-fifths (+80%).
• Seniors will comprise one-quarter (25%) of Nova Scotia’s population in 2026.
• Because women live longer than men, the ratio of women to men increases considerablywith age. In 2005, there are 103 women for every 100 men between the ages of 55 and64. This measure increases dramatically and steadily with age so that there are 277women for every 100 men in the 85+ group.
• Halifax, where seniors made up 11 per cent of the population (2005), is the youngestcounty in the province. In contrast, at 20 per cent, Guysborough County has thelargest share of seniors.
• When compared to regional municipalities and rural Nova Scotia, towns have thehighest proportion of seniors. In 2003, just under 20 per cent of the residents of the31 towns were seniors. This compared to 16.6 per cent for Cape Breton RegionalMunicipality, 11.0 per cent for Halifax Regional Municipality, and 14.5 per cent forrural Nova Scotia.
• Six towns had more than one in four residents who were 65 or older (2003). Thesetowns were Mahone Bay, Lunenburg, Digby, Lockeport, Berwick, and Annapolis Royal.
3
Seniors’ Statistical Profile 2005
HIGHLIGHTS
HEALTH
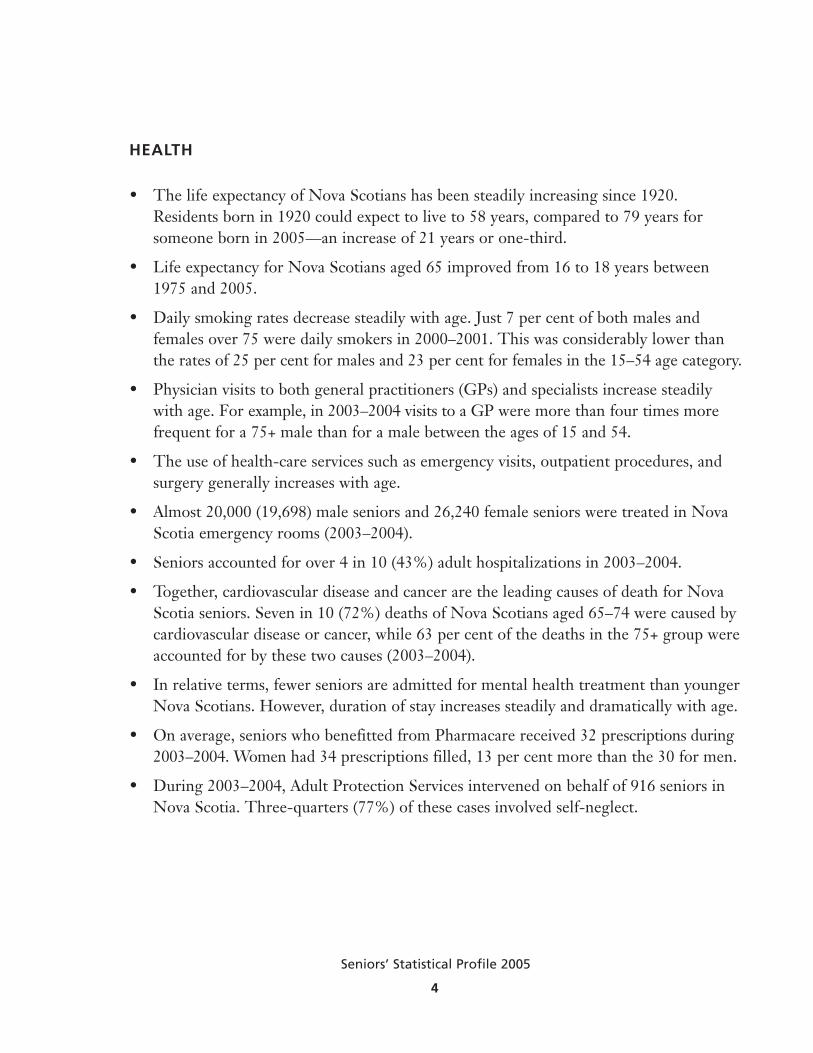
• The life expectancy of Nova Scotians has been steadily increasing since 1920.Residents born in 1920 could expect to live to 58 years, compared to 79 years forsomeone born in 2005—an increase of 21 years or one-third.
• Life expectancy for Nova Scotians aged 65 improved from 16 to 18 years between1975 and 2005.
• Daily smoking rates decrease steadily with age. Just 7 per cent of both males andfemales over 75 were daily smokers in 2000–2001. This was considerably lower thanthe rates of 25 per cent for males and 23 per cent for females in the 15–54 age category.
• Physician visits to both general practitioners (GPs) and specialists increase steadilywith age. For example, in 2003–2004 visits to a GP were more than four times morefrequent for a 75+ male than for a male between the ages of 15 and 54.
• The use of health-care services such as emergency visits, outpatient procedures, andsurgery generally increases with age.
• Almost 20,000 (19,698) male seniors and 26,240 female seniors were treated in NovaScotia emergency rooms (2003–2004).
• Seniors accounted for over 4 in 10 (43%) adult hospitalizations in 2003–2004.
• Together, cardiovascular disease and cancer are the leading causes of death for NovaScotia seniors. Seven in 10 (72%) deaths of Nova Scotians aged 65–74 were caused bycardiovascular disease or cancer, while 63 per cent of the deaths in the 75+ group wereaccounted for by these two causes (2003–2004).
• In relative terms, fewer seniors are admitted for mental health treatment than youngerNova Scotians. However, duration of stay increases steadily and dramatically with age.
• On average, seniors who benefitted from Pharmacare received 32 prescriptions during2003–2004. Women had 34 prescriptions filled, 13 per cent more than the 30 for men.
• During 2003–2004, Adult Protection Services intervened on behalf of 916 seniors inNova Scotia. Three-quarters (77%) of these cases involved self-neglect.
4
Seniors’ Statistical Profile 2005
DIVERSITY
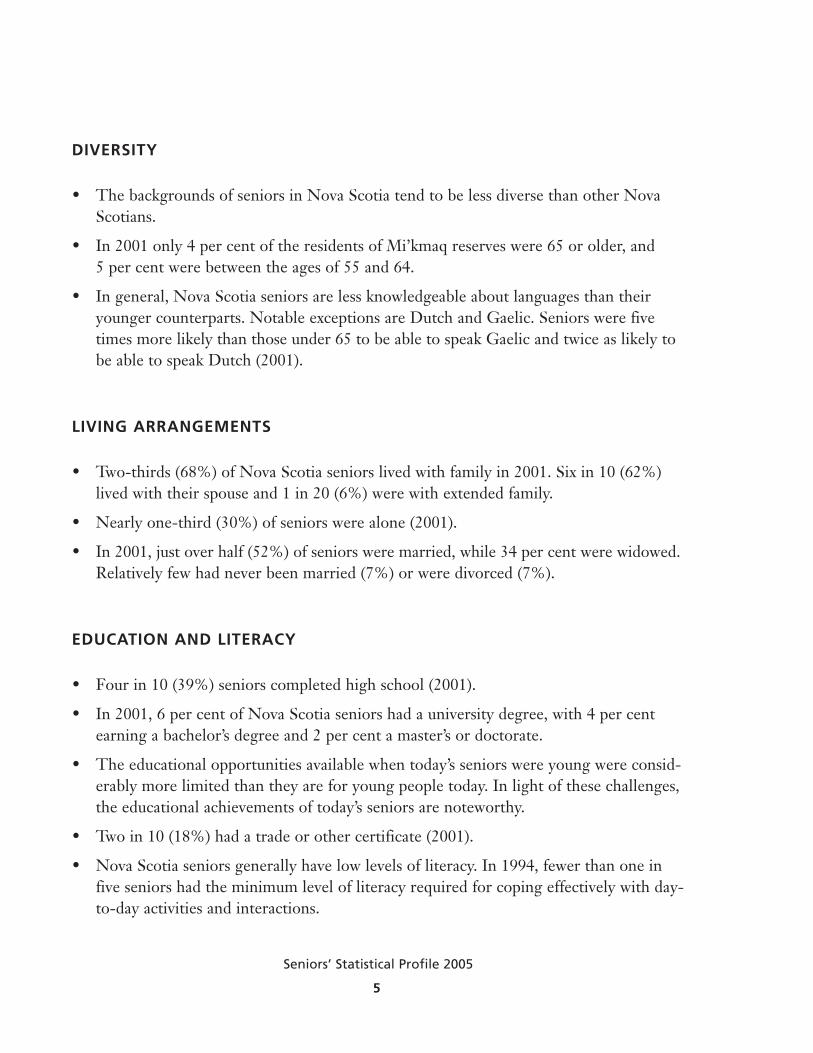
• The backgrounds of seniors in Nova Scotia tend to be less diverse than other NovaScotians.
• In 2001 only 4 per cent of the residents of Mi’kmaq reserves were 65 or older, and 5 per cent were between the ages of 55 and 64.
• In general, Nova Scotia seniors are less knowledgeable about languages than theiryounger counterparts. Notable exceptions are Dutch and Gaelic. Seniors were fivetimes more likely than those under 65 to be able to speak Gaelic and twice as likely tobe able to speak Dutch (2001).
LIVING ARRANGEMENTS
• Two-thirds (68%) of Nova Scotia seniors lived with family in 2001. Six in 10 (62%)lived with their spouse and 1 in 20 (6%) were with extended family.
• Nearly one-third (30%) of seniors were alone (2001).
• In 2001, just over half (52%) of seniors were married, while 34 per cent were widowed.Relatively few had never been married (7%) or were divorced (7%).
EDUCATION AND LITERACY
• Four in 10 (39%) seniors completed high school (2001).
• In 2001, 6 per cent of Nova Scotia seniors had a university degree, with 4 per centearning a bachelor’s degree and 2 per cent a master’s or doctorate.
• The educational opportunities available when today’s seniors were young were consid-erably more limited than they are for young people today. In light of these challenges,the educational achievements of today’s seniors are noteworthy.
• Two in 10 (18%) had a trade or other certificate (2001).
• Nova Scotia seniors generally have low levels of literacy. In 1994, fewer than one infive seniors had the minimum level of literacy required for coping effectively with day-to-day activities and interactions.
5
Seniors’ Statistical Profile 2005

EMPLOYMENT
• In 2001, 5 per cent of seniors were involved in paid employment.
• In 2001, 45 per cent of the 55–64 age group were employed.
• The number of older workers increased between 1996 and 2001. The increase inworkers aged 55–64 was dramatic (+28%), while employment among seniors increasedmore modestly (12%).
FINANCES
• Seniors tend to have lower incomes than their younger counterparts. In 2003, theaverage household income for the 77,000 senior households in the province was $33,300.
• Incomes among seniors were 40 per cent lower than among the 50–64 age group, and47 per cent below the under-50 group (2003).
• In 2003, three-quarters (74%) of seniors owned their home.
• Although 7 in 10 (71%) senior households owned a car, the rate of car ownership waslower than that of other age groups (2003).
• Younger seniors (65–74) have a somewhat higher income compared to older seniors(75+). In 2002, the average income for seniors between 65 and 74 was $25,200 or 11per cent more than the income of $22,700 received by older seniors.
• Seniors aged 65–74 derived nearly half (46%) of their incomes from Old Age Security(OAS) and Canada Pension Plan (CPP), followed by private pension (35%), investments(10%), and employment (10%).
• In 2002, more than half (54%) of the income for older seniors came from public benefits, while 32 per cent came from private pensions, 13 per cent from investments,and a modest 1 per cent from employment.
• Seniors’ incomes are lowest in Guysborough County and highest in Halifax County.Incomes were two-thirds higher in Halifax in 2002.
6
Seniors’ Statistical Profile 2005

• The overall incidence of poverty for Nova Scotia seniors is comparable to the rate foryounger adults in the 18–64 age group. Federal programs such as Old Age Security,Guaranteed Income Supplement, and Canada Pension Plan help ensure that most seniors are living above the poverty line. However, despite these income security programs, 3 in 20 seniors (15%), or 18,000 older Nova Scotians, were living below thelow-income cut-off (LICO) in 2001.
• The poverty rate for Nova Scotia seniors has generally been improving since 1981. At that time, nearly 4 in 10 (38%) older women and one-quarter of men were living inpoverty. Fortunately, the overall trend has been favourable during previous two decades.The incidence for women has declined from 38 per cent in 1981 to 20 per cent in 2001.The LICO is defined by Statistics Canada to represent the income level at which families are considerably worse off than average. In these situations, a substantial proportion of family income is going to essentials such as food, shelter, and clothing.
• Two-thirds (67%) of seniors living in economic hardship were women living by themselves (2001).
INCOME SECURITY
• In 2005, nearly 99 per cent of Nova Scotians 65 and older, or 131,000 seniors, collectedOld Age Security (OAS) in Nova Scotia.
• Nine out of 20 (44%) OAS recipients also benefitted from the Guaranteed IncomeSupplement (GIS: additional income support for low-income seniors).
• Over the past six years, there has been a gradual, but steady decline in the proportionof OAS recipients who also benefitted from GIS.
• Six in 10 (62%) seniors who collected GIS in 2005 were single.
• Single seniors who qualify for the GIS in either HRM or CBRM are at the greatestrisk of living below Statistics Canada’s LICO.
7
Seniors’ Statistical Profile 2005

CARING
• Although unpaid care is provided to seniors by persons of all ages, adults between 45and 54 are most likely to be caring for a senior. One-third (30%) of the members ofthis group contributed to the care of a senior in 2001.
• Seniors are very involved in the care of other seniors. In 2001, 3 in 20 (17%) seniorsprovided unpaid care to another senior.
• While men are often involved, women provide most of the care for seniors. One in 4(25%) women acted as a caregiver to a senior, compared to 17 per cent of men (2001).Women also spend more time caregiving.
• It is important to note that the provision of support in the home goes both ways.Thousands of Nova Scotia seniors provide unpaid child care. One in 10 or 12,900 seniors cared for a young child in 2001.
• Seniors are extremely generous. On average, in 2000, seniors donated $688 to charity—considerably more than the average of $488 for all ages.
• Seniors’ generosity is even more impressive in the context of their total expenditures.Over 2 per cent (2.3%) of senior household expenditures went to charity—almost fivetimes the rate for those under 55 (2000).
• The vast majority (86%) of senior households donated to charity in 2000.
• Of the $154 million in personal donations made by Nova Scotians in 2000, one-third(34%) or $52 million came from seniors.
LEISURE
• Nova Scotians continue to travel well into their later years. Seniors made 494,000trips within Nova Scotia in 2001. Each of these trips were at least 80 kilometres awayfrom home or involved an overnight stay.
• Older Nova Scotians are also active travellers outside the province. Seniors took72,000 trips to other provinces in Canada (2001).
• Although pet ownership declines with age, many Nova Scotia seniors benefitted fromthis relationship. Slightly under half (48%) of seniors owned a pet in 2000, comparedto 65 per cent in the 50–64 age group and 70 per cent of those under 50.
8
Seniors’ Statistical Profile 2005
CURRENT POPULATION
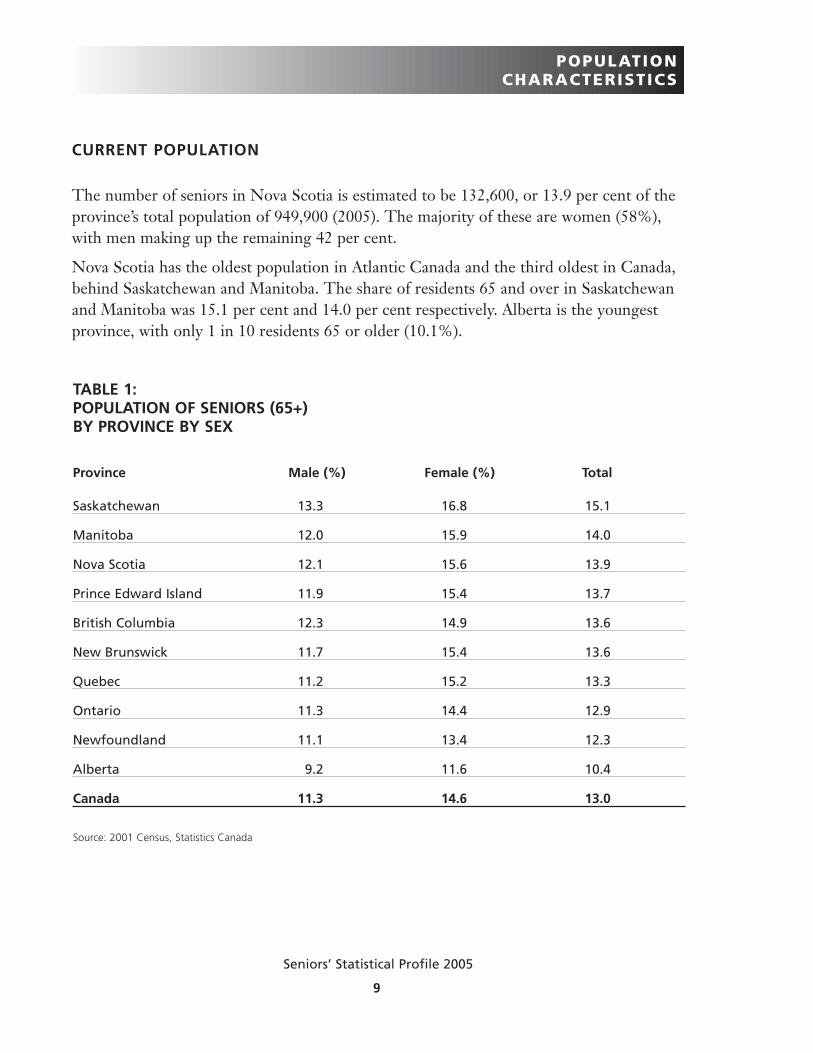
The number of seniors in Nova Scotia is estimated to be 132,600, or 13.9 per cent of theprovince’s total population of 949,900 (2005). The majority of these are women (58%),with men making up the remaining 42 per cent.
Nova Scotia has the oldest population in Atlantic Canada and the third oldest in Canada,behind Saskatchewan and Manitoba. The share of residents 65 and over in Saskatchewanand Manitoba was 15.1 per cent and 14.0 per cent respectively. Alberta is the youngestprovince, with only 1 in 10 residents 65 or older (10.1%).
9
Seniors’ Statistical Profile 2005
TABLE 1: POPULATION OF SENIORS (65+) BY PROVINCE BY SEX
Province Male (%) Female (%) Total
Saskatchewan 13.3 16.8 15.1
Manitoba 12.0 15.9 14.0
Nova Scotia 12.1 15.6 13.9
Prince Edward Island 11.9 15.4 13.7
British Columbia 12.3 14.9 13.6
New Brunswick 11.7 15.4 13.6
Quebec 11.2 15.2 13.3
Ontario 11.3 14.4 12.9
Newfoundland 11.1 13.4 12.3
Alberta 9.2 11.6 10.4
Canada 11.3 14.6 13.0
Source: 2001 Census, Statistics Canada
POPULATIONCHARACTERISTICS

POPULATION PROJECTIONS
The following population pyramids dramatically show the impact of an aging baby boomgeneration. In 2005, the bulge or largest age group is 40–45, producing a diamond-likeshape. Slightly smaller, yet still impressive in size, is the 45–49 group, followed by the50–54 segment.
Beyond age 50, the size of the groups gets progressively smaller with age. The decliningbirth rate is also apparent, with fewer and fewer people in the groups below 20–24. Alsoillustrated is the higher life expectancy for women. In the 90+ category, women outnumbermen by nearly four to one.
10
Seniors’ Statistical Profile 2005
Thousands
Source: Population Projections, Statistics Canada
FIGURE 1: NOVA SCOTIA POPULATION �BY AGE AND SEX, 2005
Age
50 40 30 20 10 0 10 20 30 40 50
0 – 45 – 9
10 – 1415 – 1920 – 2425 – 2930 – 3435 – 3940 – 4445 – 4950 – 5455 – 5960 – 6465 – 6970 – 7475 – 7980 – 8485 – 8990 +
Male Female
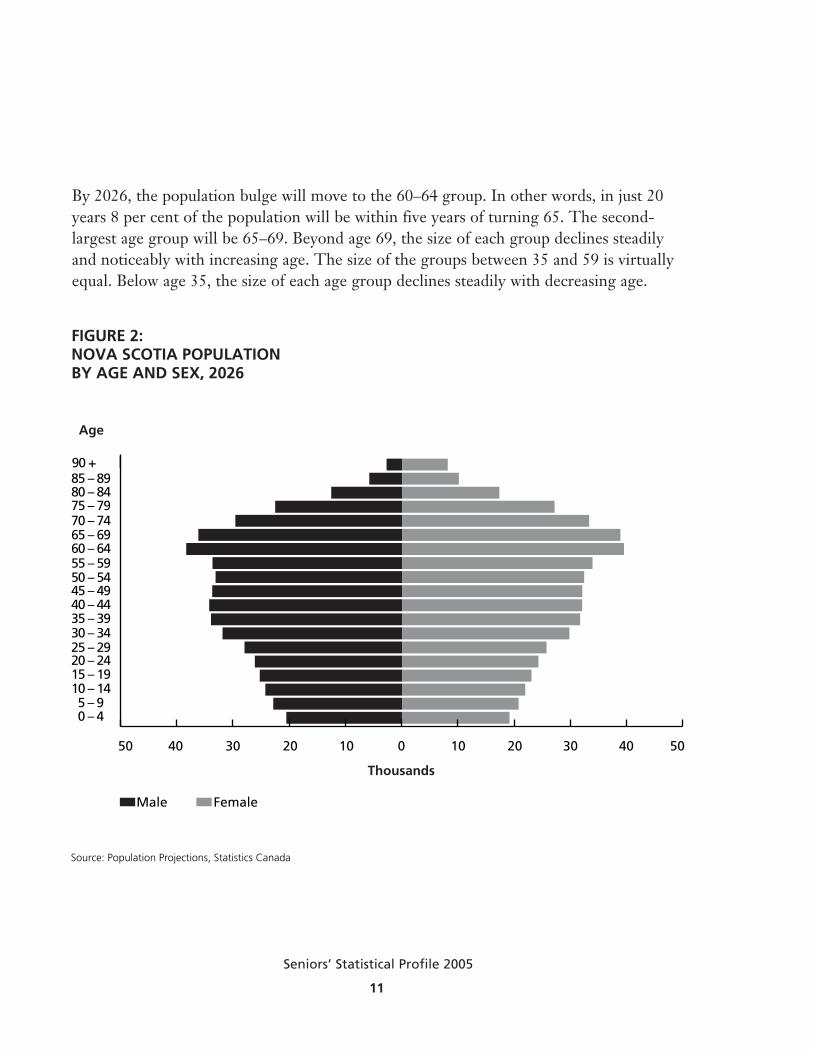
By 2026, the population bulge will move to the 60–64 group. In other words, in just 20years 8 per cent of the population will be within five years of turning 65. The second-largest age group will be 65–69. Beyond age 69, the size of each group declines steadilyand noticeably with increasing age. The size of the groups between 35 and 59 is virtuallyequal. Below age 35, the size of each age group declines steadily with decreasing age.
11
Seniors’ Statistical Profile 2005
Thousands
Source: Population Projections, Statistics Canada
FIGURE 2: NOVA SCOTIA POPULATION BY AGE AND SEX, 2026�
Age
50 40 30 20 10 0 10 20 30 40 50
0 – 45 – 9
10 – 1415 – 19
20 – 2425 – 2930 – 3435 – 3940 – 4445 – 4950 – 5455 – 5960 – 6465 – 6970 – 7475 – 7980 – 8485 – 8990 +
Male Female
12
Seniors’ Statistical Profile 2005
Year
Source: Population Projections, Statistics Canada
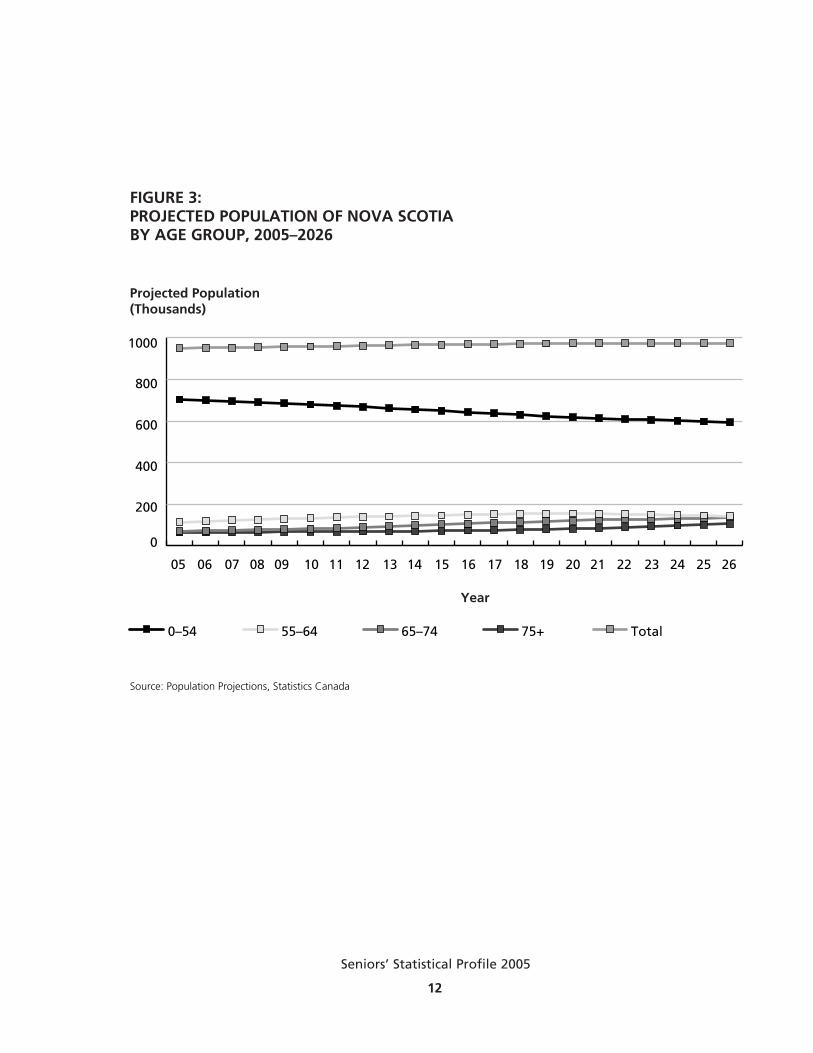
FIGURE 3: PROJECTED POPULATION OF NOVA SCOTIA�BY AGE GROUP, 2005–2026
Projected Population �(Thousands)
0
200
400
600
800
1000
Total75+65–7455–640–54
26252423222120191817161514131211100908070605
Figure 3 shows that the total population of Nova Scotia is expected to grow by only 3 percent between 2005 and 2026. In contrast, by 2026 the seniors’ population will be238,900—an increase of 80 per cent. In 2026, one in 4 (25%) Nova Scotians will be 65years of age or older. The over-55 age group will also experience healthy increases. The55–64 segment will grow by 26 per cent over the next two decades. The size of this segment is expected to peak in 2020, with slight decreases after that (Figure 4, Table 3).The 65–74 group will grow steadily until about 2010 (15%), with accelerated growth to2020 (49%), and more moderate growth after that. The 65–74 segment is projected tonearly double (+93%) by 2026. The 75+ group will grow by two-thirds (+66%) over thenext quarter century.
One of the major forces behind the aging of the population is the maturing baby boomgeneration. Baby boomers (born between 1947 and 1966) will start turning 65 in 2012.Other factors behind the aging Nova Scotia population include increased life expectancies,declining birth rates, and low immigration.
Seniors are the fastest-growing segment of the population, with 8,100 Nova Scotians celebrating their 65th birthday in 2005. A slight majority (52%) of these new seniors willbe women.
Table 2 illustrates that the percentage of older Nova Scotians will increase in all age categories during the next 20 years. The 55–64 group will grow from just under 12 percent of the population in 2005 to over 14 per cent in 2026, peaking at 16 per cent in 2020.The 65–74 group will undergo the most dramatic growth, expanding from 7 per cent to14 per cent. The 75+ category started at 7 per cent and will rise to almost 11 per cent.
13
Seniors’ Statistical Profile 2005
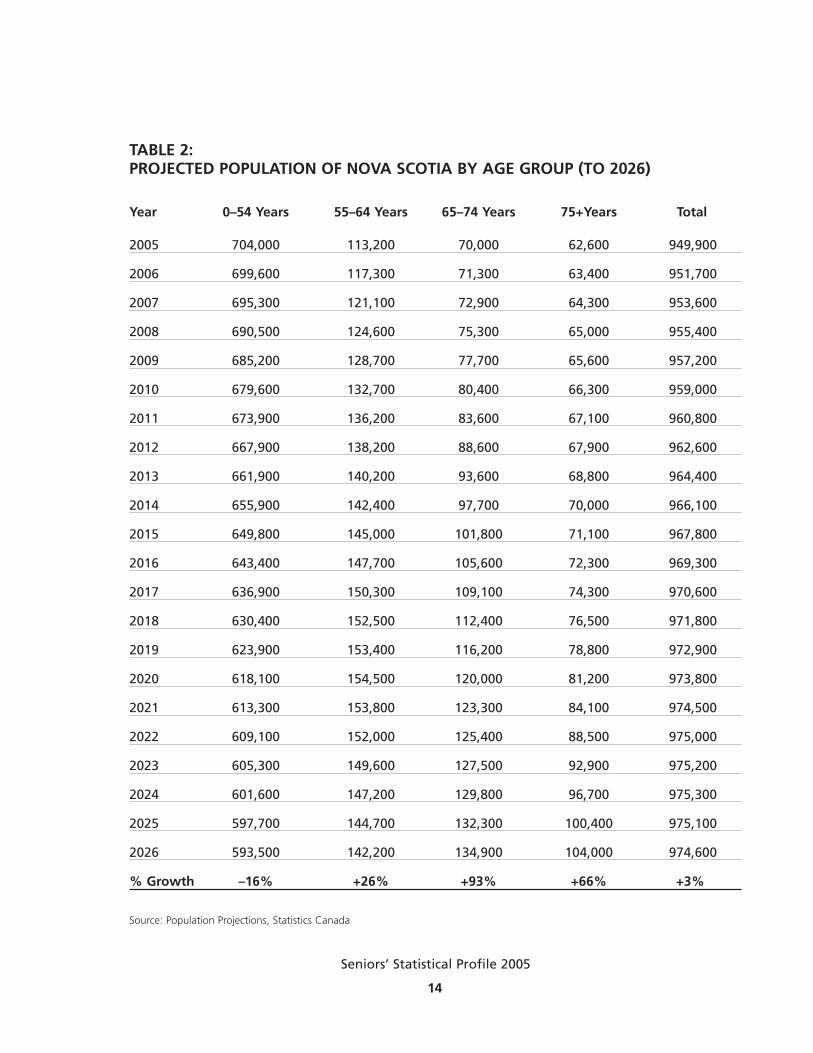
TABLE 2: PROJECTED POPULATION OF NOVA SCOTIA BY AGE GROUP (TO 2026)
Year 0–54 Years 55–64 Years 65–74 Years 75+Years Total
2005 704,000 113,200 70,000 62,600 949,900
2006 699,600 117,300 71,300 63,400 951,700
2007 695,300 121,100 72,900 64,300 953,600
2008 690,500 124,600 75,300 65,000 955,400
2009 685,200 128,700 77,700 65,600 957,200
2010 679,600 132,700 80,400 66,300 959,000
2011 673,900 136,200 83,600 67,100 960,800
2012 667,900 138,200 88,600 67,900 962,600
2013 661,900 140,200 93,600 68,800 964,400
2014 655,900 142,400 97,700 70,000 966,100
2015 649,800 145,000 101,800 71,100 967,800
2016 643,400 147,700 105,600 72,300 969,300
2017 636,900 150,300 109,100 74,300 970,600
2018 630,400 152,500 112,400 76,500 971,800
2019 623,900 153,400 116,200 78,800 972,900
2020 618,100 154,500 120,000 81,200 973,800
2021 613,300 153,800 123,300 84,100 974,500
2022 609,100 152,000 125,400 88,500 975,000
2023 605,300 149,600 127,500 92,900 975,200
2024 601,600 147,200 129,800 96,700 975,300
2025 597,700 144,700 132,300 100,400 975,100
2026 593,500 142,200 134,900 104,000 974,600
% Growth –16% +26% +93% +66% +3%%
Source: Population Projections, Statistics Canada
14
Seniors’ Statistical Profile 2005

15
Seniors’ Statistical Profile 2005
Year
Source: 1995 Census, Statistics Canada
FIGURE 4: PERCENTAGE OF NOVA SCOTIANS 55 AND OLDER�PROJECTED BY AGE GROUP, 2000–2026
Percent (%)
5
10
15
20
75+65–7455–64
262524232221201918171615141312111009080706050403020100

TABLE 3: PROJECTED NOVA SCOTIA POPULATION (PERCENTAGE) BY AGE GROUP TO 2026
Year 0–54 Years 55–64 Years 65–74 Years 75+Years
2005 74.1 11.9 7.4 6.6
2006 73.5 12.3 7.5 6.7
2007 72.9 12.7 7.6 6.7
2008 72.3 13.0 7.9 6.8
2009 71.6 13.4 8.1 6.9
2010 70.9 13.8 8.4 6.9
2011 70.1 14.2 8.7 7.0
2012 69.4 14.4 9.2 7.1
2013 68.6 14.5 9.7 7.1
2014 67.9 14.7 10.1 7.2
2015 67.1 15.0 10.5 7.3
2016 66.4 15.2 10.9 7.5
2017 65.6 15.5 11.2 7.7
2018 64.9 15.7 11.6 7.9
2019 64.1 15.8 11.9 8.1
2020 63.5 15.9 12.3 8.3
2021 62.9 15.8 12.7 8.6
2022 62.5 15.6 12.9 9.1
2023 62.1 15.3 13.1 9.5
2024 61.7 15.1 13.3 9.9
2025 61.3 14.8 13.6 10.3
2026 60.9 14.6 13.8 10.7
Source: Population Projections, Statistics Canada
16
Seniors’ Statistical Profile 2005

TABLE 4:POPULATION OF NOVA SCOTIA SENIORS BY AGE AND GENDER, 2005 AND 2026
2005 2026Age Male Female Male Female
55–64 55,800 57,400 70,500 71,700
65–74 33,200 36,800 64,400 70,500
75–84 17,800 26,700 34,400 43,500
85+ 4,800 13,300 8,400 17,900
Source: Population Projections, Statistics Canada
17
Seniors’ Statistical Profile 2005
Because women tend to live longer than men, the ratio of women to men increases considerably with age. In 2005, there are 103 women for every 100 men between the agesof 55 and 64. This measure increases dramatically and steadily with age, so that there are277 women for every 100 men in the 85+ group. In 2026, the ratio of women to men inthe 55–64 category will change slightly to 102. The disparity in numbers for the 85+ category will be less dramatic in 2026, with 213 women for every 100 men.
18
Seniors’ Statistical Profile 2005
POPULATION BY COUNTY
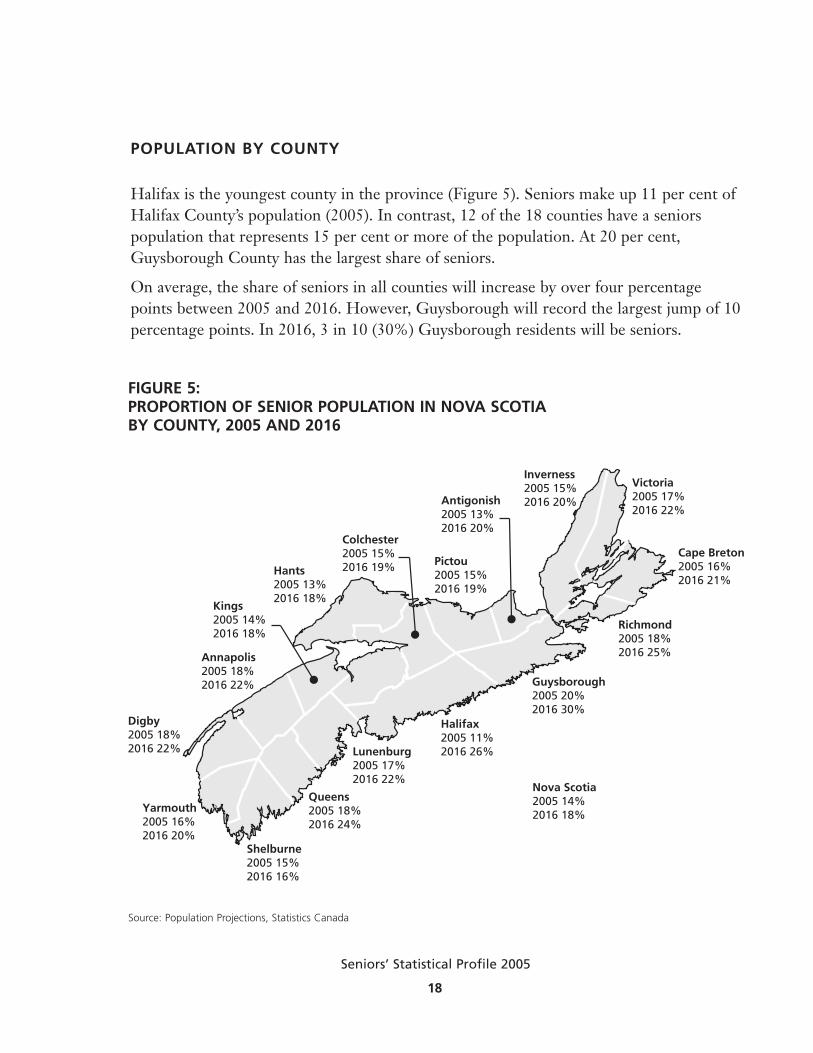
Halifax is the youngest county in the province (Figure 5). Seniors make up 11 per cent ofHalifax County’s population (2005). In contrast, 12 of the 18 counties have a seniors population that represents 15 per cent or more of the population. At 20 per cent,Guysborough County has the largest share of seniors.
On average, the share of seniors in all counties will increase by over four percentagepoints between 2005 and 2016. However, Guysborough will record the largest jump of 10percentage points. In 2016, 3 in 10 (30%) Guysborough residents will be seniors.
Source: Population Projections, Statistics Canada
FIGURE 5: PROPORTION OF SENIOR POPULATION IN NOVA SCOTIA�BY COUNTY, 2005 AND 2026
Shelburne2005 15% 2016 16%
Yarmouth2005 16% 2016 20%
Queens2005 18% 2016 24%
Hants2005 13% 2016 18%
Kings2005 14% 2016 18%
Nova Scotia2005 14% 2016 18%
Guysborough2005 20% 2016 30%
Halifax2005 11% 2016 26%Lunenburg
2005 17% 2016 22%
Annapolis2005 18% 2016 22%
Digby2005 18% 2016 22%
Victoria2005 17% 2016 22%
Cape Breton2005 16% 2016 21%
Richmond2005 18% 2016 25%
Antigonish2005 13% 2016 20%
Pictou2005 15% 2016 19%
Colchester2005 15% 2016 19%
Inverness2005 15% 2016 20%
FIGURE 5: PROPORTION OF SENIOR POPULATION IN NOVA SCOTIABY COUNTY, 2005 AND 2016
Source: Population Projections, Statistics Canada
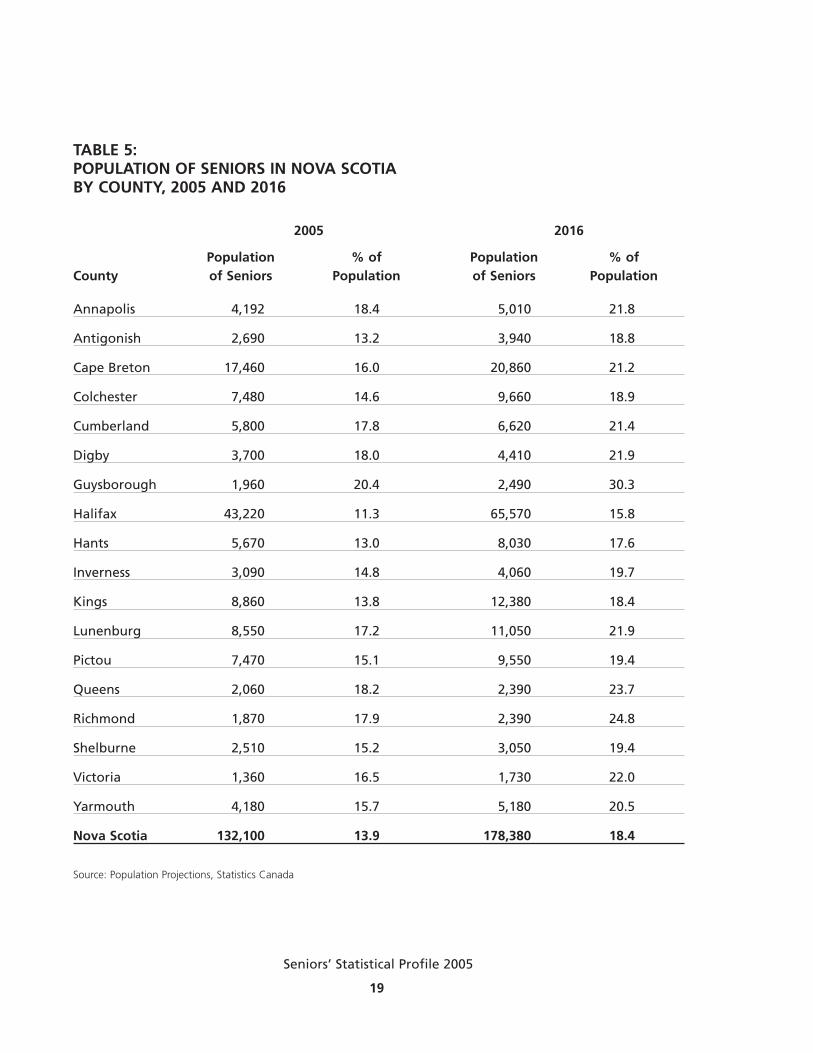
TABLE 5: POPULATION OF SENIORS IN NOVA SCOTIA BY COUNTY, 2005 AND 2016
2005 2016
Population % of Population % ofCounty of Seniors Population of Seniors Population
Annapolis 4,192 18.4 5,010 21.8
Antigonish 2,690 13.2 3,940 18.8
Cape Breton 17,460 16.0 20,860 21.2
Colchester 7,480 14.6 9,660 18.9
Cumberland 5,800 17.8 6,620 21.4
Digby 3,700 18.0 4,410 21.9
Guysborough 1,960 20.4 2,490 30.3
Halifax 43,220 11.3 65,570 15.8
Hants 5,670 13.0 8,030 17.6
Inverness 3,090 14.8 4,060 19.7
Kings 8,860 13.8 12,380 18.4
Lunenburg 8,550 17.2 11,050 21.9
Pictou 7,470 15.1 9,550 19.4
Queens 2,060 18.2 2,390 23.7
Richmond 1,870 17.9 2,390 24.8
Shelburne 2,510 15.2 3,050 19.4
Victoria 1,360 16.5 1,730 22.0
Yarmouth 4,180 15.7 5,180 20.5
Nova Scotia 132,100 13.9 178,380 18.4
Source: Population Projections, Statistics Canada
19
Seniors’ Statistical Profile 2005
POPULATION BY TOWN AND REGIONAL MUNICIPALITY
When compared to regional municipalities and rural Nova Scotia, towns have the highestproportion of seniors (Table 6). In 2003, 19.5 per cent of the residents of the province’s 31towns were seniors. This compared to 16.6 per cent for Cape Breton RegionalMunicipality, 11.0 per cent for Halifax Regional Municipality and 14.5 per cent for ruralNova Scotia. (Rural Nova Scotia is considered to be all areas outside town and cityboundaries.) Six towns had more than one in four residents who were 65 or older. Thesetowns were Mahone Bay (29.5%), Annapolis Royal (27.4%), Lunenburg (26.6%),Lockeport (26.4%), Berwick (25.6%), and Digby (25.5%).
20
Seniors’ Statistical Profile 2005

TABLE 6: NOVA SCOTIA URBAN, TOWN, AND RURAL SENIORS’ POPULATIONSPOPULATION OF SENIORS 65+BY TOWN, REGIONAL MUNICIPALITY, AND RURAL AREA, 2003
Towns Towns
Area Population % Population Area Population % Populationof Seniors of Seniors
Amherst 1,874 19.3 New Glasgow 1,895 19.9
Annapolis Royal 150 27.4 Oxford 240 17.6
Antigonish 1,100 22.9 Parrsboro 354 22.9
Berwick 611 25.6 Pictou 734 18.7
Bridgetown 231 21.6 Port Hawkesbury 453 12.0
Bridgewater 1,507 19.1 Shelburne 319 15.7
Canso 169 17.6 Springhill 789 18.9
Clark’s Harbour 182 18.9 Stellarton 760 15.6
Digby 544 25.5 Stewiacke 215 15.0
Hantsport 241 20.0 Trenton 422 15.0
Kentville 997 17.2 Truro 2,508 21.5
Lockeport 193 26.4 Westville 522 13.3
Lunenburg 696 26.6 Windsor 899 23.2
Mahone Bay 296 29.5 Wolfville 769 20.8
Middleton 403 23.0 Yarmouth 1,456 18.7
Mulgrave 150 16.2
Town Total 21,679 19.5
Regional Municipalities
Cape Breton 17,599 16.6
Halifax 41,603 11.0
Rural and Non-Rural Comparison
Non-Rural NS 80,881 13.6
Rural NS 49,374 14.5
Province 130,255 13.9
21
Seniors’ Statistical Profile 2005
Source: Statistics Canada

LIFE EXPECTANCY
The life expectancy of Nova Scotians has been steadily increasing since 1920 (Figure 6).Residents born in 1920 could expect to live to 58 years, compared to 79 years for someoneborn in 2005—an increase of 21 years or one-third. Much of this gain can be attributed tomedical advances and improvements in living conditions.
23
Seniors’ Statistical Profile 2005
HEALTH
Year of Birth
Source: Population Projections, Statistics Canada
FIGURE 6: LIFE EXPECTANCY OF NOVA SCOTIANS�BY YEAR OF BIRTH, 1920–2005
Age (Years)
0
10
20
30
40
50
60
70
80
200520001995199019851980197519701965196019551950194519401935193019251920

TABLE 8: NOVA SCOTIA LIFE EXPECTANCY IN YEARS AT AGE 65, BY GENDER, 1975–2005
Year Male Female All
1975 14 18 16
1984 15 19 17
1989 15 19 17
1995 15 20 18
2000 16 20 18
2005 17 20 18
Source: Canadian Vital Statistics, Statistics Canada
TABLE 7: LIFE EXPECTANCY BY YEAR OF BIRTH NOVA SCOTIA, 1920–2005
Life LifeYear Expectancy Year Expectancy
1920 59 1965 71
1925 60 1970 72
1930 61 1975 73
1935 63 1980 75
1940 64 1985 76
1945 67 1990 77
1950 69 1995 78
1955 71 2000 79
1960 71 2005 79
Source: Canadian Vital Statistics, Statistics Canada
24
Seniors’ Statistical Profile 2005
Life expectancy for Nova Scotians aged 65 also continues to increase. Life expectancy atage 65 improved from 16 to 18 years for both sexes between 1975 and 2005. Women tendto live longer than men. Females currently at age 65 can be expected to outlive their malecounterparts by three years. On average, a female turning 65 in 2005 will live to 85, compared to a male who will reach 82.
25
Seniors’ Statistical Profile 2005
SMOKING
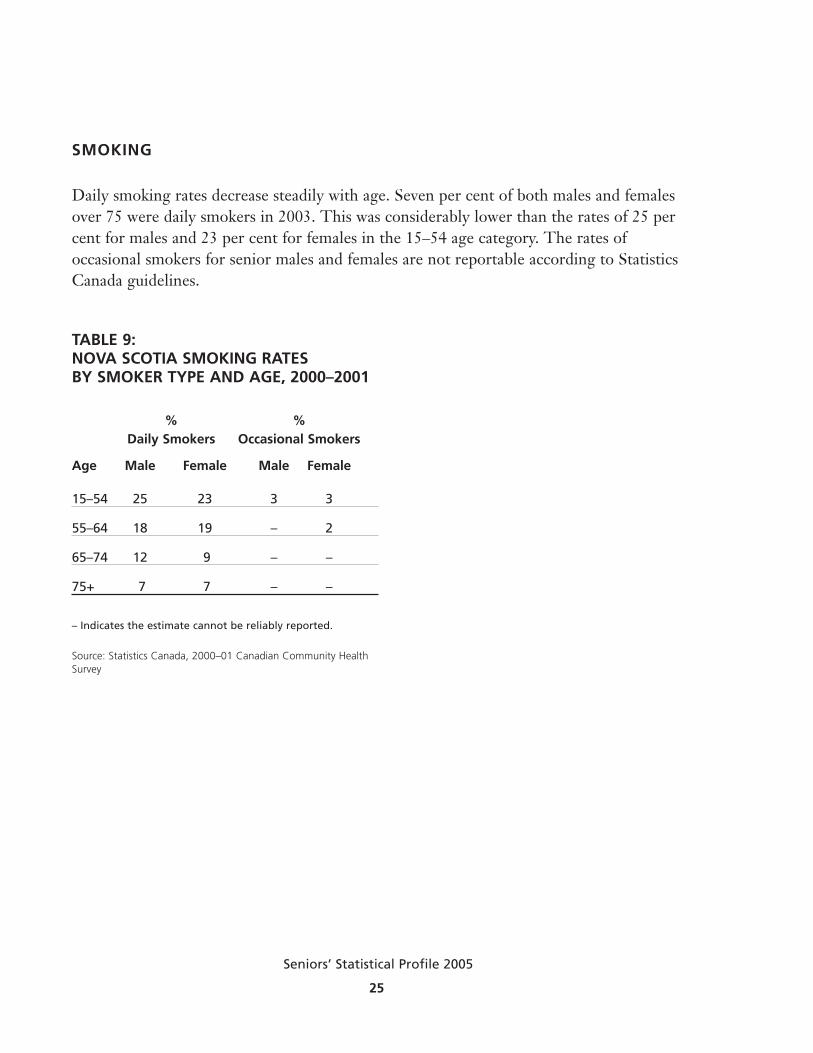
Daily smoking rates decrease steadily with age. Seven per cent of both males and femalesover 75 were daily smokers in 2003. This was considerably lower than the rates of 25 percent for males and 23 per cent for females in the 15–54 age category. The rates of occasional smokers for senior males and females are not reportable according to StatisticsCanada guidelines.
TABLE 9: NOVA SCOTIA SMOKING RATES BY SMOKER TYPE AND AGE, 2000–2001
% % Daily Smokers Occasional Smokers
Age Male Female Male Female
15–54 25 23 3 3
55–64 18 19 – 2
65–74 12 9 – –
75+ 7 7 – –
– Indicates the estimate cannot be reliably reported.
Source: Statistics Canada, 2000–01 Canadian Community HealthSurvey

PHYSICIAN VISITS
Physician visits to both general practitioners (GPs) and specialists increase steadily withage. For example, in 2003–2004, GP visits were nearly four times more frequent for a 75+male than for a male between the ages of 15 and 54. The increase for females was two-fold. The increase in visits with age to a specialist was almost five-fold for males and morethan double for females.
When comparing rates for males and females, doctor visits are more frequent for femalesin the pre-senior age categories, while males 75 and older are more likely to see a doctorthan women in the same age category. Total physician visits per 1,000 males 75 and oldermeasured 11,667, compared to 11,353 for females—a modest difference of 3 per cent.Within the 65–74 age group, total physician visits were 4 per cent higher for females.
26
Seniors’ Statistical Profile 2005
TABLE 10: PHYSICIAN VISITS IN NOVA SCOTIA BY SEX AND AGE, 2003–2004
Physician Sex 15–54 55–64 65–74 75+
General Practitioner Male Visits 658,547 242,768 206,948 206,937
Per 1,000 2,442 4,694 6,776 8,992
Female Visits 1,244,563 298,478 262,642 351,120
Per 1,000 4,585 5,580 7,332 9,047
Specialist Male Visits 150,547 66,379 70,308 61,556
Per 1,000 558 1,283 2,156 2,675
Female Visits 272,733 70,281 71,436 89,505
Per 1,000 1,005 1,314 1,994 2,306
Total Physician Male Visits 809,094 309,147 291,256 268,493
Per 1,000 3,000 5,978 8,932 11,667
Female Visits 1,517,296 368,759 334,078 440,625
Per 1,000 5,590 6,894 9,326 11,353
Source: Nova Scotia Department of Health, Health Economics, 2003–2004

27
Seniors’ Statistical Profile 2005
EMERGENCY, OUTPATIENT, AND SURGERY SERVICES
The use of physician services, such as emergency visits, outpatient procedures, and surgery, generally increases with age. In 2003–2004, the only exception was a compara-tively high rate of female emergency visits in the 15–54 category. Almost 20,000 (19,698)male seniors and 26,240 female seniors were treated by a physician in Nova Scotia emergency rooms. A total of 46,295 seniors were treated by a physician as outpatients,while 64,503 seniors had surgery. Males in the 75+ group were five times more likely torequire surgery than in the 15–54 age group.
TABLE 11: USE OF PHYSICIAN SERVICES IN NOVA SCOTIA BY SEX AND AGE, 2003–2004
Physician Sex 15–54 55–64 65–74 75+
Emergency Male Visits 65,414 11,953 9,921 9,777
Per 1,000 243 231 304 425
Female Visits 78,827 11,864 10,601 15,639
Per 1,000 290 222 296 403
Outpatient Male Visits 47,560 12,785 11,546 9,480
Per 1,000 176 247 354 412
Female Visits 66,587 13,704 11,524 13,745
Per 1,000 245 256 322 354
Surgery Male Visits 36,704 15,165 15,299 15,379
Per 1,000 136 293 469 668
Female Visits 58,501 16,451 14,573 19,252
Per 1,000 216 308 407 496
Source: Nova Scotia Department of Health, Health Economics, 2003–2004
28
Seniors’ Statistical Profile 2005
DAY SURGERY
Seniors make up a relatively large share of the population receiving day surgery in NovaScotia (Table 12). Seniors accounted for over a third (35%) of all adult day surgeries in2003–2004. Seniors were more likely to have day surgery than younger Nova Scotians.Seniors between 65 and 74 had 70 per cent more day surgeries than the 45–64 age group,while the rate was almost doubled for seniors 75 and older (93 per cent higher than the45–64 age group).
The most common intervention for those 75 and older is eye related, followed by digestivesystem interventions. In fact, together these two categories comprised 66 per cent of theday surgeries for this age group. Similarly, eye and digestive interventions accounted for61 per cent of interventions for the 65–74 group, although digestive system interventionsoutnumbered eye interventions for these younger seniors.

29
Seniors’ Statistical Profile 2005
TABLE 12: DAY SURGERY INTERVENTIONS IN NOVA SCOTIA HOSPITALS, 2003–2004
Intervention 15–44 45–64 65–74 75+
Eye Interventions 449 1,858 3,240 5,597
Per 100,000 109 790 4,887 9,381
Digestive System Interventions 7,284 12,915 5,324 3,796
Per 100,000 1,761 5,493 8,030 6,362
Urinary System Interventions 2,150 4,372 2,591 2,732
Per 100,000 520 1,860 3,908 4,579
Skin, Subcutaneous Tissue and Breast Interventions 1,343 1,406 448 570
Per 100,000 325 598 676 955
Cardiovascular Interventions 244 434 267 338
Per 100,000 59 185 403 567
Nervous System Interventions 804 994 204 174
Per 100,000 194 423 308 292
Musculoskeletal Interventions 3,741 4,137 1,011 498
Per 100,000 905 1,760 1,525 835
Respiratory Interventions 162 483 301 210
Per 100,000 39 205 454 352
Ear, Nose and Throat Interventions 2,510 701 139 101
Per 100,000 607 298 210 169
All Interventions Interventions 24,183 29,108 13,937 14,278
Per 100,000 5,848 12,380 21,021 23,931
Note: The methodology of data analysis for day surgery interventions is different for fiscal year 2003–2004 from fiscal year 2001–2002. Data for 2003–2004 is based on day surgery interventions performed only in main operating roomsand endoscopic rooms.
Source: Canadian Institute for Health Information, Discharge Abstract Database, 2003–2004National Ambulatory Care Reporting System, 2003–2004.
HOSPITALIZATION
Although seniors make up less than 14 per cent of the province’s population, they accountfor a relatively large share of hospitalizations (Table 13). In 2003–2004, seniors accountedfor 4 in 10 (43%) hospitalizations of persons 15 and older. Seniors are much more likely tobe hospitalized than younger Nova Scotians. The hospitalization rate for seniors between65 and 74 was more than double that of the 45–64 age group, while the rate was almostfour times higher for seniors aged 75 and older. By far, the leading cause of hospitalizationfor all seniors is circulatory disease. The most common reasons for hospitalization forthose aged 75 and older were circulatory disease (27%), respiratory disease (9%), digestivesystem disease (7%), nutritional and metabolic disease (7%), and cancer (malignant neo-plasms) (6%). The pattern is similar among seniors aged 65–74. The most common reasonsfor hospitalization of those aged 65–74 were circulatory disease (27%), cancer (malignantneoplasms) (9%), followed by digestive system disease (8%), respiratory disease (8%), andnutritional and metabolic disease (8%).
30
Seniors’ Statistical Profile 2005

31
Seniors’ Statistical Profile 2005
TABLE 13: NOVA SCOTIA HOSPITAL SEPARATIONS BY DIAGNOSIS AND AGE, 2003–2004
Most Responsible Diagnosis 15–44 45–64 65–74 75+
Circulatory Disease (including Cardiovascular) Separations 760 4,315 3,498 5,621
Per 100,000 184 1,835 5,276 9,421
Respiratory Disease Separations 1,019 1,378 1,519 2,915
Per 100,000 246 586 2,291 4,886
Digestive System Disease Separations 2,787 3,123 1,524 2,216
Per 100,000 674 1,328 2,299 3,714
Injury and Poisoning Separations 1,875 1,529 816 1,737
Per 100,000 453 650 1,231 2,911
Cancer (Malignant Neoplasms) Separations 864 2,528 1,587 1,646
Per 100,000 209 1,075 2,394 2,759
Genitourinary Disease Separations 1,682 1,601 806 1,161
Per 100,000 407 681 1,216 1,946
Musculoskeletal Separations 743 1,283 932 889
Per 100,000 180 546 1,406 1,490
Nutritional and Metabolic Disease Separations 457 563 360 527
Per 100,000 111 239 543 883
Nervous System Disease Separations 234 316 194 440
Per 100,000 57 134 293 737
All Hospitalizations Separations 25,729 22,005 14,070 21,923
Per 100,000 6,222 9,359 21,222 36,745
Note: A separation is defined as the discharge of a patient from a health-care facility. A single patient may account for more than one discharge.
Source: Canadian Institute for Health Information, Discharge Abstract Database, 2003–2004

CAUSE OF DEATH
Together, circulatory disease (including cardiovascular) and cancer (malignant neoplasms)are the leading cause of death for Nova Scotia seniors (Table 14). In the 65–74 group,cancer caused 616 deaths, followed by 383 circulatory disease related deaths (2003–2004).Circulatory disease overtook cancer as the leading cause of death in the 75+ category.Circulatory disease took 2,008 lives, while cancer took 1,108 lives of seniors 75 and older.About 7 in 10 (72%) deaths of Nova Scotians aged 65–74 were caused by circulatory disease or cancer, while 63 per cent of the deaths in the 75+ group were accounted for bythese two causes.
Other causes of death among seniors include chronic respiratory disease, Alzheimer’s disease, influenza and pneumonia, unintentional injuries, and diabetes. The death rates forthe 10 diseases (identified in Table 14) that most affect seniors, increase steadily with age.For example, the death rate per 100,000 for the top 10 diseases was 532 for 45–64, 2,098for 65–74, and 8,330 for older seniors. The death rate for seniors 75+ was four-fold thatof seniors aged 65–74 and over 15 times that of those aged 45–64.
32
Seniors’ Statistical Profile 2005
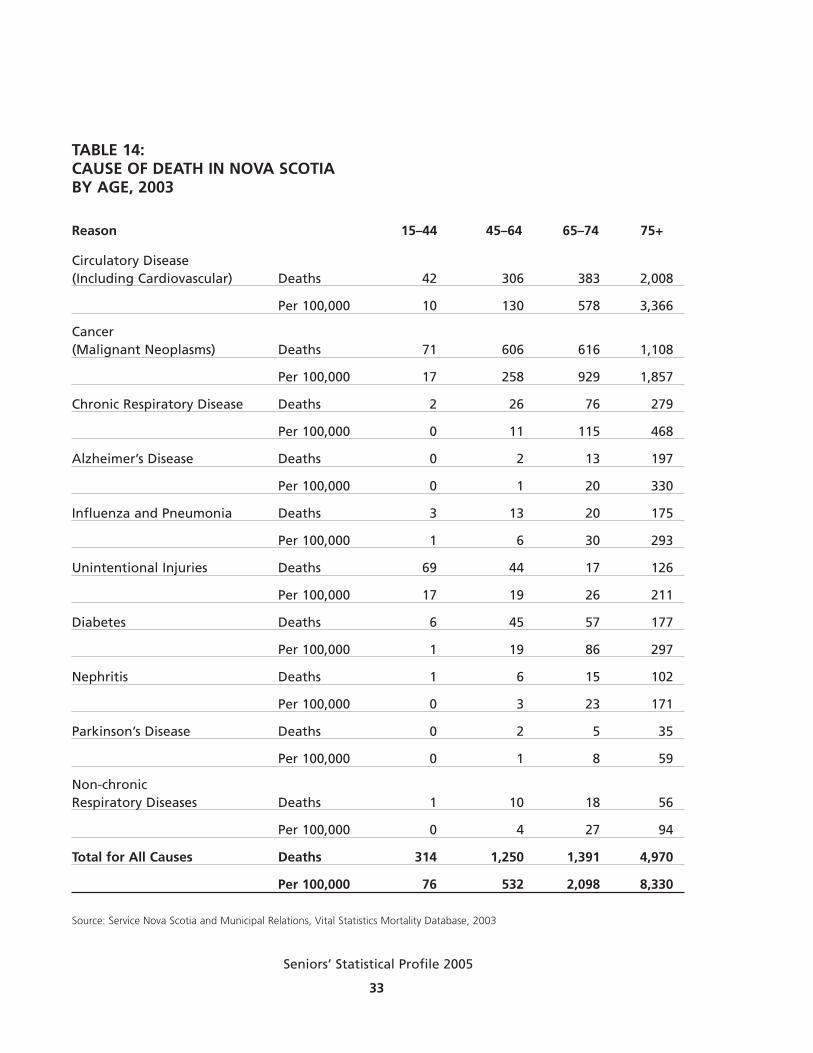
TABLE 14: CAUSE OF DEATH IN NOVA SCOTIA BY AGE, 2003
Reason 15–44 45–64 65–74 75+
Circulatory Disease (Including Cardiovascular) Deaths 42 306 383 2,008
Per 100,000 10 130 578 3,366
Cancer (Malignant Neoplasms) Deaths 71 606 616 1,108
Per 100,000 17 258 929 1,857
Chronic Respiratory Disease Deaths 2 26 76 279
Per 100,000 0 11 115 468
Alzheimer’s Disease Deaths 0 2 13 197
Per 100,000 0 1 20 330
Influenza and Pneumonia Deaths 3 13 20 175
Per 100,000 1 6 30 293
Unintentional Injuries Deaths 69 44 17 126
Per 100,000 17 19 26 211
Diabetes Deaths 6 45 57 177
Per 100,000 1 19 86 297
Nephritis Deaths 1 6 15 102
Per 100,000 0 3 23 171
Parkinson’s Disease Deaths 0 2 5 35
Per 100,000 0 1 8 59
Non-chronic Respiratory Diseases Deaths 1 10 18 56
Per 100,000 0 4 27 94
Total for All Causes Deaths 314 1,250 1,391 4,970
Per 100,000 76 532 2,098 8,330
Source: Service Nova Scotia and Municipal Relations, Vital Statistics Mortality Database, 2003
33
Seniors’ Statistical Profile 2005
MENTAL HEALTH
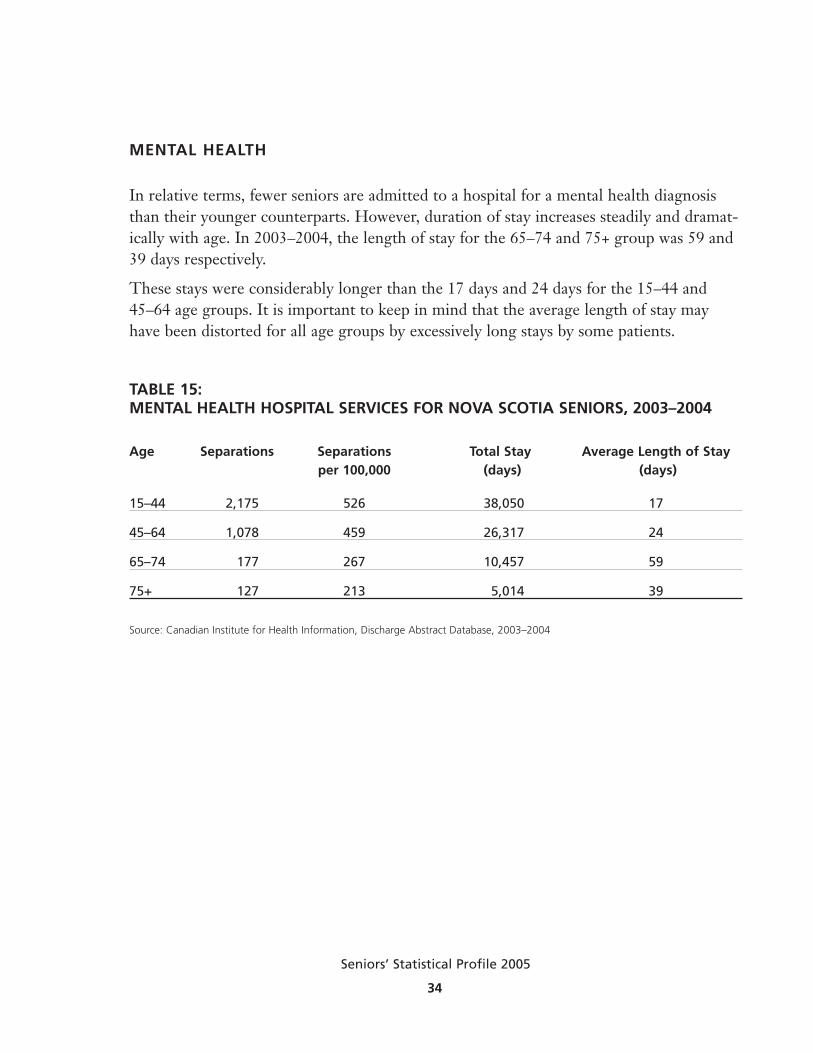
In relative terms, fewer seniors are admitted to a hospital for a mental health diagnosisthan their younger counterparts. However, duration of stay increases steadily and dramat-ically with age. In 2003–2004, the length of stay for the 65–74 and 75+ group was 59 and39 days respectively.
These stays were considerably longer than the 17 days and 24 days for the 15–44 and45–64 age groups. It is important to keep in mind that the average length of stay mayhave been distorted for all age groups by excessively long stays by some patients.
34
Seniors’ Statistical Profile 2005
TABLE 15: MENTAL HEALTH HOSPITAL SERVICES FOR NOVA SCOTIA SENIORS, 2003–2004
Age Separations Separations Total Stay Average Length of Stayper 100,000 (days) (days)
15–44 2,175 526 38,050 17
45–64 1,078 459 26,317 24
65–74 177 267 10,457 59
75+ 127 213 5,014 39
Source: Canadian Institute for Health Information, Discharge Abstract Database, 2003–2004
SENIORS’ PHARMACARE
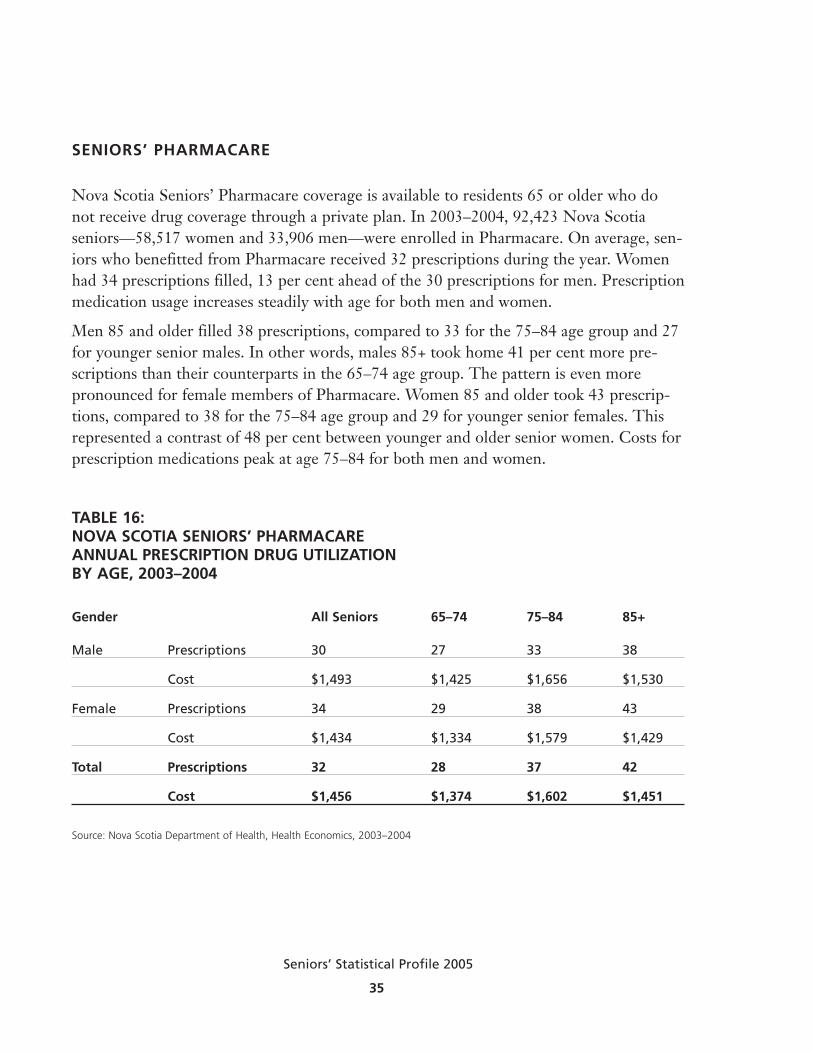
Nova Scotia Seniors’ Pharmacare coverage is available to residents 65 or older who donot receive drug coverage through a private plan. In 2003–2004, 92,423 Nova Scotia seniors—58,517 women and 33,906 men—were enrolled in Pharmacare. On average, sen-iors who benefitted from Pharmacare received 32 prescriptions during the year. Womenhad 34 prescriptions filled, 13 per cent ahead of the 30 prescriptions for men. Prescriptionmedication usage increases steadily with age for both men and women.
Men 85 and older filled 38 prescriptions, compared to 33 for the 75–84 age group and 27for younger senior males. In other words, males 85+ took home 41 per cent more pre-scriptions than their counterparts in the 65–74 age group. The pattern is even more pronounced for female members of Pharmacare. Women 85 and older took 43 prescrip-tions, compared to 38 for the 75–84 age group and 29 for younger senior females. Thisrepresented a contrast of 48 per cent between younger and older senior women. Costs forprescription medications peak at age 75–84 for both men and women.
35
Seniors’ Statistical Profile 2005
TABLE 16: NOVA SCOTIA SENIORS’ PHARMACAREANNUAL PRESCRIPTION DRUG UTILIZATION BY AGE, 2003–2004
Gender All Seniors 65–74 75–84 85+
Male Prescriptions 30 27 33 38
Cost $1,493 $1,425 $1,656 $1,530
Female Prescriptions 34 29 38 43
Cost $1,434 $1,334 $1,579 $1,429
Total Prescriptions 32 28 37 42
Cost $1,456 $1,374 $1,602 $1,451
Source: Nova Scotia Department of Health, Health Economics, 2003–2004

ADULT PROTECTION
During 2003–2004, the Nova Scotia Department of Health’s Adult Protection Servicesintervened on behalf of 916 seniors and 190 adults aged 50 to 64 years who met the definition of “an adult in need of protection” as defined in the Adult Protection Act.
Three-quarters (77%) of these cases involved self-neglect. Caregiver neglect was the second most common issue. Neglect involving a caregiver was the reason for 139 or 13per cent of the intakes. Other reasons for intervention included physical abuse (5%) andmental cruelty (2%).
TABLE 17: NOVA SCOTIA ADULT PROTECTION SERVICESINTAKES OF OLDER NOVA SCOTIANS BY PRESENTING PROBLEM, 2003–2004
Problem Intakes
50–64 65–84 85+
Self-Neglect 146 514 189
Caregiver Neglect 17 86 36
Physical Abuse 14 29 8
Mental Cruelty 3 18 4
Financial Abuse 8 8 8
Other 2 11 5
Total 190 666 250
Source: Nova Scotia Department of Health, Adult Protection Services, 2003–2004
36
Seniors’ Statistical Profile 2005
MI’KMAQ POPULATION
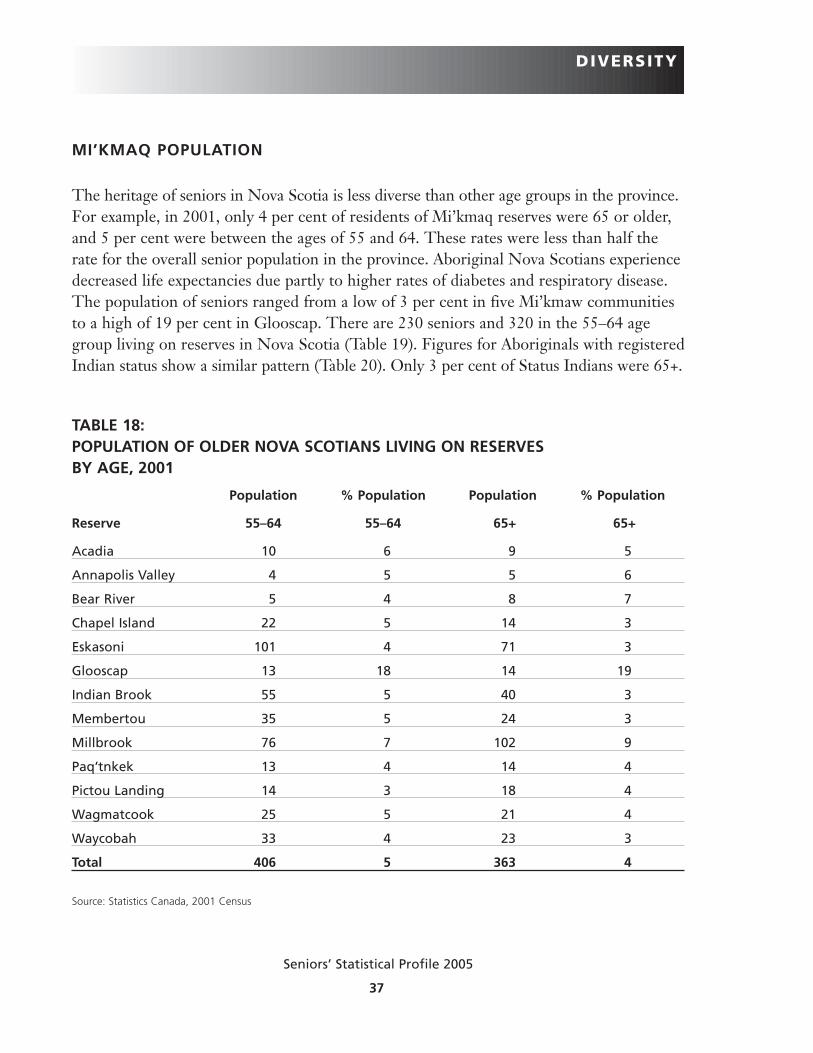
The heritage of seniors in Nova Scotia is less diverse than other age groups in the province.For example, in 2001, only 4 per cent of residents of Mi’kmaq reserves were 65 or older,and 5 per cent were between the ages of 55 and 64. These rates were less than half therate for the overall senior population in the province. Aboriginal Nova Scotians experiencedecreased life expectancies due partly to higher rates of diabetes and respiratory disease.The population of seniors ranged from a low of 3 per cent in five Mi’kmaw communitiesto a high of 19 per cent in Glooscap. There are 230 seniors and 320 in the 55–64 agegroup living on reserves in Nova Scotia (Table 19). Figures for Aboriginals with registeredIndian status show a similar pattern (Table 20). Only 3 per cent of Status Indians were 65+.
37
Seniors’ Statistical Profile 2005
TABLE 18: POPULATION OF OLDER NOVA SCOTIANS LIVING ON RESERVES BY AGE, 2001
Population % Population Population % Population
Reserve 55–64 55–64 65+ 65+
Acadia 10 6 9 5
Annapolis Valley 4 5 5 6
Bear River 5 4 8 7
Chapel Island 22 5 14 3
Eskasoni 101 4 71 3
Glooscap 13 18 14 19
Indian Brook 55 5 40 3
Membertou 35 5 24 3
Millbrook 76 7 102 9
Paq’tnkek 13 4 14 4
Pictou Landing 14 3 18 4
Wagmatcook 25 5 21 4
Waycobah 33 4 23 3
Total 406 5 363 4
Source: Statistics Canada, 2001 Census
DIVERSITY
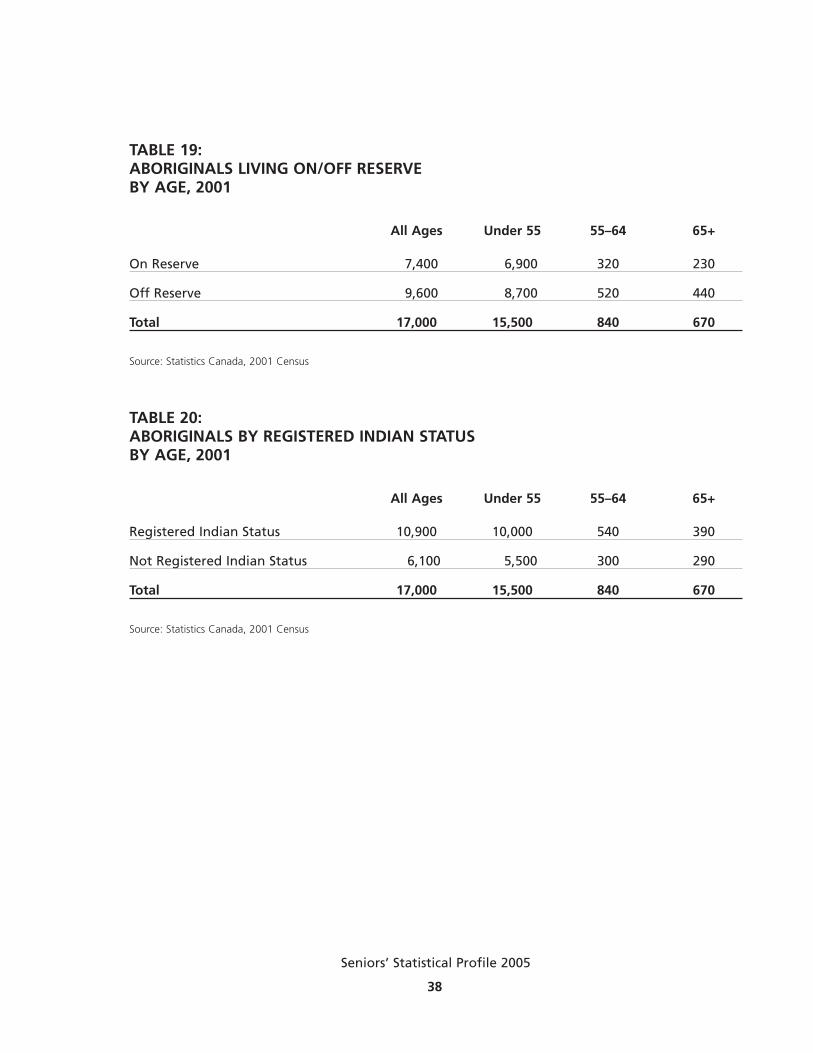
TABLE 19: ABORIGINALS LIVING ON/OFF RESERVE BY AGE, 2001
All Ages Under 55 55–64 65+
On Reserve 7,400 6,900 320 230
Off Reserve 9,600 8,700 520 440
Total 17,000 15,500 840 670
Source: Statistics Canada, 2001 Census
TABLE 20: ABORIGINALS BY REGISTERED INDIAN STATUS BY AGE, 2001
All Ages Under 55 55–64 65+
Registered Indian Status 10,900 10,000 540 390
Not Registered Indian Status 6,100 5,500 300 290
Total 17,000 15,500 840 670
Source: Statistics Canada, 2001 Census
38
Seniors’ Statistical Profile 2005

39
Seniors’ Statistical Profile 2005
LANGUAGE
In general, Nova Scotia seniors are less knowledgeable about languages than theiryounger counterparts. Seniors’ ability to carry on a conversation in French, Mi’kmaq,Spanish, and Arabic is considerably lower compared to younger residents.
For example, in 2001 the rate for Mi’kmaq was about one-third and for Arabic one-fourth. Notable exceptions are Dutch and Gaelic. Seniors were five times more likely tospeak Gaelic and twice as likely to speak Dutch, than younger Nova Scotians.
TABLE 21: KNOWLEDGE OF VARIOUS LANGUAGES, NOVA SCOTIANS BY AGE, 2001
Language All Ages Under 55 55–64 65+
English 895,800 634,200 142,600 119,000
French 91,100 74,700 7,400 9,000
German 6,100 3,900 1,000 1,200
Arabic 5,300 4,800 300 200
Mi’kmaq 4,700 4,200 300 200
Spanish 4,400 3,700 400 300
Dutch 2,500 1,300 500 700
Italian 1,700 1,000 300 400
Chinese 1,600 1,200 200 200
Greek 1,500 900 300 300
Gaelic 1,000 300 100 600
Polish 1,000 700 100 200
Source: Statistics Canada, 2001 Census
41
Seniors’ Statistical Profile 2005
FAMILY AND MARITAL STATUS
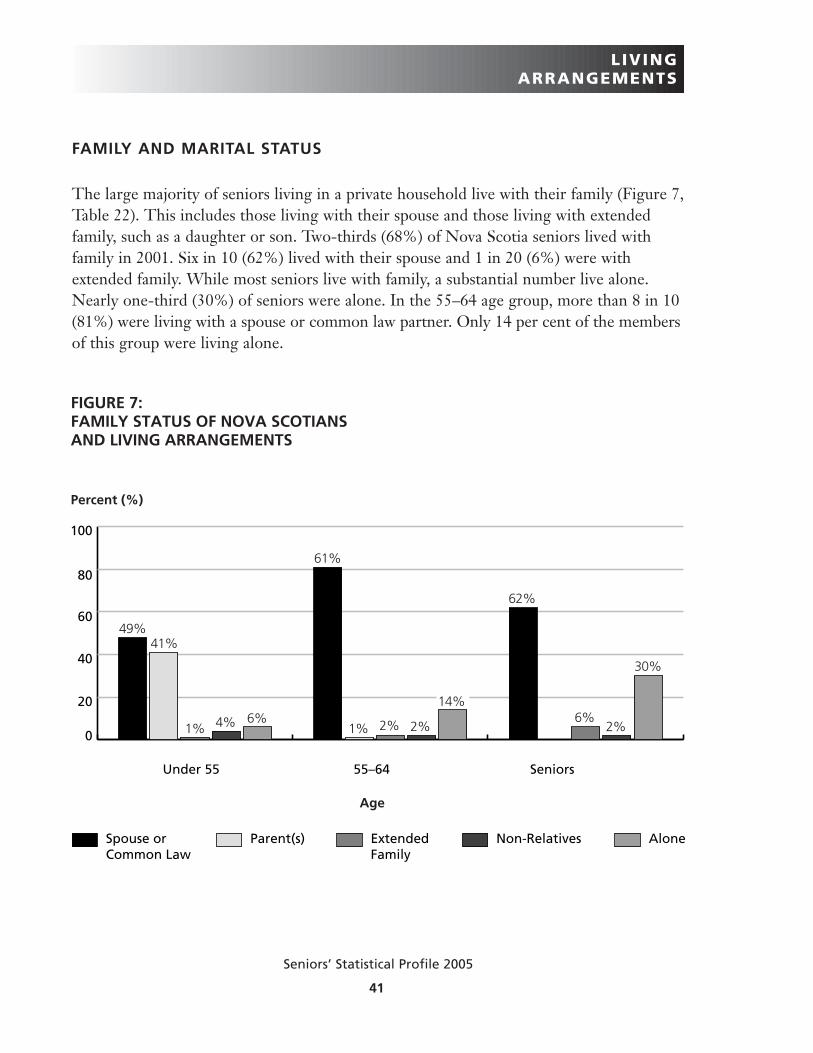
The large majority of seniors living in a private household live with their family (Figure 7,Table 22). This includes those living with their spouse and those living with extendedfamily, such as a daughter or son. Two-thirds (68%) of Nova Scotia seniors lived withfamily in 2001. Six in 10 (62%) lived with their spouse and 1 in 20 (6%) were withextended family. While most seniors live with family, a substantial number live alone.Nearly one-third (30%) of seniors were alone. In the 55–64 age group, more than 8 in 10(81%) were living with a spouse or common law partner. Only 14 per cent of the membersof this group were living alone.
LIVINGARRANGEMENTS
Age
Source: 2001 Census, Statistics Canada
FIGURE 7: FAMILY STATUS OF NOVA SCOTIANS �AND LIVING ARRANGEMENTS
Percent (%)
0
20
40
60
80
100
AloneNon-RelativesExtended �Family
Parent(s)Spouse or�Common Law
Seniors55–64Under 55
30%
2%6%
62%
2% 2%1%
61%
6%4%1%
41%49%
14%

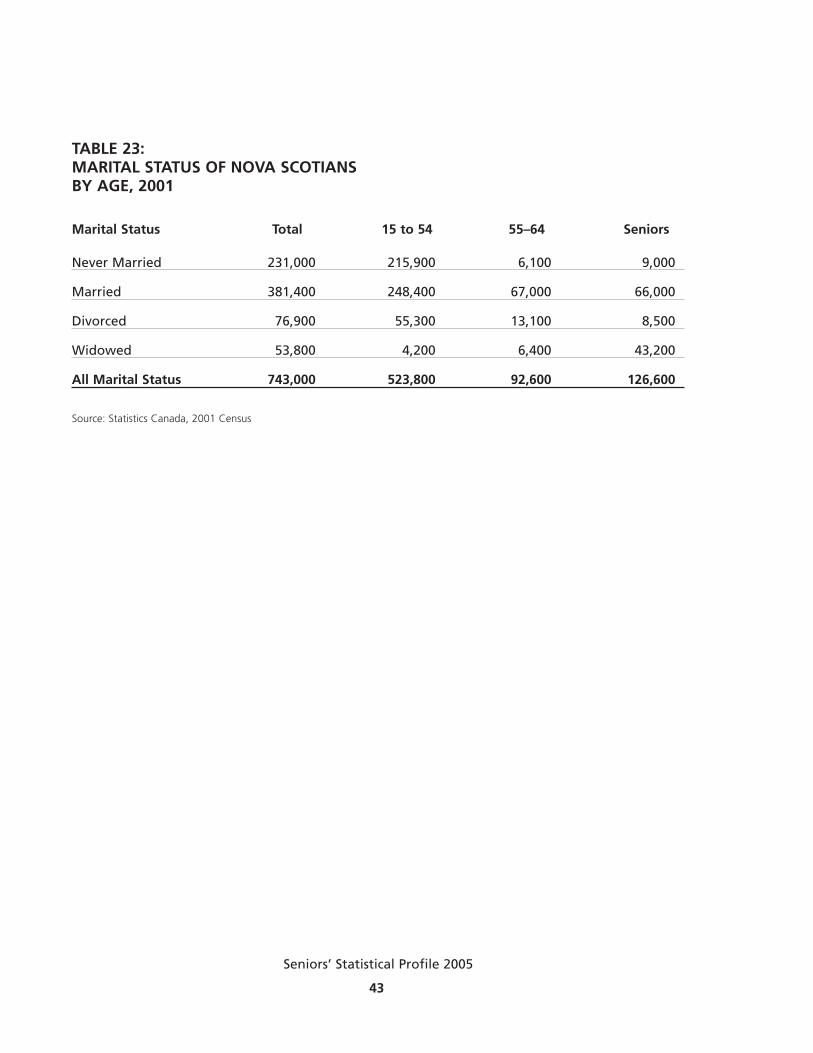
Half (52%) of all seniors were married in 2001, while 34 per cent were widowed (Table 23).Relatively few had never been married (7%) or were divorced or separated (7%). Sevenout of 10 (72%) members of the 55–64 group were married, while 14 per cent weredivorced. Fewer than 1 in 10 fell into each of the other categories—never married (7%)and widowed (7%).
TABLE 22: FAMILY STATUS OF NOVA SCOTIANSAND LIVING ARRANGEMENTS
Living Arrangements All Ages Under 55 55–64 Seniors
With Spouse or Common Law 481,700 334,700 73,900 73,100
Parent(s) 279,800 278,200 1,300 300
With Extended Family 16,100 6,700 2,000 7,400
With Non-Relatives 28,800 25,000 1,800 2,100
Alone 89,000 40,500 12,700 35,800
All Living Arrangements 895,300 684,900 91,700 118,700
Source: Statistics Canada, 2001 Census
42
Seniors’ Statistical Profile 2005
43
Seniors’ Statistical Profile 2005
TABLE 23: MARITAL STATUS OF NOVA SCOTIANS BY AGE, 2001
Marital Status Total 15 to 54 55–64 Seniors
Never Married 231,000 215,900 6,100 9,000
Married 381,400 248,400 67,000 66,000
Divorced 76,900 55,300 13,100 8,500
Widowed 53,800 4,200 6,400 43,200
All Marital Status 743,000 523,800 92,600 126,600
Source: Statistics Canada, 2001 Census
HOUSING ARRANGEMENTS
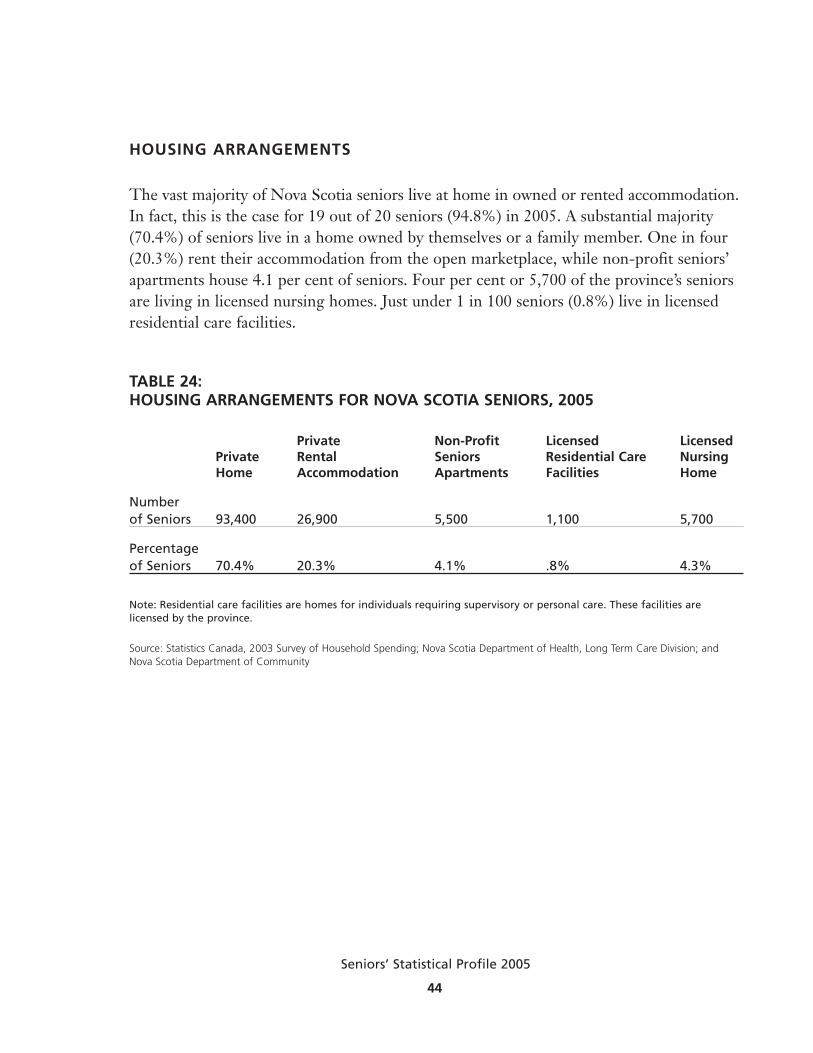
The vast majority of Nova Scotia seniors live at home in owned or rented accommodation.In fact, this is the case for 19 out of 20 seniors (94.8%) in 2005. A substantial majority(70.4%) of seniors live in a home owned by themselves or a family member. One in four(20.3%) rent their accommodation from the open marketplace, while non-profit seniors’apartments house 4.1 per cent of seniors. Four per cent or 5,700 of the province’s seniorsare living in licensed nursing homes. Just under 1 in 100 seniors (0.8%) live in licensedresidential care facilities.
TABLE 24: HOUSING ARRANGEMENTS FOR NOVA SCOTIA SENIORS, 2005
Private Non-Profit Licensed Licensed Private Rental Seniors Residential Care Nursing Home Accommodation Apartments Facilities Home
Number of Seniors 93,400 26,900 5,500 1,100 5,700
Percentage of Seniors 70.4% 20.3% 4.1% .8% 4.3%
Note: Residential care facilities are homes for individuals requiring supervisory or personal care. These facilities arelicensed by the province.
Source: Statistics Canada, 2003 Survey of Household Spending; Nova Scotia Department of Health, Long Term Care Division; andNova Scotia Department of Community
44
Seniors’ Statistical Profile 2005

45
Seniors’ Statistical Profile 2005
EDUCATION
Seniors have relatively low levels of formal education. For example, in 2001, 6 per cent ofNova Scotia seniors had a university degree, compared to 12 per cent of those aged 55–64and 16 per cent of those aged 15–54. Educational attainment generally declines with anincrease in age. Four in 10 (39%) of today’s seniors completed high school. This comparesto 57 per cent of those aged 55–64 and 72 per cent of those aged 15–54. Of the seniorswho did not complete high school, 59 per cent graduated from junior high.
It is important to keep in mind that the educational opportunities available to today’s seniors when they were young were considerably more limited than they are today.Considering these challenges, the educational achievements of today’s seniors is note-worthy. Nearly 2 in 10 (18%) have a trade or other certificate, 4 per cent a bachelor’sdegree, and 2 per cent hold a master’s or doctorate.
EDUCATIONAND LITERACY
TABLE 25: HIGHEST DEGREE, CERTIFICATE OR DIPLOMA FOR NOVA SCOTIANS BY AGE, 2001
Education All Ages 15–54 55–64 65+
Below Grade 9 65,700 22,400 13,400 29,900
Grade 9 193,300 124,500 25,800 43,000
High School Certificate 71,300 55,700 7,100 8,500
Some Post Secondary 88,700 71,500 8,000 9,200
Trade Certificate 103,200 77,900 14,000 11,300
Other Certificate 107,300 84,700 12,400 10,200
Bachelor’s Degree 81,600 69,300 7,100 5,200
Master’s Degree 17,500 12,800 3,000 1,700
Medical or Doctorate 3,700 2,100 1,100 500
Total 732,300 521,000 91,900 119,400
Source: Statistics Canada, 2001 Census

Some older Nova Scotians chose to go back to school. In 2001, 500 seniors returned topursue a formal education; while 900 of those in the 55–64 age group returned to class. Inaddition, many older Nova Scotians were enrolled in less traditional educational programs.
TABLE 26: SCHOOL ATTENDANCE BY NOVA SCOTIANS BY AGE, 2001
All Ages 15–54 55–64 65+
Not Attending 628,500 418,600 91,000 118,900
Attending Full Time 82,700 82,300 200 200
Attending Part Time 21,200 20,200 700 300
Total 732,400 521,100 91,900 119,400
Source: Statistics Canada, 2001 Census
46
Seniors’ Statistical Profile 2005
47
Seniors’ Statistical Profile 2005
LITERACY
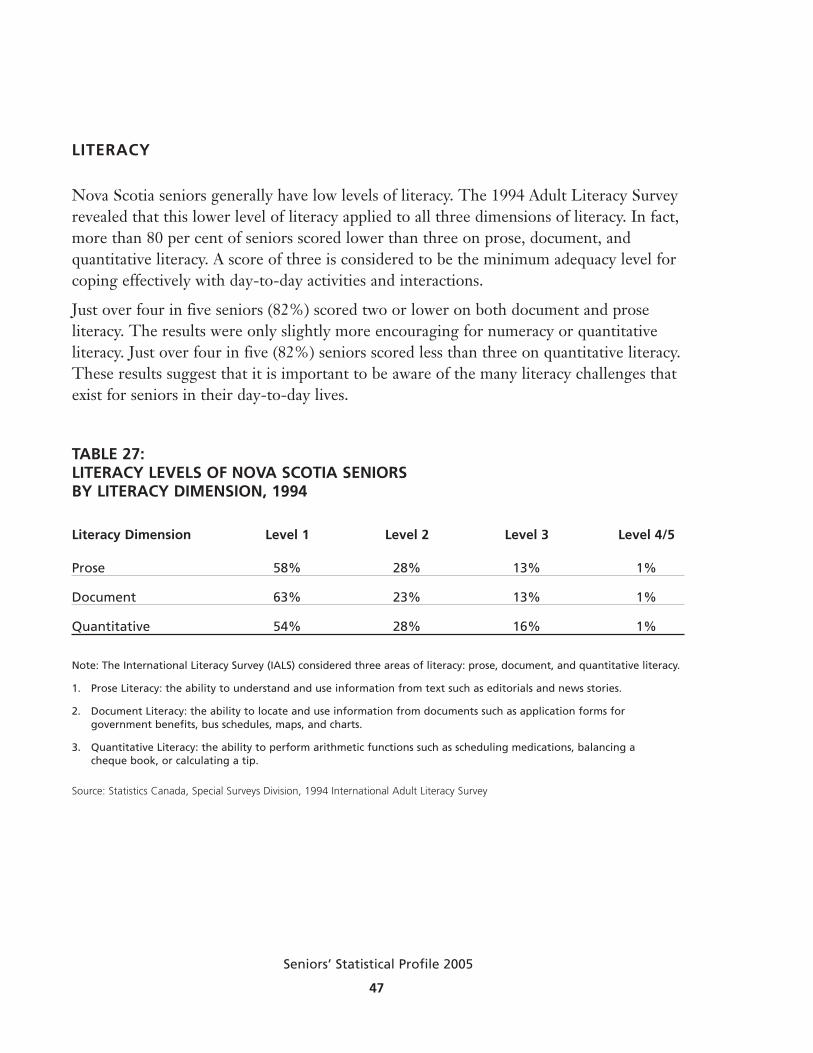
Nova Scotia seniors generally have low levels of literacy. The 1994 Adult Literacy Surveyrevealed that this lower level of literacy applied to all three dimensions of literacy. In fact,more than 80 per cent of seniors scored lower than three on prose, document, and quantitative literacy. A score of three is considered to be the minimum adequacy level forcoping effectively with day-to-day activities and interactions.
Just over four in five seniors (82%) scored two or lower on both document and prose literacy. The results were only slightly more encouraging for numeracy or quantitative literacy. Just over four in five (82%) seniors scored less than three on quantitative literacy.These results suggest that it is important to be aware of the many literacy challenges thatexist for seniors in their day-to-day lives.
TABLE 27: LITERACY LEVELS OF NOVA SCOTIA SENIORS BY LITERACY DIMENSION, 1994
Literacy Dimension Level 1 Level 2 Level 3 Level 4/5
Prose 58% 28% 13% 1%
Document 63% 23% 13% 1%
Quantitative 54% 28% 16% 1%
Note: The International Literacy Survey (IALS) considered three areas of literacy: prose, document, and quantitative literacy.
1. Prose Literacy: the ability to understand and use information from text such as editorials and news stories.
2. Document Literacy: the ability to locate and use information from documents such as application forms for government benefits, bus schedules, maps, and charts.
3. Quantitative Literacy: the ability to perform arithmetic functions such as scheduling medications, balancing a cheque book, or calculating a tip.
Source: Statistics Canada, Special Surveys Division, 1994 International Adult Literacy Survey
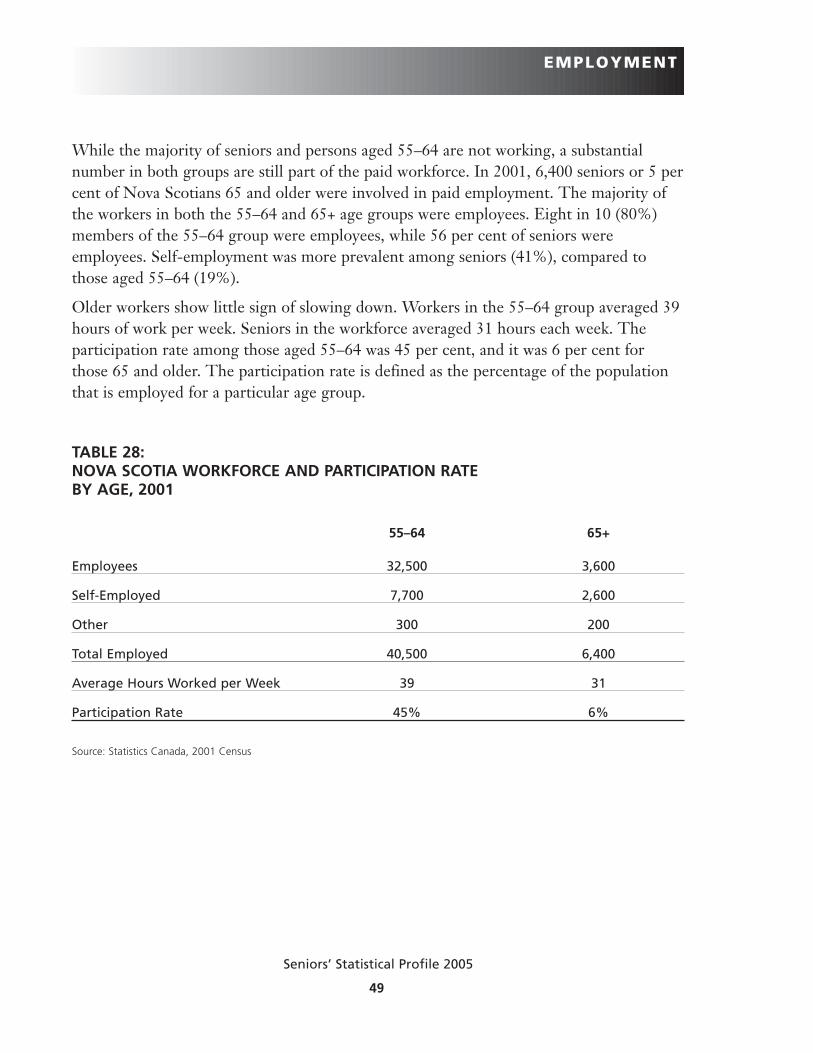
While the majority of seniors and persons aged 55–64 are not working, a substantial number in both groups are still part of the paid workforce. In 2001, 6,400 seniors or 5 percent of Nova Scotians 65 and older were involved in paid employment. The majority ofthe workers in both the 55–64 and 65+ age groups were employees. Eight in 10 (80%)members of the 55–64 group were employees, while 56 per cent of seniors were employees. Self-employment was more prevalent among seniors (41%), compared tothose aged 55–64 (19%).
Older workers show little sign of slowing down. Workers in the 55–64 group averaged 39hours of work per week. Seniors in the workforce averaged 31 hours each week. The participation rate among those aged 55–64 was 45 per cent, and it was 6 per cent forthose 65 and older. The participation rate is defined as the percentage of the populationthat is employed for a particular age group.
49
Seniors’ Statistical Profile 2005
TABLE 28: NOVA SCOTIA WORKFORCE AND PARTICIPATION RATE BY AGE, 2001
55–64 65+
Employees 32,500 3,600
Self-Employed 7,700 2,600
Other 300 200
Total Employed 40,500 6,400
Average Hours Worked per Week 39 31
Participation Rate 45% 6%
Source: Statistics Canada, 2001 Census
EMPLOYMENT
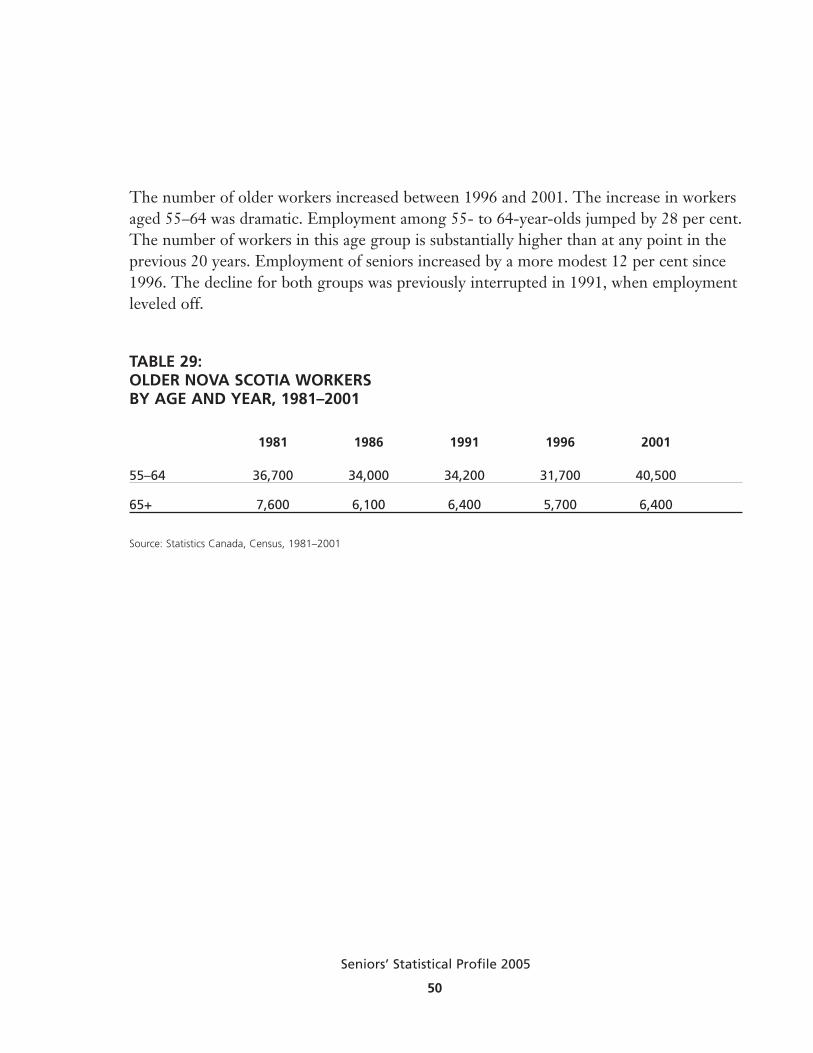
The number of older workers increased between 1996 and 2001. The increase in workersaged 55–64 was dramatic. Employment among 55- to 64-year-olds jumped by 28 per cent.The number of workers in this age group is substantially higher than at any point in theprevious 20 years. Employment of seniors increased by a more modest 12 per cent since1996. The decline for both groups was previously interrupted in 1991, when employmentleveled off.
50
Seniors’ Statistical Profile 2005
TABLE 29: OLDER NOVA SCOTIA WORKERS BY AGE AND YEAR, 1981–2001
1981 1986 1991 1996 2001
55–64 36,700 34,000 34,200 31,700 40,500
65+ 7,600 6,100 6,400 5,700 6,400
Source: Statistics Canada, Census, 1981–2001
HOUSEHOLD INCOME
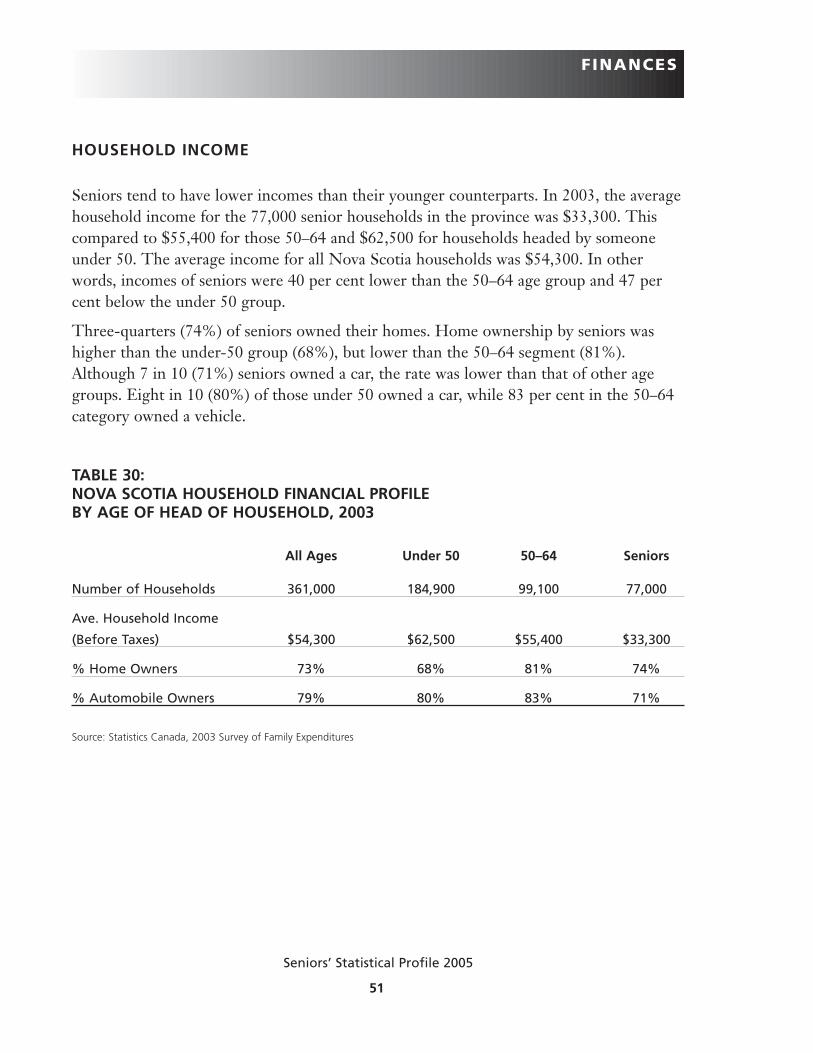
Seniors tend to have lower incomes than their younger counterparts. In 2003, the averagehousehold income for the 77,000 senior households in the province was $33,300. Thiscompared to $55,400 for those 50–64 and $62,500 for households headed by someoneunder 50. The average income for all Nova Scotia households was $54,300. In otherwords, incomes of seniors were 40 per cent lower than the 50–64 age group and 47 percent below the under 50 group.
Three-quarters (74%) of seniors owned their homes. Home ownership by seniors washigher than the under-50 group (68%), but lower than the 50–64 segment (81%).Although 7 in 10 (71%) seniors owned a car, the rate was lower than that of other agegroups. Eight in 10 (80%) of those under 50 owned a car, while 83 per cent in the 50–64category owned a vehicle.
51
Seniors’ Statistical Profile 2005
FINANCES
TABLE 30: NOVA SCOTIA HOUSEHOLD FINANCIAL PROFILE BY AGE OF HEAD OF HOUSEHOLD, 2003
All Ages Under 50 50–64 Seniors
Number of Households 361,000 184,900 99,100 77,000
Ave. Household Income
(Before Taxes) $54,300 $62,500 $55,400 $33,300
% Home Owners 73% 68% 81% 74%
% Automobile Owners 79% 80% 83% 71%
Source: Statistics Canada, 2003 Survey of Family Expenditures
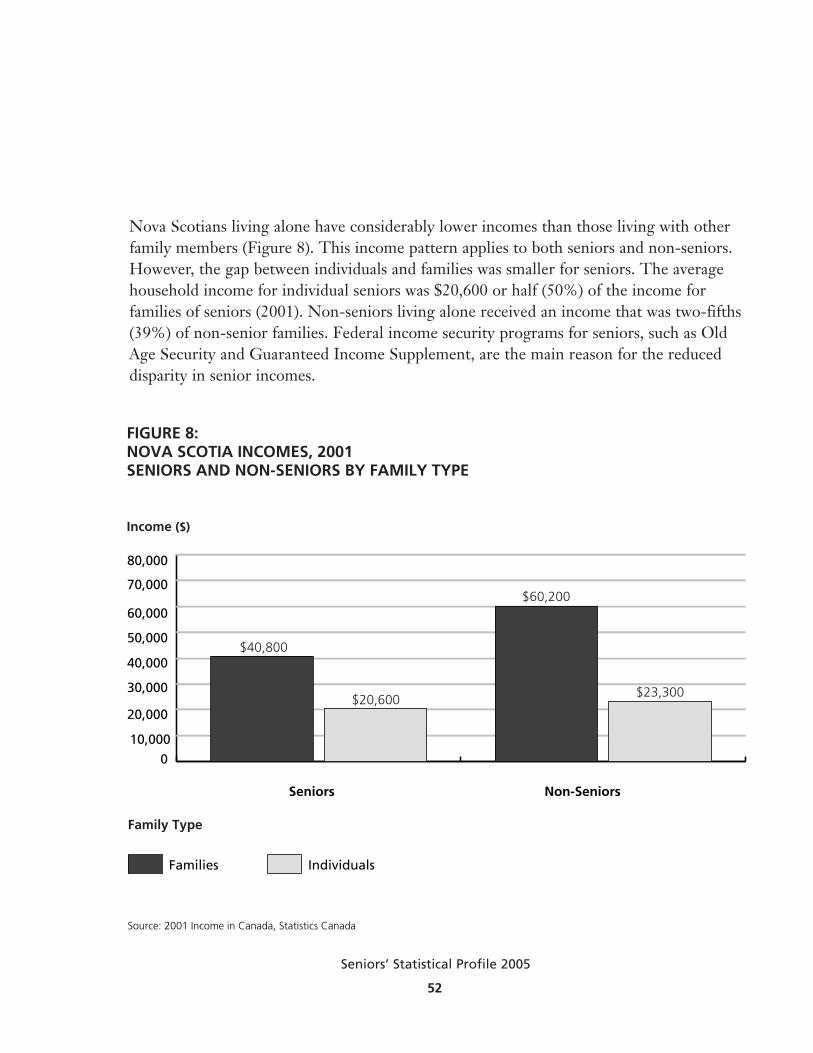
Nova Scotians living alone have considerably lower incomes than those living with otherfamily members (Figure 8). This income pattern applies to both seniors and non-seniors.However, the gap between individuals and families was smaller for seniors. The averagehousehold income for individual seniors was $20,600 or half (50%) of the income forfamilies of seniors (2001). Non-seniors living alone received an income that was two-fifths(39%) of non-senior families. Federal income security programs for seniors, such as OldAge Security and Guaranteed Income Supplement, are the main reason for the reduceddisparity in senior incomes.
52
Seniors’ Statistical Profile 2005
Family Type
Source: 2001 Income in Canada, Statistics Canada
FIGURE 8: NOVA SCOTIA INCOMES, 2001�SENIORS AND NON-SENIORS BY FAMILY TYPE
Income ($)
0
10,000
20,000
30,000
40,000
50,000
60,000
70,000
80,000
IndividualsFamilies
Non-SeniorsSeniors
$60,200
$23,300$20,600
$40,800

SOURCES OF INCOME
Younger seniors (65–74) have a somewhat higher income compared to older seniors (75+).Tables 30 and 31 indicate that the average income in 2002 for seniors between 65 and 74was $25,200 or 11 per cent more than the income of $22,700 received by older seniors.Younger seniors benefit more from private pensions and paid employment; while olderseniors enjoy higher public benefits (OAS and CPP) and investment income. Seniors aged65–74 derived nearly half (46%) of their income from OAS and CPP, followed by privatepension (35%), investments (10%), and employment (10%).
More than half (54%) of the income for older seniors came from public benefits; while 32per cent came from private pensions, 13 per cent from investments, and a modest 1 percent from employment. Average incomes by county for residents aged 65–74 ranged froma low of $18,200 in Guysborough County to $30,800 in Halifax. The range for older seniors was $16,400 in Guysborough County to $28,300 in Halifax.
53
Seniors’ Statistical Profile 2005

TABLE 31: INDIVIDUAL INCOME BY COUNTY OF RESIDENCE AND SOURCE FOR AGE 65–74, 2002
PrivateCPP/OAS Pension Employment Investment Total
Annapolis $11,100 $8,100 $900 $1,500 $21,600
Antigonish 11,500 7,800 2,200 1,600 23,000
Cape Breton 12,400 6,900 1,600 1,200 22,100
Colchester 11,400 7,800 2,100 2,100 23,400
Cumberland 11,600 6,800 1,200 1,300 21,000
Digby 11,200 5,600 1,200 1,700 19,600
Guysborough 11,800 4,500 1,000 800 18,200
Halifax 11,300 12,200 3,800 3,500 30,800
Hants 11,500 7,200 1,400 2,100 22,200
Inverness 11,800 7,400 2,500 1,400 23,200
Kings 11,100 8,900 1,600 2,300 24,000
Lunenburg 11,200 7,600 1,800 2,600 23,100
Pictou 11,700 7,800 1,800 3,100 24,400
Queens 11,300 8,400 1,100 2,900 23,700
Richmond 11,900 4,900 0 700 18,800
Shelburne 11,700 4,900 3,100 2,000 21,600
Victoria 11,300 7,000 0 1,100 21,500
Yarmouth 11,500 6,100 1,600 2,000 21,200
Nova Scotia $11,500 $8,900 $2,500 $2,400 $25,200
Source: Nova Scotia Department of Finance, Community Counts Division, 2002
54
Seniors’ Statistical Profile 2005
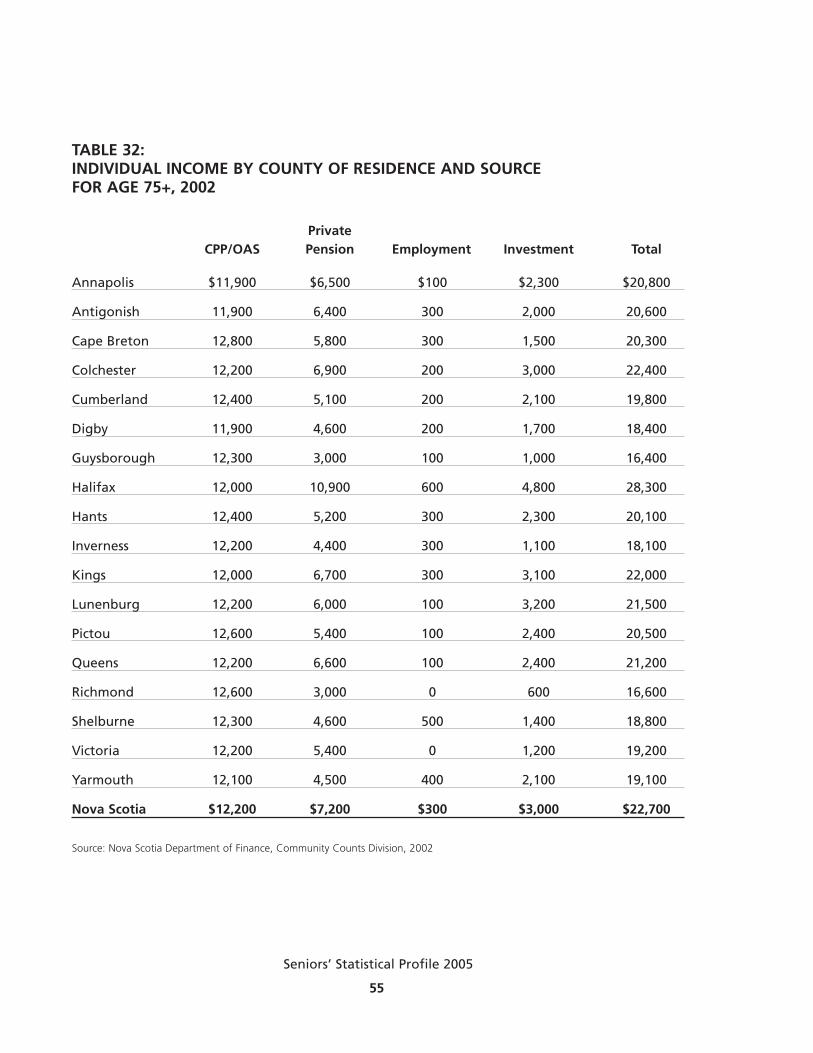
TABLE 32: INDIVIDUAL INCOME BY COUNTY OF RESIDENCE AND SOURCE FOR AGE 75+, 2002
PrivateCPP/OAS Pension Employment Investment Total
Annapolis $11,900 $6,500 $100 $2,300 $20,800
Antigonish 11,900 6,400 300 2,000 20,600
Cape Breton 12,800 5,800 300 1,500 20,300
Colchester 12,200 6,900 200 3,000 22,400
Cumberland 12,400 5,100 200 2,100 19,800
Digby 11,900 4,600 200 1,700 18,400
Guysborough 12,300 3,000 100 1,000 16,400
Halifax 12,000 10,900 600 4,800 28,300
Hants 12,400 5,200 300 2,300 20,100
Inverness 12,200 4,400 300 1,100 18,100
Kings 12,000 6,700 300 3,100 22,000
Lunenburg 12,200 6,000 100 3,200 21,500
Pictou 12,600 5,400 100 2,400 20,500
Queens 12,200 6,600 100 2,400 21,200
Richmond 12,600 3,000 0 600 16,600
Shelburne 12,300 4,600 500 1,400 18,800
Victoria 12,200 5,400 0 1,200 19,200
Yarmouth 12,100 4,500 400 2,100 19,100
Nova Scotia $12,200 $7,200 $300 $3,000 $22,700
Source: Nova Scotia Department of Finance, Community Counts Division, 2002
55
Seniors’ Statistical Profile 2005

LOW INCOME
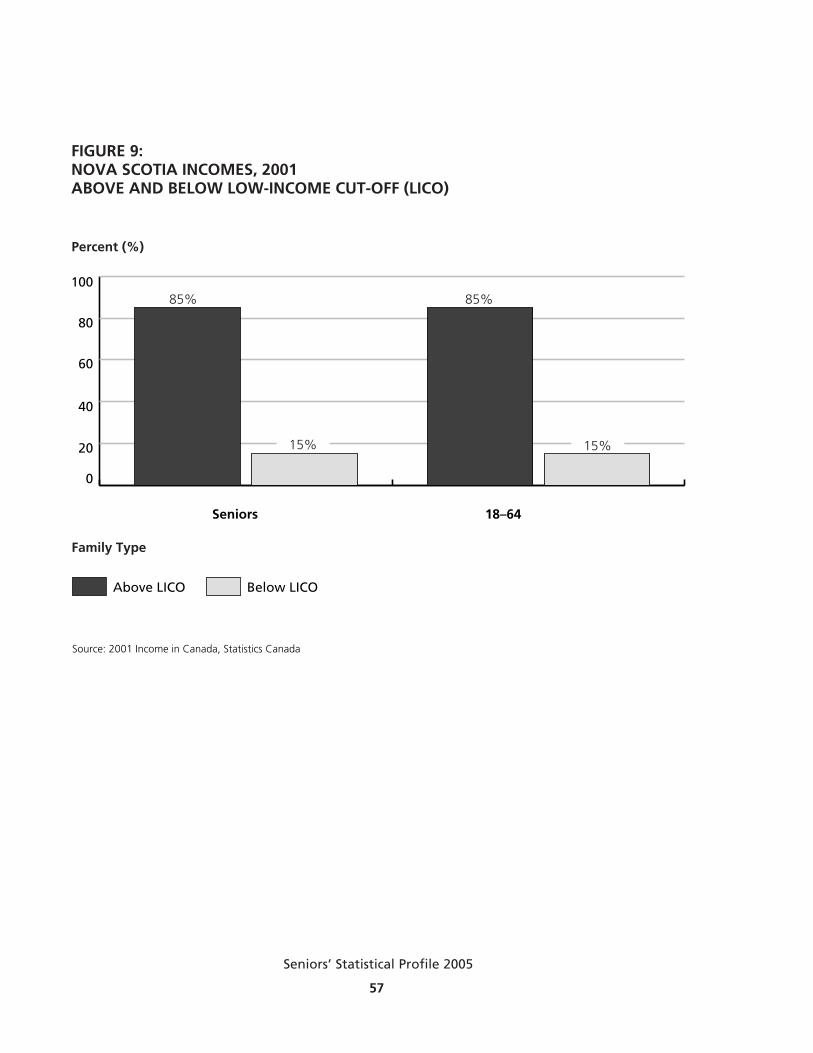
The overall incidence of poverty for Nova Scotia seniors is comparable to the rate foryounger adults in the 18–64 age group (Table 33). Federal programs such as Old AgeSecurity, Guaranteed Income Supplement, and Canada Pension Plan help ensure thatmost seniors are living above the poverty line. However, despite these income securityprograms, 3 in 20 seniors (15%) or 18,000 older Nova Scotians were living below thelow-income cut-off (LICO) in 2001. In comparison, 88,000 or 15 per cent of non-seniorswere living below the low-income cut-off.
The poverty rate for Nova Scotia seniors has generally been improving since 1981. Atthat time, nearly 4 in 10 (38%) of older women and one-quarter of men were living inpoverty. Fortunately, the overall trend has been favourable during the previous twodecades. The incidence for women has declined from 38 per cent in 1981 to 20 per centin 2001. The rate for men improved from 24 per cent to 8 per cent over the same timeperiod. In each of the past five years, there has been a steady reduction in the poverty ratefor senior women—dropping from 24 per cent in 1996.
The LICO is defined by Statistics Canada to represent the income level at which familiesare considerably worse off than average. In these situations a substantial proportion offamily income is going to essentials such as food, shelter, and clothing. The LICO isviewed by many to be the poverty line. LICO’s are set for various situations in Canada.
The size of the community is taken into account, as it is generally more expensive to livein more-populated areas. Family size is also considered in setting the LICO. The statisticsused in this report are based on the before-tax version of the LICO.
Two-thirds of seniors living in economic hardship are women living by themselves (Table33). Of the 18,000 seniors below the LICO, three-quarters (72%) or 13,000 were female(Figure 10). Senior men made up the remaining 4,000. The rate of economic hardshipamong senior women living alone is noteworthy. Nearly one-half (45%) of senior womenliving by themselves were living below the LICO.
56
Seniors’ Statistical Profile 2005
57
Seniors’ Statistical Profile 2005
Family Type
Source: 2001 Income in Canada, Statistics Canada
FIGURE 9: NOVA SCOTIA INCOMES, 2001 �ABOVE AND BELOW LOW-INCOME CUT-OFF (LICO)
Percent (%)
0
20
40
60
80
100
Below LICOAbove LICO
18–64Seniors
85% 85%
15% 15%
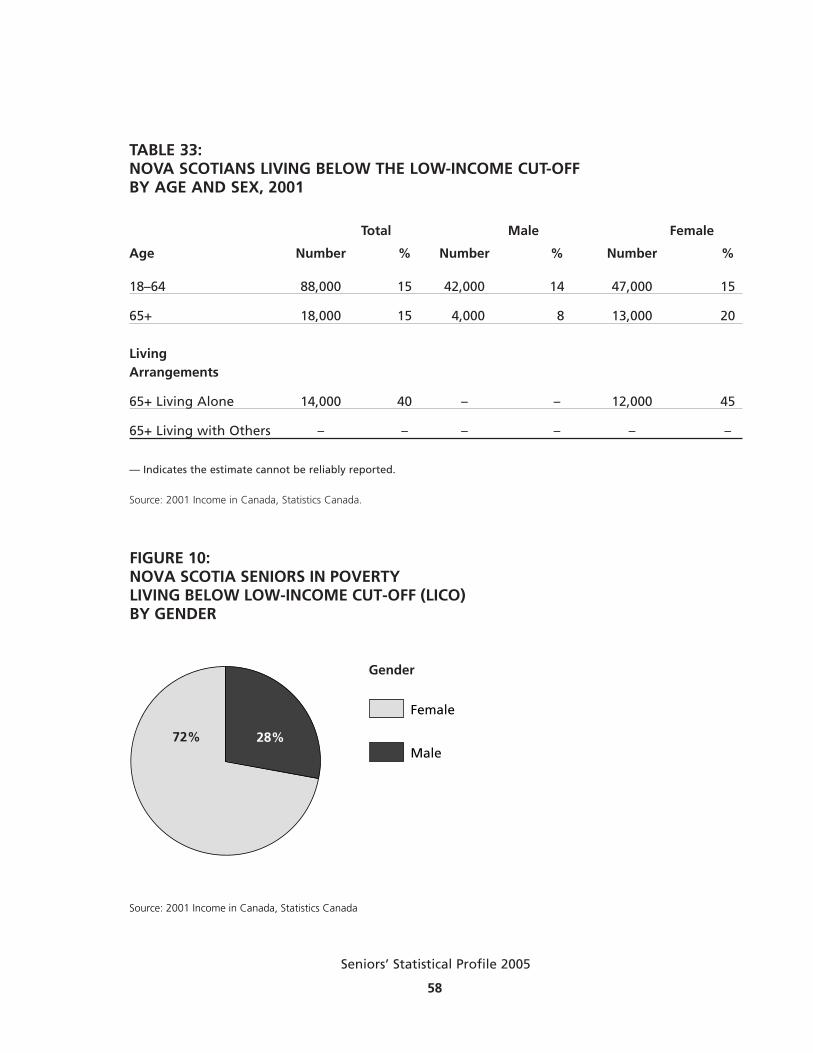
TABLE 33: NOVA SCOTIANS LIVING BELOW THE LOW-INCOME CUT-OFF BY AGE AND SEX, 2001
Total Male Female
Age Number % Number % Number %
18–64 88,000 15 42,000 14 47,000 15
65+ 18,000 15 4,000 8 13,000 20
Living Arrangements
65+ Living Alone 14,000 40 – – 12,000 45
65+ Living with Others – – – – – –
— Indicates the estimate cannot be reliably reported.
Source: 2001 Income in Canada, Statistics Canada.
58
Seniors’ Statistical Profile 2005
Gender
Source: 2001 Income in Canada, Statistics Canada
FIGURE 10: NOVA SCOTIA SENIORS IN POVERTY LIVING BELOW LOW-INCOME CUT-OFF (LICO) �BY GENDER
Female
Male28%72%
59
Seniors’ Statistical Profile 2005
HOME OWNERSHIP
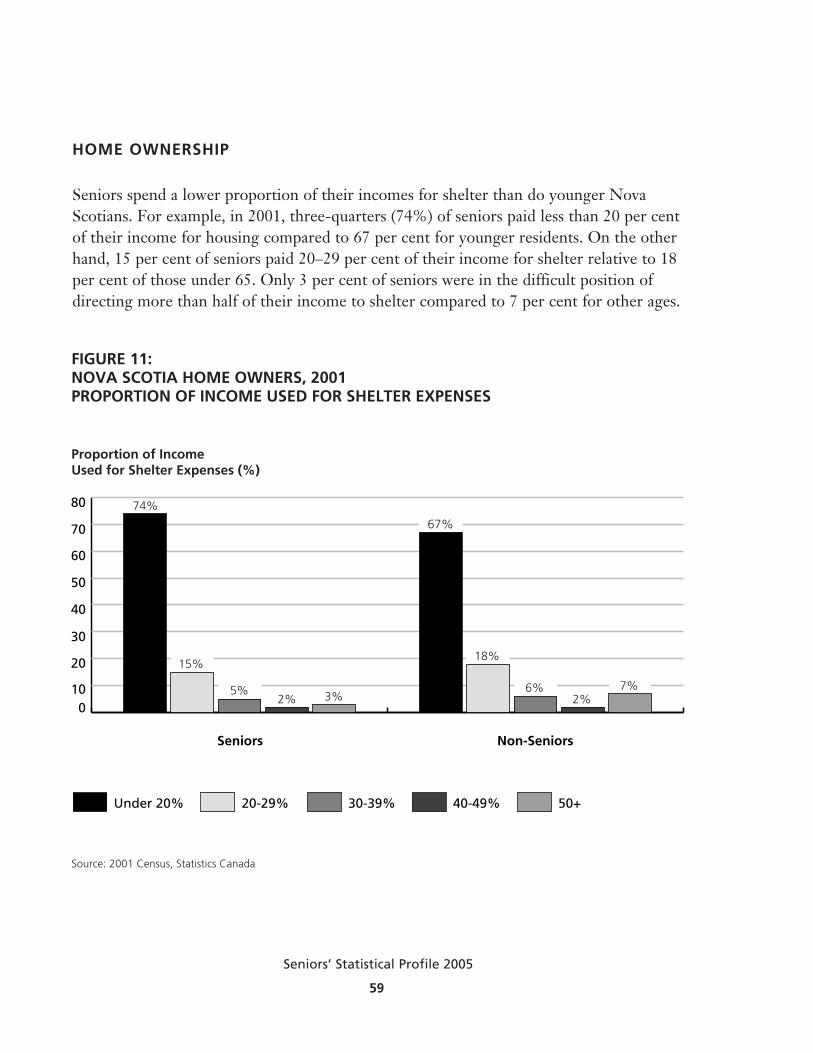
Seniors spend a lower proportion of their incomes for shelter than do younger NovaScotians. For example, in 2001, three-quarters (74%) of seniors paid less than 20 per centof their income for housing compared to 67 per cent for younger residents. On the otherhand, 15 per cent of seniors paid 20–29 per cent of their income for shelter relative to 18per cent of those under 65. Only 3 per cent of seniors were in the difficult position ofdirecting more than half of their income to shelter compared to 7 per cent for other ages.
Source: 2001 Census, Statistics Canada
FIGURE 11: NOVA SCOTIA HOME OWNERS, 2001�PROPORTION OF INCOME USED FOR SHELTER EXPENSES
Proportion of Income�Used for Shelter Expenses (%)
010
20
30
40
50
60
70
80
50+40-49%30-39%20-29%Under 20%
Non-SeniorsSeniors
74%
2% 3% 2%
15%
5%
67%
18%
6% 7%
60
Seniors’ Statistical Profile 2005
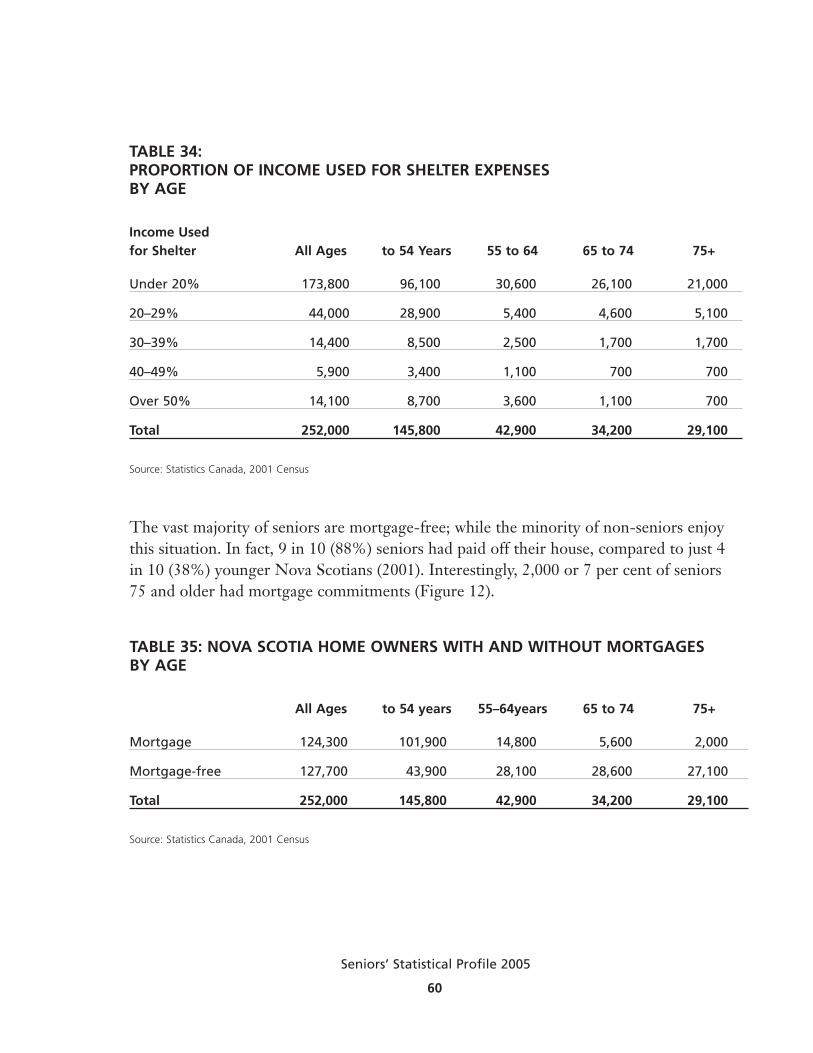
TABLE 34: PROPORTION OF INCOME USED FOR SHELTER EXPENSES BY AGE
Income Used for Shelter All Ages to 54 Years 55 to 64 65 to 74 75+
Under 20% 173,800 96,100 30,600 26,100 21,000
20–29% 44,000 28,900 5,400 4,600 5,100
30–39% 14,400 8,500 2,500 1,700 1,700
40–49% 5,900 3,400 1,100 700 700
Over 50% 14,100 8,700 3,600 1,100 700
Total 252,000 145,800 42,900 34,200 29,100
Source: Statistics Canada, 2001 Census
The vast majority of seniors are mortgage-free; while the minority of non-seniors enjoythis situation. In fact, 9 in 10 (88%) seniors had paid off their house, compared to just 4in 10 (38%) younger Nova Scotians (2001). Interestingly, 2,000 or 7 per cent of seniors75 and older had mortgage commitments (Figure 12).
TABLE 35: NOVA SCOTIA HOME OWNERS WITH AND WITHOUT MORTGAGES BY AGE
All Ages to 54 years 55–64years 65 to 74 75+
Mortgage 124,300 101,900 14,800 5,600 2,000
Mortgage-free 127,700 43,900 28,100 28,600 27,100
Total 252,000 145,800 42,900 34,200 29,100
Source: Statistics Canada, 2001 Census

61
Seniors’ Statistical Profile 2005
Presence of Mortgage
Source: 2001 Census, Statistics Canada
FIGURE 12: NOVA SCOTIA HOME OWNERS �PRESENCE OF MORTGAGE BY AGE
0
50,000
100,000
150,000
200,000
250,000
300,000
75+65–74 years55–64 yearsTo 54 yearsAll Ages
TotalMortgage-freeMortgage
Number of Homeowners

62
Seniors’ Statistical Profile 2005
FAMILY EXPENDITURES
As with the rest of the population, seniors devote a large share of their overall spending tofood, shelter, transportation, and household operation (Table 36). In 2003, senior familyhouseholds spent over half (55%) of their income on these essentials—somewhat more thannon-senior families—50–64 (47%) and under 50 (49%). Other significant expenditures forseniors included health care (6%) and recreation (4%).
Seniors are considerably more generous than non-seniors. It is noteworthy that seniorsspent 5.5 per cent of their income on gifts and charitable contributions—over five timesas much as residents under 50 and double those 50–64. Although seniors’ tax paymentsare considerable, they tend to pay less in taxes than younger people. Seniors paid 11.1 percent of their income towards taxes, in contrast to 19.3 per cent for people 50–64 and 19.8per cent for those under 50.

63
Seniors’ Statistical Profile 2005
TABLE 36: FAMILY EXPENDITURE PROFILE (PERCENTAGE) BY AGE OF HEAD OF HOUSEHOLD
All Ages Under 50 50–64 Seniors
Food 11.3 11.0 11.0 13.5
Shelter 17.3 17.9 15.7 18.0
Household Operation 5.6 5.6 5.1 6.4
Household Furnishings 3.1 3.1 3.3 2.7
Clothing 3.9 4.1 4.0 2.9
Transportation 14.9 14.2 15.6 16.9
Health Care 3.0 2.3 3.3 5.8
Personal Care 1.4 1.5 1.4 1.4
Recreation 5.7 6.4 5.3 3.9
Reading and Education 2.2 2.5 2.4 .7
Tobacco, Alcohol, and Gaming 3.0 2.9 3.5 3.0
Personal Taxes 18.5 19.8 19.3 11.1
Insurance and Pensions 6.4 6.5 6.0 6.5
Charity and Gifts 1.8 .9 2.8 5.5
Miscellaneous 1.6 1.5 1.4 1.3
Total 100.0 100.0 100.0 100.0
Source: Statistics Canada, 2003 Survey of Household Expenditures
65
Seniors’ Statistical Profile 2005
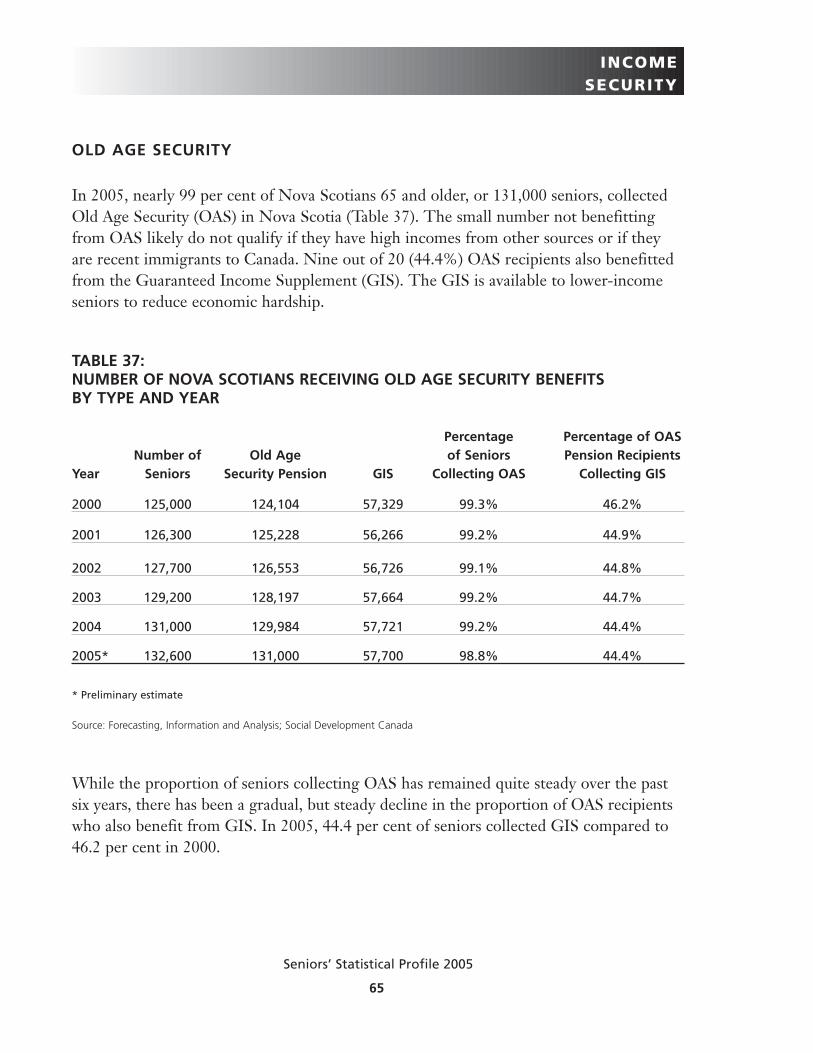
OLD AGE SECURITY
In 2005, nearly 99 per cent of Nova Scotians 65 and older, or 131,000 seniors, collectedOld Age Security (OAS) in Nova Scotia (Table 37). The small number not benefittingfrom OAS likely do not qualify if they have high incomes from other sources or if theyare recent immigrants to Canada. Nine out of 20 (44.4%) OAS recipients also benefittedfrom the Guaranteed Income Supplement (GIS). The GIS is available to lower-incomeseniors to reduce economic hardship.
TABLE 37: NUMBER OF NOVA SCOTIANS RECEIVING OLD AGE SECURITY BENEFITS BY TYPE AND YEAR
Percentage Percentage of OASNumber of Old Age of Seniors Pension Recipients
Year Seniors Security Pension GIS Collecting OAS Collecting GIS
2000 125,000 124,104 57,329 99.3% 46.2%
2001 126,300 125,228 56,266 99.2% 44.9%
2002 127,700 126,553 56,726 99.1% 44.8%
2003 129,200 128,197 57,664 99.2% 44.7%
2004 131,000 129,984 57,721 99.2% 44.4%
2005* 132,600 131,000 57,700 98.8% 44.4%
* Preliminary estimate
Source: Forecasting, Information and Analysis; Social Development Canada
While the proportion of seniors collecting OAS has remained quite steady over the pastsix years, there has been a gradual, but steady decline in the proportion of OAS recipientswho also benefit from GIS. In 2005, 44.4 per cent of seniors collected GIS compared to46.2 per cent in 2000.
INCOME SECURITY
GUARANTEED INCOME SUPPLEMENT
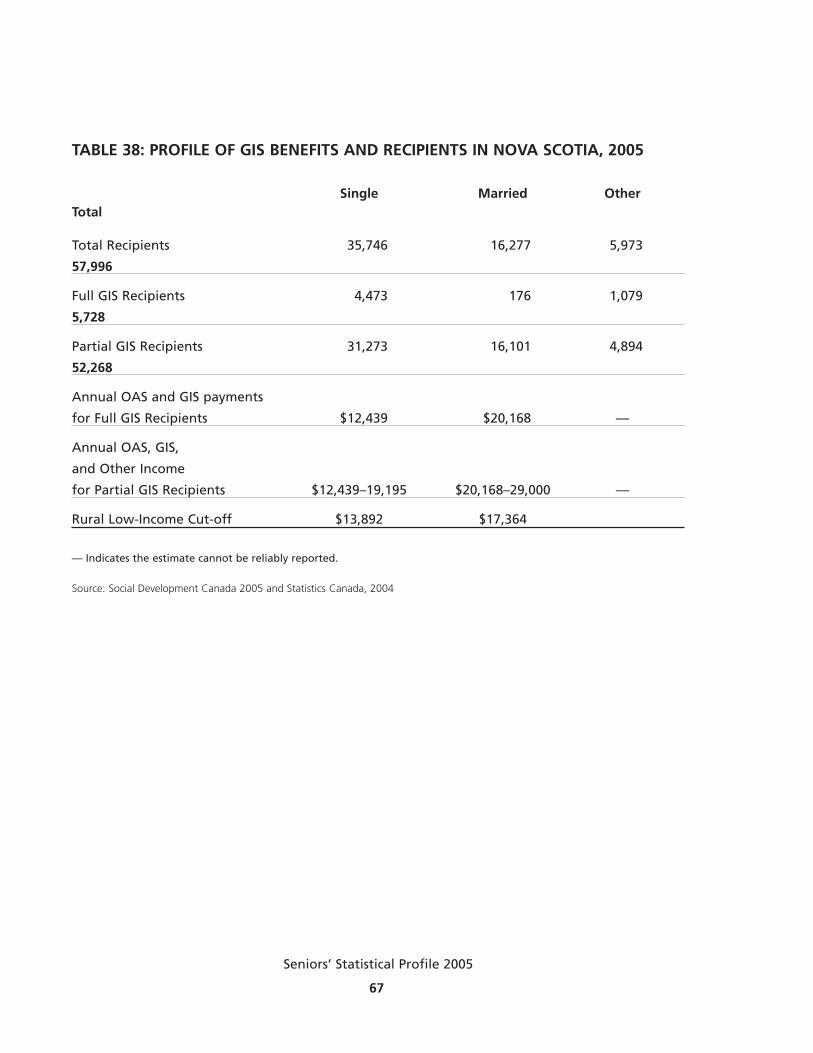
As mentioned earlier, federal GIS payments are made to low-income seniors. The majorityof GIS recipients in Nova Scotia are single. Table 38 shows that 6 in 10 (62%) of the57,996 seniors who collected GIS in 2005 were single. One in 10 (10%) seniors whoreceive GIS qualifies for the full supplement. Four-fifths (78%) of seniors collecting thefull supplement were single.
A senior household that has no additional sources of income beyond OAS collects themaximum supplement. In 2005, a full OAS payment and full GIS provided a single seniorwith an income of $12,439, and a married couple with an income of $20,168. Over fivethousand (5,728) seniors relied exclusively on OAS and GIS payments as their onlysources of income. A partial supplement is paid to the point when OAS, GIS, and otherincome totals $19,195 for an individual and $29,000 for a married couple.
Table 38 also shows the low-income cut-offs (LICO) for urban and rural Nova Scotia.The LICOs range from $13,892 for a senior living alone in rural Nova Scotia, to$21,5561 for an urban married couple (i.e., Halifax Regional Municipality or Cape BretonRegional Municipality). These levels illustrate why single seniors are at a greater risk ofbeing economically strained. Single seniors in both rural and urban Nova Scotia receivingthe maximum GIS and OAS are considered to be living below the poverty line. A singlesenior receiving the maximum GIS and OAS would be somewhat below ($1,453) theLICO in rural Nova Scotia and considerably under ($4,802) in urban Nova Scotia.Married couples are well above ($2,804) the LICO in rural Nova Scotia and just below($1,383) the low-income mark (2002) in urban Nova Scotia.
66
Seniors’ Statistical Profile 2005
67
Seniors’ Statistical Profile 2005
TABLE 38: PROFILE OF GIS BENEFITS AND RECIPIENTS IN NOVA SCOTIA, 2005
Single Married OtherTotal
Total Recipients 35,746 16,277 5,973
57,996
Full GIS Recipients 4,473 176 1,079
5,728
Partial GIS Recipients 31,273 16,101 4,894
52,268
Annual OAS and GIS payments
for Full GIS Recipients $12,439 $20,168 ––
Annual OAS, GIS,
and Other Income
for Partial GIS Recipients $12,439–19,195 $20,168–29,000 ––
Rural Low-Income Cut-off $13,892 $17,364
— Indicates the estimate cannot be reliably reported.
Source: Social Development Canada 2005 and Statistics Canada, 2004
RECEIVING CARE
Most seniors spend a considerable amount of time looking after themselves and theirhomes. Many seniors, however, are fortunate to receive assistance with household work,personal chores, and care. Figure 13 and Table 12 show that unpaid care is provided toseniors by persons of all ages. Adults between 45 and 54 are most likely to be caring for asenior.
One-third (30%) of the members of this group contributed to the care of a senior in 2001.Fourteen per cent of the 45–54 age group provided up to 5 hours of care each week, while6 per cent provided 5 to 9 hours of care, and 10 per cent contributed over 10 hours.Seniors are very involved in the care of other seniors. Three in 20 (17%) seniors providedunpaid care to another senior. Among other ages, the proportion providing care rangedfrom 13 per cent for 15- to 34-year-olds, 27 per cent for 55- to 64-year-olds, and 25 percent for the 35–44 age group.
While men often provide care to seniors, women provide most of this assistance (Table 12).One in four (25%) women acted as a caregiver to a senior in 2001, compared to 17 percent of men. More than twice (2.1 times) as many women assisted seniors for over 10hours a week. The number of female caregivers was 25 per cent higher in the one- tofour-hour category and 80 per cent higher for five to nine hours.
69
Seniors’ Statistical Profile 2005
CARING

70
Seniors’ Statistical Profile 2005
Source: 2001 Census, Statistics Canada
FIGURE 13: NOVA SCOTIANS HELPING SENIORS, 2001 �HOURS OF UNPAID CARE PROVIDED TO SENIORS �BY AGE
Percent (%)
0
20
40
60
80
100
10+ Hours5–9 HoursUnder 5 HoursNo Hours
SeniorsAge 55–64Age 45–54Age 35–44Age 15–34
8% 7%3%
7%11%
6%10%10%
6%7%6%3%2%
83%
73%70%
87%
Hours of Unpaid Care
75%
13% 14%

TABLE 39: HOURS OF UNPAID CARE TO NOVA SCOTIA SENIORS BY AGE OF CAREGIVER, 2001
Age 0 Hours 1 to 4 Hours 5 to 9 Hours over 10 Hours
Male and Female
15–34 204,000 19,400 5,300 6,700
35–44 118,400 19,700 7,600 11,800
45–54 101,200 20,800 8,600 13,900
55–64 71,200 10,100 5,500 10,300
65+ 102,300 8,700 4,000 8,600
Total 597,000 78,700 31,000 51,200
Male
15–34 102,200 8,500 6,200 2,400
35–44 60,600 8,400 2,600 3,600
45–54 52,300 9,500 3,100 4,300
55–64 37,100 4,700 2,000 3,000
65+ 44,500 3,800 1,500 3,000
Total 296,700 35,000 11,100 16,400
Female
15–34 101,800 10,900 3,300 4,300
35–44 57,800 11,200 5,000 8,200
45–54 48,900 11,200 5,500 9,600
55–64 34,000 5,400 3,400 7,300
65+ 57,800 4,900 2,600 5,600
Total 300,400 43,700 19,900 34,900
Source: Statistics Canada, 2001Census
71
Seniors’ Statistical Profile 2005

PROVIDING CHILD CARE
It is important to note that the provision of support in the home goes both ways.Thousands of Nova Scotia seniors provided unpaid child care. One in 10 or 12,900 seniors cared for a young child in 2001. Almost half (45%) of this care was in the range of1 to 4 hours per week, 30 per cent was between 5 and 14 hours, and the remainder (25%)exceeded 14 hours (Table 40).
72
Seniors’ Statistical Profile 2005

TABLE 40:HOURS OF UNPAID CHILD CARE IN NOVA SCOTIA BY AGE OF CAREGIVER, 2001
Age 0 Hours 1 to 4 Hours 5 to 14 Hours over 14 Hours
Male and Female
15–34 145,900 18,400 14,700 53,100
35–44 54,300 12,700 23,000 61,700
45–54 85,100 16,500 16,800 19,000
55–64 71,900 8,000 6,800 5,200
65+ 106,400 5,800 3,900 3,200
Total 463,600 61,300 65,200 142,300
Male
15–34 80,500 9,200 8,300 15,600
35–44 30,100 7,800 12,900 22,700
45–54 42,300 8,900 8,100 7,700
55–64 37,200 3,800 2,600 1,800
65+ 46,200 2,500 1,500 1,000
Total 236,300 32,000 33,400 49,100
Female
15–34 65,400 9,200 6,400 37,300
35–44 24,200 5,000 10,100 38,900
45–54 42,800 7,600 8,700 11,400
55–64 34,700 4,100 4,200 3,400
65+ 60,200 3,300 2,400 2,200
Total 227,300 29,300 31,800 93,200
Source: Statistics Canada, 2001 Census
73
Seniors’ Statistical Profile 2005

TABLE 41: HOUSEHOLD CONTRIBUTIONS TO CHARITY BY AGE OF HEAD OF HOUSEHOLD, 2003
All Ages Under 50 50–64 Seniors
Average Donation Per household 451 280 539 749
Average % of Total
Household Expenditures 0.8% 0.4% 1.0% 2.3%
% of Households
Making a Donation 72% 70% 73% 77%
Total Donations ($millions) $163 $52 $53 $58
% of Total Donations 100% 32% 33% 36%
Source: Statistics Canada, 2003 Survey of Household Expenditures
74
Seniors’ Statistical Profile 2005
GENEROSITY
Seniors are extremely generous, both in absolute and relative terms. On average, seniorsdonated $749 to charity in 2003—considerably more than the average of $451 for all ages.Seniors’ generosity is even more impressive in the context of their total expenditures.Over 2 per cent (2.3%) of senior household expenditures went to charity—almost sixtimes the rate for those under 50. The vast majority (77%) of senior households donatedto charity. While Nova Scotians as a whole tend to be generous, seniors are even more so.Of the $163 million in personal donations made by Nova Scotians, over one-third (36%)or $58 million came from seniors. The 50–64 age group ranked second in generosity.Three-quarters (73%) of the members of this group donated, with average donationsamounting to $539 per year.

PREVALENCE OF DISABILITIES
A significant portion of seniors reported difficulties carrying out activities of daily living.These individuals were considered to be living with a disability. Disability rates increasesteadily with age. Adults 75 and older had the highest rate of disability. Six in 10 (61%) members of this group reported a condition that reduced the amount or kinds of activitiesthey could participate in.
The rate of disability was comparable for males and females in all age groups. In the case of75+ group, the rates were exactly the same (61%) for both male and female. Two in five(40%) Nova Scotians in the 65–74 age group reported a disability. The disability rateamong these young seniors was five-fold the rate for the 15–44 age group.
75
Seniors’ Statistical Profile 2005
TABLE 42: DISABILITY RATES FOR NOVA SCOTIANS BY AGE AND SEX, 2001
Age Group % Population % Male % Female
15–44 8 8 9
45–64 24 25 23
65–74 40 39 40
75+ 61 61 61
Source: Statistics Canada, 2001 Participation and Activity Survey
DISABILITY
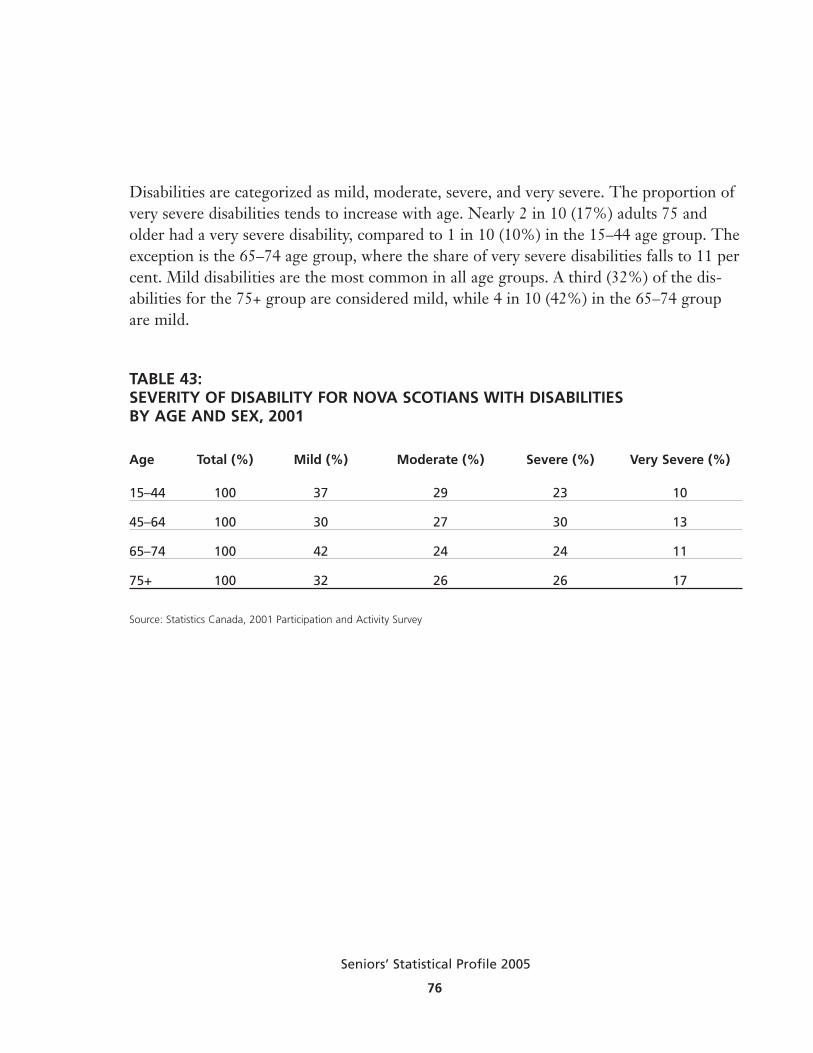
Disabilities are categorized as mild, moderate, severe, and very severe. The proportion ofvery severe disabilities tends to increase with age. Nearly 2 in 10 (17%) adults 75 andolder had a very severe disability, compared to 1 in 10 (10%) in the 15–44 age group. Theexception is the 65–74 age group, where the share of very severe disabilities falls to 11 percent. Mild disabilities are the most common in all age groups. A third (32%) of the dis-abilities for the 75+ group are considered mild, while 4 in 10 (42%) in the 65–74 groupare mild.
TABLE 43: SEVERITY OF DISABILITY FOR NOVA SCOTIANS WITH DISABILITIES BY AGE AND SEX, 2001
Age Total (%) Mild (%) Moderate (%) Severe (%) Very Severe (%)
15–44 100 37 29 23 10
45–64 100 30 27 30 13
65–74 100 42 24 24 11
75+ 100 32 26 26 17
Source: Statistics Canada, 2001 Participation and Activity Survey
76
Seniors’ Statistical Profile 2005

TRAVEL
Nova Scotians continue to travel well into their later years. Nova Scotians 65 and overmade 543,000 trips within Nova Scotia in 2003. In fact, 9.3 per cent of all trips by NovaScotians were made by members of this age group. Each of these trips was at least 80kilometres away from home or involved an overnight stay. This volume of travel equatedto an average of over four (4.2) trips per senior.
LEISURE
TABLE 44: TRAVEL IN NOVA SCOTIA BY NOVA SCOTIAN, PERSON TRIPS BY AGE, 2003
Age Group Person Trips % of Person Trips
0–54 4,398,000 75.4
55–64 892,000 15.3
65–69 235,000 4.0
70+ 308,000 5.3
Total 5,833,000 100.0
Source: Statistics Canada, 2003 Canadian Travel Survey
Older Nova Scotians are also active travelling outside of the province. Seniors took95,000 trips and accounted for 8.1 per cent of all travel to other provinces in Canada.
TABLE 45: TRAVEL BY NOVA SCOTIANS TO OTHER PROVINCES, PERSON TRIPS BY AGE, 2003
Age Group Person Trips % of Person Trips
0–54 967,000 82.6
55–64 109,000 9.3
65–69 41,000 3.5
70+ 54,000 4.6
Total 1,171,000 100.0
Source: Statistics Canada, 2003 Canadian Travel Survey
77
Seniors’ Statistical Profile 2005
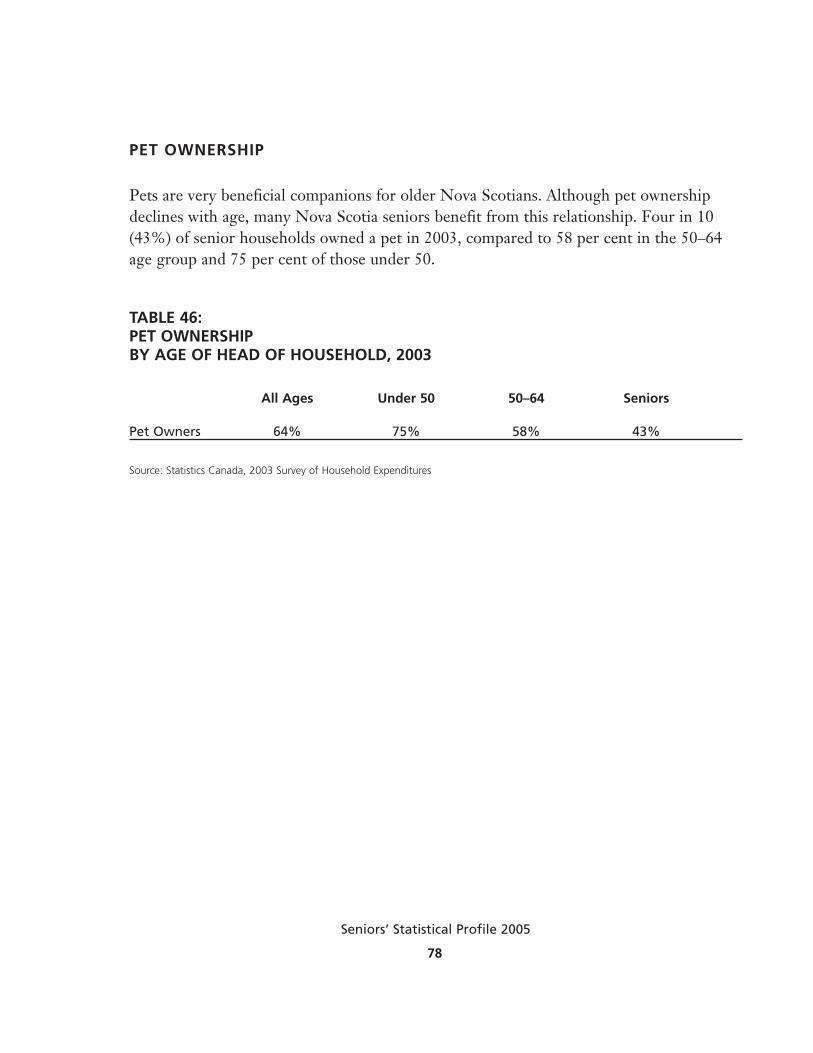
PET OWNERSHIP
Pets are very beneficial companions for older Nova Scotians. Although pet ownershipdeclines with age, many Nova Scotia seniors benefit from this relationship. Four in 10(43%) of senior households owned a pet in 2003, compared to 58 per cent in the 50–64age group and 75 per cent of those under 50.
TABLE 46: PET OWNERSHIP BY AGE OF HEAD OF HOUSEHOLD, 2003
All Ages Under 50 50–64 Seniors
Pet Owners 64% 75% 58% 43%
Source: Statistics Canada, 2003 Survey of Household Expenditures
78
Seniors’ Statistical Profile 2005


