1OCTOBER 1997 2387 LEE AND WILHELMSON q 1997 American Meteorological Society The Numerical Simulation of Nonsupercell Tornadogenesis. Part II: Evolution of a Family of Tornadoes along a Weak Outflow Boundary BRUCE D. LEE* AND ROBERT B. WILHELMSON Department of Atmospheric Sciences and National Center for Supercomputing Applications, University of Illinois, Urbana, Illinois (Manuscript received 6 November 1996, in final form 31 March 1997) ABSTRACT Nonsupercell tornadogenesis along a weak outflow boundary has been simulated using a three-dimensional moist convective cloud model. Thermodynamic conditions similar to those observed for nonsupercell tornado (NST) events of the High Plains were utilized in the model initialization. As the ensemble system of storm, outflow boundary, and leading edge vortices evolve, six distinct life cycle stages for the development and decay of NSTs are documented that span a period of about 35 min. Consistent with the results of Part I of this numerical study, vortex sheet dynamics exert considerable control over the outflow leading edge. The progression of pretornadic life cycle stages serves to concentrate vertical vorticity effectively along the outflow boundary in discrete misocyclone circulations aligned in a 3-km wavelength pattern. The organization of larger-scale mis- ocyclones and ultimate intensification to initial tornadic intensity occurs coincident with the rapid development of deep convection overhead. The strongest members of a family of NSTs that develop in the model maintain ground-relative surface wind speeds of greater than 30 m s 21 for approximately 11 min within which wind speeds meet F1 severity criteria for 6 min. The mature vortices reach the midlevels of the moist convection and display deep, rotationally induced axial downdrafts. The rapid transition to a predominant downdraft character for the storm complex and to an outflow dominated subcloud air mass heralds the onset of NST dissipation. The NST evolution simulated here compares very favorably to observational NST studies. The misocyclones are shown to provide an asymmetric pattern of convective forcing along the outflow boundary, which supports the formation of deep moist convection directly over them. Vertical vorticity in the boundary layer misocyclones is redistributed upward into the midlevels of the moist convection (;6 km) by developing deep updrafts. The mature vortices are maintained by vertical vorticity transported from a vortex sheet located along the outflow boundary and by vertical vorticity produced from the tilting of horizontal vorticity in the inflow region southeast of the NSTs. Low-level vortex stretching is the dominant vorticity tendency term as the vortices intensify to and maintain tornadic strength. No significant vertical tilting of baroclinically generated horizontal vorticity was indicated even after convective downdraft-associated new outflow pools formed in the environment surrounding the misocyclones. These new outflow pools play a major role in NST intensification by increasing convergence and resultant vortex stretching along the periphery of the tornadic circulations. A comparative simulation with rain production turned off, which precluded the possibility of new outflow devel- opment, revealed that NST intensity was roughly 25% greater in the baseline simulation. In an additional comparative simulation where no moist convection was allowed to develop, the resultant misocyclones markedly lacked the coherent organization and intensity of the misocyclones and NSTs of the baseline simulation and no NST-strength vortices developed. A six-stage ‘‘refined’’ model of NST development and decay is presented. 1. Introduction In Part I of this series of articles on the simulation of nonsupercell tornadogenesis (NSTG), misocyclone initiation and evolution were investigated along outflow boundaries possessing significant across-front horizon- tal shear with a dry, nonhydrostatic, three-dimensional *Current affiliation: Department of Earth Sciences, University of Northern Colorado, Greeley, Colorado. Corresponding author address: Dr. Bruce D. Lee, Department of Earth Sciences, University of Northern Colorado, 501 20th Street, Greeley, CO 80639. E-mail: [email protected]numerical model (Lee and Wilhelmson 1997, hereafter LW97). Misocyclone circulations, which by definition (Fujita 1981) have diameters less than 4 km, are the parent circulations of nonsupercell tornadoes. The sen- sitivity of misocyclone development to variations in en- vironment vertical shear, across-front horizontal shear, and ambient stability were presented in addition to an examination of the influence surface friction has on mis- ocyclone evolution. In this paper, NSTG is simulated in a moist environ- ment with a three-dimensional convective cloud model. Tornadogenesis is examined along a weak outflow boundary with thermodynamic conditions similar to that often associated with observed nonsupercell tornado (NST) events of the High Plains. The overarching ob- jective of this phase of the numerical investigation in-
Transcript
1 OCTOBER 1997 2387L E E A N D W I L H E L M S O N
q 1997 American Meteorological Society
The Numerical Simulation of Nonsupercell Tornadogenesis. Part II: Evolution of aFamily of Tornadoes along a Weak Outflow Boundary
BRUCE D. LEE* AND ROBERT B. WILHELMSON
Department of Atmospheric Sciences and National Center for Supercomputing Applications, University of Illinois, Urbana, Illinois
(Manuscript received 6 November 1996, in final form 31 March 1997)
ABSTRACT
Nonsupercell tornadogenesis along a weak outflow boundary has been simulated using a three-dimensionalmoist convective cloud model. Thermodynamic conditions similar to those observed for nonsupercell tornado(NST) events of the High Plains were utilized in the model initialization. As the ensemble system of storm,outflow boundary, and leading edge vortices evolve, six distinct life cycle stages for the development and decayof NSTs are documented that span a period of about 35 min. Consistent with the results of Part I of this numericalstudy, vortex sheet dynamics exert considerable control over the outflow leading edge. The progression ofpretornadic life cycle stages serves to concentrate vertical vorticity effectively along the outflow boundary indiscrete misocyclone circulations aligned in a 3-km wavelength pattern. The organization of larger-scale mis-ocyclones and ultimate intensification to initial tornadic intensity occurs coincident with the rapid developmentof deep convection overhead. The strongest members of a family of NSTs that develop in the model maintainground-relative surface wind speeds of greater than 30 m s21 for approximately 11 min within which wind speedsmeet F1 severity criteria for 6 min. The mature vortices reach the midlevels of the moist convection and displaydeep, rotationally induced axial downdrafts. The rapid transition to a predominant downdraft character for thestorm complex and to an outflow dominated subcloud air mass heralds the onset of NST dissipation. The NSTevolution simulated here compares very favorably to observational NST studies.
The misocyclones are shown to provide an asymmetric pattern of convective forcing along the outflowboundary, which supports the formation of deep moist convection directly over them. Vertical vorticity in theboundary layer misocyclones is redistributed upward into the midlevels of the moist convection (;6 km) bydeveloping deep updrafts. The mature vortices are maintained by vertical vorticity transported from a vortexsheet located along the outflow boundary and by vertical vorticity produced from the tilting of horizontal vorticityin the inflow region southeast of the NSTs. Low-level vortex stretching is the dominant vorticity tendency termas the vortices intensify to and maintain tornadic strength. No significant vertical tilting of baroclinically generatedhorizontal vorticity was indicated even after convective downdraft-associated new outflow pools formed in theenvironment surrounding the misocyclones. These new outflow pools play a major role in NST intensificationby increasing convergence and resultant vortex stretching along the periphery of the tornadic circulations. Acomparative simulation with rain production turned off, which precluded the possibility of new outflow devel-opment, revealed that NST intensity was roughly 25% greater in the baseline simulation. In an additionalcomparative simulation where no moist convection was allowed to develop, the resultant misocyclones markedlylacked the coherent organization and intensity of the misocyclones and NSTs of the baseline simulation and noNST-strength vortices developed. A six-stage ‘‘refined’’ model of NST development and decay is presented.
1. Introduction
In Part I of this series of articles on the simulationof nonsupercell tornadogenesis (NSTG), misocycloneinitiation and evolution were investigated along outflowboundaries possessing significant across-front horizon-tal shear with a dry, nonhydrostatic, three-dimensional
*Current affiliation: Department of Earth Sciences, University ofNorthern Colorado, Greeley, Colorado.
Corresponding author address: Dr. Bruce D. Lee, Department ofEarth Sciences, University of Northern Colorado, 501 20th Street,Greeley, CO 80639.E-mail: [email protected]
numerical model (Lee and Wilhelmson 1997, hereafterLW97). Misocyclone circulations, which by definition(Fujita 1981) have diameters less than 4 km, are theparent circulations of nonsupercell tornadoes. The sen-sitivity of misocyclone development to variations in en-vironment vertical shear, across-front horizontal shear,and ambient stability were presented in addition to anexamination of the influence surface friction has on mis-ocyclone evolution.
In this paper, NSTG is simulated in a moist environ-ment with a three-dimensional convective cloud model.Tornadogenesis is examined along a weak outflowboundary with thermodynamic conditions similar to thatoften associated with observed nonsupercell tornado(NST) events of the High Plains. The overarching ob-jective of this phase of the numerical investigation in-
2388 VOLUME 54J O U R N A L O F T H E A T M O S P H E R I C S C I E N C E S
volves the basic understanding of the life cycle stagesof NSTs and their parent misocyclones in the presenceand influence of deep moist convection. The process bywhich lower-tropospheric misocyclones influence thecharacter of the deep convection and how this deepconvection ultimately affects the intensification of themisocyclone is not well understood. Specifically, wewish to understand how storm processes such as thecreation of new outflow regions influence the NST. Twoadditional motivations for this research include 1) theconfirmation of various features associated with NSTsthat have only been rarely observed and 2) the verifi-cation and refinement of the observational model ofNSTG.
The reader is referred to LW97 for a review of ob-servational, theoretical, and modeling studies relevantto NSTs and NSTG. A short summary is included hereon NSTs and the conceptual model of NSTG that hasresulted from observational studies. The terms ‘‘non-supercell tornado’’ as given by Wakimoto and Wilson(1989, hereafter WW89) or ‘‘nonmesocyclone tornado’’as given by Brady and Szoke (1989, hereafter BS89)have been used to describe tornadoes associated withstorms not displaying the prominent pretornadic mid-level rotation found in supercell storms. Bluestein(1985) coined the name ‘‘landspout’’ to describe certainNSTs that have a similar visual appearance to water-spouts. The current ‘‘observational model’’ for NSTGbecame established as more NST cases were analyzed,most of which occurred near the National Center forAtmospheric Research’s observational network in north-east Colorado. Studies by Wilson (1986), WW89, andBS89 built the foundation for this model of NSTG.Common attributes of NST environments include 1) thepresence of a mesoscale surface boundary possessingsignificant across-front horizontal shear (i.e., verticalvorticity), 2) misocyclones circulations along theboundary, 3) rapidly growing cumulus congestus oryoung cumulonimbus along the boundary, and 4) onlyweak mid- and upper-tropospheric winds. If a fortunatejuxtaposition of moist convective updraft and misocy-clone occurs, the vortex may be stretched to tornadicintensity (see WW89’s Fig. 20). The results from a com-prehensive observational dual-Doppler study by Robertsand Wilson (1995, hereafter RW95) of the 15 June 1988Denver multiple NST event have closely matched andadded detail to this observational model. In contrast tothis model, Wilczak et al. (1992) found that the verticaltilting of baroclinically generated horizontal vorticityplayed an important role in tornado formation, based ona multiple-Doppler study of a Colorado NST.
The model and experimental design for these simu-lations are presented in section 2, followed in section3 by results detailing the development and decay of a‘‘family’’ of NSTs and associated deep moist convectionthat developed in this simulation. For clarity, the ex-pression family as used here defines several simulta-neously occurring tornadoes, as contrasted with certain
supercell family tornado events associated with cyclictornado production occurring over several-hour periods.In this study, a vortex is arbitrarily defined as an NSTwhen its ground relative winds exceed 30 m s21 (i.e.,high F0 velocity criteria; see Fujita 1981). In section 4an analysis of the life cycle of one particular tornadois presented, which includes an examination of vorticityredistribution, maintenance, and intensification. Section5 features the impact of new outflow from storms ini-tiating along the outflow leading edge on NST inten-sification and examines the effect of overhead deepmoist convection on the boundary layer misocyclones.A ‘‘refined’’ model of NSTG is presented in section 6that incorporates the results from observational studies,LW97, and this numerical investigation.
2. Model description and experimental design
a. The model
A three-dimensional, nonhydrostatic, quasi-com-pressible, finite difference convective cloud modelcalled MSTFLOW is employed to simulate NSTG alonga weak outflow boundary. This model is a hybrid spin-off of the Klemp and Wilhelmson (1978) cloud modeland the COMMAS model (Wicker and Wilhelmson1995) and was designed to utilize the massively parallelConnection Machine (CM-5) at the National Center forSupercomputing Applications. The high speed and largememory CM-5 proved to be an ideal platform on whichto run the high-resolution simulations necessary for thisinvestigation (see the appendix in LW97 for code per-formance information on this platform).
The MSTFLOW model is described in the appendix;consequently, only a broad summary is presented here.The Coriolis force is neglected in these experiments, inkeeping with the high Rossby number nature of theflows being simulated. MSTFLOW utilizes a Kesslercloud microphysics formulation similar to that used inKlemp and Wilhelmson (1978) and Durran and Klemp(1983). A diagnostic subgrid-scale mixing parameter-ization is employed (Smagorinsky 1963; Lilly 1962;Clark 1979). A bulk aerodynamic surface friction pa-rameterization identical to that employed by Wilhelm-son and Chen (1982) is included in the model to rep-resent a ‘‘semi-slip’’ condition at the model surface.Within this formulation, a drag coefficient (CD) of 0.002was used. A geometric mapping (Walko 1988) is usedto stretch the grid vertically. The model has rigid upperand lower boundaries (i.e., w 5 0). To prevent artificialreflection of vertically propagating gravity waves offthe upper domain lid, a Rayleigh sponge layer is appliedin the model above 11 km. The effective viscosity ofthis layer is gradually increased such that verticallypropagating waves have zero amplitude by the time theyreach the model top. The lateral boundaries were openin the west–east direction and cyclic in the north–southdirection. The open lateral boundary conditions used by
1 OCTOBER 1997 2389L E E A N D W I L H E L M S O N
FIG. 1. Initial configuration of the model domain that contains acold reservoir (dark gray transition shading), a region of southerlies(light gray shading with ‘‘S’’ designator), and the vertical profile ofthe west–east winds present over the entire domain (see text forspecific details).
FIG. 2. Hodographs representing the initial vertical structure of thehorizontal winds present in the western and eastern portions of themodel domain and a skew-T diagram of the thermodynamic condi-tions outside of the cold reservoir region.
Klemp and Wilhelmson (1978) are adopted and allowinternally generated gravity waves to pass smoothly outof the domain with a minimum of reflection. The cyclicnorth–south condition is both computationally efficientand effective for studying the time evolution of insta-bilities that have periodic characteristics in the north–south direction.
These simulations employed a 384 3 192 3 50 pointgrid with 60-m horizontal grid spacing and a stretchedvertical grid with spacing ranging from 40 m at thesurface to 700 m near the top of the domain. Thisstretched vertical grid configuration places 23 gridpoints in the dynamically critical surface to 2-km layer.The model domain size (23 km 3 11.5 km 3 14 km)shown in Fig. 1 was chosen such that NSTG and theconcurrently evolving storms at the outflow leadingedge could reach some semblance of maturity whileremaining well within the domain interior (with respectto the east–west domain boundaries). The domain wasallowed to move at the speed of the propagating densitycurrent initially and then tuned to the propagation speedof the vortex and storm system. The north–south domainwidth was selected such that this dimension would bemuch larger than the wavelength of the evolving mis-ocyclones along the leading edge (;1.3–3 km), thusensuring that the misocyclone wavelength is being driv-en by the dynamics of the problem and not the north–south dimension of the domain.
b. Initialization
The initial conditions are designed to represent anortheast Colorado NST scenario involving a weak out-flow boundary. This weak outflow boundary is createdin the model via a quasi ‘‘dam break’’ initializationwhereby a cold reservoir is allowed to collapse, creatingan outflowlike density current in the model domain (Fig.1) in a manner similar to that employed in Part I (seeLW97 for a detailed description of this outflow initial-
ization). The maximum temperature deficit in this res-ervoir is 22.5 K, a value typical of weak summer out-flow boundaries in northeast Colorado (Mahoney 1988).The initial cold reservoir shape is described by an el-liptical arc with a horizontal major axis radius of 7 kmand a vertical minor axis radius of 3.5 km. The reservoirtemperature deficit transitions from a maximum deficitalong the western boundary to no deficit using a cosinefunction of x. There is no vertical variation of pertur-bation potential temperature within the reservoir.
Heterogeneous initial conditions in the model windfield shown in Fig. 1 and on the hodographs of Fig. 2are utilized such that, as the outflow propagates forward,a region of significant horizontal shear (a vertical vortexsheet) is created at the leading edge. A broad transitionregion is included at the interior edge of the region ofsoutherly winds that avoids an artificial introduction ofa strong vertical vortex sheet into the model. Initialhorizontal shear (vertical vorticity) on the western pe-riphery of the region of southerlies in the boundary layerbefore cold reservoir collapse is 0.005 s21. The creationof a strong vortex sheet is left to the propagating outflow
2390 VOLUME 54J O U R N A L O F T H E A T M O S P H E R I C S C I E N C E S
boundary and its interaction with the southerly flow,which has a maximum magnitude of 15 m s21 near thesurface. The differential velocity of the line parallelwind (across the leading edge) based on observationalNST studies ranges from 5 to 30 m s21; thus our choiceof a 15 m s21 maximum southerly wind lies well withinthis observational range. The model domain wind fieldcontains a vertical shear profile in u such that outflowleading edge and the misocyclones residing there arevertically erect (Rotunno et al. 1988; Xu and Moncrieff1994; Chen 1995). Trial simulations using strong out-flow boundaries (temperature deficits up to 28 K) re-quired unrealistically large vertical shear magnitudes(relative to documented northeast Colorado NST cases)in the ambient environment to produce erect updraftstructure at the outflow leading edge. A thermodynamicprofile composited from several northeast ColoradoNST cases is used (Fig. 2) that features a convectiveavailable potential energy (CAPE) of 1060 m2 s22 anda lifted index of 25. This profile consists of a dry ad-iabatic boundary layer below a small capping inversionat the 670-mb level. An elevated well-mixed layer existsbetween 510 and 670 mb. The equilibrium level fromsurface based parcel ascent lies at the 210-mb level.
To introduce subtle three-dimensionality to the coldpool initial conditions, very small random thermal per-turbations were placed into the first eastern kilometerof the cold reservoir. These perturbations were assignedto two gridpoint groupings (120 m) in the y directionand had a height and length of 1 km. In total, 96 thermalperturbations whose magnitude randomly ranged be-tween 20.2 and 0.0 K were laid out along the cold poolleading edge.
A technique delaying the collapse of the cold poolfor a 200-s time period at the start of the model inte-gration was utilized to prevent the cold reservoir fromshearing apart given the environment of vertical shearin which it initially resided. To accomplish this, thepotential temperature field was prevented from updatingduring this 200-s span, while all other model variablesexcept the moist microphysics variables were allowedto update. As the pressure and vertical velocity fieldsresponded to the cold pool presence, a thermally directcirculation developed at the cold pool leading edge suchthat upon reaching 200 s, the cold reservoir collapsesin a more realistic manner.
c. Parameter studies
To further understand the role that storm processesplay in NSTG, two parameter studies were undertaken.The first of these involved the role played by precipi-tation-generated new outflow from overhead or directlyadjacent storms on the intensification and demise of theNST. A simulation designated ‘‘No-Qr’’ was conductedin which the rain microphysics processes in MSTFLOWwere turned off to prohibit ‘‘new’’ outflow developmentthrough evaporation and precipitation downloading. The
second parameter study involved the role played by theoverlying moist convection on the NSTG process. Toinvestigate this, the moist microphysics of MSTFLOWwere turned off entirely in a simulation designated ‘‘No-Qc,’’ such that cloud formation above the outflow lead-ing edge was eliminated along with the associated storminduced subcloud convergence. The results from bothof these simulations were qualitatively and quantita-tively contrasted with the baseline simulation, hereafterreferred to as ‘‘BASE.’’
3. Evolution of the NST family and associateddeep convection
a. Misocyclone and initial tornado development
The simulated outflow originates from the collapseof the cold pool reservoir, yielding a thunderstorm out-flowlike density current as in LW97. As the outflowpropagates eastward and encounters the region of low-level southerlies, significant horizontal shear is realizedacross the current’s leading edge, setting up a verticalvortex sheet (note that the winds within the outflow bodyare predominantly westerly). Regions of marked hori-zontal shear similar to that created in this simulationand aligned along boundary layer convergence lines areevident in observational NST studies (Wilson 1986;BS89; WW89; Wilczak et al. 1992; RW95). The cap-tivating part of the initial NSTG process lies not withthe development of this vortex sheet but with its break-down into horizontal shearing instabilities that are theinaugural circulations of developing misocyclones alongthe outflow leading edge. This vortex sheet breakdownis illustrated in the plan view perspective of verticalvorticity provided in Fig. 3 for selected times in theBASE simulation. The vortex sheet, fully developed by900 s, begins breaking down into individual instabilitiesof which nine are evident by 1020 s. These horizontalshearing instabilities are triggered by the subtle three-dimensionality provided by a weak lobe and cleft in-stability response at the outflow leading edge and anyresidual signal remaining from the small thermal per-turbations initially present at the leading edge of thecold pool. Lobe and cleft instability develops in thegravitationally unstable region at a density current’sleading edge where less dense ambient air is overrunby the current and attempts to rise up through the cur-rent’s nose, creating a pattern of lobes and clefts (seeFig. 5 in LW97; Simpson 1972). The evolution of thisvortex sheet into a line of misocyclones proceeds in thesame manner documented in the dry simulations ofLW97. From 900 to 1140 s, vortex sheet roll up isevident as the developing horizontal shearing instabil-ities of approximate 1.3-km wavelength create a clearpattern of vorticity rich and poor areas generated bypreferential advection of cyclonic vertical vorticityalong the sheet into the developing pools of vorticity.During this same period, selective amplification of the
1 OCTOBER 1997 2391L E E A N D W I L H E L M S O N
FIG. 3. Time sequence of the outflow leading edge surface vertical vorticity. Vertical vorticity contours plotted are 0.05, 0.1, 0.2, and 0.3s21. The gray arrows represent misocyclone paths from one time sequence to another.
fastest growing available modes determine the resultingpattern of vorticity maxima (Batchelor 1967). A beau-tiful observational example of this leading edge roll upmay be found in a study by Mueller and Carbone (1987)that looked at the dynamics of a thunderstorm outflowtransiting the Denver area on 19 June 1984. Note that,since a box speed in the north–south direction has beentuned to the average northerly motion of the vortices(;7.5 m s21), the vortices appear to have no northwardmotion in Fig. 3. Subharmonic interactions ongoingalong the leading edge between 1020 and 1860 s resultin 1) vortex pairing events between vortices of similarstrength that lead to vortex pair coalescence, and 2)extrusion events in which a stronger vortex extrudes thevorticity from its weaker neighbor(s). All of these pro-cesses ultimately result in the concentration of verticalvorticity and the increase in circulation at four discretelocations along the outflow leading edge by 1860 s. Tovisually trace the consolidation of vertical vorticityalong one section of the vortex sheet into the longerwavelength pattern (l ; 3 km) seen at 1860 s, graypaths in Fig. 3 may be followed from the original in-cipient instabilities to the large consolidated vortex lo-cated at y 5 8500 m. Note that the process of concen-trating vorticity along the sheet into the four major mis-ocyclones occurs over relatively short timescales (;15–20 min). The larger-scale entities at 1860 s, hereafter
designated as vortex/NST A, B, C, or D, shown in Fig.3, represent a concentration of eddy kinetic energy alongthe leading edge. The reader is referred to LW97 for adetailed look at the vortex dynamics of this misocyclonegeneration process. The merger of vortices seen hereshares much in common with the two-dimensional sim-ulations of perturbed vortex sheets by Riley and Metcalf(1980) and Corcos and Sherman (1984). Additionally,the coalescence processes involving these like-signedvortices are similar to those found by McWilliams(1984) for isolated coherent vortices in two-dimensionalturbulent flow. Convergence line misocyclone circula-tions that have been suggested to arise from horizontalshearing instability similar to that modeled here havebeen reported in observational NST studies (and studiesof other related vortices along convergence lines) byCarbone (1983), Wilson (1986), Mueller and Carbone(1987), BS89, WW89, and RW95. Note that since initialvortex sheet roll up and subsequent interactions takeplace on scales that are quite small (;1 km), many radarand numerical studies featuring boundaries possessingmarked horizontal shear never resolve these phenomena.
To gain a three-dimensional perspective of the en-semble evolution of the developing line of deep con-vection, the outflow boundary, and the misocyclonesand initial NSTs, Fig. 4 is provided. The perspective ofthe first three panels of Fig. 4 for times 1260, 1440, and
2392 VOLUME 54J O U R N A L O F T H E A T M O S P H E R I C S C I E N C E S
FIG. 4. Three-dimensional model renderings of the evolving ensemble of leading edge vortices, storm, and outflow boundary for 1260,1440, and 1860 s. At the domain base the blue color spectrum delineates the outflow boundary (darker 5 colder). The yellow vertical vortextubes are representative of vertical vorticity greater than 0.1 s21. The gray-scaled cloud isosurface represents cloud water greater than 0.2 gkg21. Viewing perspective in the first three panels is from an elevated position looking east, while the viewing position in the fourth panelis surface-based, looking southeast.
1860 s is from an elevated position looking east. At1260 s, a gradually deepening line of moist convection(maximum cloud top of 6.5 km) has initiated over theoutflow leading edge. Lying underneath this line of con-vection, misocyclone cores represented by the shallow(but rapidly deepening) vortex tubes are tied directly tothe leading edge of the outflow boundary, delineated bythe sharp coloration change from cyan to dark blue. Atthis time, there are seven prominent misocyclone cir-culations denoted by the vortex tubes and one weakcirculation located between the second and third prin-cipal circulations from the left (the weak vortex patchat y 5 8000 m seen at 1140 s in Fig. 3). The misocyclonecirculations may additionally be inferred from the wavepattern in the outflow leading edge thermal structurecreated by the cyclonic advection of cool outflow airaround the misocyclones. By 1440 s, the rightmost six
principal misocyclones are observed to pair off, while,concurrently, the line of rapidly deepening convectiontakes on a much more three-dimensional character withtowers reaching the 8.5-km level. Misocyclone mergerevents have been observed just prior to NST occurrenceson at least three occasions (Wilson 1986; Wilczak et al.1992; RW95). Animations of the model vorticity fieldsand massive particle trajectory releases indicate that thismerger process between vortices first takes place in theconvergent flow in the lowest few kilometers followedby a gradual consolidation at higher levels.1 By 1860 s,
1 Visualization of a Numerically Simulated Family of ‘‘Landspout’’Tornadoes Along a Weak Outflow Boundary is a 7-min video pro-duced at NCSA featuring the simulation analyzed in this article. Cop-ies are available from the authors upon request.
1 OCTOBER 1997 2393L E E A N D W I L H E L M S O N
FIG. 5. Photograph of three of six simultaneously occurring NSTs reported near Lazbuddie, Texas, on 4 June 1995. (Photograph copyrightP. Blottman).
a family of young NSTs is apparent, with three of thesecirculations resulting from misocyclone coalescenceevents. Vortices B, C, and D now qualify as youngNSTs, while the winds in vortex A fall just below NSTthreshold intensity (as defined in section 1) until theyexceed it at 2280 s. The model-rendered tornado familyis visually comparable to outbreaks of NSTs orientatedin a vortex row configuration such as pictured in Fig.5. The storms exhibit marked three-dimensional char-acter at 1860 s, with three large convective towers thathave reached an altitude of 10.5 km. The last panel inFig. 4 provides a ground-based close-up perspectivelooking southeast at the young NST family and cloudbase. Notable in this image is the major restructuringof the cloud base by the deepening misocyclone cir-culations. Encircling each vortex tube is a ‘‘collarlike’’cloud with a slightly lowered cloud base that is furtherbounded by a dry slot created from the entrainment ofnonsaturated air into the circulation at levels abovecloud base. Animations of the simulation from thisground-based perspective distinctly show the upwardprogression of these originally shallow circulations (viathe ascending vortex tubes) and clearly shows cloud-base motion reflecting these deepening circulations. Thecollarlike cloud-base structure and associated rotating‘‘swirl’’ appearance in the cloud base may be compa-rable to similar cloud-base appearance reported in ob-servational NST studies (BS89; WW89) and in somewaterspout observations (Golden 1971). In section 4, adetailed analysis of the development and demise of theNST B member of this tornado family is provided.
At low levels, a very coherent signal of the young
NSTs at 1860 s may be seen in the model wind, vorticity,and pressure fields in Fig. 6. Much similarity existsbetween the southernmost vortices (B, C, D), which areall products of misocyclone mergers, in stark contrastto the small northern vortex at y 5 10 600 m. As seenin the surface misocyclone-relative horizontal windfield, the vortex diameters, designated as the across-circulation diameter of the annulus of peak wind speed,ranged from 300 m for the small northern vortex to anaverage of 550 m for the southern three circulations. Toput these dimensions in perspective, WW89 and Wak-imoto and Martner (1992) have reported photogram-metrically retrieved NST widths ranging from 25 to 600m. At this initial NST stage, peak vertical vorticity wasapproximately 0.3 s21 for all four vortices; however, thedistribution of vorticity differed markedly from the vor-tex ring pattern seen for the young NSTs B and C to amore centralized vorticity maximum for vortex A andNST D. The surface pressure field in Fig. 6 has ap-proximately cyclostrophically adjusted to the NST low-level rotations, as may be seen using Eq. (1) below:
Dp ; r .2V t (1)
Assuming an average tangential velocity (Vt) for NSTsB, C, and D of 21 m s21 and a density (r) of 1.03 kgm23 for the near-surface environment, the expected per-turbation pressure deficit is 4.5 mb, a value close to theaverage pressure deficit observed of 4.6 mb (calculatedwith respect to the pressure field just outside the cir-culation proper). The vertical velocity field at the 250-mlevel shown in Fig. 6 features updraft regions encirclingthe vortices with peak updraft of approximately 7 m s21
2394 VOLUME 54J O U R N A L O F T H E A T M O S P H E R I C S C I E N C E S
FIG. 6. Horizontal cross sections at 1860 s of the misocyclone-relative horizontal surface wind(Vh), positive surface vertical vorticity (z), surface perturbation pressure (P9), and 250-m verticalvelocity (W). Contour intervals are 0.1 s21, 1 mb, and 2 m s21 for the vertical vorticity, per-turbation pressure, and vertical velocity plots, respectively. Maximum velocity vector (m s21)and field maxima and minima are shown in the lower right corner.
located along the eastern periphery of each young NST.Most interesting perhaps is the presence of an axialdowndraft at this level in each of the vortices exceptvortex A. The largest axial downdrafts exist in NSTs B(26.1 m s21) and C (24.5 m s21) and their existencemay explain the ringlike vorticity distribution seen forthese NSTs. As the downward axial flow nears the sur-face, a local divergence region results (and a region ofnegative vortex stretching), creating the vortex ring andgenerally wider circulation. These axial downdrafts willbe examined in greater detail in section 3c.
b. Development of moist convective asymmetry
Previous dry and moist simulations of misocycloneevolution along outflow boundaries have indicated thatthese circulations have a marked influence on the updraftdistribution along the outflow leading edge and shouldcorrespondingly affect the spatial distribution of deepconvection developing there (Lee 1994; LW97). Kings-mill (1995) suggested the possibility that misocyclonesalong an outflow boundary could initiate deep convec-tion but was unable to verify this hypothesis in an ob-servational study using a 1991 Convection and Precip-
itation/Electrification Project dataset from Florida. Inlight of these previous modeling results, Kingsmill’shypothesis appears to be justified. Model evidence in-dicates that the misocyclones do strongly influencestorm structure. Figure 7a shows the cloud-base updraftat the 2-km level at 1860 s. The major misocycloneshave strikingly altered the updraft distribution with‘‘hook’’-shaped updraft appendages wrapping wellaround the misocyclone circulations at this level. Thispattern is consistent with the slotted moist convectivecollar seen in the ground-based perspective of the fourthpanel of Fig. 4 and is the cloud-base reflection of amoist convective plume that nearly encircles the mis-ocyclone circulation up to the midlevels of this stormcomplex. A very narrow and weak axial downdraft maybe seen for NST B even at cloud-base level. Beginningaround 1860 s, rain wrapping around the deepening ma-jor misocyclone circulations is also being configured inhook patterns (corresponding to the slot of updraft min-ima to the inside of the updraft hooks) that notablyresemble in size and shape the radar reflectivity hooksdocumented by RW95 for one of the NSTs which oc-curred in the 15 June 1988 Denver NST outbreak (seetheir Fig. 8). Radar hook echoes, normally associated
1 OCTOBER 1997 2395L E E A N D W I L H E L M S O N
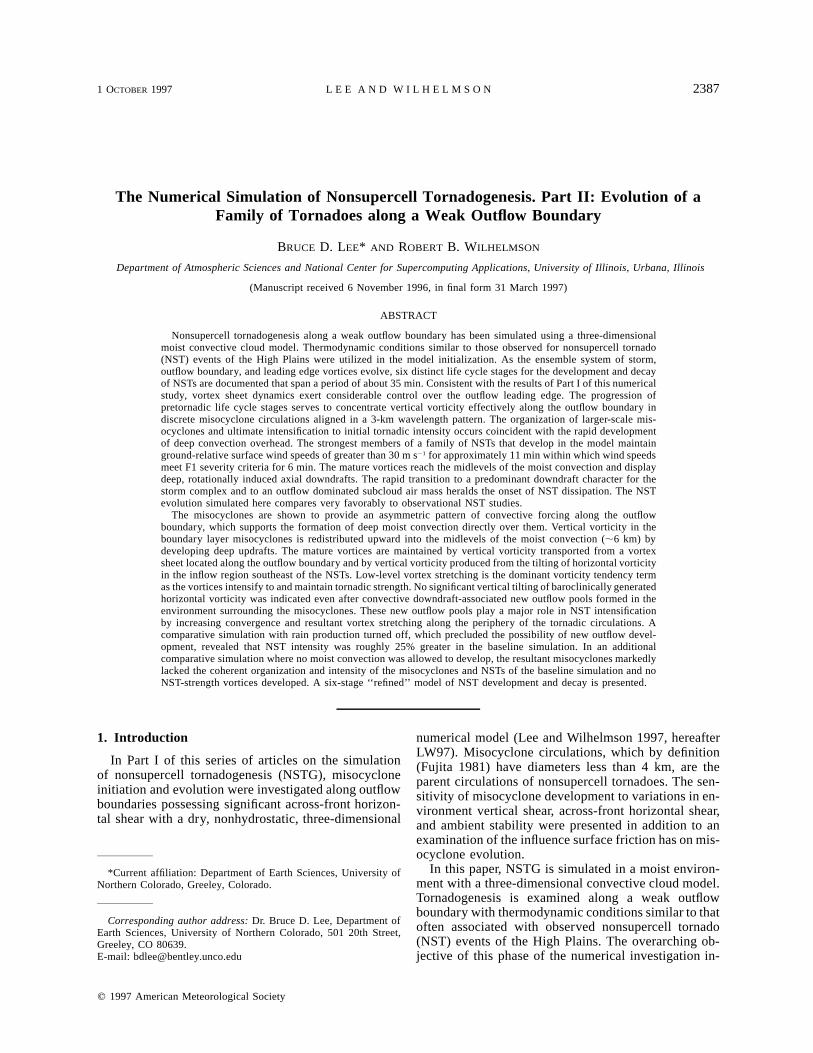
FIG. 7. Horizontal cross sections at 1860 s of (a) vertical velocity at 2000 m (cloud base) and(b) convergence at both the surface and at 500 m. (a) The dark shading denotes areas of updraftgreater than 10 m s21 and the x’s show the positions of the circulation centers at the surface.The vertical velocity contour interval is 4 m s21. (b) The light gray shading denotes surfaceconvergence greater than 0.01 s21 and the dark shading represents surface convergence greaterthan 0.05 s21. The heavy solid line in (b) represents convergence greater than 0.01 s21 at the500-m level.
with supercellular convection, have also been reportedwith other NST events (Wilson 1986; WW89; Wakimotoand Martner 1992) and additionally in waterspout cases(Golden 1974b; Golden and Sabones 1991).
To understand the boundary layer forcing driving, inpart, the pattern of updrafts seen in Fig. 7a, plots ofconvergence at the surface and at the 500-m level areprovided in Fig. 7b. Surface convergence of greater than0.01 s21 nearly encircle the vortices, with values largerthan 0.05 s21 found along the eastern side of the cir-culations. This low-level convergence pattern is prin-cipally produced by surface friction-induced radial in-flow. This convergent forcing around the low-level mis-ocyclone directly sustains the columnar updraft at lowlevels, which ultimately supports the moist convectionabove the boundary layer NST circulations. Concur-rently, the moist convection is providing a positive feed-back by inducing local convergence into the subcloudlayer above the misocyclones; thus, both mechanismswork cooperatively in supporting a deep misocycloneupdraft column. The deep convective updrafts betweenand to the east of the misocyclones at cloud base appear
better associated with the convergence pattern at 500m, seen in Fig. 7b. This convergence pattern is posi-tioned along the vertical thermal wall of the outflowboundary.
To shed further light on the convective forcing alongthe line, time-dependent misocyclone-relative trajectorystudies for the period between 1500 and 1900 s (i.e.,the period of final merger for the vortex pairs andmarked reconfiguration of the deepening convection)were run to identify the source regions supporting thestorm and updraft profiles seen in Figs. 4 and 7a. Thetrajectory analysis uses stored three-dimensional modeldatasets at 20 s intervals and employs a fourth-orderRunge–Kutta method for the time integration of the tra-jectories. Forty-six trajectories (every fourth grid point)were laid out in a north–south line approximately 400m east of the row of misocyclones along a path from y5 200 to 11 200 m and at an elevation of 200 m, asshown in Fig. 8. Most of the trajectories become en-trained in the low-level convergent flow field surround-ing the misocyclones and then rise rapidly in the strongboundary layer updrafts that the misocyclones and over-
2396 VOLUME 54J O U R N A L O F T H E A T M O S P H E R I C S C I E N C E S
FIG. 8. Time-dependent trajectories released at z 5 200 m and ata position 400 m to the east of the row of vortices. Forty-six trajec-tories were tracked from 1500 to 1900 s. The perspective is from anelevated position looking west. The tallest trajectory at 1900 s hasreached the 4200-m level.
head moist convection are driving. Clearly, the moistconvection just above the misocyclones is being sup-ported by air at low levels in the boundary layer thatis drawn into the misocyclone circulations and lifted.Slightly lowered cloud bases directly above the orga-nizing misocyclone circulations would further suggestthat this moist convection is tapping into air originatingjust above the surface, which is slightly more moist.Note that, in this simulation, rotationally induced pres-sure deficit is not accounted for in the model saturationvapor pressure calculation; thus, no pressure-inducedcloud lowerings are possible in the model as configured.To put the trajectory endpoint heights in Fig. 8 in properperspective, the highest trajectory has ascended to 4200m between 1500 and 1900 s. Trajectories that do notbecome entrained in the misocyclone flow fields suchas those between the middle two misocyclones rise com-paratively very little during this time. To further inves-tigate the source regions for air supporting the moistconvection, a backward time-dependent trajectory anal-ysis was conducted at 1900 s with a line of trajectoriesreleased along a line parallel to cloud base at cloud-base level (2000 m). During a 400-s time integration,this analysis demonstrated that the air feeding the moistconvection between the misocyclones largely originatedat elevations higher in the boundary layer and muchfarther upstream than the air supporting the moist con-vection atop the misocyclones. Parcels associated withthese trajectory paths between the misocyclones roseslowly in the boundary layer until encountering the out-flow wall between the misocyclones, at which point theparcels ascended rapidly to cloud base. This pattern ofdeep convective forcing near the misocyclone properand along the outflow boundary thermal wall just northof the misocyclones is consistent with the dry simulationresults of LW97. An in-depth numerical study of deepmoist convective forcing by misocyclone circulations iscurrently under way.
c. Tornado maturity and dissipationThe NSTs display generally steady character between
1860 and 2000 s, after which marked changes in ap-
pearance and intensity take place as new outflow fromthe line of storms begins to influence the circulations.Figure 9 is provided for a three-dimensional perspectiveof key stages in the maturation and dissipation of theNSTs. This visualization employs both the three-di-mensional isosurface renderings used in Fig. 4 and acolored massive particle trajectory release to yield qual-itative information on the vortex structure and verticalvelocity character. At 1980 s, the line of vortices is verysimilar to that seen in Fig. 4 for 1860 s (using the sameviewing perspective). The NST family members are ver-tically erect and situated along distinct open waves ap-parent in the surface temperature field, which result frommisocyclones aligned along the original outflow leadingedge. The NSTs also have very similar dimensions andintensity as seen at 1860 s in Fig. 6. The first region ofnew outflow reaching the surface is indicated by thedark blue area just to the east of the NST family at 1980s. New outflow, originating principally from the coolingcreated from evaporating precipitation, continues to de-scend and spread out along the surface both to the eastand west of the vortex row. Concurrent with this intro-duction of new cold pools bounding the NSTs, the vor-tices narrow and intensify markedly. The second panelof Fig. 9 for 2160 s displays a snapshot visualizationfrom a massive particle release, whereby 6500 particleswere introduced at locations along the outflow leadingedge where the vertical vorticity exceeded 0.04 s21,starting at 1200 s. The perspective here (and in the fourthpanel) is looking southwest from an elevated position.The green coloration is used for particles in updraft andthe red coloration for particles in downdraft. For a prop-er height perspective, particles at the very top of thispicture are at the approximate 6500-m level. This vi-sualization reveals very coherent vortex structure withmost particles in updraft at this time; however, note thestream of red particles in the center of NSTs B, C, andD. This stream of particles is aligned along an inten-sifying axial downdraft developing in these three strongvortices. In contrast, the more narrow and sinuous vor-tex A displays only updraft character through most ofits existence. By 2200 s (panel 3), the new cold poolsare indicated by the expanding dark blue regions wrap-ping around the periphery of the NST circulations. Notethat, in this visualization, a temperature-relative color-ation technique is employed at the domain surface suchthat the coldest temperatures at any particular time arecolored with the darkest blue shading. By 2200 s, someof the new cold pools have maximum perturbation po-tential temperature deficits at their center of 28 K. Atthis stage, the vortex intensity is nearing its peak. Asthis storm–NST system becomes more outflow domi-nated, especially after 2360 s, three of the vortices be-come highly tilted, as shown in the massive particlevisualization for 2504 s. Their low-level portions getundercut and advected by the strongest nearby cold poolin a similar fashion to that documented for a ColoradoNST occurring on 2 June 1987 (Wakimoto and Martner
1 OCTOBER 1997 2397L E E A N D W I L H E L M S O N
FIG. 9. Three-dimensional model renderings for times 1980 and 2200 s using the same criteria as in Fig. 4. Massive particle trajectoryvisualization is shown for times 2106 and 2504 s with a perspective looking southwest from an elevated position. The green and red colorcoding for the 6500 particles represents updraft and downdraft, respectively (see text for further details).
1992). These highly tilted vortices create a ‘‘roping out’’appearance quite common in the dissipation stages ofboth nonsupercell and supercell tornadoes. Note that,by 2504 s, red particles denoting downdraft make up alarge percentage of the total particles displayed, indi-cating that the cold negatively buoyant flow of the newcold pools has wrapped around the tornadic circulations,dissipating the low-level updrafts almost completely.The NST intensities continue to decline until the sim-ulation’s end at 2640 s.
A comparative examination of the NST family’s low-level features between 1860 s, shown in Fig. 6, and at2200 s, a time near maximum intensity shown in Fig.10, reveals major changes in the local flow regime inwhich the vortices reside, along with a marked changein vortex size and intensity. The average diameter by2200 s of the major NSTs (B, C, D) is approximately400 m with the diameter of vortices B and D contractingabout 30% since 1860 s. The principal flow regime
change occurring after 2000 s involved the introductionof new storm outflow regions into the low-level envi-ronment, seen as distinct divergence areas in the surfacehorizontal wind field. The configuration of the primaryoutflow divergence areas relative to the tornadic cir-culations for vortices B and C resembles the wrappingrear-flank downdraft portion of the classic Lemon andDoswell (1979) schematic of the low-level flow struc-ture of supercell thunderstorms, albeit on a smaller scale(see their Fig. 7). RW95 suggested that the interactionof new outflow with a misocyclone circulation similarto that modeled here was instrumental in vortex inten-sification for one of the 15 June 1988 Denver, Colorado,NSTs. Carbone (1983) reported on a case of NSTGalong a severe cold frontal rainband where the observedtornado occurred at a time coincident with the appear-ance of nearby spreading downdraft close to the surface.In this simulation, the three major NSTs were alreadyunder way for 3–4 min before new outflow pools in-
2398 VOLUME 54J O U R N A L O F T H E A T M O S P H E R I C S C I E N C E S
FIG. 10. Horizontal cross sections at 2200 s of the NST-relative horizontal surface wind (Vh),positive surface vertical vorticity (z), surface perturbation pressure (P9), and 250-m verticalvelocity (W). Contour intervals are 0.1 s21, 1 mb, and 3 m s21 for the vertical vorticity, per-turbation pressure, and vertical velocity plots, respectively. Maximum velocity vector (m s21)and field maxima and minima are shown in the lower right corner.
teracted with these vortices, so that the primary role ofthe outflow here is in the intensification of the NSTs.The major vortices reach F1 intensity soon after theseoutflows begin to encounter the surface circulations withpeak ground relative surface wind speed of 39 m s21
realized for NST B at 2280 s. Concurrent with the out-flow–vortex interactions, surface vertical vorticity at2200 s jumps to near 0.4 s21 in NST C and over 0.4s21 for NSTs B and D, while the surface pressure dropsaccordingly within these vortices to a maximum pres-sure deficit of approximately 7 mb (with respect to thepressure field just outside the circulation proper). Thevertical velocity patterns associated with the majorNSTs at 250 m have contracted in size and nearly dou-bled in intensity, while the axial downdrafts havestrengthened slightly while narrowing significantly. Incontrast, the updraft region for NST A has nearly dis-appeared, signaling the end of its intensification. Peak250-m updraft and axial downdraft at this time are as-sociated with NST B and are 12.5 and 26.5 m s21,respectively. As seen in Fig. 6, the surface vortex ringpattern displayed by NSTs B and C at 1860 s also existsat 2200 s and is the result of the axial downdrafts pen-etrating to near the surface. Note the presence of wrap-
ping, precipitation-driven downdrafts both west and eastof the major NSTs that are driving the new cold poolsat the surface.
The X–Z vertical plane through NST B shown in Fig.11 at 2200 s reveals a 5000-m-deep axial downdraftwith a surrounding updraft annulus reaching the stormmidlevels. The vortex column is of similar depth, asrevealed by the shaded region in Fig. 11. The verticalvelocity structure at low levels resembles the high swirlratio two-cell vortex model schematic of Davies-Jones(1986) with a penetrating downdraft to the surface. Toexamine the forcing mechanisms driving the low-levelportion of this axial downdraft, the inviscid Boussinesqapproximation of the vertical momentum equation [Eq.(2)] is examined for a section of the NST B axial down-draft,
]w 1 ]p9 u95 2V ·=w 2 1 g 1 0.61q9 2 q 2 q (2)y c r1 2]t r ]z u
between 500 and 1000 m at 2200 s. The first two right-hand side terms of Eq. (2) represent the change in ver-tical velocity at a given point due to advection and theperturbation pressure gradient force. The third term rep-
1 OCTOBER 1997 2399L E E A N D W I L H E L M S O N
FIG. 11. Vertical X–Z slice of vertical velocity (W), perturbation pressure (P9) and verticalvorticity (z) through the center of NST B at 2200 s. The gray background profiles representareas where the vertical vorticity is greater than 0.04 s21. Contour intervals are 4 m s21 and 1mb for the vertical velocity and pressure fields, respectively.
resents the virtual buoyancy and water loading. For thisanalysis, the first term can be further simplified by con-sidering only the vertical advection of w since the vor-tex-relative radial flow vanishes near the vortex axis.The third term can also be simplified given that no cloudwater exists in this layer and negligible rainwater hadyet been entrained into the low-level vortex. The resultsof this analysis revealed that the layer average pertur-bation pressure gradient term (20.150 m s22) was anorder of magnitude larger than the layer average buoy-ancy term (20.015 m s22) and two orders of magnitudelarger than the layer average advection term (2 0.003m s22). Thus, the downward-directed perturbation pres-sure gradient force induced by strong low-level rotation[Eq. (1)] is primarily responsible for the low-level axialdowndraft. A comparison of the vertical accelerationforcing term magnitudes higher in the vortex columnsimilarly reveals that the perturbation pressure gradientterm remains dominant. The plot of perturbation pres-sure (referenced from the base state) in Fig. 11 dem-onstrates that a local reversal in the vertical perturbationpressure gradient along the axis of the NST extends fromthe surface to above the 4000-m level. Axial downdraftsin tornadoes have been observationally documented us-ing Doppler radar (Wakimoto and Martner 1992; Wur-man et al. 1996) and have been indicated in two- andthree-dimensional numerical models of tornado-likevortices such as in Walko (1988) and Lewellen et al.(1997), respectively.
The minimum contracted vortex diameters at the sur-face for the major NSTs after 2200 s are constrained bythe balance between surface inflow convergence and
core divergence provided by the penetrating axial down-drafts that reach nearly to the surface. Additionally, thediameter and character of the NSTs as the vortices ap-proach and, in some cases, fall below 360 m in diameter(NSTs A and D) are highly limited by the model hor-izontal resolution with the 60-m grid. At these narrowdiameters, the tight model field gradients induce highvalues of model mixing that acts to relax the gradientsand consequently constrain the real minimum diameterand model field variable maxima and minima of theseNSTs. Additionally, to approach a low-level vortex so-lution with fidelity, much finer grid spacing (;10 m)may be required, as suggested by Lewellen (1993).
Despite the resolution limitations noted above, thedissipation of the NST family can still be qualitativelyrepresented. The decay of the simulated NSTs, well un-der way for all member vortices by 2460 s, occurs asthe low-level flow field becomes increasingly dominatedby outflow from the storm complex. The surface vortex-relative wind field at this time, shown in Fig. 12, ischaracterized by numerous divergence regions associ-ated with the descending storm outflow. Regions ofstrong outflow have moved the low-level NST circu-lations well off the family’s north–south axis seen inFig. 10, resulting in highly tilted vortex tubes similarto that photogrammetrically documented for a ColoradoNST by Wakimoto and Martner (1992). Concurrently,substantial reductions since 2200 s in average surfacepeak vertical vorticity (36%) and average peak pressuredeficit (47%) have occurred as the rotation weakens inthe dying family of NSTs. In stark contrast to the well-organized vertical velocity structure seen at 2200 s, the
2400 VOLUME 54J O U R N A L O F T H E A T M O S P H E R I C S C I E N C E S
FIG. 12. As in Fig. 10 except at 2460 s.
pattern of vertical velocity at 2460 s is complex, withdowndrafts predominating. Cold and negatively buoyantdowndraft air is quickly surrounding and becoming en-trained into the major low-level circulations, leaving agood portion of the vortex in descending and divergentmotion. This dissipation process, brought about by theintroduction of stable air, is much like that described inthe demise of waterspouts (Golden 1974a; Wakimotoand Lew 1993) and of observed low-level mesocyclonesin tornadic supercell thunderstorms by Brandes (1984).Further, this process appears qualitatively similar to thedissipation of the Dimmit, Texas, tornado of 2 June 1995reported by Rasmussen and Straka (1996).
4. Analysis of the life cycle of NST B
a. Time series analysis
To elucidate the developmental stages of a typicalNST as simulated here, various time-series analyseshave been completed using representative vortex B.Time–height cross sections for maximum vertical vor-ticity and vertical velocity shown in Fig. 13 have beencreated by extracting maximum values of these quan-tities throughout the model integration for each hori-zontal level in or very near the parent misocyclone cir-culation (or its predecessors) for NST B. A single-passfilter that averages each data point with its nearest neigh-bors (on all sides) has been applied to smooth out noise
from this data. The most prominent gross feature seenin Fig. 13a for the vertical vorticity time series is itsupward-sloping character out to approximately 1680 s,indicating the upward progression of vertical vorticityoriginating from the lower half of the boundary layer.This ascent of vertical vorticity is associated with astrong updraft pulse seen in Fig. 13b that is occurringnearly simultaneously within the juxtaposed developingdeep moist convection. This upward vertical vorticityprogression is consistent with the observations ofWW89 and BS89. The prominent low- and midlevelcloud rotation observed in this simulation is a conse-quence of this upward transport of vertical vorticityfrom the boundary layer. During this period of verticalvorticity column deepening, low-level vorticity mag-nitudes are increasing markedly in the misocyclones.The vorticity time-height series in Fig. 13a is very sim-ilar in character to vorticity time–height cross sectionscompiled by RW95 for three of the NSTs occurring on15 June 1988 near Denver, Colorado. In the case ana-lyzed here, NST B was a product of misocyclone merg-ers around 1620 s into the simulation. This event showsup as a temporary drop in subcloud layer vertical vor-ticity magnitude in Fig. 13a at 1620 s. At this time ofconsolidation, vertical vorticity from the former indi-vidual misocyclones is redistributed to a larger diametercirculation, resulting in a drop in area average vorticity.A decline in peak vertical vorticity accompanies this
1 OCTOBER 1997 2401L E E A N D W I L H E L M S O N
FIG. 13. Time–height cross sections of (a) maximum vertical vorticity and (b) maximum verticalvelocity for regions in or near NST B and its predecessor misocyclones. Contour intervals are0.05 s21 and 4 m s21 for the maximum vertical vorticity and maximum vertical velocity, respec-tively. The gray arrow marks the time of misocyclone coalescence.
drop in area-average vertical vorticity. An observationalcounterpart to the modeled NST B evolution is thatdocumented by RW95 for their NST-designated T2. Theparent misocyclone for T2 was the product of a miso-cyclone merger event not unlike that simulated here.During the merger process, Roberts and Wilson reportan initial increase in diameter of the resultant vortexand a drop in vertical vorticity. A dual-Doppler-derivedvertical vorticity time-height series reflects this tem-porary drop in vorticity during consolidation (seeRW95’s Fig. 13), much like the consolidation signalpresent in Fig. 13a at 1620 s, with both observationaland modeled combined vortices showing strong sub-sequent intensification. The phase of strongest intensityfor NST B spans the interval from 2000 to 2360 s, aperiod corresponding to the enhanced low-level vortic-ity seen in Fig. 13a. Not coincidentally, this period alsoincludes the emergence of new low-level cold poolsadjacent to the NST circulations that enhance the low-level convergence around the tornadic vortices. The sig-nal of this period of maximum NST intensity is distinctin Fig. 13b as the 12 m s21 updraft contour drops inaltitude to near 200 m. A maximum low-level updraftof nearly 20 m s21 is realized at the 500-m level at 2300
s. The period of marked NST dissipation is clearly de-lineated on both vertical vorticity and updraft series,beginning at approximately 2400 s. At this time, thedepth of the intense vertical vorticity column drops sub-stantially and the storm updraft decreases markedly. Thetime–height vorticity time series of RW95 also reflectsthis rapid decrease in depth and strength at NST dis-sipation. The demise of the modeled NSTs is due to theweakening storm in which updraft predominance hasbeen replaced by downdraft predominance, while at thesurface negatively buoyant and divergent outflow hasinundated the environment in and around the dying NSTcirculations. This dissipation stage scenario is likelycommon for NSTs.
The life cycle stages of the NSTs in this simulationare well represented in time-series data of maximumsurface vertical vorticity and circulation shown in Fig.14 and in time series of maximum surface wind speedand pressure deficit shown in Fig. 15. This time seriesanalysis focuses on the development of NST B. To con-struct Fig. 14, the maximum vertical vorticity wastracked initially for a section of the developing vortexsheet between y 5 6900 and 10 200 m starting at 600s, then subsequently for the misocyclones that devel-
2402 VOLUME 54J O U R N A L O F T H E A T M O S P H E R I C S C I E N C E S
FIG. 14. Time series of maximum surface vertical vorticity (solid) and circulation (dashed) forthe evolution of NST B. Life cycle stages overlaid on these time series are explained in the text.
FIG. 15. Time series of maximum surface pressure deficit (with respect to the local surroundingenvironment, solid) and maximum ground-relative surface wind speed (dashed) for the evolutionof NST B. Life cycle stages overlaid on these time series are explained in the text.
oped from this section, and finally for the consolidatedmisocyclone that would produce NST B (see Fig. 3).The circulation time series was constructed starting ata time (900 s) corresponding to the appearance of awave along the vortex sheet seen in Fig. 3 at y 5 7000m that would subsequently become one of the two pri-
mary misocyclones that later would merge to producethe parent misocyclone of NST B. The circulation wastracked through misocyclone merger and through thetornado life span. The circulation in the horizontal planemay be calculated using Eq. (3),
G 5 zA, (3)
1 OCTOBER 1997 2403L E E A N D W I L H E L M S O N
where z is the average vorticity within some stated re-gion A. For this calculation, the 0.01 s21 vorticity con-tour for the chosen misocyclone is approximately en-compassed by a box around which the circulation iscomputed. Based on the first part of this numerical studyreported in LW97 and the results presented in section3, six stages for the genesis, maturation, and dissipationof NSTs have been designated and are overlaid on thetime series in Fig. 14. During the vortex sheet devel-opment stage (I) the gradual increase in vertical vorticitybetween 600 and 900 s is a consequence of the devel-oping outflow boundary encountering the southerlywind regime. The vortex sheet roll-up stage (II) occursbetween 900 and 1200 s (see Fig. 3). During this period,the peak misocyclone vertical vorticity has increasedrapidly, while, correspondingly, the circulation has in-creased as vertical vorticity, originally nearly evenlydistributed along the sheet, is concentrated in misocy-clone centers. The misocyclone interaction and mergerstage (III) spans the period from 1200 to 1820 s withcirculation values that are nearly steady until approxi-mately 1620 s when the circulation increases nearlythreefold as the three vorticity concentrations seen at1620 s in Fig. 3 merge by 1800 s. During this stage,the misocyclone peak vorticity continues to grow, al-though less rapidly than seen for stage II, reaching amaximum between 1540 and 1620 s, after which a sharpbut short-term drop in vertical vorticity is observed,corresponding to the consolidation of the three vorticityconcentrations. Vorticity values increase once again andthen plateau out in the NST early mature stage (IV) thatsomewhat arbitrarily begins at 1820 s when NST B’smaximum wind speed exceeds 30 m s21 (see Fig. 15)and lasts until approximately 2000 s, at which time newoutflow pools have emerged at low levels, creating ad-ditional convergence near NST B. In the NST late ma-ture stage (V) beginning at 2000 s, NST B intensifiesmarkedly in response to this outflow interaction withvertical vorticity values peaking at 0.45 s21 at 2260 s.During both stages IV and V, the circulation for NSTB fluctuates only slightly; however, similar to that ob-served in Fig. 13, the demise of NST B arises abruptly,as seen in the steep decline in both the circulation andvorticity curves during the NST dissipation stage (VI),which begins at approximately 2360 s.
Time series of peak pressure deficit and maximumground-relative wind speed shown in Fig. 15 were cre-ated in a similar manner to the vertical vorticity timeseries of Fig. 14. Once again, the time series are overlaidwith designated life cycle stages that reflect the tendencyand magnitude of the time-series variables. The time-series plots for pressure and wind speed are near mirrorreflections of each other (even in some of the minordetails) and are clearly inversely correlated as antici-pated for vortical flows via Eq. (1). Maximum windsand pressure deficits rapidly increase in stage II as small-scale misocyclones emerge along the outflow leadingedge as the vortex sheet rolls up and closed circulations
develop. In stage III, wind speeds and pressure deficitscontinue gradually increasing until the local flow fieldsare temporarily disrupted by the misocyclone mergersbeginning at 1620 s. Once unification takes place, thepressure and wind fields quickly rebound with an im-mediate 2.5-mb drop in pressure and an increase in sur-face wind speed to 30 m s21. Stage IV is typified byslow intensification of NST B up to 2000 s, a time whenthe pressure deficit has reached 5.1 mb and the windspeed has reached 32 m s21. Consistent with the dra-matic intensification indicated for vertical vorticity inFig. 14 for stage V, the time series for wind speed andpressure deficit also reveal the major intensification ofNST B. After 2080 s, surface winds reach and maintainF1 intensity for a 6-min span with a maximum speedof 39 m s21 occurring at 2300 s. The peak pressuredeficit of 7.1 mb occurs just 20 s before the occurrenceof maximum wind speed. The signal of NST B’s demise(stage VI) emerges just as abruptly in the pressure andmaximum wind time series, as was indicated in thetime–height cross sections for vertical vorticity and ver-tical velocity seen in Fig. 13. There appears to be avertical continuity in the collapse of NST B, indicatinga strong connection between processes taking place bothin cloud and near the surface. This connection is thedowndraft prevalence aloft and related negatively buoy-ant outflow near the surface. Both pressure deficit andmaximum wind speed continue dropping rapidly untilthe simulation’s end. Through the period starting withthe beginning of stage IV and ending within stage VI,NST B maintained maximum surface winds of greaterthan 30 m s21 for an 11-min period. Along with theanalyzed evolution of the NST family presented in sec-tion 3, the time–height cross sections and time serieshave provided a means by which the developmentalstages of the NST family could be delineated using mea-sures of misocyclone, NST, and storm strength and byemploying intervariable comparison to infer changeswithin the NST storm system that drive these life cyclestages.
b. Vorticity redistribution, maintenance, andintensification
As noted in the previous sections, a key tenet of theobservational model of NSTG included a vorticity poolthat originated at low levels and built vertically in con-junction with developing deep convection overhead.This upward redistribution of vertical vorticity, apparentin radar observations of deep circulations associatedwith some NSTs (Wilson 1986; WW89; RW95), can beevaluated by assessing the vertical advection of verticalvorticity. The vertical vorticity tendency equation canbe written as
]z ]w5 2V ·=z 1 v ·=w 1 z , (4)h]t ]z
where the right-hand side terms represent the advection
2404 VOLUME 54J O U R N A L O F T H E A T M O S P H E R I C S C I E N C E S
FIG. 16. Vertical X–Z cross section at 1440 s of gray-shaded verticalvorticity and contoured vertical advection of vertical vorticity as-sociated with the second misocyclone from the north boundary seenin Fig. 4. The advection contour intervals displayed are 210, 5, 10,20, and 40 3 1024 s22. The gray-shaded regions correspond to verticalvorticity greater than 0.04 (light gray), 0.1 (medium gray), and 0.2s21 (dark gray).
of vertical vorticity (z), the tilting of horizontal vorticity(vh), and the stretching of vertical vorticity, respec-tively. The advection term may be further subdividedinto horizontal and vertical components, the latter ofwhich,
]z ]z5 2w , (5)1 2]t ]z
ADVz
was used to analyze the vertical development of themisocyclone circulations of this modeling study. Shownin Fig. 16 is an X–Z slice of vertical vorticity and verticaladvection of vertical vorticity for the second misocy-clone from the north boundary shown in Fig. 4 at 1440s. A clear pattern of vertical transport of z is present,with large advection values exceeding 10 3 1024 s22
through a deep column extending to the 3.5-km level.At these advection rates, only 100 s would be requiredfor a particular level within this column to realize a zincrease of 0.1 s21. The stretching and tilting terms inthis column above 1.5 km are generally less then 30%of the magnitude of the vertical advection term; thus,the deep vorticity distribution seen in the time–heightprofile of Fig. 13a is accounted for mainly through ver-tical transport. The combined misocyclone and moistconvective updraft acts as a vorticity pump to transportvertical vorticity from near the surface well into thestorm’s midlevels. This process explains the onset ofvisible rotation present in animations of the model cloudfield associated with the simulated misocyclones andmay explain similar observational phenomena.
Analysis of the vortex dynamics operative along out-flow boundaries possessing leading edge vertical vortexsheets as described in detail in LW97 and as summarizedin section 3a have established how large pools of vor-ticity on the misocyclone scale (1–2 km in diameter)can be established over relatively short timescales(;15–20 min). Short-lived tornado events of severalminutes’ duration could be explained through the con-traction (stretching) of these misocyclone-scale vorticitypools; however, many observed NST events as well asthe NST family simulated here have life spans exceeding10 min. Other mechanisms supplying vertical vorticityto the low-level tornadic region must be operative tomaintain these vortices. Two mechanisms have beenidentified in these NST simulations. The primary mech-anism involves the northward transport of vertical vor-ticity along the outflow boundary to NST B as shownin Fig. 17 for 2060 s. Vertical vorticity magnitudes ex-ceeding 0.04 s21 have become reestablished along a vor-tex sheet, which extends south along the occlusionboundary and the north–south branch of the outflowboundary. A slightly weaker vortex sheet has also de-veloped along the west–east branch of the outflow. Thevortex-relative flow regime along these sheets supportsthe net transport of vertical vorticity toward the south-eastern periphery of NST B. To examine the vorticityevolution for parcels entering the NST circulation fromthe vortex sheet, time-dependent trajectory analysis wasperformed. This analysis revealed that parcels enteringthe tornado periphery at z 5 20 m, with a vertical vor-ticity of 0.04 s21, experienced a dramatic increase invertical vorticity to 0.26 s21 in just one-half revolution(30 s), while ascending to 135 m. This increase in vor-ticity was nearly entirely due to stretching. When parcelsenter the vortex periphery, they encounter convergenceof 0.061 s21 averaged through a depth of 135 m. Thestretching spinup time may be found by considering justthe stretching portion of the vorticity tendency equation[Eq. (4)] and integrating with respect to t and z. Usingthe reported values of convergence and the initial ver-tical vorticity, only a 30-s spinup time is required forthese parcels to attain vertical vorticity of 0.25 s21.
A secondary mechanism supplying vertical vorticity
1 OCTOBER 1997 2405L E E A N D W I L H E L M S O N
FIG. 17. Horizontal cross section of contoured surface vertical vor-ticity, NST-relative surface wind, and 40-m positive vorticity ten-dency tilting term (shaded) in the region near NST B at 2060 s. Forreference, the surface outflow boundary position is delineated by thedark gray line. The vertical vorticity contours shown are 0.01, 0.04,0.10, and 0.3 s21. Maximum velocity vector (m s21) is shown in thelower right corner. The gray-shaded region designates the area wherethe tilting term is greater than 1.0 3 1024 s22.
to NST B involves the tilting of horizontal vorticity inthe low-level (z , 100 m) inflow region east and south-east of NST B, as shown in Fig. 17. Parcels enteringNST B from this region subsequently undergo stretchingas they experience convergence along the vortex pe-riphery. The horizontal vorticity present in this inflowregion results from vertical shear caused by surface fric-tion. An axis of maximum horizontal vorticity becomesestablished along the leading edge of the outflow bound-ary where ambient air is entrained under the frictioninduced outflow ‘‘nose.’’ Tilting of this horizontal vor-ticity occurs along the east–west updraft gradient seenin Figs. 6 and 10. Although positive tilting term valuesin this region are only in the range 1 3 1024 to 7 31024 s22, this mechanism provides a modest verticalvorticity contribution over short periods. Time-depen-dent trajectories and analysis of the tilting and stretchingmechanisms were used to evaluate the vorticity evolu-tion of parcels passing through this region of positivetilting and subsequently into NST B during the period2000–2110 s. Parcels entering this region of positivetilting from the southeast at the 25-m level have resi-dence times of about 50 s before encountering the NST’sring of strong peripheral convergence. During these 50
s, the parcels experience positive tilting of ;2 3 1024
s22, which would result in the generation of verticalvorticity of 0.01 s21. The parcels then enter the vortexperiphery, where, over the next 60 s, the parcels riserapidly within the NST’s updraft annulus to the z 5480-m level. During this ascent, the parcels experiencelayer average convergence of 0.038 s21, which, consid-ering only vortex stretching, would result in an increasein vertical vorticity to 0.1 s21.
To examine how the primary intensification mecha-nisms change from the NST early mature stage to theNST late mature stage with respect to ongoing stormprocesses, the stretching and tilting terms of the vorticitytendency equation [Eq. (4)] are utilized. Shown in Fig.18 for representative vortex NST B are contour plots ofthe stretching term at the 60-m level for times 1860 and2200 s. At 1860 s, positive vortex stretching at valuesgreater than 10 3 1024 s22 occurs over the majority ofthe vortex region with values greater than 100 3 1024
s22 realized in a small area in the northeast quadrant.The region of negative stretching is associated with theaxial downdraft seen in Fig. 6. Positive tilting at thislevel and time (not shown) is similar in configurationto the area of positive tilting shown in Fig. 17 (for 2060s) and is generally more than an order of magnitudeweaker than the stretching term. Examination of higherlevels in the boundary layer revealed no regions of sig-nificantly larger positive tilting near the NSTs.
With the advent of new cold pools emerging into thelow-level flow field at approximately 2000 s, the patternand magnitude of the stretching term by 2200 s changessubstantially along with the vortex diameter (Fig. 18).In response to the increasing convergence along the pe-riphery of the NST circulations from the expanding coldpools, a pattern of strong vortex stretching at 60 mcompletely encircles the low-level vortex, with a largeembedded area of stretching values greater than 100 31024 s22 covering most of the northeast half of the vor-tex. To put this value in perspective, only 40 s wouldbe required to realize tornadic level vorticity values(;0.4 s21). In fact, an area of very strong stretchingemerges along the north side of NST B, with a peakvalue well above 200 3 1024 s22. Stretching term valuesare 2–5 times larger than those observed at 1860 s overall but the very center of the tornadic circulation. Thissignal of increased low-level vorticity stretching is doc-umented in a time–height cross section of peak vortexstretching values compiled for the region associatedwith NST B’s circulation, as shown in Fig. 19. Not onlydo the stretching values increase markedly after 2000 sbut the depth of very strong stretching increases fromthe stage IV frictionally driven surface inflow layerdepth of approximately 100 m to a depth of 300–400m. Consistent with the time-series data presented in sec-tion 4a, a sharp drop in peak stretching magnitudes oc-cur after 2360 s, spelling the decline of NST B. Thecore minimum in stretching seen in Fig. 18 at 2200 sis tied to the presence of axial downdraft penetrating to
2406 VOLUME 54J O U R N A L O F T H E A T M O S P H E R I C S C I E N C E S
FIG. 18. Horizontal cross section of contoured vorticity tendencystretching term at 1860 and 2200 s at the 60-m level for the regionnear NST B. For reference, the background gray-shaded region des-ignates areas with vertical vorticity greater than 0.1 s21. The stretchingterm contours shown are 250, 10, 50, 100, and 200 3 1024 s22.
FIG. 19. Time–height cross section of peak vorticity tendencystretching term values associated with NST B. The stretching termcontours shown are 50, 100, 200, and 300 3 1024 s22.
FIG. 20. Horizontal vorticity (vh) vectors and shaded regions ofvorticity tendency tilting term at 2200 s for NST B at the 500-mlevel. The maximum horizontal vorticity vector magnitude (s21) isshown in the lower right corner. The light and dark gray shadingrepresents regions where tilting term magnitudes exceed 1 3 1024
and 10 3 1024 s22, respectively. The hatched area represents negativetilting of magnitudes less than 210 3 1024 s22. The black dot rep-resents the center of circulation.
near the surface (Fig. 11). Positive tilting at 60 m (notshown) takes on a ringlike configuration on the peripheryof NST B and remains generally more than an order ofmagnitude smaller than the stretching term at 2200 s.
The tilting term was examined at higher levels in theboundary layer at 2200 s to see if the introduction ofnew cold pools into the local NST environment wouldprompt much larger positive tilting term contributions.The notion here is that, with the emergence of a numberof strong thermal boundaries as shown in Fig. 9, large
values of baroclinically generated horizontal vorticityshould arise along the leading edges of these expandingpools. Note that by 2200 s some of the new cold poolshave surface maximum potential temperature deficits attheir center of 28 K. Featured in Fig. 20 is the horizontalvorticity vector field and tilting term for the region nearNST B at the 500-m level. As expected, the environmentsurrounding NST B has become rich in narrow bandsof horizontal vorticity aligned along the leading edgesof the cold pools. The large horizontal vorticity vectorsobserved within the tornadic circulation proper are at-
1 OCTOBER 1997 2407L E E A N D W I L H E L M S O N
FIG. 21. Time series of maximum surface pressure deficit (with respect to the local surroundingenvironment) and maximum surface across-vortex differential velocity for the evolution of NSTB in the BASE and No-Qr simulations. The BASE life cycle stages are overlaid on these timeseries.
tributed to the very large horizontal gradient in verticalvelocity associated with NST B’s updraft annulus. Thereare no organized regions of strong tilting that might beassociated with the ingestion of baroclinically generatedstreamwise vorticity into the NST B circulation. Theonly regions of modest tilting at 500 m are inside thetornadic circulation and are artifacts of the verticallytilted orientation of the vortex tube at this level. A sim-ilar tilting term analysis was undertaken at higher levelsin the boundary layer with comparable results.
This analysis has highlighted the primary role stretch-ing plays in low-level vortex intensification and furtheraccentuates the role played by the new outflows. In stageV, the combination of surface-friction-induced conver-gence into NST B and outflow-produced convergencearound NST B leads to very strong low-level vortexintensification through stretching. As discussed in sec-tion 3b, concurrently occurring moist convection abovethese circulations is providing a positive feedback byinducing local convergence in the subcloud layer, which,in concert with the low-level convergence mechanismsjust addressed, supports a strong and tall vortex alongwith a deep updraft annulus that couples the surfacewith the storm midlevels as shown in Fig. 11. The ma-ture vortices are primarily maintained by vertical vor-ticity transported into the tornado circulations from avortex sheet along the outflow boundary. A secondarymaintenance mechanism involved the inflow of verticalvorticity produced from the tilting of horizontal vorticity
southeast of the NSTs. No strong signal of vertical tiltingof baroclinically generated horizontal vorticity was in-dicated, even after convective downdraft associated newoutflow pools emerged in the environment surroundingthe misocyclones.
5. Assessing the impact of new outflow and deepmoist convection
a. Comparative No-Qr simulation
To examine the degree of influence that the emergenceof new outflow pools have on NST intensity and lon-gevity, the model was rerun with all parameters set asthey were for the BASE simulation with the exceptionthat the production of rainwater was turned off inMSTFLOW. The lack of rainwater precipitation in thissimulation eliminates the creation of subcloud layerstorm outflow from evaporation and water loading. Bycomparing some intensity measures for NST B betweenthis simulation designated No-Qr and BASE, a quan-titative assessment of the new outflow’s impact on NSTintensification may be made.
Time series of the maximum surface pressure deficitand the maximum surface across-vortex differential ve-locity shown in Fig. 21 were created in a similar mannerto that discussed in section 4a for the development andevolution of NST B in the No-Qr and BASE simulations.The pressure and wind traces lie nearly on top of each
2408 VOLUME 54J O U R N A L O F T H E A T M O S P H E R I C S C I E N C E S
FIG. 22. Outflow leading edge surface vertical vorticity configuration for BASE and No-Qc at times 1860 and 2160 s.Vertical vorticity contour intervals used are 0.025, 0.1, 0.2, 0.3, and 0.4 s21.
other through the first three stages as anticipated, giventhat the big difference between these runs lies with theoutflow–NST interaction. After a slight divergence inNST intensity by both indicators in stage IV, a pro-nounced signal of outflow induced intensification is ob-served in stage V for BASE. BASE simulation peakdifferential velocity is 25% higher than No-Qr and peakpressure deficit is 53% higher than No-Qr. A comparisonof peak vertical vorticity observed over the most intense2-min period in stage V (not shown) reveals a nearly25% increase in vertical vorticity for BASE versus theNo-Qr simulation. A similar pattern of outflow-inducedintensification is observed for the other two major vor-tices NST C and NST D. In essence, the No-Qr simu-lation does not have a stage V, rather an extended stageIV that lasts approximately 9 min before dissipationbegins. The No-Qr simulation may represent observedcases where storm outflow is very weak, allowing thetornado to persist for an extended period at quasi-steadyintensity. These cases may, in general, be inherentlyweaker due to the absence of outflow-induced low-levelvortex stretching. For instance, surface winds for NSTB in the No-Qr simulation only briefly reached low F1
intensity and mainly were in the high F0 range. Asshown in Fig. 21, the pressure deficit and differentialvelocity for NST B in the No-Qr case begins a muchmore moderate decline in intensity after 2300 s thanobserved for BASE, due to the absence of new strongoutflow into the subcloud layer. The demise of the NSTsin No-Qr occurs as the low-level circulations graduallybecome wrapped in stable air from within the originalweak outflow. Vortex intensification through stretchingis inhibited and the vortex maintenance mechanisms de-scribed in section 4b no longer support the NSTs.
b. Comparative No-Qc simulation
To assess the organizational impact and intensifica-tion properties of deep moist convection above theevolving outflow leading edge vortices, a simulationdesignated No-Qc was completed in which the cloudmicrophysics were turned off in MSTFLOW. With nodeep moist convection present over the evolving line ofvortices, a much different evolution of leading edgecirculations occurred. The vertical vorticity contourplots shown in Fig. 22 display a comparison of the
1 OCTOBER 1997 2409L E E A N D W I L H E L M S O N
FIG. 23. Time series of maximum surface pressure deficit (with respect to the local surroundingenvironment) and maximum surface across-vortex differential velocity for the evolution of NSTB in BASE and NST B’s counterpart circulation in No-Qc. The BASE life cycle stages are overlaidon these time series.
configuration of leading edge vortices for BASE andNo-Qc at two times, 1860 and 2160 s. In both runs thepools of vorticity by 1860 s are positioned at similarlocations along the outflow leading edge; however,structurally the No-Qc vortex pools are much larger inphysical dimension and lack a uniform quasi-circularshape as in BASE. In association with this larger phys-ical size, the vertical vorticity magnitudes are muchsmaller in No-Qc at 1860 s. At 2160 s, the BASE NSTshave narrowed further and intensified, while the No-Qccirculations have remained approximately steady instrength while maintaining a loose integrity. Compar-ative differences in characteristics such as larger size,elongated shape, and weak vorticity magnitudes are in-dicative that the boundary layer environment in No-Qclacked the convergence and resultant stretching suppliedby the deep moist convection present in BASE.
To obtain a more quantitative assessment of the in-tensity difference between the developing NST B cir-culation and its counterpart in No-Qc, time series ofpeak pressure deficit and maximum across-vortex dif-ferential velocity are presented in Fig. 23. Nearly iden-tical series for both indicators are seen up through thevortex sheet roll-up process of stage II. Coincident withthe strong updraft pulse of rapidly developing moistconvection indicated in Fig. 13b, the pressure deficitand differential velocity traces between BASE andNo-Qc begin a divergent trend at approximately 1200s that continues until late in stage V of BASE. The time
of maximum intensity (for the indicators used here) forNST B’s counterpart circulation in No-Qc occurs muchearlier than BASE at a time near 1800 s with a peakpressure deficit of 2.7 mb and differential velocity of32 m s21. For comparison, NST B in BASE reachesmaximum intensity near 2260 s with a peak pressuredeficit of 7.1 mb and maximum differential velocity of57 m s21. A trend toward general weakening of theseintensity indicators after 1800 s in No-Qc continues untilthe end of the simulation. No tornadic intensity vorticesever develop in No-Qc. It is readily apparent in thistime series that the moist convection aloft begins to havean impact on the misocyclones quite early in the NSTGprocess. This impact becomes increasingly magnifiedeven before ancillary storm processes produce new out-flow that sharply intensify the BASE NSTs after 2000s. These comparative time series provide further evi-dence of the important role that overhead rapidly de-veloping moist convection plays in providing the properconvergent subcloud environment for NSTG to com-mence.
6. Summary and discussion
In conjunction with Part I of this article series, whichexamined the development of pretornadic misocyclonesalong an outflow boundary, a comprehensive morphol-ogy of the development of simulated NSTs along con-vergence lines such as thunderstorm outflow boundaries
2410 VOLUME 54J O U R N A L O F T H E A T M O S P H E R I C S C I E N C E S
FIG. 24. Schematic presentation of the life cycle stages of NST evolution. The diagrams for stages V and VI focus in on just one memberof the NST family. The viewing perspective is from an elevated position looking northwest. See text for details.
has been documented. Through an identification of theongoing processes integral to each life cycle stage ofNST development and dissipation, a ‘‘refined’’ modelof NSTG and decay that builds on the current obser-vational model outlined in WW89 and BS89 (with addeddetail in RW95) has been created. To illustrate the re-fined model, a schematic presentation of the life cyclestages of NST evolution is provided in Fig. 24. Non-supercell tornadogenesis along outflow boundaries ap-pears highly dependent upon the vortex sheet dynamicsoperative along the outflow leading edge. The vortexsheet development stage (I) commences as an outflowboundary (or other convergence boundary) encountersan air mass with a low-level wind field possessing acomponent of motion directed parallel to the outflowleading edge. This interaction of air masses creates anarrow transition zone of marked horizontal shear (i.e.,a vertical vortex sheet) aligned along the leading edgeof the boundary. Horizontal shearing instability is trig-gered along this vortex sheet by perturbations presentat the outflow leading edge. Lobe and cleft instability
provides a source for these triggers, although other pos-sible triggers may include, but are not limited to, hor-izontal convective roll intersections with the outflowboundary, natural variations in the surface roughness,or naturally occurring variations in the outflow thermalfield. As the horizontal shearing instabilities develop,the vortex sheet rolls up along with the outflow leadingedge in the vortex sheet roll-up stage (II). Once the bulkof the vertical vorticity along the sheet has been effec-tively concentrated in the maturing horizontal shearinginstabilities (i.e., first generation misocyclones) by pref-erential vorticity advection induced by the instabilities,interaction between vortices soon follows in the miso-cyclone interaction and merger stage (III). The two com-mon interactions include vortex pairing events, wherevortices of similar strength pair off and ultimately co-alesce, and vorticity extrusion events, whereby a stron-ger vortex extrudes (or mines) the vorticity from itsweaker neighbor(s). These vortex interactions producea longer wavelength misocyclone pattern that containslarger circulations that may then be subject to strong
1 OCTOBER 1997 2411L E E A N D W I L H E L M S O N
vortex stretching. These larger misocyclones producean asymmetric pattern of moist convective forcing alongthe outflow leading edge. The deep convection thatforms above the misocyclones is supported by air par-cels originating near the surface that are carried aloftto their level of free convection by updrafts driven bothby the low-level misocyclone and by the subcloud layerconvergence induced by the moist convection. As theyoung storms rapidly develop, vertical vorticity is re-distributed from the boundary layer to the storm mid-levels through vertical advection by the coupled mis-ocyclone and storm updraft. The NST early mature stage(IV) occurs as low-level stretching, due primarily tosurface-friction-induced inflow, intensifies the misocy-clone circulations to tornadic intensity. Concurrently,moist convection occurring above these circulations fur-ther supports NST intensification by inducing subcloudconvergence and weak vortex stretching throughout thedepth of the boundary layer. The mature vortices areprimarily maintained by vertical vorticity transported atlevels near the surface into the tornado circulation froma vortex sheet along the outflow boundary. A secondarymaintenance mechanism involved the inflow of verticalvorticity produced from the tilting of low-level hori-zontal vorticity southeast of the NSTs. The most intensephase, the NST late mature stage (V), occurs concurrentwith the emergence of new precipitation-induced coldpools that bound the NST, increasing the low-level con-vergence and significantly increasing the associated vor-tex stretching on the periphery of the NSTs. In stage V,the diameter of the NSTs decrease substantially in re-sponse to outflow-induced peripheral convergence. Thetransition to a predominant downdraft character for thestorm complex and negatively buoyant subcloud airmass heralds the onset of the NST dissipation stage (VI).The NSTs tilt sharply when their lower portions areadvected along with the strongest nearby advancing coldpool, creating a roping out appearance. Cold negativelybuoyant downdraft air quickly surrounds and becomesentrained into the low-level circulations, leaving a goodportion of the vortex in descending and divergent mo-tion, ultimately dissipating the tornado. Although aweak outflow boundary was used here, this refined mod-el should be generally applicable to other boundariespossessing marked horizontal shear commonly associ-ated with NSTs. The scenarios for NSTG and decayalong differing boundaries may vary in the type andspacing of the initial perturbations that trigger horizontalshearing instability growth along the vortex sheet.
In general, the main points of the observational modelof WW89 and BS89 are largely confirmed by this nu-merical study, including 1) the presence of shearing in-stability, which created the misocyclones along a low-level convergence boundary; 2) the source of tornadicrotation originating near the surface; and 3) stretchingas the primary means of vortex intensification as themisocyclone circulation comes under the influence ofrapidly deepening overhead convection. Evidence of
significant vertical tilting of baroclinically generatedhorizontal vorticity was not observed in this simulationeven after the introduction of markedly baroclinic newcold pools. Results presented here and in LW97 suggestthat the locational relationship between the misocycloneand deep convection may not simply be a matter offortune, but rather that the misocyclones influence thepattern of convective forcing along the outflow bound-ary. An in-depth numerical study of the influence ofmisocyclone circulations on deep moist convection iscurrently under way by the authors. An alternative sug-gestion for the forcing that controls the pattern of deepconvection observed along convergence boundaries in-volves the positioning of boundary layer horizontal con-vective roll intersections with the primary convergenceline (Wilson et al. 1992; Wakimoto and Atkins 1994).The actual mechanism responsible for observed patternsof initial deep convection is likely highly situation de-pendent. Whatever the controlling factors are for moistconvective forcing, when no moist convection existedoverhead, the resultant misocyclones acutely lacked thecoherent organization and intensity of the misocyclonesand NSTs of BASE.
The concept of a family of tornadoes as simulatedmay initially appear to be a highly anomalous event.Observational evidence and modeling studies such asthis one would argue, given the paradigm of a vortexsheet breaking down into a number of candidate vor-tices, that under the proper vertical shear and deep con-vective thermodynamic environment, a number of si-multaneously occurring NSTs are possible. Viewed inthis context, it is not surprising that when one NST isobserved it is not unusual to see others occurring nearlysimultaneously along a developing line of storms as-sociated with a common boundary. This family aspectalso likely applies to generally weaker vortices such asgustnadoes (Doswell 1985) observed along the leadingedge of outflow boundaries that possess significantacross-front horizontal shear (such as the forward- andrear-flank boundaries of supercell thunderstorms).
This modeling study has identified a major role fornew storm outflow in NST intensification. Previousmodeling work (Lee 1994) had suggested that new out-flow played a role in NST intensification. The obser-vational NST study by RW95 showed that, while thepresence of new storm outflow was not a prerequisiteto tornadogenesis, consistent with the stage IV NSTssimulated here, new outflow may play a role in thetiming and intensity of NSTs. The vortex intensificationanalysis for this simulation and supporting observa-tional evidence of RW95 indicate that as new outflowinteracts with the low-level portions of the tornado itdramatically increases the local convergence and resul-tant vortex stretching. Comparative results using a sim-ulation without the rain production microphysics turnedon (eliminating the generation of new cold storm out-flow) indicated that the outflow interaction markedlyincreased the NST intensity as indicated by a 25% in-
2412 VOLUME 54J O U R N A L O F T H E A T M O S P H E R I C S C I E N C E S
crease in across-vortex differential velocity and vorticityand corresponding 53% larger pressure deficit.
The ‘‘refined’’ model of NST evolution presentedabove may be, in part, applicable to other tornadic vor-tex types as well. For instance, in some tornadoes thatchallenge current classification schemes such as thestrong (F3) Newcastle, Texas, tornado of 29 May 1994,documented in the radar analysis of Wakimoto and At-kins (1996), tornadogenesis occurred in conjunctionwith a low-level shear feature that deepened and inten-sified coincident with rapidly deepening convectionalong the flanking line of a supercell thunderstorm wellaway from the mesocyclone location. It appears that thevortex intensification stage is broadly similar to thatpresented here, although how the large pool of vorticityat low levels originated is uncertain. How similar aresome of the stages outlined in the ‘‘refined’’ model tothe morphology of developing incipient low-level ver-tical vorticity zones near the tornadic region of supercellthunderstorms? Brandes (1977, 1978) has suggested thepossibility that vertical vorticity may be concentratedin a manner whereby a vortex sheet residing in the vi-cinity of a supercell’s mesocyclone rolls up to formcirculations potentially important to tornadogenesis, aprocess not unlike stage II of the schematic model ofNSTG.
The tornadogenesis model also appears to share muchin common with waterspout formation. In Golden’s(1974a, b) observational studies of waterspouts in the1970s, a detailed morphology of waterspout develop-ment was compiled that shares several aspects of therefined model. Golden suggested that multiple darkspots observed on the sea surface represented water-spout embryo circulations that were created from shear-ing instabilities forming along a vertical vortex sheet.This may be analogous to the first evolution horizontalshearing instabilities simulated in this study. Dark spotsforming in close proximity were not observed to persistindividually, indicating that vortex mergers were alsooccurring in some cases, similar to stage (III). In wa-terspout cases, the intensification and decay of the vor-tices were associated with respective periods of updraftgrowth and decay in the convective cloud line, similarto the scenario for misocyclone–NST intensification anddissipation as presented here (stages III, IV, and VI).On a qualitative level, the three-dimensional images ofthe young NSTs shown in Fig. 4, positioned at the centerof the wave spirals seen in the surface thermal field,appear strikingly similar in orientation to aerial pho-tographs of waterspouts with respect to sea surface in-dications of similar shear–convergence boundaries(Golden 1974a). As close as the NSTG model may ap-pear to partially explaining waterspouts, there is dis-agreement on the vertical vorticity source region in somewaterspout events. Based on observational and mod-eling evidence, Simpson et al. (1991) argue for an in-cloud cumulus-scale source region of vertical vorticityfor certain waterspout events, in clear contrast to the
boundary layer vorticity source region of the NSTGmodel. Other significant contrasts exist between the en-vironments of NSTs and waterspouts, which may in-clude factors such as CAPE and surface roughness. Fur-ther high-resolution modeling studies are planned to in-vestigate waterspout genesis.
Trial experiments leading up to the successful BASEsimulation indicated a large sensitivity in the prereq-uisite conditions for producing a successful NST sim-ulation that may, in part, explain why NST occurrenceis not commonplace. This NSTG process appeared quitesensitive to the ambient vertical shear profile that wouldjust balance the cold pool circulation to yield uprightoutflow leading edge structure and deep convection di-rectly over the misocyclones. The NSTG process wasalso highly sensitive to the timing of rapid deep con-vective development. For instance, if the misocycloneinteraction and merger stage (III) was not complete be-fore storm maturity, the resulting NSTs were relativelyweak. To further understand the sensitivities of theNSTG process, a series of parameter tests to be pre-sented in Part III of this article series will explore thesensitivity of tornadogenesis to changes in initial vortexsheet strength, CAPE, and vertical shear. By understand-ing these sensitivities, the nowcasting community inNST-prone locations may greatly benefit.
Acknowledgments. The authors wish to thank BrianJewett and Louis Wicker for many beneficial discussionson this topic. We also wish to recognize the visualizationsoftware development of Crystal Shaw and David Wo-jtowicz, which facilitated the analysis of these simula-tions. Rita Roberts and Jim Wilson of the National Cen-ter for Atmospheric Research provided data and valu-able insight on the 15 June 1988 Denver tornado out-break. Peter Blottman graciously provided slides andvideo documentation of the 4 June 1995 Lazbuddie,Texas, NST family. This research was supported by theNational Science Foundation under NSF Grants ATM-92-14098 and ATM-96-33228 and by the National Cen-ter for Supercomputing Applications. These simulationswere performed on the Connection Machine (CM-5) atthe National Center for Supercomputing Applications.We gratefully acknowledge three anonymous reviewerswhose suggestions helped improve this manuscript.
APPENDIX
Numerical Model Description
The MSTFLOW numerical model was created to sim-ulate cloud and density current dynamics in a massivelyparallel computational environment. MSTFLOW is sim-ilar in design to the cloud model of Klemp and Wil-helmson (1978, hereafter KW78) and to the COMMAScloud model described in Wicker and Wilhelmson(1995); however, the model code is written in CM FOR-TRAN, which allows computations to be done in a data-
1 OCTOBER 1997 2413L E E A N D W I L H E L M S O N
parallel environment on the National Center for Super-computing Application’s Connection Machine. Themodel is a three-dimensional, nonhydrostatic, finite dif-ference, convective cloud model that utilizes a quasi-compressible version of the Navier–Stokes equations.The Coriolis acceleration is ignored due to the highRossby number of the flows being simulated. The mo-mentum, thermodynamic, and pressure equations beingsolved can be written in Cartesian coordinates in thefollowing form:
du ]pi 1 c up ydt ]xi
u5 d g 2 1 1 0.61(q 2 q ) 2 q 2 q 1 D , (A1)i3 y y c r ui[ ]u
df5 M 1 D , (A2)f fdt
2]p c ]s1 (ru u ) 5 f , (A3)y j p2]t c r u ]xp y j
where2]p R p ]u c dud j s yf 5 2u 1 1 1 D , (A4)p j p2]x c ]x c u dtj y j p y
and the substantial derivative is
d ] ]5 1 u .jdt ]t ]xj
The nondimensional pressure and virtual potential tem-perature are defined as
R /cd ppP 1 p 5 (A5)1 2p0
u 5 u(1 1 0.61q ). (A6)y y
In this equation set, ui (i 5 1, 2, 3) are the u, y, and wvelocity components and p is the perturbation nondi-mensional pressure from the base-state value P. In Eq.(A2), f represents the variables of potential temperature(u) and the mixing ratio values for water vapor, cloudwater, and rainwater (qy, qc, and qr). Other variables andconstants include the pressure (p), reference pressure(p0 5 1000 mb), density (r), speed of sound (cs), grav-itational acceleration (g), gas constant for dry air (Rd),and specific heats of dry air at constant pressure (cp)and constant volume (cy). The variables with overbarsare base-state values that are functions only of height.The M and D terms are contributions from cloud mi-crophysics and from subgrid-scale mixing. The termsthat make up fp have been shown to be inconsequentialto the physical processes of importance in the modeland are thus ignored (KW78).
The moist microphysics formulation is based on threecategories of water that include water vapor, cloud wa-ter, and rainwater. Rainwater quantities are assumed to
exist in Marshall–Palmer drop distributions (Marshalland Palmer 1948) and have terminal fall speeds basedon a mass-weighted formulation adjusted for atmo-spheric density variations. A cloud water threshold mustbe met before the autoconversion of cloud water to rain-water is allowed to take place. The threshold value se-lected (a 5 0.003 g g21) is consistent with the commentsof Soong (1974) for the continental nature of the cloudssimulated. See Durran and Klemp (1983) for specificdetails of this cloud microphysics parameterization.
A diagnostic turbulent mixing parameterization sim-ilar to that designed by Clark (1979) is employed. Thesubgrid-scale momentum mixing term in Eq. (A1)Dui
can be written as
]D 5 (t ), (A7)u iji ]xj
where the Reynolds stress tensor is specified in termsof the stratification and shear, according to the formu-lation of Smagorinsky (1963) and Lilly (1962),
tij 5 KmDij. (A8)
The deformation tensor is given by
]u ]u 2 ]ui j kD 5 1 2 d , (A9)ij ij]x ]x 3 ]xj i k
and the total deformation is represented as
12 2 2 2 2 2 2Def 5 (D 1 D 1 D ) 1 D 1 D 1 D .11 22 33 12 13 232
(A10)
The momentum eddy mixing coefficients employed inhorizontal mixing ( ) and in vertical mixing ( ) areK Km mxy z
given by
1/2B
2 2K 5 (c l Dz) max Def 2 , 0 , (A11)m m mxy 1 2[ ]Pr1/2
where lm 5 (DxDyDz)1/3 and cm 5 0.21 following Dear-dorff (1971). This split form of the momentum eddymixing coefficient compensates for the mixing lengthchanges associated with a stretched grid implementa-tion. The calculation of the buoyancy term (B) is ac-complished using the formulation of KW78 as follows:
g ]u26; q # 10cu ]z
B 5]u ]q ]qe c r5 26gA 2 g 1 ; q . 10 ,c1 2]z ]z ]z
(A13)
where the equivalent potential temperature (ue) and Aare given as
2414 VOLUME 54J O U R N A L O F T H E A T M O S P H E R I C S C I E N C E S
Lu 5 u 1 q , (A14)e y
c Pp
1.61«Lqy1 11 R TdA 5 . (A15)
2u «L qy1 21 12c R Tp d
In the equations above, L is the latent heat of vapor-ization and « has a value of 0.622. The subgrid-scalescalar mixing term Df in Eq. (A2) may be written as
] ]fD ; K , (A16)f h1 2]x ]xj j
where Kh is the scalar eddy mixing coefficient that isrelated to Km by the relation
KmK 5 (A17)h Pr
and the eddy Prantl number (Pr) is set to ⅓ (Deardorff1972).
MSTFLOW employs centered, second-order ‘‘boxmethod’’ spatial differencing (Kurihara and Holloway1967) for advection and second-order ‘‘leapfrog’’ timedifferencing to integrate the equation set forward. AnArakawa ‘‘C-grid’’ is utilized in the placement of themodel-dependent variables. The model is time split forefficiency in a similar fashion to KW78 so that termsresponsible for the soundwave part of the solution aresolved at a smaller time step than the terms responsiblefor the advection, buoyancy, and subgrid-scale mixing.A Robert (1966) time smoother is applied to all modelvariables, except p, at the large time steps to preventsolution separation associated with leapfrog time inte-gration schemes. A fourth-order filter is applied in thehorizontal to the momentum and scalar variables to in-hibit the growth of nonlinear instabilities and other spu-rious short wavelength modes. Small, second-order ver-tical background damping is also applied to these vari-ables for the same reasons. The coefficient (alowk) forthis background vertical diffusion is given as a functionof the stretched vertical grid by
alowk 5 0.125Dz. (A18)
Boundary conditions for this model are discussed insection 2.
REFERENCES
Batchelor, G. K., 1967: An Introduction to Fluid Dynamics. Cam-bridge University Press, 516 pp.
Bluestein, H. B., 1985: The formation of a ‘‘landspout’’ in a ‘‘broken-line’’ squall line in Oklahoma. Preprints, 14th Conf. on SevereLocal Storms, Indianapolis, IN, Amer. Meteor. Soc., 267–270.
Brady, R. H., and E. J. Szoke, 1989: A case study of non-mesocyclonetornado development in northeast Colorado: Similarities to wa-terspout formation. Mon. Wea. Rev., 117, 843–856.
Brandes, E. A., 1977: Gust front evolution and tornado genesis asviewed by Doppler radar. J. Appl. Meteor., 16, 333–338., 1978: Mesocyclone evolution and tornadogenesis: Some ob-servations. Mon. Wea. Rev., 106, 995–1011., 1984: Vertical vorticity generation and mesocyclone sustenancein tornadic thunderstorms: The observational evidence. Mon.Wea. Rev., 112, 2253–2269.
Carbone, R. E., 1983: A severe frontal rainband. Part II: Tornadoparent vortex circulation. J. Atmos. Sci., 40, 2639–2654.
Chen, C., 1995: Numerical simulations of gravity currents in uniformshear flows. Mon. Wea. Rev., 123, 3240–3253.
Clark, T. L., 1979: Numerical simulations with a three-dimensionalcloud model: Lateral boundary condition experiments and mul-ticellular severe storm simulations. J. Atmos. Sci., 36, 2191–2215.
Corcos, G. M., and F. S. Sherman, 1984: The mixing layer: Deter-ministic models of a turbulent flow. Part 1. Introduction and thetwo-dimensional flow. J. Fluid Mech., 139, 29–65.
Davies-Jones, R. P., 1986: Tornado dynamics. Thunderstorm Mor-phology and Dynamics, E. Kessler, Ed., 2d ed., University ofOklahoma Press, 197–236.
Deardorff, J. W., 1971: On the magnitude of the subgrid-scale eddycoefficient. J. Comput. Phys., 7, 120–133., 1972: Numerical investigation of neutral and unstable planetaryboundary layers. J. Atmos. Sci., 29, 91–115.
Doswell, C. A., III, 1985: The operational meteorology of convectiveweather. Vol. II: Storm scale analysis. NOAA Tech. Memo. ERLESG-15, 240 pp. [NTIS PB 85 226959/XAB.]
Durran, D. R., and J. B. Klemp, 1983: A compressible model for thesimulation of moist mountain waves. Mon. Wea. Rev., 111,2341–2361.
Fujita, T. T., 1981: Tornadoes and downbursts in the context of gen-eralized planetary scales. J. Atmos. Sci., 38, 1511–1534.
Golden, J. H., 1971: Waterspouts and tornadoes over south Florida.Mon. Wea. Rev., 99, 146–154., 1974a: The life cycle of Florida Keys’ waterspouts. J. Appl.Meteor., 13, 676–692., 1974b: Scale-interaction implications for the waterspout lifecycle. J. Appl. Meteor., 13, 693–709., and M. E. Sabones, 1991: Tornadic waterspout formation nearintersecting boundaries. Preprints, 25th Int. Conf. on Radar Me-teorology, Paris, France, Amer. Meteor. Soc., 420–423.
Kingsmill, D. E., 1995: Convection initiation associated with a sea-breeze front, a gust front, and their collision. Mon. Wea. Rev.,123, 2913–2933.
Klemp, J. B., and R. B. Wilhelmson, 1978: The simulation of three-dimensional convective storm dynamics. J. Atmos. Sci., 35,1070–1096.
Kurihara, Y., and J. Holloway, 1967: Numerical integration of a nine-level global primitive equation model formulated by the boxmethod. Mon. Wea. Rev., 95, 509–530.
Lee, B. D., 1994: The numerical simulation of non-supercell torna-dogenesis. Ph.D. dissertation, University of Illinois, 215 pp.[Available from Dept. of Atmospheric Sciences, University ofIllinois at Urbana–Champaign, Urbana, IL 61801.], and R. B. Wilhelmson, 1997: The numerical simulation of non-supercell tornadogenesis. Part I: Initiation and evolution of pre-tornadic misocyclone circulations along a dry outflow boundary.J. Atmos. Sci., 54, 32–60.
Lemon, L. R., and C. A. Doswell III, 1979: Severe thunderstormevolution and mesocyclone structure as related to tornadoge-nesis. Mon. Wea. Rev., 107, 1184–1197.
Lewellen, W. S., 1993: Tornado vortex theory. The Tornado: Its Struc-ture, Dynamics, Prediction, and Hazards, Geophys. Monogr.,No. 79, Amer. Geophys. Union, 19–39., D. C. Lewellen, and R. I. Sykes, 1997: Large eddy simulationof a tornado’s interaction with the surface. J. Atmos. Sci., 54,581–605.
Lilly, D. K., 1962: On the numerical simulation of buoyant convec-tion. Tellus, 14, 168–172.
1 OCTOBER 1997 2415L E E A N D W I L H E L M S O N
Mahoney, W. P., 1988: Gustfront characteristics and the kinematicsassociated with interacting thunderstorm outflows. Mon. Wea.Rev., 116, 1474–1491.
Marshall, J. S., and W. M. Palmer, 1948: The distribution of raindropswith size. J. Meteor., 5, 165–166.
McWilliams, J. C., 1984: The emergence of isolated coherent vorticesin turbulent flow. J. Fluid Mech., 146, 21–43.
Mueller, C. K., and R. E. Carbone, 1987: Dynamics of a thunderstormoutflow. J. Atmos. Sci., 44, 1879–1898.
Rasmussen, E. N., and J. M. Straka, 1996: Mobile mesonet obser-vations of tornadoes during VORTEX-95. Preprints, 18th Conf.on Severe Local Storms, San Francisco, CA, Amer. Meteor. Soc.,1–5.
Riley, J. J., and R. W. Metcalfe, 1980: Direct numerical simulationof a perturbed turbulent mixing layer. AIAA 18th AerospaceMeeting, Pasadena, CA, American Institute of Aeronautics andAstronautics, 1–7.
Robert, A. J., 1966: The integration of a low order spectral form ofthe primitive meteorological equations. J. Meteor. Soc. Japan,44, 237–245.
Roberts, R. D., and J. W. Wilson, 1995: The genesis of three non-supercell tornadoes observed with dual-Doppler radar. Mon.Wea. Rev., 123, 3408–3436.
Rotunno, R., J. B. Klemp, and M. L. Weisman, 1988: A theory forstrong, long-lived squall lines. J. Atmos. Sci., 45, 463–485.
Simpson, J., R. Roff, B. R. Morton, K. Labas, G. Dietachmayer, M.McCumber, and R. Penc, 1991: A Great Salt Lake waterspout.Mon. Wea. Rev., 119, 2241–2270.
Simpson, J. E., 1972: Effects of the lower boundary on the head ofa gravity current. J. Fluid Mech., 53, 759–768.
Smagorinsky, J., 1963: General circulation experiments with theprimitive equations: 1. The basic experiment. Mon. Wea. Rev.,91, 99–164.
Soong, S.-T., 1974: Numerical simulation of warm rain developmentin an axisymmetric cloud model. J. Atmos. Sci., 31, 1262–1285.
Wakimoto, R. M., and J. W. Wilson, 1989: Non-supercell tornadoes.Mon. Wea. Rev., 117, 1113–1140., and B. E. Martner, 1992: Observations of a Colorado tornado.Part II: Combined photogrammetric and Doppler radar analysis.Mon. Wea. Rev., 120, 552–543., and J. K. Lew, 1993: Observations of a Florida waterspoutduring CaPE. Wea. Forecasting, 8, 412–423., and N. T. Atkins, 1994: Observations of the sea-breeze frontduring CaPE. Part I: Single-Doppler, satellite, and cloud pho-togrammetry analysis. Mon. Wea. Rev., 122, 1092–1114., and , 1996: Observations on the origins of rotation: TheNewcastle tornado during VORTEX 94. Mon. Wea. Rev., 124,384–407.
Walko, R. L., 1988: Plausibility of substantial dry adiabatic subsi-dence in a tornado core. J. Atmos. Sci., 45, 2251–2267.
Wicker, L. J., and R. B. Wilhelmson, 1995: Simulation and analysisof tornado development and decay within a three-dimensionalsupercell thunderstorm. J. Atmos. Sci., 52, 2675–2703.
Wilczak, J. M., T. W. Christian, D. E. Wolfe, R. J. Zamora, and B.B. Stankov, 1992: Observations of a Colorado tornado. Part I:Mesoscale environment and tornadogenesis. Mon. Wea. Rev.,120, 497–520.
Wilhelmson, R. B., and C. S. Chen, 1982: A simulation of the de-velopment of successive cells along a cold outflow boundary. J.Atmos. Sci., 39, 1446–1483.
Wilson, J. W., 1986: Tornadogenesis by nonprecipitation inducedwind shear lines. Mon. Wea. Rev., 114, 270–284., G. B. Foote, N. A. Crook, J. C. Fankhauser, C. G. Wade, J. D.Tuttle, and D. K. Mueller, 1992: The role of boundary-layerconvergence zones and horizontal rolls in the initiation of thun-derstorms: A case study. Mon. Wea. Rev., 120, 1785–1815.
Wurman, J., J. M. Straka, and E. N. Rasmussen, 1996: Fine-scaleDoppler radar observations of tornadic storms. Science, 272,1774–1777.
Xu, Q., and M. W. Moncrieff, 1994: Density current circulations inshear flow. J. Atmos. Sci., 51, 434–446.