THE [O ii] k3727 LUMINOSITY FUNCTION AND STAR FORMATION RATE AT z 1.2 IN THE COSMOS 2 SQUARE DEGREE FIELD AND THE SUBARU DEEP FIELD 1 M. I. Takahashi, 2 Y. Shioya, 3 Y. Taniguchi, 3 T. Murayama, 2 M. Ajiki, 2 S. S. Sasaki, 3 O. Koizumi, 2 T. Nagao, 4,5 N. Z. Scoville, 6,7 B. Mobasher, 8 H. Aussel, 7,9 P. Capak, 6 C. Carilli, 10 R. S. Ellis, 6 B. Garilli, 11 M. Giavalisco, 8 L. Guzzo, 12 G. Hasinger, 13 C. Impey, 14 M. G. Kitzbichler, 15 A. Koekemoer, 8 O. Le Fe `vre, 16 S. J. Lilly, 17 D. Maccagni, 11 A. Renzini, 18 M. Rich, 19 D. B. Sanders, 7 E. Schinnerer, 20 M. Scodeggio, 11 P. Shopbell, 6 V. Smolc ˇic ´, 21,22 S. Tribiano, 23,24 Y. Ideue, 3 and S. Mihara 3 Received 2006 September 15; accepted 2007 March 3 ABSTRACT We have carried out a wide-field imaging survey for [O ii] k3727 emitting galaxies at z 1:2 in the HST COSMOS 2 square degree field using the Suprime-Cam on the Subaru Telescope. The survey covers a sky area of 6700 arcmin 2 in the COSMOS field, and a redshift range between 1.17 and 1.20 (z ¼ 0:03), corresponding to a survey volume of 5:56 ; 10 5 Mpc 3 . We obtain a sample of 3176 [O ii] emitting galaxies with observed emission-line equivalent widths greater than 26 8. Since our survey tends to sample brighter [O ii] emitting galaxies, we also analyze a sample of fainter [O ii] emitting galaxies found in the Subaru Deep Field (SDF). We find an extinction-corrected [O ii] luminosity density of 10 40:35 þ0:08 0:06 ergs s 1 Mpc 3 , corresponding to star formation rate density of 0:32 þ0:06 0:04 M yr 1 Mpc 3 in the COSMOS field at z 1:2. This is the largest survey for [O ii] emitters beyond z ¼ 1 currently available. Subject headingg s: galaxies: distances and redshifts — galaxies: evolution — galaxies: luminosity function, mass function Online material: machine-readable tables 1. INTRODUCTION Measurements of the galaxy star formation rate density (SFRD) are one of the most important issues concerning studies of forma- tion and evolution of galaxies. Since the pioneering study by Madau et al. (1996), a number of observational studies have been made to investigate both metal-enrichment history and star formation his- tory in galaxies as a function of age or redshift (e.g., Gallego et al. 1995; Ellis et al. 1996; Lilly et al. 1996; Hogg et al. 1998; Tresse & Maddox 1998; Madau et al. 1998; Pettini et al. 1998; Steidel et al. 1999; Barger et al. 2000; Fujita et al. 2003a; Giavalisco et al. 2004; Dickinson et al. 2004; Taniguchi et al. 2005; Bouwens & Illingworth 2006). A current picture is that the SFRD steeply increases for first 900 Myr (from z 30 to z 6), peaks at z 3, and then decreases strongly to the present day (e.g., Bouwens & Illingworth 2006). It is important to investigate what happened in first 900 Myr in the early universe (Taniguchi et al. 2005; Kashikawa et al. 2006; Bouwens & Illingworth 2006 and refer- ences therein). And it is also important to investigate what hap- pened from z 3 to 1, because galaxies as well as large-scale structures could have rapidly evolved in this era. Star formation activity in galaxies could be linked to galaxy en- vironments because interaction and merging events can trigger intense star formation. Therefore, it is necessary to investigate coevolution between galaxies and large-scale structures (e.g., Scoville et al. 2007). Recently, large-scale structures with a scale of several tens to 100 Mpc have been reported for samples of Lyemitters or Lyman break galaxies (LBG), i.e., star-forming galaxies, at 3 < z < 6 (e.g., Steidel et al. 1998; Shimasaku et al. 2003; Ouchi et al. 2005a; Kashikawa et al. 2006). At z 1, such large-scale structure of galaxies with a scale over 10 Mpc have also been reported (Tanaka et al. 2001; Nakata et al. 2005; Gal et al. 2005). These observational results appear to be consistent with N-body simulations, which suggest that clusters of galaxies at A 1 Based on data collected at Subaru Telescope, which is operated by the National Astronomical Observatory of Japan. 2 Astronomical Institute, Graduate School of Science, Tohoku University, Aramaki, Aoba, Sendai 980-8578, Japan. 3 Physics Department, Graduate School of Science and Engineering, Ehime University, Bunkyo-cho, Matsuyama 790-8577, Japan. 4 National Astronomical Observatory of Japan, Mitaka, Tokyo 181-8588, Japan. 5 INAF— Osservatorio Astrofisico di Arcetri, Largo Enrico Fermi 5, 50125 Firenze, Italy. 6 California Institute of Technology, MC 105-24, 1200 East California Boulevard, Pasadena, CA 91125. 7 Institute for Astronomy, University of Hawaii, 2680 Woodlawn Drive, Honolulu, HI 96822. 8 Space Telescope Science Institute, 3700 San Martin Drive, Baltimore, MD 21218. 9 Service d’Astrophysique, CEA/Saclay, 91191 Gif-sur-Yvette, France. 10 National Radio Astronomy Observatory, P.O. Box O, Socorro, NM 87801-0387. 11 CNR Instituto di Astrofisica Spaziale e Fisica Cosmica Milano, Milan, Italy. 12 Osservatorio Astronomico di Brera, via Brera, Milan, Italy. 13 Max Planck Institut fuer Extraterrestrische Physik, D-85478 Garching, Germany. 14 Steward Observatory, University of Arizona, 933 North Cherry Avenue, Tucson, AZ 85721. 15 Max-Planck-Institut f u ¨r Astrophysik, D-85748 Garching bei Mu ¨nchen, Germany. 16 Laboratoire d’Astrophysique de Marseille, BP 8, Traverse du Siphon, 13376 Marseille Cedex 12, France. 17 Department of Physics, Swiss Federal Institute of Technology (ETH- Zurich), CH-8093 Zurich, Switzerland. 18 European Southern Observatory, Karl-Schwarzschild-Strasse 2, D-85748 Garching, Germany. 19 Department of Physics and Astronomy, University of California, Los Angeles, CA 90095. 20 Max Planck Institut f u ¨r Astronomie, Ko ¨nigstuhl 17, Heidelberg, D-69117, Germany. 21 Princeton University Observatory, Princeton, NJ 08544. 22 University of Zagreb, Department of Physics, Bijenicka cesta 32, 10000 Zagreb, Croatia. 23 American Museum of Natural History, NewYork, NY. 24 CUNY Bronx Community College, New York, NY. 456 The Astrophysical Journal Supplement Series, 172:456 Y 467, 2007 September # 2007. The American Astronomical Society. All rights reserved. Printed in U.S.A.
Transcript
THE [O ii] k3727 LUMINOSITY FUNCTION AND STAR FORMATION RATE AT z � 1.2IN THE COSMOS 2 SQUARE DEGREE FIELD AND THE SUBARU DEEP FIELD1
M. I. Takahashi,2Y. Shioya,
3Y. Taniguchi,
3T. Murayama,
2M. Ajiki,
2S. S. Sasaki,
3O. Koizumi,
2T. Nagao,
4,5
N. Z. Scoville,6,7
B. Mobasher,8H. Aussel,
7,9P. Capak,
6C. Carilli,
10R. S. Ellis,
6B. Garilli,
11
M. Giavalisco,8L. Guzzo,
12G. Hasinger,
13C. Impey,
14M. G. Kitzbichler,
15A. Koekemoer,
8
O. Le Fevre,16
S. J. Lilly,17
D. Maccagni,11
A. Renzini,18
M. Rich,19
D. B. Sanders,7
E. Schinnerer,20
M. Scodeggio,11
P. Shopbell,6V. Smolcic,
21,22
S. Tribiano,23,24
Y. Ideue,3and S. Mihara
3
Received 2006 September 15; accepted 2007 March 3
ABSTRACT
We have carried out a wide-field imaging survey for [O ii] k3727 emitting galaxies at z � 1:2 in theHSTCOSMOS2 square degree field using the Suprime-Cam on the Subaru Telescope. The survey covers a sky area of 6700 arcmin2
in the COSMOS field, and a redshift range between 1.17 and 1.20 (�z ¼ 0:03), corresponding to a survey volume of5:56 ; 105 Mpc3. We obtain a sample of 3176 [O ii] emitting galaxies with observed emission-line equivalent widthsgreater than 268. Since our survey tends to sample brighter [O ii] emitting galaxies, we also analyze a sample of fainter[O ii] emitting galaxies found in the SubaruDeep Field (SDF).We find an extinction-corrected [O ii] luminosity densityof 1040:35
þ0:08�0:06 ergs s�1 Mpc�3, corresponding to star formation rate density of 0:32þ0:06
�0:04 M� yr�1 Mpc�3 in theCOSMOS field at z � 1:2. This is the largest survey for [O ii] emitters beyond z ¼ 1 currently available.
Subject headinggs: galaxies: distances and redshifts — galaxies: evolution —galaxies: luminosity function, mass function
Online material: machine-readable tables
1. INTRODUCTION
Measurements of the galaxy star formation rate density (SFRD)are one of the most important issues concerning studies of forma-tion and evolution of galaxies. Since the pioneering study byMadauet al. (1996), a number of observational studies have beenmade toinvestigate bothmetal-enrichment history and star formation his-tory in galaxies as a function of age or redshift (e.g., Gallego et al.1995; Ellis et al. 1996; Lilly et al. 1996; Hogg et al. 1998; Tresse&Maddox 1998; Madau et al. 1998; Pettini et al. 1998; Steidel et al.1999; Barger et al. 2000; Fujita et al. 2003a; Giavalisco et al.2004; Dickinson et al. 2004; Taniguchi et al. 2005; Bouwens &Illingworth 2006). A current picture is that the SFRD steeplyincreases for first 900Myr (from z � 30 to z � 6), peaks at z �3,and then decreases strongly to the present day (e.g., Bouwens &Illingworth 2006). It is important to investigate what happened
in first 900 Myr in the early universe (Taniguchi et al. 2005;Kashikawa et al. 2006; Bouwens & Illingworth 2006 and refer-ences therein). And it is also important to investigate what hap-pened from z � 3 to �1, because galaxies as well as large-scalestructures could have rapidly evolved in this era.Star formation activity in galaxies could be linked to galaxy en-
vironments because interaction and merging events can triggerintense star formation. Therefore, it is necessary to investigatecoevolution between galaxies and large-scale structures (e.g.,Scoville et al. 2007). Recently, large-scale structures with a scaleof several tens to 100 Mpc have been reported for samples ofLy� emitters or Lyman break galaxies (LBG), i.e., star-forminggalaxies, at 3 < z < 6 (e.g., Steidel et al. 1998; Shimasaku et al.2003; Ouchi et al. 2005a; Kashikawa et al. 2006). At z � 1, suchlarge-scale structure of galaxies with a scale over 10 Mpc havealso been reported (Tanaka et al. 2001; Nakata et al. 2005; Gal et al.2005). These observational results appear to be consistent withN-body simulations, which suggest that clusters of galaxies at
A
1 Based on data collected at Subaru Telescope, which is operated by theNational Astronomical Observatory of Japan.
2 Astronomical Institute, Graduate School of Science, Tohoku University,Aramaki, Aoba, Sendai 980-8578, Japan.
3 Physics Department, Graduate School of Science and Engineering, EhimeUniversity, Bunkyo-cho, Matsuyama 790-8577, Japan.
4 National Astronomical Observatory of Japan, Mitaka, Tokyo 181-8588, Japan.5 INAF—Osservatorio Astrofisico di Arcetri, Largo Enrico Fermi 5, 50125
Firenze, Italy.6 California Institute of Technology, MC 105-24, 1200 East California
Boulevard, Pasadena, CA 91125.7 Institute for Astronomy, University of Hawaii, 2680 Woodlawn Drive,
Honolulu, HI 96822.8 Space Telescope Science Institute, 3700 San Martin Drive, Baltimore, MD
21218.9 Service d’Astrophysique, CEA/Saclay, 91191 Gif-sur-Yvette, France.10 National Radio Astronomy Observatory, P.O. Box O, Socorro, NM
87801-0387.11 CNR Instituto di Astrofisica Spaziale e Fisica Cosmica Milano, Milan, Italy.12 Osservatorio Astronomico di Brera, via Brera, Milan, Italy.13 Max Planck Institut fuer Extraterrestrische Physik, D-85478 Garching,
Germany.
14 Steward Observatory, University of Arizona, 933 North Cherry Avenue,Tucson, AZ 85721.
15 Max-Planck-Institut f ur Astrophysik, D-85748 Garching bei Munchen,Germany.
16 Laboratoire d’Astrophysique de Marseille, BP 8, Traverse du Siphon,13376 Marseille Cedex 12, France.
17 Department of Physics, Swiss Federal Institute of Technology (ETH-Zurich), CH-8093 Zurich, Switzerland.
18 European Southern Observatory, Karl-Schwarzschild-Strasse 2, D-85748Garching, Germany.
19 Department of Physics and Astronomy, University of California, LosAngeles, CA 90095.
20 Max Planck Institut f ur Astronomie, Konigstuhl 17, Heidelberg, D-69117,Germany.
21 Princeton University Observatory, Princeton, NJ 08544.22 University of Zagreb, Department of Physics, Bijenicka cesta 32, 10000
Zagreb, Croatia.23 American Museum of Natural History, New York, NY.24 CUNY Bronx Community College, New York, NY.
456
The Astrophysical Journal Supplement Series, 172:456 Y467, 2007 September
# 2007. The American Astronomical Society. All rights reserved. Printed in U.S.A.
z � 1 are still in the formation process (e.g., Moore et al. 1998).Therefore, more detailed studies on clustering of galaxies at z > 1are crucially important to understand the evolution of large-scalestructures as well as that of galaxies themselves.
It is, however, difficult to obtain a large sample of galaxiesbeyond z ¼ 1. Although optical broadband imaging could detecta large number of LBGs, the accuracy of photometric redshifts isnot high enough to obtain a sample of galaxies at a concerned red-shift interval. Spectroscopic surveys are useful to obtain such asample. However, since most galaxies beyond z ¼ 1 are faint, weneed a lot of observing time to carry out such a program. Anothermethod is to carry out an optical surveywith a narrowband filter toisolate strong emission-line galaxies beyond z ¼ 1. However,beyond z � 0:5, the H� emission line, which is a good tracer ofstar formation rate (e.g., Gallego et al. 1996; Hammer et al. 1997;Jansen et al. 2001; Teplitz et al. 2003; Hopkins 2004 and refer-ences therein), is no longer detectable in the visible window.Therefore, the [O ii] k3727 emission line provides an estimatorof the star-formation activity in galaxies. Although this line isconsidered to be a less reliable tracer of star formation rate becauseits line intensity is more affected by dust obscuration (Kennicutt1998), careful comparisons among SFRs derived with variousobservables (e.g., H� , [O ii], UV, and so on) are consistentwithin a factor of 3 (Cram et al. 1998; Hopkins 2004). Therefore,this line has the clear advantage of being observable in the vis-ible bands over the interesting redshift range of 0:5 < z < 1:6,where the SFRD is thought to be changing rapidly.
In this paper, we present results of our narrowband imagingsurvey for [O ii] emitters at z � 1:2 in the Cosmic Evolution Sur-vey (COSMOS; Scoville et al. 2007) 2 square degree field. Thissurvey was carried out during the course of Subaru imagingsurveys of the COSMOS field (Taniguchi et al. 2007; see alsoMurayama et al. 2007) by using the narrowband filter NB816[kc ¼ 81508 and�k(FWHM) ¼ 1208] available for the prime-focus, wide-field camera, Suprime-Cam, on the 8.2 m SubaruTelescope (see x 2.1). Since the Suprime-Cam provides a verywide field of view; 34 0 ; 27 0, this is suitable for wide-field opticalimaging surveys. Through the large area covered by the COSMOS,we can obtain the largest sample of [O ii] emitting galaxies beyondz ¼ 1 by performing narrowband imaging of this field, targetinggalaxies at z � 1:2. Such a large sample can improve the precisionof our estimates of the SFRD at z > 1.
However, the COSMOS can sample only brighter [O ii] emit-ting galaxies because of relatively shallower survey depths. Inorder to obtain an accurate luminosity function of [O ii] emitters,it is also necessary to probe faint [O ii] emitters. For this purpose,we analyze a sample of fainter [O ii] emitters taken from theSubaru Deep Field (SDF; Kashikawa et al. 2004), where the samenarrowband filter (NB816) was used (see x 2.2). Although theSDF covered sky area is �1/8 of the COSMOS field, the muchdeeper survey depth of the SDF makes it possible to explore faintobjects and determine the faint end slope of the luminosity func-tion of [O ii] emitting galaxies.
Throughout this paper, magnitudes are given in the AB system.We adopt a flat universe with the following cosmological pa-rameters:�matter ¼ 0:3,�� ¼ 0:7, andH0 ¼ 70 km s�1 Mpc�1.
2. PHOTOMETRIC CATALOG
2.1. The HST COSMOS Field
The Cosmic Evolution Survey (COSMOS) is a 2 square de-gree imaging survey centered at � (J2000:0) ¼ 10h00m28:6s and�(J2000:0) ¼ þ02�12 021:0 00 (Scoville et al. 2007). Our opticalnarrowband imaging observations of the HST COSMOS field
have been made with the Suprime-Cam (Miyazaki et al. 2002)on the 8.2m Subaru Telescope (Kaifu et al. 2000; Iye et al. 2004)at Mauna Kea Observatories.
In this analysis, we use the COSMOS official photometric red-shift catalog, which includes objects whose total imagnitudes (i 0
or i�) are brighter than 25 mag. The catalog presents 300 diameteraperture magnitude of Subaru /Suprime-Cam B, V, r 0, i 0, z 0, andNB816.25 Our NB816 imaging data of the COSMOS field arealso used to search both for Ly� emitters at z � 5:7 (Murayamaet al. 2007) and for H� emitters at z � 0:24 (Shioya et al. 2007).Details of the Suprime-Cam observations are given in Taniguchiet al. (2007).
Because the accuracy of standard star calibration (�0.05mag) istoo large for obtaining accurate photometric redshifts, Capak et al.(2007) recalibrated the photometric zero points for photometricredshifts using the SEDs of galaxies with spectroscopic redshifts.Following the recommendation of Capak et al. (2007), we apply thezero-point correction to the photometric data in the official catalog.The offset values are 0.189, 0.04, �0.040, �0.020,�0.005, 0.054,and �0.072 for B, V, r 0, i 0, i�, z 0, and NB816, respectively. Thezero-point corrected limiting magnitudes are B ¼ 27:4, V ¼ 26:5,r 0 ¼ 26:6, i 0 ¼ 26:1, z 0 ¼ 25:4, and NB816 ¼ 25:6 for a 3 �detection on a 300 diameter aperture. The catalog also includes 300 di-ameter i�-band aperture magnitude from CFHT. We use the CFHTi� magnitude for bright galaxies with i 0 < 21 mag because they ap-pear to be less affected by the saturation effects. All magnitudesare corrected for the Galactic extinction: E(B� V ) ¼ 0:0195 �0:006 (Capak et al. 2007). Details of the COSMOS official pho-tometric redshift catalog are presented in Mobasher et al. (2006).
2.2. The Subaru Deep Field
We used a catalog obtained by the Subaru Deep Field (SDF)project (Kashikawa et al. 2004). The SDF project is the deepestoptical imaging survey using the Suprime-Cam on the SubaruTelescope. The SDF is located near the North Galactic Pole,being centered at � (J2000:0) ¼ 13h24m38:9s and �(J2000:0) ¼þ27�29 025:9 00. The SDF project official photometric catalog isobtained from the SDF site.26 In this work, we used B, V, RC, i
0,z 0, and NB816 data given in the i 0 selected catalog with 300 di-ameter aperture photometry. Note that we correct NB816 mag inthe SDF photometric catalog because there is a small photomet-ric offset (�0.08 mag). The limiting magnitudes for a 3 � detec-tion on a 300 diameter aperture are as follows:B ¼ 27:6,V ¼ 27:0,RC ¼ 27:2, i 0 ¼ 27:0, z 0 ¼ 26:2, and NB816 ¼ 26:1 mag. ThePSF size in this catalog is 0.9800. All magnitudes are corrected forthe Galactic extinction: E(B� V ) ¼ 0:01678 � 0:003 (Schlegelet al. 1998). This complements our COSMOS [O ii] survey by ex-tending it to fainter flux limits.
Table 1 summarizes the covered sky area, survey volume andphotometric property in the COSMOS field and the SDF. Sincethe central wavelength of NB816 filter corresponds to a redshiftof 1.2 for [O ii] k3727 emission, together with the broadband fil-ter data, we can carry out a search for [O ii] emitters at z � 1:2.
3. RESULTS
3.1. Selection of NB816-Excess Objects
In order to select NB816-excess objects efficiently, it is desir-able to have a wavelength-matched continuum image as off-band
25 Our SDSS broadband filters are designated as rþ, iþ, and zþ in Capak et al.(2007) to distinguish from the original SDSS filters. Also, our B and V filters aredesignated as BJ and VJ in Capak et al. (2007), where J means Johnson andCousins filter system used in Landolt (1992).
26 See http://step.mtk.nao.ac.jp/sdf /project.
[O ii] LUMINOSITY FUNCTION AT z � 1.2 457
data. Since the central wavelength of the NB816 filter is differentfrom those of either i (i 0 or i�) and z 0 filters, wemake awavelength-matched continuum, ‘‘iz continuum,’’ using the following linearcombination: fiz ¼ 0:57fi þ 0:43fz 0 , where fi and fz 0 are the i (i
0
or i�) and z 0 flux densities, respectively. Its 3 � limiting magni-tude is iz ’ 26:0 mag in a 300 diameter aperture in the COSMOSfield,while 26.9mag in the SDF.Note thatwe use theCFHT i� mag-nitude for the bright galaxies with i 0 < 21 mag in the COSMOSfield since their i 0 magnitudes suffer from saturation effects. Thisenables us to more precisely sample the continuum at the same ef-fective wavelength as that of the NB816 filter.
Taking both the scatter in the iz� NB816 color and our sur-vey depth into account, candidate line-emitting objects are se-lected with the following criteria:
iz� NB816 � 0:2 ð1Þ
and
iz� NB816 > 3�iz�NB816; ð2Þ
where iz� NB816 ¼ 0:2 corresponds to EWobs � 268.We jus-tify these adopted criteria in x 3.3. We compute the 3 � of thecolor as
These two criteria, (1) and (2), are shown in Figure 1 by the redand blue solid lines, respectively.
In the COSMOS field, taking account of the homogeneity of thenoise level, we select galaxies in the following region: 149:40917� <R:A: < 150:82680� and 1:49056� < decl: < 2:90705�. The ef-fective survey area is 6700 arcmin2. We find 5824 sources in theCOSMOS field that satisfy the above criteria.
In the case of the SDF, objects with NB816 < 20 mag appearto be saturated. In order to avoid such saturated bright objects,we have also imposed the criterion NB816 > 20mag to the SDFsample.We then find 602 sources that satisfy the above criteria inthe SDF.
Note that the above NB816-excess objects found in both theCOSMOS field and the SDF are brighter than the limiting mag-nitude in all bands.
3.2. Selection of NB816-Excess Objects at z � 1:2
A narrowband survey of emission-line galaxies can potentiallydetect galaxies with different emission lines at different red-shifts. Strong emission lines that we would expect to detect areH� , H�, [O iii] kk4959, 5007, and [O ii] k3727 (Tresse et al.1999; Kennicutt 1992). In Table 2 we show redshift coverages ofthose emission lines for the NB816 filter.
Fig. 1.—Diagrams between iz� NB816 and NB816 for all objects in thei0-selected catalog in the COSMOS field (top) and the SDF (bottom). The hori-zontal solid red line corresponds to iz� NB816 ¼ 0:2. The blue line shows thedistribution of 3 � error. The pink line shows the limiting magnitude of iz. Thedotted line shows NB816 ¼ 20 mag.
TAKAHASHI ET AL.458 Vol. 172
In order to distinguish [O ii] k3727 emitters at z � 1:2 fromotheremission-line objects at different redshifts, we investigate theirbroadband color properties. In the top panels of Figures 2 and 3,we show the B� r 0 versus i 0 � z 0 and B� V versus i 0 � z 0
color-color diagrams for the 5824 sources in the COSMOS fieldtogether with the loci of model galaxies taken fromColman et al.(1980).We can clearly see some clumps in the diagrams.We alsocalculated local surface density on the diagrams shown by thecontours. The contour levels correspond to 2�, �, �/2, and �/3,where � corresponds to the mean surface density on each color-color diagram. These contours show prominent sequences closeto the model predictions for [O ii] emitters, with distinct H� , H�,or [O iii] kk4959, 5007 emitter in the diagrams.
Taking account of the model lines and the surface densitycontours on the diagram, we find that [O ii] emitters at z � 1:2
TABLE 2
Emission Lines Potentially Detected inside the Narrowband
Fig. 2.—Diagrams between B� r 0 vs. i0 � z0 for the 5824 emitter sources inthe COSMOS field (top) and B� RC vs. i0 � z0 for the 602 emitter sources in theSDF (bottom). Color loci of model galaxies (E, Sbc, Scd, Irr) from z ¼ 0 to 1.2 areshown with red lines. Colors of z ¼ 0:24, 0.64, 0.68, and 1.18 (for H� , [O iii],H�, and [O ii] emitters, respectively) are shownwith blue, yellow, green, and pinklines, respectively. The contour levels shown with gray lines corresponds to 2�,�, �/2, and �/3, where � is the mean surface density on each diagram. Pink pointsare [O ii] emitters at z � 1:2 confirmed by spectroscopy. We select the sourcesunder the dotted line in each panel as [O ii] emitters.
Fig. 3.—Diagrams between B� V vs. i0 � z0 for the 5824 emitter sources inthe COSMOS field (top) and the 602 emitter sources in the SDF (bottom). Themodel lines, points, and contour levels are same as Fig. 2. We select the sourcesunder the dotted line in each panel as [O ii] emitters.
[O ii] LUMINOSITY FUNCTION AT z � 1.2 459No. 1, 2007
can be selected by adopting the following criteria on the B� r 0
versus i 0 � z 0 color-color diagram:
B� r 0 < 5 i 0 � z 0ð Þ � 1:3; ð4Þ
or
B� r 0 < 0:7 i 0 � z 0ð Þ þ 0:4; ð5Þ
and on the B� V versus i 0 � z 0 color-color diagram:
B� V < 1:3 i 0 � z 0ð Þ: ð6Þ
The candidates that satisfy both of the criteria are selected to be[O ii] emitters at z � 1:2. These criteria give us a sample of 3178[O ii] emitting galaxy candidates in the COSMOS field. We candistinguish [O ii] emitters fromH� or H� or [O iii] emitters usingthese criteria. Since the two brightest [O ii] emitters seem to beAGNs, we do not include them in our final samples. Therefore,we finally obtain a sample of 3176 [O ii] emitting galaxy can-didates in the COSMOS field. Note that three [O ii] emitters atz � 1:2 confirmed by spectroscopy (Figs. 2 and 3, pink points intop panels; see x 3.3) are satisfied with the three criteria.
Next, we distinguish [O ii] emitters at z � 1:2 from emission-line objects at other redshifts in the SDF. In the bottom panels ofFigures 2 and 3, we show the B� RC versus i 0 � z 0 and B� Vversus i 0 � z 0 color-color diagram for the 602 sources in theSDF. The contour levels are the same as above. Taking accountof themodel lines and contours of distribution on the diagram,wefind that [O ii] emitters at z � 1:2 can be selected by adoptingthe following criteria on the B� RC versus i 0 � z 0 color-colordiagram:
B� RC < 5 i 0 � z 0ð Þ � 1:3; ð7Þ
or,
B� RC < 0:7 i 0 � z 0ð Þ þ 0:4; ð8Þ
and on the B� V versus i 0 � z 0 color-color diagram:
B� V < 1:3 i 0 � z 0ð Þ: ð9Þ
The candidates that satisfy both of the criteria are selected to be [O ii]emitters at z �1:2. These criteria give us a sample of 295 [O ii]emitting galaxy candidates in the SDF. After visual inspection ofthe NB816 images, we rejected one object, which appears to benoise. Therefore, we obtain a sample of 294 [O ii] emitting gal-axy candidates in the SDF. Note that four [O ii] emitters at z �1:2 confirmed by spectroscopy (Figs. 2 and 3, pink points inbottom panels; see x 3.3) are satisfied with the three criteria.
In this way, we obtain our final [O ii] emitting galaxy candi-dates in both COSMOS and SDF. To our knowledge, this is thelargest survey for [O ii] emitters beyond z ¼ 1 currently available.
In order to investigate how our selection criteria (4)Y(6) on thecolor-color diagrams affect completeness of the [O ii] emittersand contamination of the other emitters, we examined the num-ber distribution of emitter candidates as a function of distance fromthe adopted selection line on each color-color diagram in theCOSMOS field. The three distinct peaks of H� þ ½O iii, H� ,and [O ii] emitters can be seen in the distribution of B� V versusi 0 � z 0 color-color diagram shown in the right panel of Figure 4,while two prominent peaks of [O ii] emitters and that of other
emitters can be seen for the B� r 0 versus i 0 � z 0 color-colordiagram in the left panel of Figure 4.We fit the distributions witha Gaussian and estimate the amount of contamination by H� orH� + [O iii] emitters and incompleteness of the [O ii] emitters.Then we find that the amount of contamination and incomplete-ness are�2% and�3%, respectively. Thus, using the two color-color diagrams, our procedures presented here can be basicallyfree from contaminations from H� or H� or [O iii] emitters andallow us to select reliable [O ii] emitter samples at z � 1:2.
3.3. Optical Spectroscopy
Our pilot spectroscopic survey for objects in the COSMOSfield is now progressing (z-COSMOS; Lilly et al. 2006). The firstresults from z-COSMOS have already confirmed that the threegalaxies (ID 948253, ID 1297800, and ID 1690252) are star-forming galaxies at 1:17 < z < 1:20 (see Appendix).If we adopted the NB-excess criterion of iz� NB816 � 0:1
and the same color-color selection as we have described in x 3.2,our photometric sample would contain eight galaxies that werespectroscopically observed. The four galaxies among them arestar-forming galaxies at 1:17 < z < 1:20. However, the remain-ing four galaxies are all at z � 1:02, where the [O ii] emissionline is out of the bandpass of the NB816 filter. Since we find noH� , H�, or [O iii] emitters in our spectroscopic sample, our color-color selection criteria are reliable discriminators between [O ii]emitters at z � 1:2 and other emission-line objects.However, we have to mention why we find galaxies at z �
1:02 in spectroscopy. To investigate the detection at z � 1:02,we calculated evolution of iz� NB816 color by using the pop-ulation synthesis model, GALAXEV (Bruzual & Charlot 2003),and found that continuum feature of galaxies at z � 1:0 makesthe NB816 excess as shown in Figure 5. Note that emission-linefeatures are not included in Figure 5. Although one of the [O ii]emitters at z � 1:2 with small NB816 excess is removed, all fourdetections at z � 1:02 can be removed by the criterion of iz�NB816 � 0:2, as expected. Therefore, candidate line-emittingobjects are selected with the criterion of iz� NB816 � 0:2.Thus, it is expected that there is little contamination from objectsat other different redshifts in our [O ii] emitter sample.In the case of the SDF, redshifts of the following four [O ii]
emitters selected here (ID 27396, ID 29922, ID 36025, and ID178592) were also confirmed spectroscopically by Ly et al. (2007).Their spectroscopic redshifts are 1.1818, 1.1813, 1.1798, and1.1783, respectively.
Fig. 4.—Number distributions of emitter candidates on the B� r 0 vs. i0 � z0
(left) and B� V vs. i0 � z0 (right) color-color diagrams as a function of distancefrom the adopted selection lines in the COSMOS field. The adopted selectionlines are shown with dotted lines. The emitter candidates that do not satisfy theselection criteria are shownwith negative distance, while those satisfy the criteriaare shown with positive distance.
TAKAHASHI ET AL.460 Vol. 172
3.4. [O ii] Luminosity
The line flux, fL, is given by
fL ¼ �NBfNB � fiz
1� 0:57(�NB=�i); ð10Þ
where fNB and fiz are the flux densities in each filter, with�NBand �i being the effective bandwidth in those filters. The lim-iting observed line flux in the COSMOSfield and that of the SDFare 1:4 ; 10�17 and 8:7 ; 10�18 ergs s�1 cm�2, respectively.
In order to obtain the [O ii] luminosity for each source, we ap-ply a mean internal extinction correction to each object. To com-pare our result with the previous investigations compiled byHopkins (2004), we use the same extinction correction methodas that proposed by Hopkins (2004): AH� ¼ 1:0 mag and theCardelli et al. (1989) Galactic obscuration curve. Note that thiscorresponds to AV ¼ 1:22 and A½O ii ¼ 1:87 mag at the wave-length of [O ii] k3727. We also apply a statistical correction(21%; the average value of flux decrease due to the NB816 filter
transmission) to themeasured flux because the filter transmissionfunction is not square in shape (Fujita et al. 2003b). The [O ii]flux is then given by
fcor(½O ii) ¼ fL ; 100:4A½O ii ; 1:21: ð11Þ
Finally, the [O ii] luminosity is estimated by L(½O ii) ¼4�d 2
L fcor(½O ii). In this procedure, we assume that all the [O ii]k3727 emitters are located at z ¼ 1:187 that is the redshift corre-sponding to the central wavelength of NB816 filter. Therefore, theluminosity distance is set to be dL ¼ 8190 Mpc. For the COSMOSfield, the aperture effect is corrected by using the offset between300 diameter aperture and total magnitude given in the COSMOSofficial photometric catalog (Capak et al. 2007). For the SDF, weused the total magnitude in the SDF official catalog (Kashikawaet al. 2004). The basic data of [O ii] emitter candidates, including300 aperture magnitude of i 0, NB816, z 0, iz, and photometricerrors in the COSMOS field and the SDF are listed in Tables 3and 4, respectively. These tables also include line flux fL and [O ii]luminosity L(½O ii).
4. DISCUSSION
4.1. Luminosity Function of [O ii] Emitters
In order to investigate the star formation activity in the galax-ies at z �1:2 detected here, we construct the luminosity function(LF) for our COSMOS and SDF [O ii] emitter samples. The LFis given by the relation
�i log L(½O ii)f g� log L(½O ii)¼ Ni
Vco
; ð12Þ
where Vco is the comoving volume and Ni is number of galax-ies with [O ii] luminosity within the interval of log L(½O ii) �0:5� log L(½O ii). We have used� log L(½O ii) ¼ 0:2. The [O ii]LFs of the COSMOS field and SDF are shown in the top panel ofFigure 6. The number counts and the LFs obtained in both theCOSMOS field and SDF are given in Table 5.
The samples that characterize the faint end slope of the [O ii] LFmay be incomplete due to our selection criteria. The [O ii] LFlooks to be incomplete at log L � 42:0 for the COSMOS fieldand at log L � 41:8 for the SDF. To investigate the lowest lumi-nosity at which the [O ii] LF is still sufficiently complete, wechecked the luminosity at which the maximum number countappears in the LF. We examined several cases in which the binsof the LF are slightly shifted for avoiding that the selection of binsof the LF affects this analysis. We finally found log Llim ¼ 42:03
Fig. 5.—Evolution of iz� NB816 color as a function of redshift. Color loci ofmodel galaxies (SB, Irr, Scd, Sbc, E) are shown with pink, blue, green, yellow, andred lines, respectively. The horizontal lines corresponds to iz� NB816 ¼ 0:0, 0.1,and 0.2. Note that emission-line features are not included in this diagram.
TABLE 3
Photometric Properties of the [O ii] Emitter Candidates in the COSMOS Field
Note.—Table 3 is published in its entirety in the electronic edition of the Astrophysical Journal Supplement. A portion is shown here for guidance regarding its formand content.
a 300 aperture magnitude.b Photometric error.c Line flux.d Extinction corrected [O ii] luminosity.
[O ii] LUMINOSITY FUNCTION AT z � 1.2 461No. 1, 2007
and 41.77, are expected to be the completeness limit in theCOSMOS field and SDF, respectively. We fit the [O ii] LFs atL � Llim with the Schechter function (Schechter 1976) by themaximum likelihood parametric fit (the STYmethod; Sandage et al.1979).
We obtain the following best-fitting parameters for our [O ii]emitters in the COSMOS field with � ¼ �1:41þ0:16
�0:20. Theresults of Schechter function fit are overlaid in the top panel ofFigure 6.Since the Schechter function parameter � is sensitive to the
incompleteness at the faint end, we also investigate the changeof � as a function of limiting luminosity log Llim. We confirmedthat the best-fit � changes fast from when the log Llim is de-creased from 42.03 (COSMOS) and 41.77 (SDF). On the otherhand, the best-fit � changes slowly from when the log Llim isincreased from 42.03 (COSMOS) and 41.77 (SDF). For example,(log Llim; � ) ¼ (41:98; �1:15þ0:14
�0:13), (42.03, �1:41þ0:16�0:15), and
(42.08,�1:55þ0:19�0:17) for the COSMOS field, and (log Llim; � ) ¼
(41:72; �1:08þ0:36�0:37), (41.77,�1:38þ0:40
�0:37), and (41.82,�1:60þ0:43�0:41)
for the SDF, respectively. Thus, we conclude that the adopted com-pleteness limits of log Llim ¼ 42:03 (COSMOS) and 41.77 (SDF)are well determined and that derived Schechter parameters arerobust for the incompleteness.When our results of the COSMOS field and SDF are com-
pared, the number density of the COSMOS field is higher by afactor of �2 than that of the SDF because the�� of the COSMOSfield is twice as large as that of the SDF while L� is nearly thesame for the both fields. In spite of deeper survey depth of theSDF, the faint end slope of the LF for the COSMOS field andthe SDF yields a similar slope. The bottom panel of Figure 6 showsthe 1, 2, and 3 � contour levels in the � -log L� parameter spacefrom the STYanalysis. It can be seen that the � and L� are highlycorrelated. We therefore conclude that the large-number staticsof the COSMOS field provides both the reliable bright and faintends of the [O ii] LF.The [O ii] LF of previous studies (Ly et al. 2007; Hippelein
et al. 2003) are also plotted in the top panel of Figure 6. Hippeleinet al. (2003) surveyed an area of 309 arcmin2with using their ownmedium-band filters and selected 119 [O ii] emitters with thelimiting observed luminosity of log L(½O ii) ¼ 41:38 ergs s�1.Our [O ii] LF of the COSMOS field is similar to that of Hippeleinet al. (2003). The faint end slope � ¼ �1:45 of Hippelein et al.(2003) is in agreement with our value, � ¼ �1:41þ0:16
�0:15, in theCOSMOS field. Ly et al. (2007) selected 894 [O ii ] emitters inthe SDF by using the same catalog of our analysis. The differencebetween our LF of the SDF and that of Ly et al. (2007) may beattributed to the following different source selection procedures:Ly et al. (2007) used (1) 200 diameter aperture magnitude, (2) cri-terion of iz� NB816 > 2:5�iz�NB816, iz� NB816 ¼ 0:25, andthe median for the NB816 excess of 0.10, (3) B� V versus
TABLE 4
Photometric Properties of the [O ii] Emitter Candidates in the SDF
Note.—Table 4 is published in its entirety in the electronic edition of the Astrophysical Journal Supplement. A portion is shown here for guidance regarding its formand content.
a 300 aperture magnitude.b Photometric error.c Line flux.d Extinction-corrected [O ii] luminosity.
Fig. 6.—Top: Luminosity function at z � 1:2. Red points show extinction-corrected LF of the COSMOS field, blue points show extinction-corrected LF ofthe SDF. Red and blue lines are the best-fit Schechter function. The [O ii] LFderived by Ly et al. (2007) and Hippelein et al. (2003) are shown with black lineand dotted line, respectively. Bottom: 1, 2, and 3 � error contours for the best-fit[O ii] LF parameters of the COSMOS field (left) and the SDF (right).
TAKAHASHI ET AL.462 Vol. 172
RC � i 0 and V � RC versus i 0 � z 0 color-color diagrams to isolate[O ii] emitters from other emitters at different redshifts, and (4)SFR-dependent correction of Hopkins et al. (2001) for extinc-tion correction.
The number density of the [O ii] emitters in the SDF is alwayslower than those of the COSMOSfield andHippelein et al. (2003)at all the concerned luminosities. This difference is not due to se-lection method but probably to the effect of cosmic variance. Onepossible idea seems to be that the SDF samples a relatively lownumber density region of star-forming galaxies at z � 1:2 be-cause the number density obtained in the COSMOS field withthe covered area of �2 deg2 is expected to be closer to an averagenumber density in the universe. Further analysis of the [O ii] lu-minosity function at z � 1:2 in other fields will be required toconfirm that this is indeed the effect of cosmic variance.
4.2. Luminosity Density and Star Formation Rate Density
The [O ii] luminosity density is obtained by integrating the LF:
L(½O ii) ¼Z 1
0
�(L)L dL ¼ �(� þ 2)��L�; ð13Þ
where� is the Gamma function.We find the total [O ii] luminosityper unit comoving volume to be 1040:35
þ0:08�0:06 and 1039:99
þ0:22�0:09 ergs s�1
Mpc�3 at z � 1:2 in the COSMOS field and the SDF from ourbest fit LF, respectively. The star formation rate can be estimatedfrom the [O ii] luminosity using the relation
SFR ¼ 1:41 ; 10�41L(½O ii) M� yr�1; ð14Þ
where L(½O ii) is in units of ergs s�1 (Kennicutt 1998). Thus,the [O ii] luminosity density can be translated into the SFR den-
sity of �SFR ’ 0:32þ0:06�0:04 and 0:14þ0:09
�0:03 M� yr�1 Mpc�3 in theCOSMOSfield and the SDF, respectively. This SFRD from [O ii]luminosity in the COSMOS field is estimated by using the sta-tistically largest sample studied so far. The vertical error bar dueto the number statistics is definitively small, and the horizontalerror bar due to the width of the narrowband filter is also smallcompared with other spectroscopic surveys.
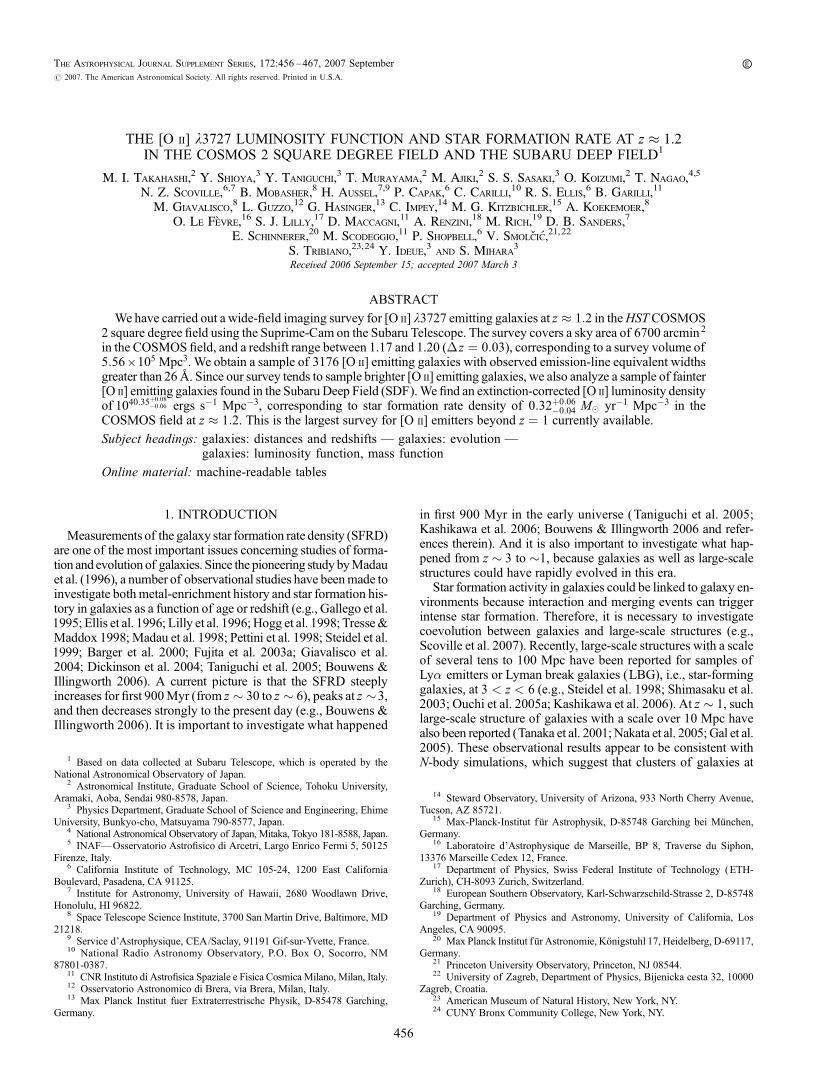
Figure 7 shows the evolution of the SFRD as a function ofredshift from z ¼ 2:5 to 0. The previous investigations plottedhere are compiled by Hopkins (2004), which have been con-verted to a common cosmology, consistent SFR calibrations,and consistent dust obscuration corrections where necessary.Our results follow the general of the strong decrease in the SFRDfrom z � 1 to z ¼ 0. If we carefully compare our results withprevious ones, we find that the SFRDmeasured in the COSMOSfield is consistent with that of Yan et al. (1999), while that of theSDF is consistent with that of Hogg et al. (1998). The differ-ence among the SFRDs of the COSMOS field, SDF, and theother surveys may not surprising because the SFRD varies fromspace to space within at least factor of 2 due to the cosmicvariance.
4.3. Spatial Distribution and Angular Two-PointCorrelation Function
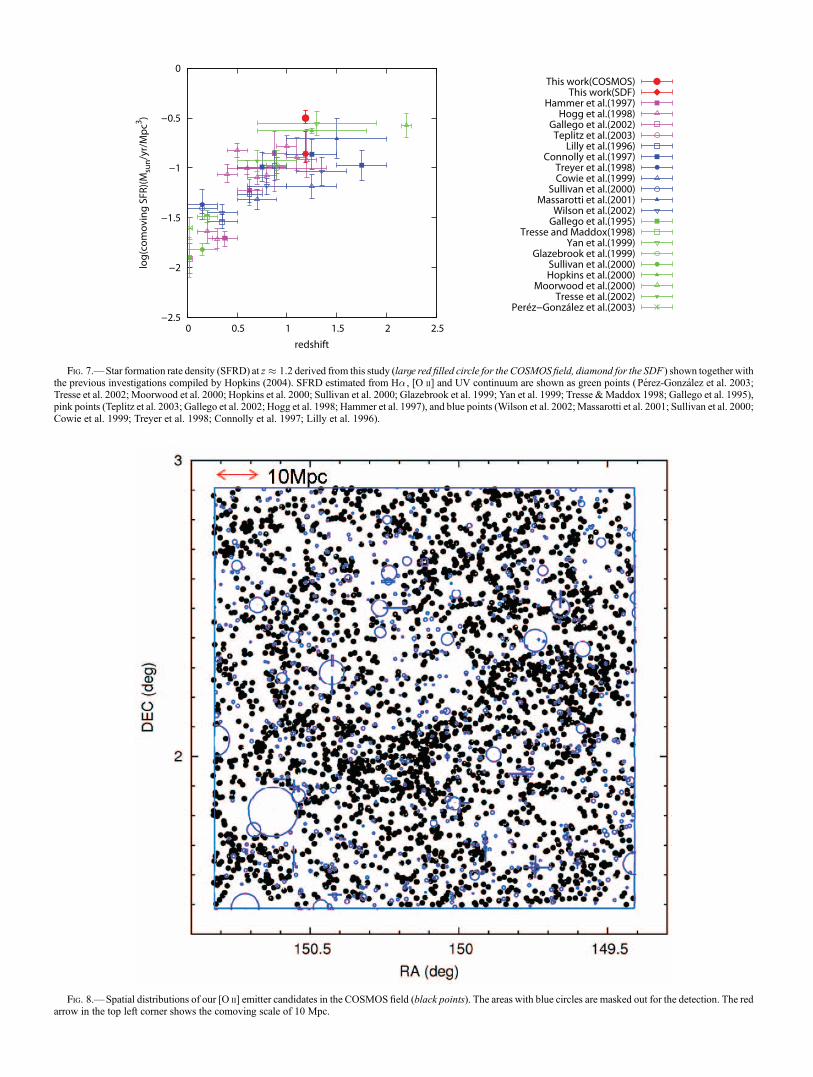
Figure 8 shows the spatial distribution of our 3176 [O ii] emittercandidates in the COSMOS field. There can be seen some clus-tering regions. In particular, it is worthwhile noting that thereappears to be a filamentary structure near the central region ofthe field in Figure 8. If this is real, this filament extends across�40 Mpc. At z � 1, large-scale clustering of red galaxies withthe scale of >10 Mpc have been identified (e.g., Tanaka et al.2001; Nakata et al. 2005; Gal et al. 2005). Our result suggests
TABLE 5
[O ii] k3727 Luminosity Function for the COSMOS Field and the SDF
COSMOS SDF
Observed Luminosity Function Corrected Luminosity Function Observed Luminosity Function Corrected Luminosity Function
[O ii] LUMINOSITY FUNCTION AT z � 1.2 463No. 1, 2007
Fig. 7.—Star formation rate density (SFRD) at z � 1:2 derived from this study (large red filled circle for the COSMOS field, diamond for the SDF ) shown together withthe previous investigations compiled by Hopkins (2004). SFRD estimated from H� , [O ii] and UV continuum are shown as green points (Perez-Gonzalez et al. 2003;Tresse et al. 2002; Moorwood et al. 2000; Hopkins et al. 2000; Sullivan et al. 2000; Glazebrook et al. 1999; Yan et al. 1999; Tresse &Maddox 1998; Gallego et al. 1995),pink points (Teplitz et al. 2003; Gallego et al. 2002; Hogg et al. 1998; Hammer et al. 1997), and blue points (Wilson et al. 2002;Massarotti et al. 2001; Sullivan et al. 2000;Cowie et al. 1999; Treyer et al. 1998; Connolly et al. 1997; Lilly et al. 1996).
Fig. 8.—Spatial distributions of our [O ii] emitter candidates in the COSMOS field (black points). The areas with blue circles are masked out for the detection. The redarrow in the top left corner shows the comoving scale of 10 Mpc.
that not only red galaxies but also relatively blue, star-forminggalaxies form large-scale clustering at these redshifts.
To discuss the clustering properties more quantitatively, wederive the angular two-point correlation function (ACF), w( ),using the estimator defined by Landy & Szalay (1993),
w( ) ¼ DD( )� 2DR( )þ RR( )
RR( ); ð15Þ
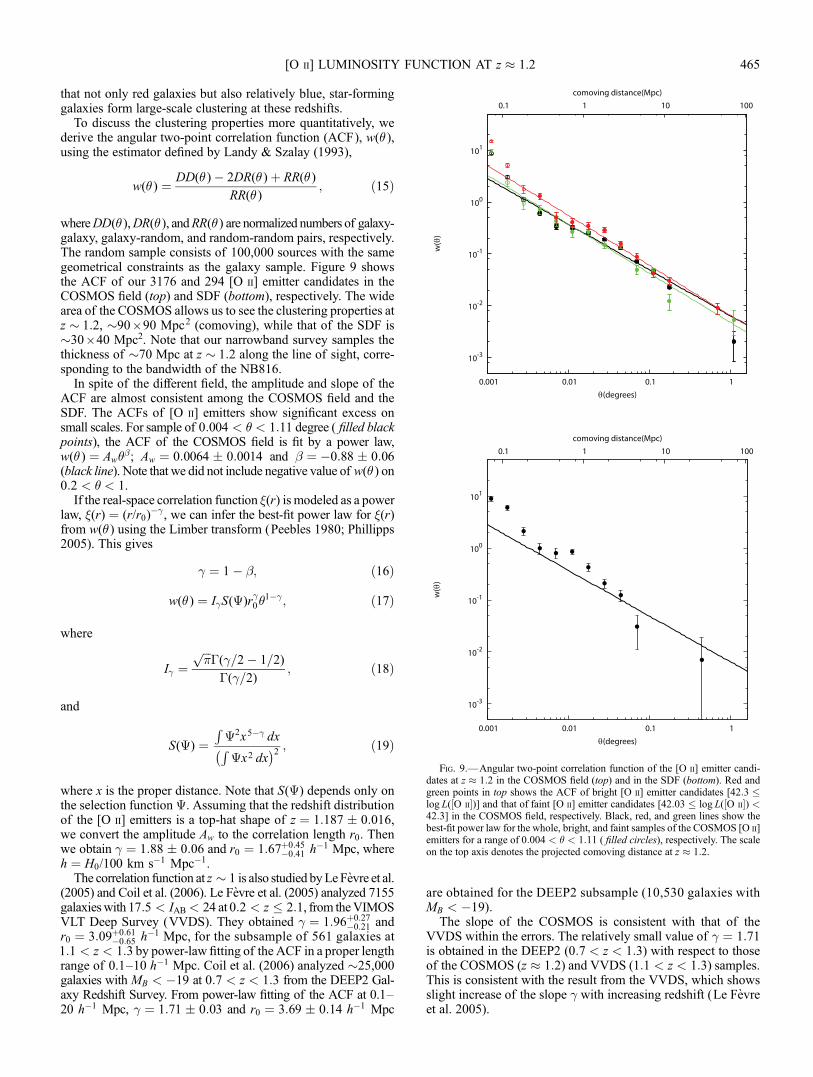
whereDD( ),DR( ), andRR( ) are normalized numbers of galaxy-galaxy, galaxy-random, and random-random pairs, respectively.The random sample consists of 100,000 sources with the samegeometrical constraints as the galaxy sample. Figure 9 showsthe ACF of our 3176 and 294 [O ii] emitter candidates in theCOSMOS field (top) and SDF (bottom), respectively. The widearea of the COSMOS allows us to see the clustering properties atz � 1:2, �90 ; 90 Mpc2 (comoving), while that of the SDF is�30 ; 40 Mpc2. Note that our narrowband survey samples thethickness of �70 Mpc at z � 1:2 along the line of sight, corre-sponding to the bandwidth of the NB816.
In spite of the different field, the amplitude and slope of theACF are almost consistent among the COSMOS field and theSDF. The ACFs of [O ii] emitters show significant excess onsmall scales. For sample of 0:004 < < 1:11 degree ( filled blackpoints), the ACF of the COSMOS field is fit by a power law,w( ) ¼ Aw
�; Aw ¼ 0:0064 � 0:0014 and � ¼ �0:88 � 0:06(black line). Note that we did not include negative value of w( ) on0:2 < < 1.
If the real-space correlation function (r) is modeled as a powerlaw, (r) ¼ (r/r0)
�� , we can infer the best-fit power law for (r)from w( ) using the Limber transform (Peebles 1980; Phillipps2005). This gives
� ¼ 1� �; ð16Þ
w( ) ¼ I�S(�)r�0
1��; ð17Þ
where
I� ¼ffiffiffi�
p�(�=2� 1=2)
�(�=2); ð18Þ
and
S(�) ¼R�2x5�� dxR�x2 dx
� �2 ; ð19Þ
where x is the proper distance. Note that S(�) depends only onthe selection function�. Assuming that the redshift distributionof the [O ii] emitters is a top-hat shape of z ¼ 1:187 � 0:016,we convert the amplitude Aw to the correlation length r0. Thenwe obtain � ¼ 1:88 � 0:06 and r0 ¼ 1:67þ0:45
�0:41 h�1 Mpc, whereh ¼ H0/100 km s�1 Mpc�1.
The correlation function at z � 1 is also studied byLeFevre et al.(2005) and Coil et al. (2006). Le Fevre et al. (2005) analyzed 7155galaxieswith 17:5 < IAB < 24 at 0:2 < z 2:1, from theVIMOSVLT Deep Survey (VVDS). They obtained � ¼ 1:96þ0:27
�0:21 andr0 ¼ 3:09þ0:61
�0:65 h�1 Mpc, for the subsample of 561 galaxies at1:1 < z < 1:3 by power-law fitting of the ACF in a proper lengthrange of 0.1Y10 h�1 Mpc. Coil et al. (2006) analyzed �25,000galaxies with MB < �19 at 0:7 < z < 1:3 from the DEEP2 Gal-axy Redshift Survey. From power-law fitting of the ACF at 0.1Y20 h�1 Mpc, � ¼ 1:71 � 0:03 and r0 ¼ 3:69 � 0:14 h�1 Mpc
are obtained for the DEEP2 subsample (10,530 galaxies withMB < �19).
The slope of the COSMOS is consistent with that of theVVDS within the errors. The relatively small value of � ¼ 1:71is obtained in the DEEP2 (0:7 < z < 1:3) with respect to thoseof the COSMOS (z � 1:2) and VVDS (1:1 < z < 1:3) samples.This is consistent with the result from the VVDS, which showsslight increase of the slope � with increasing redshift (Le Fevreet al. 2005).
Fig. 9.—Angular two-point correlation function of the [O ii] emitter candi-dates at z � 1:2 in the COSMOS field (top) and in the SDF (bottom). Red andgreen points in top shows the ACF of bright [O ii] emitter candidates [42:3 log L(½O ii)] and that of faint [O ii] emitter candidates [42:03 log L(½O ii) <42:3] in the COSMOS field, respectively. Black, red, and green lines show thebest-fit power law for the whole, bright, and faint samples of the COSMOS [O ii]emitters for a range of 0:004 < < 1:11 ( filled circles), respectively. The scaleon the top axis denotes the projected comoving distance at z � 1:2.
[O ii] LUMINOSITY FUNCTION AT z � 1.2 465
The correlation length of the COSMOS is smaller than thoseof the VVDS and DEEP2. This difference may be due to that thebrighter galaxies are selected by the VVDS (�23 < MB < �19)and DEEP2 (MB < �19) than by our COSMOS [O ii] sample(MB < �18 estimated by z 0 magnitude). It has been extensivelystudied that more luminous galaxies are more strongly clusteredin the local universe (Norberg et al. 2001, 2002; Zehavi et al.2005) and at z � 1 (Coil et al. 2006; Pollo et al. 2006). Further, theselection method adopted in the DEEP2 tends to exclude rela-tively blue galaxies and may result in the larger correlation lengththan those of the COSMOS [O ii] sample and the VVDS sample.It is known that the early type galaxies tend to show strongerclustering than late type ones (Loveday et al. 1999; Norberg et al.2002).
Since our samples are selected by emission-line features andthus biased to star-forming galaxies, the comparison is not straight-forward. Therefore, we also compare our results with those ofMeneux et al. (2006). They measure the spectral type depen-dence of correlation function using a sample of 6495 VVDS gal-axies. The galaxies with spectroscopic redshifts were divided intofour spectral classes from E/S0 (type 1), early spiral, late spiral,and irregular/star-forming galaxies (type 4). Our [O ii] samples areexpected to be almost late spiral and irregular star-forming gal-axies (see Figs. 2 and 3), we compare with merging type 3 and 4.They find that merging type 3 and 4 galaxies at 0:9 < z < 1:2(1030 galaxies, effective redshift = 1.032) have � ¼ 1:86þ0:11
�0:08and r0 ¼ 2:58þ0:25
�0:22 h�1 Mpc. The slope is in good agreementwith that of the COSMOS within the errors. Although this cor-relation length is smaller than that of all galaxies in the VVDSand DEEP2, and closer to our value r0 ¼ 1:67 h�1 Mpc, it is stilllarger than our result. Note that the magnitude range of both an-alyses is nearly the same. A interpretation of this result is thatstrong emission-line galaxies showweaker clustering than overalllate type galaxies.
To investigate the dependence of [O ii] luminosity, we alsoderive the ACFs for subsamples of different luminosity binsin the COSMOS field: (1) 42:03 log L(½O ii) < 42:30, and(2) 42:30 logL(½O ii). Note that log L(½O ii) ¼ 42:03 corre-sponds to the luminosity limit at the faint end. The green and redpoints in the top panel of Figure 9 show the ACFs obtained forthe faint subsample and for the bright subsample, respec-tively. By power-law fitting of each ACF in a range of 0:004 < < 1:11 degree we obtain Aw ¼ 0:0048 � 0:0015 and � ¼�0:95 � 0:09 (Figure 9, green line) or � ¼ 1:95 � 0:09 andr0 ¼ 1:65þ0:60
�0:55 h�1 Mpc for the faint sample, andAw ¼ 0:0065 �0:0014 and � ¼ �0:96 � 0:06 (Fig. 9, red line) or � ¼ 1:96 �0:06 and r0 ¼ 2:00þ0:45
�0:43 h�1 Mpc for the bright sample. The ACFamplitudes in the COSMOS field are given in Table 6.
Our result that clustering increases with increasing luminosityis consistent with many previous investigations (Norberg et al.2002; Zehavi et al. 2005; Coil et al. 2006; Lee et al. 2006). Thedeviation from the power law at a small scale is also reported byprevious investigations (Zehavi et al. 2004; Ouchi et al. 2005b;Coil et al. 2006; Kashikawa et al. 2006; Lee et al. 2006). Thiscould be explained by galaxy multiplicity in a single dark matterhalo at higher luminosities and on smaller scale. We do not an-alyze luminosity dependence of the ACF in the SDF, becausecompared with the COSMOS field, the number statistics of theSDF is too small to carry out this detailed analysis of the clus-tering property.
5. SUMMARY
A wide-field narrowband imaging survey for [O ii] k3727emitting galaxies at z � 1:2 in the HST COSMOS 2 square de-
gree field has been presented. Our main results and conclusionsare as follows.1. In this survey, we have found 3176 [O ii] emitting galaxies
in a comoving volume of 5:56 ; 105 Mpc3. This is the largest sur-vey for [O ii] emitters beyond z ¼ 1 to date.2. Although our survey samples numerous [O ii] emitting gal-
axies,most of them are relatively brighter oneswith logL(½O ii) >1042:03 ergs s�1. Therefore, it is difficult to investigate fainter partsof [O ii] luminosity function. In order to obtain more reliable in-formation, we have also analyzed optical photometric data of theSubaru Deep Field (SDF) available for public (Kashikawa et al.2004). Then we constructed the [O ii] luminosity function andfound the star formation rate density of 0:32þ0:06
�0:04 M� yr�1Mpc�3
in the COSMOS field. This result is consistent with those of pre-viousworks at similar redshifts (seeHopkins 2004)within the errors.3. The spatial distributions of [O ii] emitters show some overden-
sity regions over the entire field. In particular, a filamentary structureis found in the central region of the COSMOS field. Its extension isestimated as several tens of Mpc. These results suggest that the star-forming galaxies at z � 1:2 found here tend to cluster.4. Our angular two-point correlation function of the COSMOS
field is fit by a power law, w( ) ¼ (0:0064 � 0:0014)�0:88�0:06.We confirmed the previous results that more luminous galaxieshave stronger clustering strength. We found significant deviationfrom power law at small scale in the ACF of [O ii] emitters. Thisresult is consistentwith previous surveys (Zehavi et al. 2004;Ouchiet al. 2005b; Kashikawa et al. 2006), which suggests that [O ii]emitters at z � 1:2 are biased tracers of the mass density field.
The HST COSMOS treasury program was supported throughNASA grant HST-GO-09822. We greatly acknowledge the con-tributions of the entire COSMOS collaboration consisting of morethan 70 scientists. TheCOSMOSsciencemeeting in 2005Maywassupported by in part by the NSF through grant OISE-0456439.We would also like to thank the Subaru Telescope staff for theirinvaluable help. This work was financially supported in part by theJSPS (grants 15340059 and 17253001). S. S. S. and T. N. are JSPSfellows.
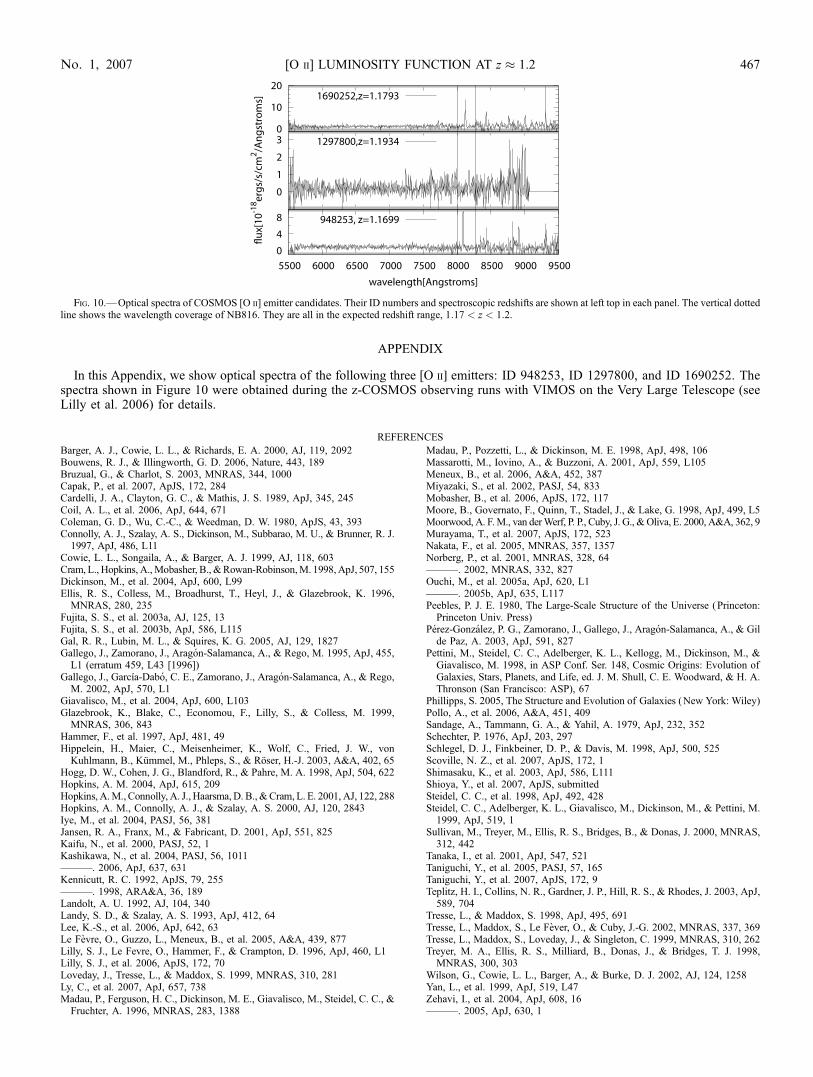
In this Appendix, we show optical spectra of the following three [O ii] emitters: ID 948253, ID 1297800, and ID 1690252. Thespectra shown in Figure 10 were obtained during the z-COSMOS observing runs with VIMOS on the Very Large Telescope (seeLilly et al. 2006) for details.
REFERENCES
Barger, A. J., Cowie, L. L., & Richards, E. A. 2000, AJ, 119, 2092Bouwens, R. J., & Illingworth, G. D. 2006, Nature, 443, 189Bruzual, G., & Charlot, S. 2003, MNRAS, 344, 1000Capak, P., et al. 2007, ApJS, 172, 284Cardelli, J. A., Clayton, G. C., & Mathis, J. S. 1989, ApJ, 345, 245Coil, A. L., et al. 2006, ApJ, 644, 671Coleman, G. D., Wu, C.-C., & Weedman, D. W. 1980, ApJS, 43, 393Connolly, A. J., Szalay, A. S., Dickinson, M., Subbarao, M. U., & Brunner, R. J.1997, ApJ, 486, L11
Cowie, L. L., Songaila, A., & Barger, A. J. 1999, AJ, 118, 603Cram, L., Hopkins, A.,Mobasher, B., &Rowan-Robinson,M. 1998,ApJ, 507, 155Dickinson, M., et al. 2004, ApJ, 600, L99Ellis, R. S., Colless, M., Broadhurst, T., Heyl, J., & Glazebrook, K. 1996,MNRAS, 280, 235
Fujita, S. S., et al. 2003a, AJ, 125, 13Fujita, S. S., et al. 2003b, ApJ, 586, L115Gal, R. R., Lubin, M. L., & Squires, K. G. 2005, AJ, 129, 1827Gallego, J., Zamorano, J., Aragon-Salamanca, A., & Rego, M. 1995, ApJ, 455,L1 (erratum 459, L43 [1996])
Gallego, J., Garcıa-Dabo, C. E., Zamorano, J., Aragon-Salamanca, A., & Rego,M. 2002, ApJ, 570, L1
Giavalisco, M., et al. 2004, ApJ, 600, L103Glazebrook, K., Blake, C., Economou, F., Lilly, S., & Colless, M. 1999,MNRAS, 306, 843
Hammer, F., et al. 1997, ApJ, 481, 49Hippelein, H., Maier, C., Meisenheimer, K., Wolf, C., Fried, J. W., vonKuhlmann, B., Kummel, M., Phleps, S., & Roser, H.-J. 2003, A&A, 402, 65
Hogg, D. W., Cohen, J. G., Blandford, R., & Pahre, M. A. 1998, ApJ, 504, 622Hopkins, A. M. 2004, ApJ, 615, 209Hopkins, A.M., Connolly, A. J., Haarsma,D. B.,&Cram, L. E. 2001, AJ, 122, 288Hopkins, A. M., Connolly, A. J., & Szalay, A. S. 2000, AJ, 120, 2843Iye, M., et al. 2004, PASJ, 56, 381Jansen, R. A., Franx, M., & Fabricant, D. 2001, ApJ, 551, 825Kaifu, N., et al. 2000, PASJ, 52, 1Kashikawa, N., et al. 2004, PASJ, 56, 1011———. 2006, ApJ, 637, 631Kennicutt, R. C. 1992, ApJS, 79, 255———. 1998, ARA&A, 36, 189Landolt, A. U. 1992, AJ, 104, 340Landy, S. D., & Szalay, A. S. 1993, ApJ, 412, 64Lee, K.-S., et al. 2006, ApJ, 642, 63Le Fevre, O., Guzzo, L., Meneux, B., et al. 2005, A&A, 439, 877Lilly, S. J., Le Fevre, O., Hammer, F., & Crampton, D. 1996, ApJ, 460, L1Lilly, S. J., et al. 2006, ApJS, 172, 70Loveday, J., Tresse, L., & Maddox, S. 1999, MNRAS, 310, 281Ly, C., et al. 2007, ApJ, 657, 738Madau, P., Ferguson, H. C., Dickinson, M. E., Giavalisco, M., Steidel, C. C., &Fruchter, A. 1996, MNRAS, 283, 1388
Madau, P., Pozzetti, L., & Dickinson, M. E. 1998, ApJ, 498, 106Massarotti, M., Iovino, A., & Buzzoni, A. 2001, ApJ, 559, L105Meneux, B., et al. 2006, A&A, 452, 387Miyazaki, S., et al. 2002, PASJ, 54, 833Mobasher, B., et al. 2006, ApJS, 172, 117Moore, B., Governato, F., Quinn, T., Stadel, J., & Lake, G. 1998, ApJ, 499, L5Moorwood, A. F.M., van derWerf, P. P., Cuby, J. G., &Oliva, E. 2000, A&A, 362, 9Murayama, T., et al. 2007, ApJS, 172, 523Nakata, F., et al. 2005, MNRAS, 357, 1357Norberg, P., et al. 2001, MNRAS, 328, 64———. 2002, MNRAS, 332, 827Ouchi, M., et al. 2005a, ApJ, 620, L1———. 2005b, ApJ, 635, L117Peebles, P. J. E. 1980, The Large-Scale Structure of the Universe (Princeton:Princeton Univ. Press)
Perez-Gonzalez, P. G., Zamorano, J., Gallego, J., Aragon-Salamanca, A., & Gilde Paz, A. 2003, ApJ, 591, 827
Pettini, M., Steidel, C. C., Adelberger, K. L., Kellogg, M., Dickinson, M., &Giavalisco, M. 1998, in ASP Conf. Ser. 148, Cosmic Origins: Evolution ofGalaxies, Stars, Planets, and Life, ed. J. M. Shull, C. E. Woodward, & H. A.Thronson (San Francisco: ASP), 67
Phillipps, S. 2005, The Structure and Evolution of Galaxies (New York: Wiley)Pollo, A., et al. 2006, A&A, 451, 409Sandage, A., Tammann, G. A., & Yahil, A. 1979, ApJ, 232, 352Schechter, P. 1976, ApJ, 203, 297Schlegel, D. J., Finkbeiner, D. P., & Davis, M. 1998, ApJ, 500, 525Scoville, N. Z., et al. 2007, ApJS, 172, 1Shimasaku, K., et al. 2003, ApJ, 586, L111Shioya, Y., et al. 2007, ApJS, submittedSteidel, C. C., et al. 1998, ApJ, 492, 428Steidel, C. C., Adelberger, K. L., Giavalisco, M., Dickinson, M., & Pettini, M.1999, ApJ, 519, 1
Sullivan, M., Treyer, M., Ellis, R. S., Bridges, B., & Donas, J. 2000, MNRAS,312, 442
Tanaka, I., et al. 2001, ApJ, 547, 521Taniguchi, Y., et al. 2005, PASJ, 57, 165Taniguchi, Y., et al. 2007, ApJS, 172, 9Teplitz, H. I., Collins, N. R., Gardner, J. P., Hill, R. S., & Rhodes, J. 2003, ApJ,589, 704
Tresse, L., & Maddox, S. 1998, ApJ, 495, 691Tresse, L., Maddox, S., Le Fever, O., & Cuby, J.-G. 2002, MNRAS, 337, 369Tresse, L., Maddox, S., Loveday, J., & Singleton, C. 1999, MNRAS, 310, 262Treyer, M. A., Ellis, R. S., Milliard, B., Donas, J., & Bridges, T. J. 1998,MNRAS, 300, 303
Wilson, G., Cowie, L. L., Barger, A., & Burke, D. J. 2002, AJ, 124, 1258Yan, L., et al. 1999, ApJ, 519, L47Zehavi, I., et al. 2004, ApJ, 608, 16———. 2005, ApJ, 630, 1
Fig. 10.—Optical spectra of COSMOS [O ii] emitter candidates. Their ID numbers and spectroscopic redshifts are shown at left top in each panel. The vertical dottedline shows the wavelength coverage of NB816. They are all in the expected redshift range, 1:17 < z < 1:2.
[O ii] LUMINOSITY FUNCTION AT z � 1.2 467No. 1, 2007