The OBF Database: A Large Face Video Database for Remote Physiological Signal Measurement and Atrial Fibrillation Detection Xiaobai Li † , Iman Alikhani † , Jingang Shi † , Tapio Sepp¨ anen † , Juhani Junttila ‡ , Kirsi Majamaa-Voltti ‡ , Mikko Tulppo ‡ and Guoying Zhao §† † Center for Machine Vision and Signal Analysis (CMVS), University of Oulu, Oulu, Finland ‡ Research Unit of Internal Medicine, Medical Research Center Oulu, Oulu University Hospital and University of Oulu, Oulu, Finland § School of Information and Technology, Northwest University, Xi’an, China Email:{xiaobai.li,iman.alikhani,jingang.shi,tapio.seppanen,juhani.junttila,mikko.tulppo,guoying.zhao}@oulu.fi & kirsi.majamaa-voltti@ppshp.fi Abstract—Physiological signals, including heart rate (HR), heart rate variability (HRV), and respiratory frequency (RF) are important indicators of our health, which are usually measured in clinical examinations. Traditional physiological signal measure- ment often involves contact sensors, which may be inconvenient or cause discomfort in long-term monitoring sessions. Recently, there were studies exploring remote HR measurement from facial videos, and several methods have been proposed. However, previous methods cannot be fairly compared, since they mostly used private, self-collected small datasets as there has been no public benchmark database for the evaluation. Besides, we haven’t found any study that validates such methods for clinical applications yet, e.g., diagnosing cardiac arrhythmias/disease, which could be one major goal of this technology. In this paper, we introduce the Oulu Bio-Face (OBF) database as a benchmark set to fill in the blank. The OBF database in- cludes large number of facial videos with simultaneously recorded reference physiological signals. The data were recorded both from healthy subjects and from patients with atrial fibrillation (AF), which is the most common sustained and widespread cardiac arrhythmia encountered in clinical practice. Accuracy of HR, HRV and RF measured from OBF videos are provided as the baseline results for future evaluation. We also demonstrated that the video-extracted HRV features can achieve promising performance for AF detection, which has never been studied before. From a wider outlook, the remote technology may lead to convenient self-examination in mobile condition for earlier diagnosis of the arrhythmia. I. INTRODUCTION Physiological signals such as heart rate (HR), heart rate variability (HRV), and respiratory frequency (RF) are vi- tal biomarkers of the body and necessary information for diagnostic and monitoring purposes of clinicians. They are constantly regulated by the autonomic activity of the nervous system and thus are indirect sources of information regarding nervous system functionality. Those biomarkers are monitored Correspnding Author: Guoying Zhao, email: guoying.zhao@oulu.fi in many health-care scenarios in clinical settings, whether it is a treatment procedure or examination and diagnostics. Conven- tional yet most prevalent means of cardiovascular monitoring often involves invasive or non-invasive sets of sensors, e.g., electrocardiography (ECG) sensors attached to the chest to measure cardiac electrical activity, or a pulse oximeter attached to finger tip or earlobe in order to measure the blood volume pulse (BVP). The wired connection of sensor sets causes discomfort (particularly for elderlies and infants) for those undergo long-term monitoring. In recent years, there were studies reported that heartbeat could be remotely measured from facial videos [1], [2], [3], [4], [5]. Some studies [2], [4], [5] proposed color-based methods to measure heartbeat information by analyzing the color change of the face videos, while others [3] proposed motion-based methods. No doubt whatsoever the idea of estimating physiological signals remotely from face could be a promising alternative platform for inconvenient clinical and daily monitoring, and it explains the reason of growing number of research papers in this area. However, considering the emerging technology of remote physiological signal measure- ment, two key questions are yet to be addressed: 1) How can we fairly evaluate the proposed methods?, 2) Are the methods sufficiently accurate for medical pur- poses? Previous studies were not able to comprehensively address these two prominent questions, and one major reason is the lack of a benchmark database. To our best knowledge, as of now we were not able to find any database published for the purpose of validating video-extracted physiological signals to detect abnormal cardiac activity patterns for clinical purpose. In this paper, we introduce the Oulu BioFace (OBF) database, as a benchmark testing set to fill in the blank. OBF database includes large number of controlled subjects’ data as well as patients’ suffering from atrial fibrillation (AF). A 978-1-5386-2335-0/18/$31.00 c 2018 IEEE
Transcript
The OBF Database: A Large Face Video Databasefor Remote Physiological Signal Measurement and
Atrial Fibrillation DetectionXiaobai Li†, Iman Alikhani†, Jingang Shi†, Tapio Seppanen†, Juhani Junttila‡, Kirsi Majamaa-Voltti‡,
Mikko Tulppo‡ and Guoying Zhao§††Center for Machine Vision and Signal Analysis (CMVS),
University of Oulu, Oulu, Finland‡Research Unit of Internal Medicine, Medical Research Center Oulu,
Oulu University Hospital and University of Oulu, Oulu, Finland§School of Information and Technology, Northwest University, Xi’an, China
Abstract—Physiological signals, including heart rate (HR),heart rate variability (HRV), and respiratory frequency (RF) areimportant indicators of our health, which are usually measured inclinical examinations. Traditional physiological signal measure-ment often involves contact sensors, which may be inconvenientor cause discomfort in long-term monitoring sessions. Recently,there were studies exploring remote HR measurement fromfacial videos, and several methods have been proposed. However,previous methods cannot be fairly compared, since they mostlyused private, self-collected small datasets as there has beenno public benchmark database for the evaluation. Besides, wehaven’t found any study that validates such methods for clinicalapplications yet, e.g., diagnosing cardiac arrhythmias/disease,which could be one major goal of this technology.
In this paper, we introduce the Oulu Bio-Face (OBF) databaseas a benchmark set to fill in the blank. The OBF database in-cludes large number of facial videos with simultaneously recordedreference physiological signals. The data were recorded both fromhealthy subjects and from patients with atrial fibrillation (AF),which is the most common sustained and widespread cardiacarrhythmia encountered in clinical practice. Accuracy of HR,HRV and RF measured from OBF videos are provided as thebaseline results for future evaluation. We also demonstratedthat the video-extracted HRV features can achieve promisingperformance for AF detection, which has never been studiedbefore. From a wider outlook, the remote technology may leadto convenient self-examination in mobile condition for earlierdiagnosis of the arrhythmia.
I. INTRODUCTION
Physiological signals such as heart rate (HR), heart ratevariability (HRV), and respiratory frequency (RF) are vi-tal biomarkers of the body and necessary information fordiagnostic and monitoring purposes of clinicians. They areconstantly regulated by the autonomic activity of the nervoussystem and thus are indirect sources of information regardingnervous system functionality. Those biomarkers are monitored
in many health-care scenarios in clinical settings, whether it isa treatment procedure or examination and diagnostics. Conven-tional yet most prevalent means of cardiovascular monitoringoften involves invasive or non-invasive sets of sensors, e.g.,electrocardiography (ECG) sensors attached to the chest tomeasure cardiac electrical activity, or a pulse oximeter attachedto finger tip or earlobe in order to measure the blood volumepulse (BVP). The wired connection of sensor sets causesdiscomfort (particularly for elderlies and infants) for thoseundergo long-term monitoring.
In recent years, there were studies reported that heartbeatcould be remotely measured from facial videos [1], [2], [3],[4], [5]. Some studies [2], [4], [5] proposed color-basedmethods to measure heartbeat information by analyzing thecolor change of the face videos, while others [3] proposedmotion-based methods. No doubt whatsoever the idea ofestimating physiological signals remotely from face could bea promising alternative platform for inconvenient clinical anddaily monitoring, and it explains the reason of growing numberof research papers in this area. However, considering theemerging technology of remote physiological signal measure-ment, two key questions are yet to be addressed:
1) How can we fairly evaluate the proposed methods?,2) Are the methods sufficiently accurate for medical pur-
poses?
Previous studies were not able to comprehensively addressthese two prominent questions, and one major reason is thelack of a benchmark database. To our best knowledge, as ofnow we were not able to find any database published for thepurpose of validating video-extracted physiological signals todetect abnormal cardiac activity patterns for clinical purpose.
Fig. 1. (A). ECG of a healthy person, and (B). ECG of an AF patient.The irregular pulsation of the heart and morphological change of ECGare descriptive features of AF. If AF could be examined and detected bysome convenient means at home, e.g., self-checking through a smart camerarecording one’s face, it would greatly help people who are in need ofcontinuous monitoring.
sample ECG signal measured from a healthy person as wellas an AF patient’s signal is shown in Figure 1. Our aim is firstto introduce the database, second to carry out experiments onOBF to primarily evaluate the accuracy of remote HR, HRVand RF measurements; and third to demonstrate the possibilityof using video-extracted features for AF detection, which hasnever been studied before.
II. BACKGROUND
A. Remote physiological signal measurement from face
We first briefly review the main progress of studies re-garding remote physiological signal measurements, derivedfrom facial videos. By physiological signals we mean averageHR, HRV and RF, while the literature mostly offers studiesexploring average HR, and a few of them considered themeasurements of HRV features and RF. Verkruysse et al. [1]in 2008 first reported that HR can be measured from colorfacial videos recorded under ambient light. The authors alsofound that among the three color channels, the green onecontains the strongest heart beat related component. Poh etal. in [6] proposed a method to use independent componentanalysis (ICA) of the three color channels for HR measurementfrom web-cam-recorded facial videos. Since then many studies[7], [4], [8], [5] proposed improved color-based approachesfor average HR measurement from facial videos. The laterapproaches mainly focused on face region selection, reducingartifacts, caused by motions and illumination variations.
Nevertheless, there are also studies considering motion-based methods for HR measurement from facial videos. In2013, Balakrishnan et al. [3] first proposed that HR can bemeasured by tracking the motion trajectories of facial pointsdue to the interaction of gravity and arterial pulsations, andtwo studies [9], [10] followed their work by improving thetrajectory-analyzing methods for HR measurement from facialvideos. More detailed background of remote HR measurementstudies is referred to one review paper [11].
All the mentioned studies focused on average HR measure-ment. However, HR counts the number of heartbeats withina specific period of time, which is a valuable yet very coarseand limited description of the cardiac activity. The HRV (alsoreferred as the inter-beat-interval, IBI) on the other side,indicates the variation in time interval between heartbeats,which offers much more detailed information about cardiacand autonomic nervous system activity. But HRV requiresmore delicate measurement as it is computed using time pointsof each individual heartbeat. For rigorous applications andcomplex analysis such as clinical diagnosis, HRV is needed,while HR is too coarse for such purposes.
Compared to remote HR measurement studies, remote HRVanalysis were only addressed in a few papers. In 2011 Pohet al. [2] extended their previous work and analyzed HRVand RF from facial videos using a similar yet slightly im-proved approach. The method was validated on a small self-collected dataset of 12 persons. McDuff et al. [12] used thesame approach to compute HRV features derived from face,and applied the face-derived HRV features for stress levelclassification on a self-collected dataset of ten subjects. Inone later work [13], the authors proposed a chrominance-basedmethod with continuous wavelet transform (CWT) to attenuatethe HRV measurement noise, which was validated on a self-collected dataset of six subjects. Besides, the feasibility of RFestimation from facial videos was also proved in [2], [14].
To sum up, remote physiological signal measurements is anew area in machine vision research, and growing numberof pieces of research is being reported. Considering theprospective future of the topic, two important questions needto be addressed:
• How one can fairly evaluate the proposed methods?Previous studies share one common problem about thetesting datasets. Most of the proposed methods wereonly validated on self-collected datasets, containing smallsample size. The limitation of using private datasets isthat there is no benchmark that methods can be fairlyevaluated and compared for this new emerging topic.There were some studies [4], [8], [5], [10] tested on ashared MAHNOB-HCI database [15]. The MAHNOB-HCI was originally designed for emotion analysis, andthe videos involve various issues and poor illumination,which might be too complicated for delicate HRV mea-surements. It is better to start the exploration of remoteHRV analysis methods first on a fine and well-controlleddataset (as the OBF database proposed here), and thenproceed to more challenging datasets later.
• Are the derived signals sufficiently qualified for med-ical purposes? Although the physiological signals canbe measured for other purposes (e.g. emotion analysis),one ultimate and the most demanding purpose is clinicalusage (e.g. diagnosing cardiac arrhythmia such as AF).At the moment, the authors could not find any proposedremote measurement method which has been validatedfor medical diagnosis, and thus, the primary step towardsthat is to collect a proper dataset for such target.
B. Atrial fibrillation (AF)
AF is one of the most common sustained widespread cardiacarrhythmia and according to American Heart Society at least2.7 million Americans are living with AF. In AF electricalimpulses do not originate in the sinoatrial (SA) node and causedisorganized and uncoordinated pulse through cardiac muscle.Thus, AF is usually accompanied with rapid and irregularheartbeats. It can be diagnosed using electrical activity of theheart recorded by ECG. ECG signal measured from a healthyperson versus a patient diagnosed with AF is shown in Figure1. The peak population of AF is owned by elders over 65-year-old, and it is likely to happen for younger people witheither family history, or with related diseases, like hypertensionor diabetes. AF is a major cause of hospitalization today.Constant AF may lead to severe or even fetal consequences(e.g., ischemic stroke). But in case of early diagnosis, AFcould be controlled or even cured with medications and othertreatments, such as electrical cardioversion. Unfortunately theAF in early stage is less symptomatic for some people,who may miss the opportunity of early intervention. Remoteexamination of AF in a convenient mean, e.g., with a cameraat home, could increase the chance of early intervention andcut a substantial expenses in treatment and hospitalization ofsuspected AF patients.
C. Contribution of the current study
In this paper, we introduce the OBF database. OBF databaseincludes large number of face videos and synchronized refer-ence physiological signals recorded from both healthy subjectsand AF-diagnosed patients. The OBF database can be used asa benchmark for:
1) Evaluating the methods of physiological signal deriva-tion (HR, HRV and RF) from facial videos (of resting-state vs. post-exercise; or of three groups of differentskin tones);
2) Training computational models to use video-extractedphysiological features for AF detection.
We also carry out experiments on OBF database to:1) Evaluate the accuracy of HR, HRV and RF measurement
from face, and report the performance as baseline resultsfor future comparison with other proposed methods;
2) Use the face-extracted HRV features for detecting AFcases [16].
III. OULU BIO-FACE (OBF) DATABASE
A. Equipment and setup
The data collection was first carried out for healthy subjectsat the University of Oulu, and then at the Oulu University Hos-pital for AF patient’s recording. The recording environmentand setups were strictly controlled so that data achieved atboth sites are of the same properties. A multi-modal setup wasarranged for synchronized recording of two video channels andthree channels of physiological signals from each participant.The recording set includes a computer, a color (RGB) camera,a near infra-red (NIR) camera, a biosignal data acquisition
(BIO) device with three sets of sensors, and two LED lights.Detailed information of all equipment are listed in Table II.The software used for recording physiological signals is BioTrace+ NX10 1, which is provided by the device company. Wealso used a free software VirtualDubMod 2 for the recordingof NIR videos.
TABLE ISTATISTICAL INFORMATION OF THE PARTICIPANTS.
Healthy (n=100) Patient (n=63)Age (y) 31.6± 8.8, [18, 68] 68.1± 13.2, [43, 81]Gender 61% M , 39% F 50% M , 50% FEthnic Caucasian:32%,
Asian:37%,Others:31%.
Caucasian: 100%
Weight (Kg) 71± 16 88± 13Wear eyeglasses 39% 50%
RGB videos recorded using the color camera are the coredata of OBF database. Most commercial oximeters use NIRbandwidth light sources for contact BVP measurements, whilethe NIR face videos haven’t been studied yet for the samepurpose in non-contact video-extracted context. Thus we alsoadded an additional NIR video set to explore the feasibility ofphysiological signal derivation from the NIR facial videos.
The recording environmental setup is illustrated in Figure2. A chair was placed in front of cameras at one meterdistance. Two lights standing on both sides of the camerasand illuminate the faces at 45 degree angle with a distance of1.5 meters. As OBF is the first database built for evaluatingmethods for remote measurement of physiological signals,including very challenging HRV features, there is possibilitythat the video-extracted HRV features are too poor for theAF detection at this stage. We intentionally design the setupto make sure the videos could be of relatively high quality,so that future studies can explore methods on the data as afundamental starting point. More challenging data (recordedin wild condition) will be considered as the next step.
Fig. 2. The setup of the OBF database collection.
1https://www.mindmedia.com/downloads/2http://www.virtualdub.org/3More patients data are being collected for a target number of 100. Statistic
info are based on current 6 patients.
TABLE IIEQUIPMENT AND SPECIFICATIONS AND SETTINGS.
Device Specifications Settings OutputComputer HP EliteDesk Windows 7 OS N/A
RGB camera Blackmagic URFA mini ISO 400, FPS 60, HD 1920 x 1080 RGB videoNIR camera Customized USB 2.0 Camera box (SN9C201&202) 640 x 480, FPS 30 NIR video
LED lights (2) Aputure, LightStorm LS 1c Brightness: 3500 lux, Temperature: 5500 k N/ABiosignal Acquisition NeXus-10 MKII N/A N/A
ECG sensor NX-EXG2B 256Hz ECG SignalRespiratory Belt NX-RFP1B 32Hz RF Signal
BVP sensor NX-BVP1C 128Hz BVP Signal
TABLE IIIDATA COMPOSITION OF THE OBF DATABASE.
Modalities Data length / person Total(min)Healthy (n=100) AF (n=6)
RGB Video,NIR Video
ECG, BVP, RF
Resting state:5min
Prior-treatment:5min 10600
Post-exercise:5min
Post-treatment:5min
B. Participants
Healthy participants were recruited from University of Ouluthrough internal email calls. The research content and datacollection procedure were explained in the emails, and alto-gether 100 healthy (no heart disease history) volunteers wererecruited. AF patients were recruited from Oulu UniversityHospital by cardiologists and nurses. Most of the patients werereserved on a list to receive cardioversion treatment, whilethe rest were acute patients recruited from emergency center.The collection of AF patients data is ongoing at the moment.Already six patients participated before the experiment, whilemore patients are reserved and data of altogether 100 patientsof diverse ethnicities will be collected in the following monthsand published as another database. General statistical informa-tion of the participants are summarized in Table I. The healthygroup covers a wide range of age, and owns a diverse ethnicity.
Ethical issues: The study was performed according to theDeclaration of Helsinki, and the local committee of researchethics of the Northern Ostrobothnia Hospital District approvedthe protocol. All the subjects gave written informed consent.The patients were accompanied and arranged by professionalcardiologists and nurses through the whole measurement.
C. Acquisition procedure
Before the execution of the recording, each participant readand signed the consent agreement. Then the participants wereguided to seat in front of the cameras, and bio-sensors wereattached to them. The participants were instructed to remaincomfortable and seated facing the cameras. There were twosections of recording, each lasts for five minutes. Healthyparticipants were asked to exercise (climbing the stairs) forabout five minutes between the two sessions in order to recordhigher heart rate for the next session. Thus, in session one werecorded the resting state, and in session two we recordedpost-exercise state of elevated HR and RF.
For AF patients, session one was recorded after they wereexamined by the doctor prior to the cardioversion treatment(with the AF symptom), while session two was recorded threehours later after the cardioversion treatment (with recoveredsinus heart rhythm).
Regarding the data synchronization, for each session, thecameras and the bio-sensors were synchronized by passinga visual cue (for both of the cameras) and pressing a triggerbutton (on the bio-signal data acquisition) simultaneously, bothat the start and at the end of the recording.
D. Data composition
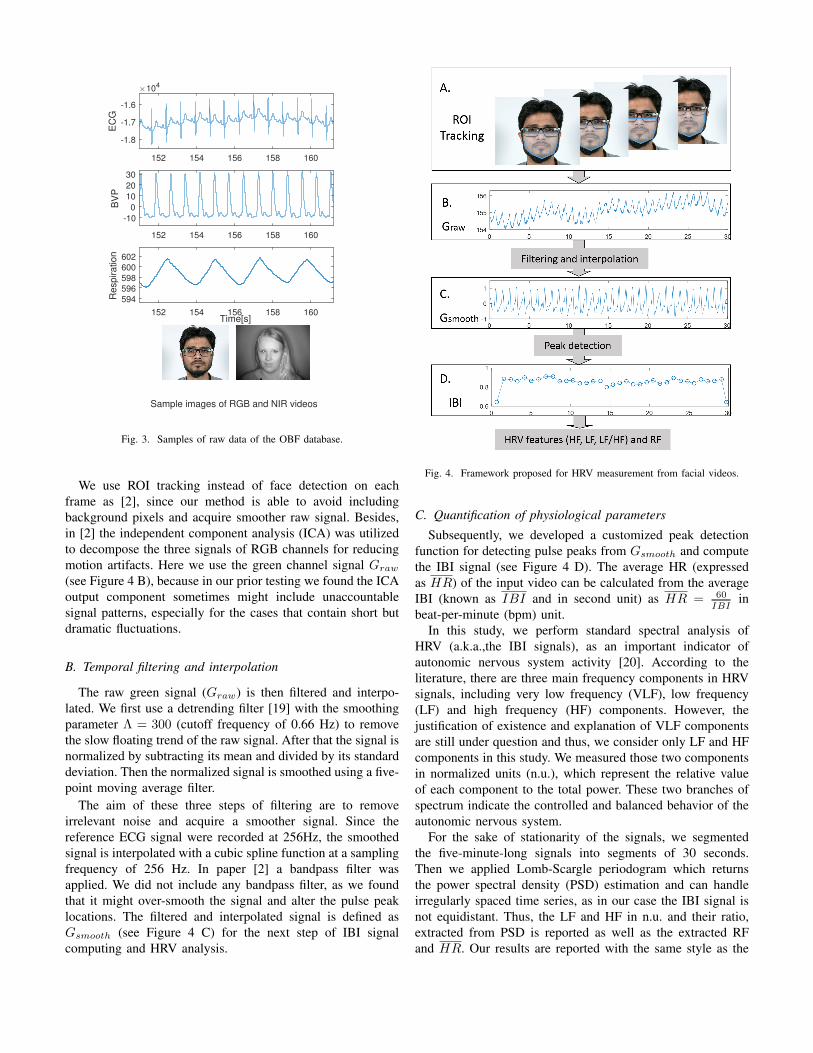
Table III lists the data included in the database. There aredata from 100 healthy participants and currently six AF pa-tients (ongoing collection). For each participant, multi-modaldata were recorded simultaneously for two sessions of fiveminutes. Sample data of each modality is shown in Figure 3.For healthy participants, session one is resting state and sessiontwo is post-exercise with elevated HR; for AF patients, sessionone is recorded before the cardioversion treatment (with AF)while session two is after the treatment (with recovered healthyheartbeat rhythm for most cases). The total data sum up to10600 minutes so far for each of the five modalities.
IV. METHOD
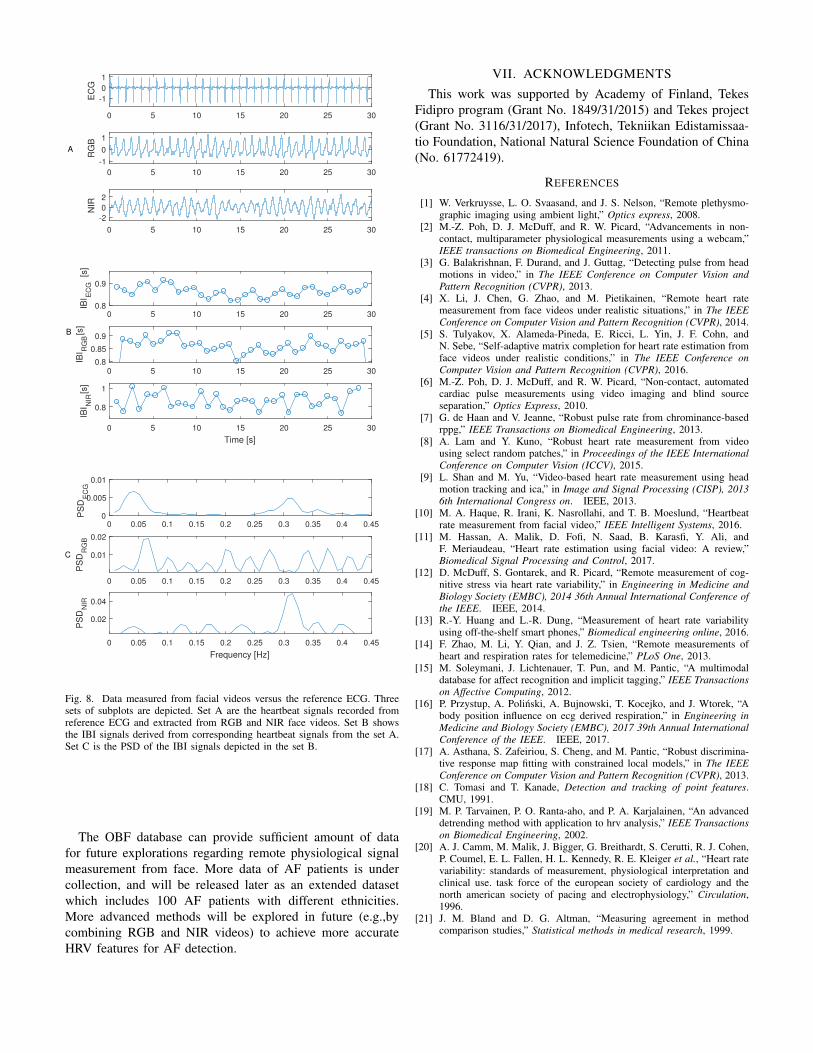
We propose a framework to measure average HR, HRVfeatures, and RF for AF detection. The main steps of theframework is shown in Figure 4. Our framework was inspiredby paper [2], while adjustments were made in several stepsthrough our prior testing and hence, the current frameworkachieves superior performance than the original method.
A. Facial ROI tracking
Given an input video of n frames, we use discriminativeresponse map fitting (DRMF) method [17] to detect the faceand locate 66 landmarks on the first frame. Then a customizedregion of interest (ROI) was defined by the facial contourlandmarks. The defined ROI was tracked through the videousing the Kanade-Lukas-Tomasi (KLT) algorithm [18] (seeFigure 4 A). The raw heartbeat signals (raw RGB signals)are calculated by averaging the pixel values within the ROI ofthe three color channels of each frame, as Rraw, Graw andBraw, which all are vectors of length n.
152 154 156 158 160
-1.8
-1.7
-1.6E
CG
104
152 154 156 158 160
-10
0
10
20
30
BV
P
152 154 156 158 160Time[s]
594
596
598
600
602
Re
sp
ira
tio
n
Sample images of RGB and NIR videos
Fig. 3. Samples of raw data of the OBF database.
We use ROI tracking instead of face detection on eachframe as [2], since our method is able to avoid includingbackground pixels and acquire smoother raw signal. Besides,in [2] the independent component analysis (ICA) was utilizedto decompose the three signals of RGB channels for reducingmotion artifacts. Here we use the green channel signal Graw
(see Figure 4 B), because in our prior testing we found the ICAoutput component sometimes might include unaccountablesignal patterns, especially for the cases that contain short butdramatic fluctuations.
B. Temporal filtering and interpolation
The raw green signal (Graw) is then filtered and interpo-lated. We first use a detrending filter [19] with the smoothingparameter Λ = 300 (cutoff frequency of 0.66 Hz) to removethe slow floating trend of the raw signal. After that the signal isnormalized by subtracting its mean and divided by its standarddeviation. Then the normalized signal is smoothed using a five-point moving average filter.
The aim of these three steps of filtering are to removeirrelevant noise and acquire a smoother signal. Since thereference ECG signal were recorded at 256Hz, the smoothedsignal is interpolated with a cubic spline function at a samplingfrequency of 256 Hz. In paper [2] a bandpass filter wasapplied. We did not include any bandpass filter, as we foundthat it might over-smooth the signal and alter the pulse peaklocations. The filtered and interpolated signal is defined asGsmooth (see Figure 4 C) for the next step of IBI signalcomputing and HRV analysis.
Fig. 4. Framework proposed for HRV measurement from facial videos.
C. Quantification of physiological parameters
Subsequently, we developed a customized peak detectionfunction for detecting pulse peaks from Gsmooth and computethe IBI signal (see Figure 4 D). The average HR (expressedas HR) of the input video can be calculated from the averageIBI (known as IBI and in second unit) as HR = 60
IBIin
beat-per-minute (bpm) unit.In this study, we perform standard spectral analysis of
HRV (a.k.a.,the IBI signals), as an important indicator ofautonomic nervous system activity [20]. According to theliterature, there are three main frequency components in HRVsignals, including very low frequency (VLF), low frequency(LF) and high frequency (HF) components. However, thejustification of existence and explanation of VLF componentsare still under question and thus, we consider only LF and HFcomponents in this study. We measured those two componentsin normalized units (n.u.), which represent the relative valueof each component to the total power. These two branches ofspectrum indicate the controlled and balanced behavior of theautonomic nervous system.
For the sake of stationarity of the signals, we segmentedthe five-minute-long signals into segments of 30 seconds.Then we applied Lomb-Scargle periodogram which returnsthe power spectral density (PSD) estimation and can handleirregularly spaced time series, as in our case the IBI signal isnot equidistant. Thus, the LF and HF in n.u. and their ratio,extracted from PSD is reported as well as the extracted RFand HR. Our results are reported with the same style as the
results reported in [2].However, for the AF detection, we use some of IBI standard
features [20], including• Time-domain: mean IBI, standard deviation of IBI, root
mean square of successive differences (RMSSD), squareroot of the sum of the squares of differences of individualvalues compared to the mean value, divided by thenumber of RRI in a period (RMSM) and percentageof samples with more than 50ms difference from theconsecutive beat (pNNI50),
• Geometrical-domain: Poincar plot standard deviations(SD1, SD2)
• Spectral-domain: LF, HF and their ratio in normalizedunit (n.u.).
V. EXPERIMENTS AND RESULTS
There are two parts of experimental results. First, weevaluate the accuracy of our framework on OBF database bycomparing physiological signals (HR, HRV features, and RR)measured from facial videos with reference ECG and BVPsignals. Second, we use the face-extracted HRV features toperform AF detection.
A. Physiological signals measured from facial videos
100 healthy participants data from OBF database are usedfor the evaluation of the proposed framework. All data arecut into 30 seconds long segments, in which each participantyields 20 segments of the data and there are entirely 2000units of sample data.
Using the proposed framework, we first compute HR ofeach segment and compare it with the corresponding referenceECG. BlandAltman plot [21] is used to evaluate the HR mea-sured from RGB videos as shown in Figure 5, and statisticalresults are listed in Table IV. It can be seen that by usingthe proposed method framework we can measure HR fromRGB videos with high accuracy on most of the cases, with theaverage error of −0.03± 2.16bpm. We also implemented theoriginal method proposed in [2] which includes the process ofICA and bandpass filtering, but the accuracy (average error =6.55±11.69 bpm) is significantly lower than our results for theHR measurement. One possible reason might be that the ICAis not very effective for some of the cases, as we mentionedin the method. In the following experiments, the IBI signalcomputing will completely be based on the heartbeats derivedin the current step, since our framework outperformed [2]’smethod by acquiring more accurate HR.
HR measured from NIR videos are shown in Figure 6, andstatistical results are listed in Table V. The results show thatheartbeat information can also be extracted from NIR facialvideos, but with poorer performance than those from RGBvideos. The average error is −1.66± 6.60bpm.
For HR measurement from RGB videos, there are a fewcases with large errors. One sample of those erroneous casesis illustrated in Figure 7. One possible reason of the large errorfor this case (and several other similar cases) is the darker skintone. Although on general the accuracy of HR measurement
50 60 70 80 90 100 110 120 130
HR from ECG as the reference. (bpm)
-50
-40
-30
-20
-10
0
10
20
30
40
50
HR
fro
m R
GB
vid
eos -
HR
fro
m E
CG
. (b
mp)
-0.03 [p = 0.54]
4.2 (+1.96SD)
-4.3 (-1.96SD)
Fig. 5. BlandAltman plot of the HR measured from RGB videos vs referenceECG. Data samples are divided into three groups according to the skin tone:group 1 (red) includes samples of lighter skin tone, group 2 (yellow) includessamples with middle-range skin tone, and group 3 (black) includes samplesof darker skin tone. Samples with large error are mostly from group 3.
60 80 100 120
HR from ECG as the reference. (bpm)
-50
-40
-30
-20
-10
0
10
20
30
40
50
HR
fro
m N
IR v
ideos -
HR
fro
m E
CG
. (b
mp)
11.3 (+1.96SD)
-14.6 (-1.96SD)
-1.66 [p =0.00]
Fig. 6. BlandAltman plot of the HR measured from NIR videos vs referenceECG. Data samples are divided into three groups the same way as Figure 5.
on NIR videos is lower comparing to RGB videos, one noteworth being pointed out is that, NIR videos might providesupplementary information for some challenging RGB casesof dark skin tone. As for the sample shown in Figure 7, theheartbeat signal extracted from NIR video is superior than thecorresponding RGB video, as NIR image is more robusterto skin tone. How to use the complimentary informationfrom RGB and NIR videos for remote physiological signalmeasurement is worthy of exploration in future, and the OBFdatabase provides a decent platform for this study.
We further computed IBI signals to extract HRV features(LF, HF and LF/HF). Figure 8 shows the video-measuredsignals and features and compared them with those of thereference ECG. The statistical results of remote HRV measure-ment from RGB videos are reported in Table IV, and thoseof NIR videos are reported in Table V. The RF is computedusing the peak location of the HF component from the PSD of
TABLE IVSUMMARY RESULTS ON OBF RGB VIDEOS USING THE PROPOSED
the IBI signal. According to the reported figures, the HR canbe measured at a higher accuracy, while basically the HRVfeatures are more challenging with larger error margin andmuch lower correlation efficiency R (mostly less than 0.5).
As mentioned in Section II, the primary focus of thecurrent paper is to introduce OBF database as a benchmarkdatabase to facilitate investigation of remote physiologicalsignal measurement. The proposed framework only includesbasic steps of HRV analysis, which could serve as a foundationfor future work. Results in Table IV and V are listed asbaseline results for later evaluation on OBF database. Moreadvanced methods will be explored in future for more reliablephysiological signal derivation, especially HRV features.
B. AF detection using video-extracted HRV features.
We also explore whether it is possible to use video-extractedHRV features for detecting AF cases against healthy ones. Thefive-minute resting-state recording of each healthy participant,and the five-minute prior-treatment recording of each AFpatient are utilized for a binary classification test. Data are alsodivided into segments of 30-second length. Entirely, there are60 AF segments (of six AF patients) and 1000 healthy controlsamples (of 100 healthy participants).
For the task of AF detection, we only considered thevariation of IBIs, derived from ECG and RGB videos. A set offeatures explained in IV-C are extracted first from the IBI dataof reference ECG, and then from the IBI data of RGB videos.Radial-basis function (RBF) kernel support vector machine(SVM) is used as the classifier and the kernel parameters areoptimized using MATLAB heuristic procedure optimization.About the testing protocol, we run 100 rounds of classificationtests and summarize the average accuracy. For each round, Werandomly select six (out of 100) healthy subjects as the controlgroup so that we have balanced samples of the two categories.The data is divided into two halves, each contains 30 healthysamples from three healthy subjects, and 30 AF samples fromthree patients. We first train on one half and test on the otherhalf, and then exchange for cross validation.
Fig. 7. One error sample. HR signal computed from RGB video is noisy dueto the dark skin tone; while HR signal computed from NIR is superior, asNIR video is less prone to skin color. The black curve is the reference ECG.
TABLE VITHE PERFORMANCE OF AF DETECTION USING ECG- AND RGB-DERIVED
IBI SIGNALS.
ACC SPECG-derived features 88.8% 89.1%
RGB-video-derived features 78.3% 78.8%
The accuracy (ACC = TP+TNTP+TN+FP+FN ) and specificity
(SP = TNTN+FP ) are used as the validation metrics. The
average ACC and SP of the 100 rounds classification arereported in Table VI for both ECG-derived features and video-derived features. We achieved accuracy of about 78.3% usingvideo-extracted HRV features for AF detection. ECG-derivedfeatures of course performed better, as ECG is the goldenstandard employed by doctors for AF diagnosis. Our resultsusing video-extracted features are quite promising, since this isthe first work that ever demonstrated using remotely measuredHRV features for AF detection. We are gathering more data ofAF patients, and more advanced methods will be explored infuture to reduce errors of video-extracted features and furtherimprove the AF detection performance.
VI. CONCLUSION
In this paper we introduce the OBF database, which includeslarge number of facial videos with corresponding referencephysiological signals as a benchmark database for validatingmethods on remote physiological signals measurement. OBFincludes data recorded from 100 healthy subjects and sixpatients diagnosed with AF, which is the most widespreadsustained cardiac arrhythmia in clinical settings. This newdatabase fills the gap between remote physiological signalanalysis and demonstration of the new technology for medicalapplications. Accuracy of HR, HRV and RF measured fromOBF videos are provided as the baseline results using aproposed framework method. We also demonstrated that thevideo-extracted HRV features can achieve promising perfor-mance for AF detection, which has never been studied before.
0 0.05 0.1 0.15 0.2 0.25 0.3 0.35 0.4 0.45
Frequency [Hz]
0.02
0.04
PS
DN
IR
0 5 10 15 20 25 30
-1
0
1
EC
G
0 5 10 15 20 25 300.8
0.9
IBI E
CG
[s]
0 0.05 0.1 0.15 0.2 0.25 0.3 0.35 0.4 0.450
0.005
0.01
PS
DE
CG
0 5 10 15 20 25 30
-1
0
1
RG
B
0 5 10 15 20 25 300.8
0.85
0.9
IBI R
GB
[s]
0 0.05 0.1 0.15 0.2 0.25 0.3 0.35 0.4 0.45
0.01
0.02
PS
DR
GB
0 5 10 15 20 25 30
-2
0
2
NIR
0 5 10 15 20 25 30
Time [s]
0.8
1
IBI N
IR[s
]
A
B
C
Fig. 8. Data measured from facial videos versus the reference ECG. Threesets of subplots are depicted. Set A are the heartbeat signals recorded fromreference ECG and extracted from RGB and NIR face videos. Set B showsthe IBI signals derived from corresponding heartbeat signals from the set A.Set C is the PSD of the IBI signals depicted in the set B.
The OBF database can provide sufficient amount of datafor future explorations regarding remote physiological signalmeasurement from face. More data of AF patients is undercollection, and will be released later as an extended datasetwhich includes 100 AF patients with different ethnicities.More advanced methods will be explored in future (e.g.,bycombining RGB and NIR videos) to achieve more accurateHRV features for AF detection.
VII. ACKNOWLEDGMENTS
This work was supported by Academy of Finland, TekesFidipro program (Grant No. 1849/31/2015) and Tekes project(Grant No. 3116/31/2017), Infotech, Tekniikan Edistamissaa-tio Foundation, National Natural Science Foundation of China(No. 61772419).
REFERENCES
[1] W. Verkruysse, L. O. Svaasand, and J. S. Nelson, “Remote plethysmo-graphic imaging using ambient light,” Optics express, 2008.
[2] M.-Z. Poh, D. J. McDuff, and R. W. Picard, “Advancements in non-contact, multiparameter physiological measurements using a webcam,”IEEE transactions on Biomedical Engineering, 2011.
[3] G. Balakrishnan, F. Durand, and J. Guttag, “Detecting pulse from headmotions in video,” in The IEEE Conference on Computer Vision andPattern Recognition (CVPR), 2013.
[4] X. Li, J. Chen, G. Zhao, and M. Pietikainen, “Remote heart ratemeasurement from face videos under realistic situations,” in The IEEEConference on Computer Vision and Pattern Recognition (CVPR), 2014.
[5] S. Tulyakov, X. Alameda-Pineda, E. Ricci, L. Yin, J. F. Cohn, andN. Sebe, “Self-adaptive matrix completion for heart rate estimation fromface videos under realistic conditions,” in The IEEE Conference onComputer Vision and Pattern Recognition (CVPR), 2016.
[6] M.-Z. Poh, D. J. McDuff, and R. W. Picard, “Non-contact, automatedcardiac pulse measurements using video imaging and blind sourceseparation,” Optics Express, 2010.
[7] G. de Haan and V. Jeanne, “Robust pulse rate from chrominance-basedrppg,” IEEE Transactions on Biomedical Engineering, 2013.
[8] A. Lam and Y. Kuno, “Robust heart rate measurement from videousing select random patches,” in Proceedings of the IEEE InternationalConference on Computer Vision (ICCV), 2015.
[9] L. Shan and M. Yu, “Video-based heart rate measurement using headmotion tracking and ica,” in Image and Signal Processing (CISP), 20136th International Congress on. IEEE, 2013.
[10] M. A. Haque, R. Irani, K. Nasrollahi, and T. B. Moeslund, “Heartbeatrate measurement from facial video,” IEEE Intelligent Systems, 2016.
[11] M. Hassan, A. Malik, D. Fofi, N. Saad, B. Karasfi, Y. Ali, andF. Meriaudeau, “Heart rate estimation using facial video: A review,”Biomedical Signal Processing and Control, 2017.
[12] D. McDuff, S. Gontarek, and R. Picard, “Remote measurement of cog-nitive stress via heart rate variability,” in Engineering in Medicine andBiology Society (EMBC), 2014 36th Annual International Conference ofthe IEEE. IEEE, 2014.
[13] R.-Y. Huang and L.-R. Dung, “Measurement of heart rate variabilityusing off-the-shelf smart phones,” Biomedical engineering online, 2016.
[14] F. Zhao, M. Li, Y. Qian, and J. Z. Tsien, “Remote measurements ofheart and respiration rates for telemedicine,” PLoS One, 2013.
[15] M. Soleymani, J. Lichtenauer, T. Pun, and M. Pantic, “A multimodaldatabase for affect recognition and implicit tagging,” IEEE Transactionson Affective Computing, 2012.
[16] P. Przystup, A. Polinski, A. Bujnowski, T. Kocejko, and J. Wtorek, “Abody position influence on ecg derived respiration,” in Engineering inMedicine and Biology Society (EMBC), 2017 39th Annual InternationalConference of the IEEE. IEEE, 2017.
[17] A. Asthana, S. Zafeiriou, S. Cheng, and M. Pantic, “Robust discrimina-tive response map fitting with constrained local models,” in The IEEEConference on Computer Vision and Pattern Recognition (CVPR), 2013.
[18] C. Tomasi and T. Kanade, Detection and tracking of point features.CMU, 1991.
[19] M. P. Tarvainen, P. O. Ranta-aho, and P. A. Karjalainen, “An advanceddetrending method with application to hrv analysis,” IEEE Transactionson Biomedical Engineering, 2002.
[20] A. J. Camm, M. Malik, J. Bigger, G. Breithardt, S. Cerutti, R. J. Cohen,P. Coumel, E. L. Fallen, H. L. Kennedy, R. E. Kleiger et al., “Heart ratevariability: standards of measurement, physiological interpretation andclinical use. task force of the european society of cardiology and thenorth american society of pacing and electrophysiology,” Circulation,1996.
[21] J. M. Bland and D. G. Altman, “Measuring agreement in methodcomparison studies,” Statistical methods in medical research, 1999.