Oil, Middle East, and the Global Economy USC April 2016 THE OIL MARKET, OPEC AND THE MIDDLE EAST: ECONOMICS AND POLITICS Manouchehr Takin* * International Oil & Energy Consultant E-mail: [email protected]. Tel: +44 (0) 7896 809 365 Takin 1
Transcript
Oil, Middle East, and the Global Economy USC April 2016
THE OIL MARKET, OPEC AND THE MIDDLE EAST: ECONOMICS AND
POLITICS
Manouchehr Takin*
* International Oil & Energy Consultant E-mail: [email protected]. Tel: +44 (0) 7896 809 365
Takin 1
2
OUTLINE OF PRESENTATION • OPEC & the Middle East – a global perspective
• A briefing on OPEC – past and present
• Oil price cycles
• Supply shortage led to oil price jump (2003-2008). Excess
supply led to oil price collapse (recent years)
• Current market situation – need for global diplomacy
• General discussions on OPEC
3
OPEC OIL RESERVES & PRODUCTION COMPARED WITH REST OF THE WORLD (2015)
0%
10%
20%
30%
40%
50%
60%
70%
80%
OPEC Rest of the World
Oil Production
Oil Reserves
Share of the world total
Source: Oil & Gas Journal
4
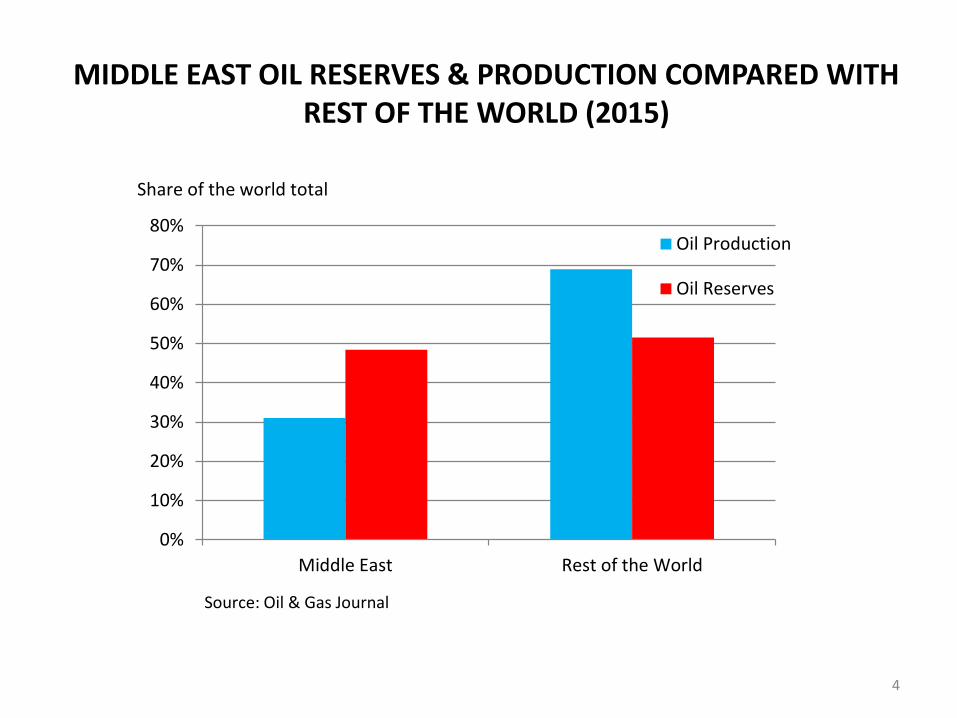
MIDDLE EAST OIL RESERVES & PRODUCTION COMPARED WITH REST OF THE WORLD (2015)
0%
10%
20%
30%
40%
50%
60%
70%
80%
Middle East Rest of the World
Oil Production
Oil Reserves
Share of the world total
Source: Oil & Gas Journal
5
• OPEC and the Middle East contribute respectively 40% and 31% to world oil production.
• Their production is low in proportion to the size of
their reserves (OPEC 73% and the M East 48.5% of world oil reserves).
RESERVES AND PRODUCTION POSITIONS OF OPEC AND THE MIDDLE EAST
6
Algeria1.0% Angola
0.7%
Libya4.0% Nigeria
3.1% Ecuador0.7%
Indonesia0.3%
Venezuela24.8%
Iran13.0%Iraq
11.8%
Kuwait 8.4%
Saudi Arabia22.0%
UAE8.1%
Qatar2.1%
Source: Oil & Gas Journal
CRUDE OIL RESERVES OF OPEC MEMBER COUNTRIES END 2015 Total 1,206 bn bbls
7
CRUDE OIL PRODUCTION OF OPEC MEMBER COUNTRIES 2015 Total 31.2 MMBPD
Algeria3.5%
Angola5.6%
Libya1.3%
Nigeria5.7% Ecuador
1.7%
Indonesia2.5%
Venezuela7.5%
Iran8.9%
Iraq12.1%
Kuwait 8.7%
Saudi Arabia31.7%
UAE9.0%
Qatar2.1%
Source: Oil & Gas Journal
8
• Saudi Arabia has about 1.5 mbpd spare production
capacity.
• The ‘rich’ countries (Saudi Arabia, the United Arab Emirates, Kuwait and Qatar) contributed 51.5% to total OPEC oil production in 2015.
• Thus the strong bargaining position of Saudi Arabia
and the other ‘rich’ countries within OPEC policy negotiations.
OIL PRODUCTION WITHIN OPEC
9
• OPEC was established in 1960 in response to the excesses of the oil concessionaires in the first half of 20th century.
• The Organization was expected to provide a stronger bargaining position in negotiating with the oil companies.
• A mission of OPEC: To coordinate and unify the petroleum policies of its Member Countries and ensure the stabilisation of oil markets in order to secure an efficient, economic and regular supply of petroleum to consumers, a steady income to producers and a fair return on capital for those investing in the petroleum industry.
ABOUT OPEC
10
• OPEC began to set the price of oil independently from the oil companies in 1974, but since the mid-1980s the price of oil has been left to the ‘global supply and demand’ and ‘market forces’.
• However, OPEC has tried to fine-tune its production in order to stabilise the oil market, avoid price fluctuations and defend the main source of the national income of its Member Countries.
• In general, OPEC policy actions have been reactive to the changing market conditions.
• OPEC has cut its production when price has fallen and has also increased its production when the price of oil has gone up.
MORE ON OPEC
11
• Is a function of market fundamentals and the (im)balance between the flow of oil into and out of the market.
• Economic growth soon leads to higher oil demand and vice versa in the case of economic slow-down and recession.
• Oil supply, however, is almost inelastic in the short-term. • When a field-development project is completed, oil
production commences irrespective of the market conditions at that time. Deep offshore fields, oil sands and other mega projects, take several years to go on stream.
THE PRICE OF OIL
12
• High price of oil provides revenue for the industry and an increase in upstream investments. The opposite happens when price is low.
• With a supply lead time of several years ‘market imbalance’ and oil price cycles are inevitable.
OIL PRICE CYCLES
13
• The price of oil rose from $20 to $147 between 2004 and
2008 because of • Supply Shortage
• The price fell to nearly $30 by end 2008-early 2009 - OPEC
cut its oil production and price improved, but since then: • Supply Excess
• Unexpected reversal of OPEC policy in November 2014 –
previous policy of cutting OPEC production and defending a high oil price was:
• Not Sustainable
THE MAIN CULPRIT: SUPPLY
WHY WAS THERE A SUPPLY SHORTAGE IN THE MID-2000S?
Takin 14
Price of oil had been $15-$25/bbl since 1980s. It collapsed to $10 in 1998
THE MAIN REASON FOR THE SUPPLY SHORTAGE
Takin 15
• Industry lost confidence in the oil price outlook and there was under-investment in world upstream from 1998 till about 2003.
• Price began to increase and companies started investing since 2004, but with the long lead-time of operations, supply could not meet growing world demand for oil, e.g. in China.
Takin
• Economic slowdown in 2008 resulted in a decrease and then slow growth in world oil demand. However, supply growth continued from ongoing projects coming on stream everywhere, in particular the US (shale & tight rocks).
• OPEC decreased its oil production to balance the market, price improved, but OPEC policy was not sustainable.
• Ministers (27 November 2014): OPEC will no more lower its oil production. The oil market weakened further.
SHORTAGE WAS REVERSED INTO EXCESS SUPPLY (Market imbalance continuing till today)
16
REVERSAL OF UNITED STATES CRUDE OIL PRODUCTION DECLINE (decrease since 1970 has reversed into increase since 2009)
Takin 17
0
2,000
4,000
6,000
8,000
10,000
12,000J
an
-19
20
Ja
n-1
930
Ja
n-1
940
Ja
n-1
950
Ja
n-1
960
Ja
n-1
970
Ja
n-1
980
Ja
n-1
990
Ja
n-2
000
Ja
n-2
010
Source: US Dept of Energy,
10,044: Nov 1970
7,376: March 1962
3,980: Sep 20084,737: Oct 20085,234: Feb 2009
Thousand barrels per day
9,694: April 2015
9,262: Dec 2015
REVERSAL OF UNITED STATES CRUDE OIL PRODUCTION DECLINE (decrease since 1970 has reversed into increase since 2009)
Takin 18
4,000
5,000
6,000
7,000
8,000
9,000
10,000Ja
n-2
000
Jan
-200
1
Jan
-200
2
Jan
-200
3
Jan
-200
4
Jan
-200
5
Jan
-200
6
Jan
-200
7
Jan
-200
8
Jan
-200
9
Jan
-201
0
Jan
-201
1
Jan
-201
2
Jan
-201
3
Jan
-201
4
Jan
-201
5
Source: US Dept of Energy,
3,980: Sep 20084,737: Oct 20085,234: Feb 2009
Thousand barrels per day
9,694: April 2015
9,262: December2015
9,078 Week to 4 March 2016
Takin 19
UNITED STATES WEEKLY CRUDE OIL PRODUCTION (January 2014 – 4 March 2016)
8.0
8.5
9.0
9.5
10.020
1401
03
2014
0314
2014
0523
2014
0801
2014
1010
2014
1219
2015
0227
2015
0508
2015
0717
2015
0925
2015
1204
2016
0212
Source: US Dept of Energy
Million barrels per day
Week to 4 March 2016: 9.078 mbpd
Takin
SOME CONSEQUENCES OF OIL PRICE COLLAPSE • Generally beneficial to the world economy.
• Serious budgetary constraint and economic/social crisis for all oil
exporting countries – OPEC and Non-OPEC.
• Examples of job losses: 250,000 jobs lost world energy industry (114,000 in the US) since mid-2014 to Jan 2016. 65,000 jobs lost in UK North Sea 2014-January 2016. 20,000 jobs lost (80,000 staff before price fall) in Halliburton. 20,000 (2015), 10,000 (2016) Schlumberger 20,000 2015, 10,000 6,000 (Technip July 2015) 6,500 (Shell July 2015) 42 US shale oil drillers became bankrupt in 2015 Sources: IEA, EIA, Oil & Gas Journal, Financial Times, BBC World News TV, City AM (London) and others
20
Takin
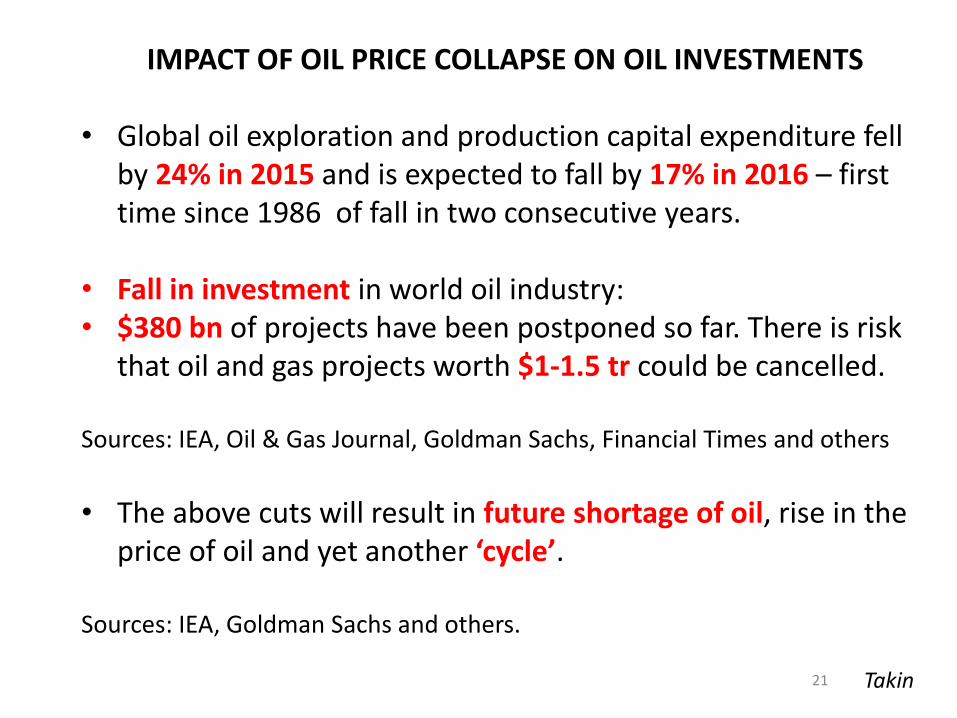
IMPACT OF OIL PRICE COLLAPSE ON OIL INVESTMENTS • Global oil exploration and production capital expenditure fell
by 24% in 2015 and is expected to fall by 17% in 2016 – first time since 1986 of fall in two consecutive years.
• Fall in investment in world oil industry: • $380 bn of projects have been postponed so far. There is risk
that oil and gas projects worth $1-1.5 tr could be cancelled. Sources: IEA, Oil & Gas Journal, Goldman Sachs, Financial Times and others
• The above cuts will result in future shortage of oil, rise in the
price of oil and yet another ‘cycle’. Sources: IEA, Goldman Sachs and others.
21
Takin
• The Kingdom is loosing $0.75 bn oil export revenue per day.
• Government sold $27 bn billion of bonds to cover its deficit in 2015.
• GDP growth 3.3% (2014), 3.1% (2015), 1.9% (2016). • Budget deficit $98 bn (2015), $87 bn (2016). • The Kingdom’s net foreign asset reserves $732 billion (end
2014) down to less than $600 billion (February 2016). • There is speculation on the value of Saudi Riyal.
• The military interventions in Yemen and Bahrain are further
draining the Kingdom’s resources. How much longer can Saudi Arabia sustain this oil policy?
IMF, AFP, Bloomberg, OILPRO, Financial Times, New York Times & other press
22
MORE ON SAUDI ARABIA
23
ANNUAL WORLD OIL SUPPLY-DEMAND DATA (mbpd)
2011 2012 2013 2014 2015 2016*
(a) Total world oil demand 88.1 89.1 90.4 91.4 93.0 94.2
(b) Total non-OPEC supply and OPEC NGLs 57.8 57.7 59.2 61.7 63.2 62.7
OPEC crude production 29.8 31.9 31 30.8 31.9 32.4**
OPEC production less 'need for OPEC oil' -0.5 0.5 -0.2 1.0 2.1 0.8
* Estimates
** Average January-February 2016
Source: OPEC
Takin
• Excess supply flow is continuing and oil storage spaces
around the world are almost full. At current production rates, stocks will keep building at 1.1 mbpd in 2016.
• In order to balance the market, oil supply should be reduced, but it will still take some time for the world oil inventories to fall to ‘normal’ operating levels.
• There is need for production cuts by OPEC and/or Non-OPEC – this requires international diplomacy.
Sources: IEA, Financial Times, OPEC and others.
24
THERE HAS BEEN EXCESS SUPPLY OF OIL FLOWING INTO THE WORLD MARKET SINCE 2014
DIPLOMACY IN 1986 & 1998 – in 2016?
Takin
• 1986: US Vice President George Bush visited Saudi Arabia and met the King.
• 1998: US Secretary of Energy Bill Richardson visited OPEC countries and openly lobbied the oil ministers.
• On both occasions leaders of OPEC member countries also became involved and met Saudi king. Finally OPEC decided to lower its production.
• 2015 and so far in 2016:
Pressure from within OPEC
Pressure from outside?
US POLITICIANS ARE NOT YET READY TO ACT
25
Takin
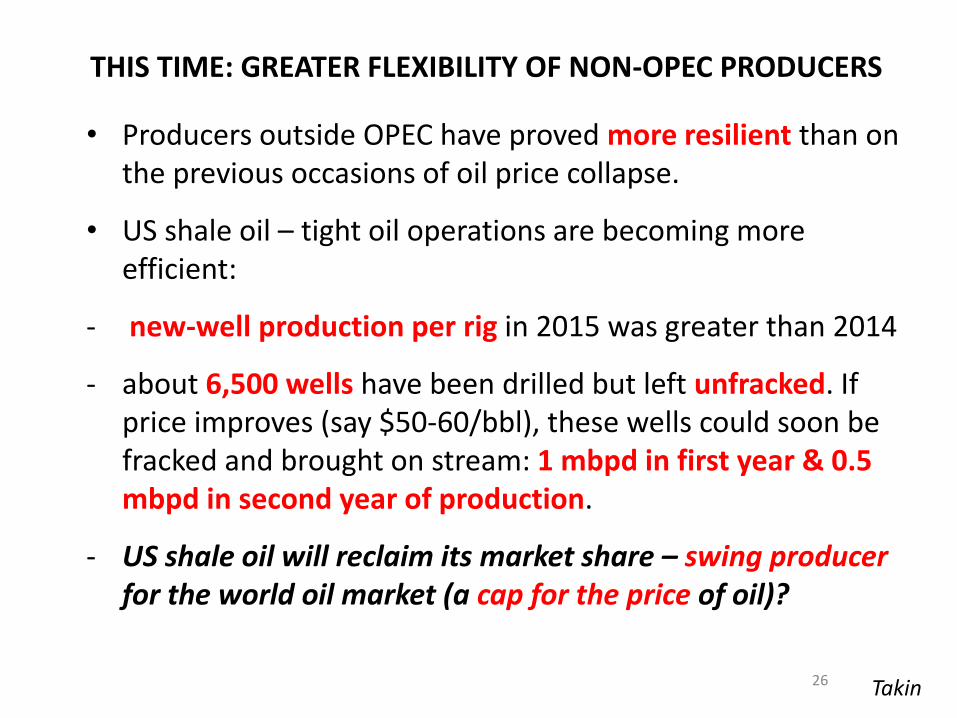
• Producers outside OPEC have proved more resilient than on the previous occasions of oil price collapse.
• US shale oil – tight oil operations are becoming more efficient:
- new-well production per rig in 2015 was greater than 2014
- about 6,500 wells have been drilled but left unfracked. If price improves (say $50-60/bbl), these wells could soon be fracked and brought on stream: 1 mbpd in first year & 0.5 mbpd in second year of production.
- US shale oil will reclaim its market share – swing producer for the world oil market (a cap for the price of oil)?
26
THIS TIME: GREATER FLEXIBILITY OF NON-OPEC PRODUCERS
27
• Are oil price cycles inevitable?
• Should oil be left to ‘market forces’?
• Should it be left to the oil majors to stabilise the market as
they did in the first half of 20th century and will the companies
be able to do so?
• Has OPEC changed? Has its mission changed?
• Is there still a role for OPEC or is it irrelevant?
• Will oil become like other commodities, needing volunteers in
the ‘West’ to campaign for ‘fair trade’ oil as they do for coffee,
banana, …….defending the farmers in the developing world?