34
THE OMSNIC ADVANTAGE 2009 ANNUAL REPORT

THE OMSNIC ADVANTAGE
2009 ANNUAL REPORT

Our MissionOMSNIC is designed to meet the professional liability
insurance needs of eligible members of the American
Association of Oral and Maxillofacial Surgeons.
OMSNIC makes a two-fold value commitment to its
policyholders to provide (1) comprehensive yet affordable
professional liability coverage and other valuable products
and services, and (2) the best possible return on the
preferred stock investment made by each policyholder.
THE OMSNIC ADVANTAGE...• Dedication to the Practicing OMS
• Consistent, Aggressive Claims Defense
• Financial Strength
• Risk Management Focus
• Emphasis on Service
• Commitment to OMS Control
THE OMSNIC ADVANTAGE

THE OMSNIC ADVANTAGE
1OMSNIC Annual Report 2009|
Table ofCONTENTS
Financial Highlights 2
Letter from the Chairman 4
OMSNIC Policyholders 6
OMSNIC Preferred Stock 7
OMSNIC Agents 8
OMSNIC Board of Directors, Executive Committee and Corporate Officers 10
Fortress Insurance Company 11
Independent Auditor’s Report 12
Consolidated Financial Statements 13
Notes to Consolidated Financial Statements 17

2
FINANCIALHIGHLIGHTS
As of December 31, 2009 2008Investments at fair value $ 282,052,704 $ 261,907,710Total assets 351,730,145 340,155,979Reserve for losses and loss adjustment expenses 167,731,255 172,992,944Unearned premiums 44,609,467 49,161,907Shareholders’ equity 121,136,975 101,376,031
For the year ended December 31, 2009 2008Net premiums earned $ 72,683,578 $ 75,163,973Investment income 11,161,832 10,439,963Net income 13,283,267 10,459,967
2
2 | OMSNIC Annual Report 2009
THE OMSNIC ADVANTAGE

3OMSNIC Annual Report 2009 | 3
CONSOLIDATED NET INCOME
(dollars in thousands)
(dollars in thousands)
(dollars in thousands)
$53,942
$57,695$60,965 $62,552 $60,619
2005 2006 2007 2008 2009
2005 2006 2007 2008 2009
$7,092 $6,198
$10,245 $10,460 $13,283
2005 2006 2007 2008 2009
$66,945$74,712
$90,774$101,376
$121,137
OMSNIC Annual Report 2009 |
OMSNIC DIRECT WRITTEN PREMIUMS
CONSOLIDATED SHAREHOLDERS’ EQUITY
THE OMSNIC ADVANTAGE

Letter from the Chairman
4 | OMSNIC Annual Report 2009
I am pleased to present to you the Company’s Annual Report for 2009.
There are many benefits to being an OMSNIC policyholder/shareholder. Whether it’s superior claims defense, risk management education that sets the industry standard or financial strength for the long-term, there is a distinct advantage to OMSs being insured by a company owned and operated by oral and maxillofacial surgeons.
We like to think of these many benefits, including those discussed below, as “The OMSNIC Advantage.”
OMSNIC and its subsidiary, Fortress Insurance Company (“Fortress”), accomplished much during 2009.
Included in this Annual Report are the consolidated financial statements. These statements reflect the continuing financial strength and operational success of the Company’s operations during 2009.
Financial highlights include:
•Consolidatedpremiumsearned were $88 million for 2009.
• Investmentincomeonaconsolidated basis, before realized gains, exceeded $11 million.
•Totalconsolidatedassetsare $352 million.
This financial strength is further evidenced by OMSNIC and Fortress having their “A (Excellent)” ratings reaffirmed by A.M. Best Company, the foremost independent rating agency for insurance companies.
As a shareholder, you participate in the Company’s successful operations through your preferred stock ownership. The Company’s profits directly increase the preferred stock share price.
As of April 1, 2010, the Company’s stock was valued at $825.77 per share, an increase of 20% from April 1, 2009.
The 2009 results were positively impacted by reductions in loss reserves required for claims made in prior years and by improved investment valuations after the 2008 financial fallout. OMSNIC had another successful year of claims management for its policyholders, despite an increasingly difficult litigation environment that saw the Company pay out on two high severity verdicts during 2009.
We continued to take a large number of claims to trial, with favorable results in over 90% of the verdicts.
In another example of how the Company protects OMSs, OMSNIC
Lewis N. Estabrooks, DMD, MS
Letter from the Chairman
THE OMSNIC ADVANTAGE

5OMSNIC Annual Report 2009 |
initiated additional coverage during 2009 for computer tomography imaging performed by an OMS for patients of other healthcare providers.
This new coverage was in response to a number of OMS practices utilizing imaging equipment to provide scans as a service to these other providers. While such scans done for their own patients were covered under a policyholder’s existing OMSNIC policy, this new service was not covered. Recognizing this gap, OMSNIC quickly developed this new coverage.
For years, a 5% premium credit was given for two policy periods if the policyholder took the Company’s risk management education program. Starting in 2009, the credit was extended to cover three policy periods.
This enhancement was made possible by OMSs increased use over the years of the practical risk management techniques OMSNIC provides in its risk management education programs.
Fortress achieved its goal of becoming licensed in all fifty states shortly after year-end. Being a national carrier will allow Fortress to continue its growth in the dental professional liability market.
At year-end 2009, Fortress provided professional liability insurance to over 14,000 dentists and dental specialists in 46 states. Dental professional liability premiums written exceeded $22 million during 2009.
Like many companies, OMSNIC continuously reviews its operations to ensure the Company delivers its services as effectively as possible. One benefit of OMSNIC’s ownership of Fortress is the ability to share certain fixed costs over a greater volume of policyholders. This past year has seen an increased emphasis on finding synergies between the two companies’ operations.
While some cost savings have already been realized, we expect the changes implemented in 2009 will continue to enhance both companies’ operations for many years to come.
Much work lies ahead of us. Uncertainties associated with the impact to our policyholders of recently passed health care legislation will require the Company to quickly adapt coverage to the changing practices of our insureds. The economic situation, while improved from this time one year ago, is still unsettled and may give rise to unforeseen issues that could affect the Company’s operations or its investments.
We are fortunate to have shareholders who are committed to the profession of oral and maxillofacial surgery working with OMSNIC to ensure we are successful in facing these challenges. On behalf of the Board of Directors and management, you have our ongoing pledge to diligently address the future professional liability issues of OMSs and continue to provide you with The OMSNIC Advantage.
Sincerely,
Lewis N. Estabrooks, DMD, MS Chairman, Board of Directors
THE OMSNIC ADVANTAGE

THE OMSNIC ADVANTAGE
6 | OMSNIC Annual Report 2009
OMSNICPolicyholders
3,183
3,665
3,9524,135
4,2744,395
4,5204,654 4,731
3,009

THE OMSNIC ADVANTAGE
7OMSNIC Annual Report 2009 |
$369.78 $400.85$426.26 $439.73
$451.42$482.07
$538.05
$612.75
$686.66
$825.77
OMSNICPreferred Stock
Each of the active policyholders of OMSNIC is also an owner of Preferred Stock in the Company. In fact, the Company’s insureds are the only Shareholders. Thus, each of the over 4,700 doctors in OMSNIC has a vested interest in the well-being of the Company.
As noted in the Company’s Articles of Incorporation, the Preferred Stock is redeemable only upon an insured’s leaving the Company due to a Death, Disability or Retirement event. In addition, the value of the preferred stock does not float in the manner of ordinary stocks, but rather is established once each year. The revised stock value is set each April 1st based upon the prior year’s financial results and in conjunction with the annual independent audit.
On April 1, 2010, the Company announced that the stock value had increased by 20% to a figure of $825.77 per share. Since the stock was first issued on September 1, 1992, the value has increased by an average of 12% per year. Of course, it should be noted that past performance is no indication of future results.
PREFERRED STOCK PRICE PER SHARE(As of April 1st of Each Year)

8 | OMSNIC Annual Report 2009
AlabamaPotter-Holden & Company, Inc.
900 Ashwood ParkwaySuite 100
Atlanta, GA 30338(888) 528-0589
Alaska
Direct through OMSNIC(800) 522-6670
ArizonaBell Insurance Group16980 Dallas Parkway
Dallas, TX 75248(800) 521-2355
Arkansas
Collier Insurance606 South Mendenhall Road
Memphis, TN 38117(800) 511-1548
ext. 2060
CaliforniaHamman-Miller-Beauchamp-
Deeble, Inc.3633 East Broadway
Long Beach, CA 90803-6099(800) 272-4594
ColoradoMile High Insurance
Agency, Inc.4251 Kipling Street
Suite 220Wheat Ridge, CO 80033
(303) 237-5445
ConnecticutMcDonough & Keegan Insurance Agency, Inc.
1210 Mill StreetEast Berlin, CT 06023
(800) 433-5994
DelawareKeller-Stonebraker
Insurance, Inc.3458 Ellicott Center Drive
Ellicott City, MD 21043-4196(410) 461-0700
District of ColumbiaKeller-Stonebraker
Insurance, Inc.3458 Ellicott Center Drive
Ellicott City, MD 21043-4196(410) 461-0700
FloridaGracey-Backer, Inc.
275 George Bush BoulevardDelray Beach, FL 33444
(800) 272-6055 ext. 118
GeorgiaPotter-Holden & Company, Inc.
900 Ashwood ParkwaySuite 100
Atlanta, GA 30338(888) 528-0589
HawaiiDirect through OMSNIC
(800) 522-6670
IdahoISDA Benefits, Inc.
P.O. Box 2558Eagle, ID 83616(888) 323-1636
Illinois(outside Cook County)
Behnke & Co., Inc.326 Susan Drive
Suite BNormal, IL 61781(800) 773-0335
Illinois(Cook County only)
Treloar & Heisel, Inc.11512 W. 183rd Street
Unit NWOrland Park, IL 60467
(708) 479-8100
IndianaThe Richard Small Agency, Inc.
30100 Telegraph RoadSuite 250
Bingham Farms, MI 48025(248) 646-2200
IowaThe Dana Company
12345 University Avenue Suite 300
Des Moines, IA 50325(515) 224-4391
KansasSunflower Insurance Group
P.O. Box 1213Salina, KS 67402-1213
(800) 563-1871
KentuckyVan Zandt, Emrich & Cary, Inc.
9710 Bunsen ParkwayLouisville, KY 40299
(800) 928-7355
LouisianaWright & Percy Insurance
4041 Essen Lane, Suite 400Baton Rouge, LA 70809
(800) 486-8283
MaineTD Insurance, Inc.
P.O. Box 406Portland, ME 04112
(800) 723-2877
MarylandKeller-Stonebraker
Insurance, Inc.3458 Ellicott Center Drive
Ellicott City, MD 21043-4196(410) 461-0700
MassachusettsIntegrated Insurance Solutions
85 Speen StreetSuite 300
Framingham, MA 01701 (508) 370-0002
MichiganThe Richard Small Agency, Inc.
30100 Telegraph RoadSuite 250
Bingham Farms, MI 48025(248) 646-2200
MinnesotaDyste Williams Agency, Inc.
6465 Wayzata BoulevardSuite 700
Minneapolis, MN 55426(800) 800-6360
MississippiWright & Percy Insurance
4041 Essen LaneSuite 400
Baton Rouge, LA 70809(800) 486-8283
MissouriBell Insurance Group16980 Dallas Parkway
Dallas, TX 75248(800) 521-2355
Missouri Sunflower Insurance Group
P.O. Box 1213Salina, KS 67402-1213
(800) 563-1871
OMSNICAGENTS
THE OMSNIC ADVANTAGE

9OMSNIC Annual Report 2009 |
MontanaDirect through OMSNIC
(800) 522-6670
NebraskaThe Dana Company
12345 University Avenue Suite 300
Des Moines, IA 50325(5I5) 224-4391
NevadaDirect through OMSNIC
(800) 522-6670
New HampshireIntegrated Insurance Solutions
85 Speen Street, Suite 300Framingham, MA 01701
(508) 370-0002
New JerseyMcDonough & Keegan Insurance Agency, Inc.
1210 Mill StreetEast Berlin, CT 06023
(800) 433-5994
New MexicoBell Insurance Group16980 Dallas Parkway
Dallas, TX 75248(800) 521-2355
New York(Lower State NY)
McDonough & Keegan Insurance Agency, Inc.
1210 Mill StreetEast Berlin, CT 06023
(800) 433-5994
New York(Upper State NY)
Jacob Hauck Agency, Inc.Hamburg Village Square
141 Buffalo StreetHamburg, NY 14075
(800) 348-0440
North CarolinaAsset Protection Group, Inc.10800 Midlothian Turnpike
Suite 220Richmond, VA 23235
(800) 644-9840
North DakotaDyste Williams Agency, Inc.
6465 Wayzata Blvd., Suite 700Minneapolis, MN 55426
(800) 800-6360
OhioThe Richard Small Agency, Inc.
30100 Telegraph RoadSuite 250
Bingham Farms, MI 48025(248) 646-2200
OklahomaAlexander & Strunk
10305 North May AvenueOklahoma City, OK 73120
(405) 751-8356
OregonDirect through OMSNIC
(800) 522-6670
PennsylvaniaDirect through OMSNIC
(800) 522-6670
Rhode IslandIntegrated Insurance Solutions
85 Speen StreetSuite 300
Framingham, MA 01701 (508) 370-0002
South CarolinaThe General Agency, Inc.
1527 Highway 7Charleston, SC 29407
(800) 922-5036
South DakotaDirect through OMSNIC
(800) 522-6670
TennesseeCollier Insurance
606 South Mendenhall RoadMemphis, TN 38117
(800) 511-1548
TexasBell Insurance Group16980 Dallas Parkway
Dallas, TX 75248(800) 521-2355
UtahMile High Insurance
Agency, Inc.4251 Kipling Street
Suite 220Wheat Ridge, CO 80033
(303) 237-5445
UtahProfessional Benefits
& InsurancePO Box 2556
Eagle, ID 83616(888) 323-1636
VermontDirect through OMSNIC
(800) 522-6670
VirginiaAsset Protection Group, Inc.10800 Midlothian Turnpike
Suite 220Richmond, VA 23235
(800) 644-9840
WashingtonPacific Underwriters Corporation12611 Des Moines Memorial Dr.
P.O. Box 68787Seattle, WA 98168
(206) 248-2254
West VirginiaKeller-Stonebraker
Insurance, Inc.3458 Ellicott Center Drive
Ellicott City, MD 21043-4196(410) 461-0700
WisconsinDyste Williams Agency, Inc.
6465 Wayzata BoulevardSuite 700
Minneapolis, MN 55426(800) 800-6360
WyomingMile High Insurance
Agency, Inc.4251 Kipling Street
Suite 220Wheat Ridge, CO 80033
(303) 237-5445
THE OMSNIC ADVANTAGE

10 | OMSNIC Annual Report 2009
THE OMSNIC ADVANTAGE
Corporate OfficersWilliam C. Passolt, CPA President and Chief Executive Officer
Patricia A. Pigoni Senior Vice President, Operations
Victoria J. Sterling, JD Senior Vice President and General Counsel
Katherine A. Ehmann, CPA Vice President, Finance
Debra K. Udey Vice President, Risk Management
Aike P. Zavala Vice President, HR
Gwendolyn J. Jaeger, RN Assistant Vice President, Claims
Peggy A. Klein Assistant Vice President, IT
Executive CommitteeLewis N. Estabrooks, DMD, MS
Steven M. Holmes, DDS
Jerry L. Jones, DDS, MD
James Q. Swift, DDS
Jeffrey S. Topf, DDS
OMS NATIONAL INSURANCE COMPANY, Risk Retention Group
Front Row: Victoria J. Sterling, JD; James Q. Swift, DDS; Patricia A. Pigoni;
Back Row: Steven M. Holmes, DDS; William C. Passolt, CPA; Lewis N. Estabrooks, DMD, MS; Jerry L. Jones, DDS, MD; Jeffrey S. Topf, DDS
Board Of DirectorsLewis N. Estabrooks, DMD, MS Chairman
Steven M. Holmes, DDS Secretary
Jerry L. Jones, DDS, MD
William C. Passolt, CPA President and Chief Executive Officer
Patricia A. Pigoni Senior Vice President, Operations
Victoria J. Sterling, JD Senior Vice President and General Counsel
James Q. Swift, DDS
Jeffrey S. Topf, DDSTreasurer
From Left: James Q. Swift, DDS; Steven M. Holmes, DDS; Lewis N. Estabrooks, DMD, MS; Jerry L. Jones, DDS, MD; Jeffrey S. Topf, DDS

11OMSNIC Annual Report 2009 |
FORTRESS INSURANCE COMPANY
Fortress is a wholly-owned subsidiary of OMSNIC. Put another way, Fortress represents an investment for OMSNIC. Fortress writes professional liability insurance for general dentists and dental specialists.
As of year-end 2009, Fortress insured 14,190 policyholders. Like OMSNIC, Fortress writes business nationally, with policyholders in 46 states.
The dental professional liability business is very competitive. Fortress has grown into one of the leading companies in this business. Total 2009 written premiums were $22.5 million.
Fortress enjoyed growth of 5.4% in policyholders and 6.4% in premiums during 2009. Business is written through a network of independent agents experienced in the dental professional liability market. Fortress’ reputation for outstanding service has assisted our agents in marketing the program.
Board of DirectorsFront Row: Edward J. Karlin, JD; Patricia A. Pigoni; Steven M. Lash, DDS. Back Row: William C. Passolt, CPA; Jeffrey S. Topf, DDS; Lewis N. Estabrooks, DMD, MS; Dennis W. Olson; Michael R. Ragan, DMD, JD, LLM.
$22,509$21,146
$19,936
$17,823
$15,953
2005 2006 2007 2008 2009
10,068
11,391
12,71313,459
14,190
FORTRESS DIRECT WRITTEN PREMIUMS(dollars in thousands)
FORTRESS POLICYHOLDERS
THE OMSNIC ADVANTAGE
20092008200720062005

Independent Auditor’s Report To the Board of Directors and Shareholders of OMS National Insurance Company, Risk Retention Group We have audited the accompanying consolidated balance sheets of OMS National Insurance Company, Risk Retention Group and subsidiary as of December 31, 2009 and 2008, and the related consolidated statements of income, changes in shareholders’ equity and cash flows for the years then ended. These consolidated financial statements are the responsibility of the Company’s management. Our responsibility is to express an opinion on these consolidated financial statements based on our audits. We conducted our audits in accordance with auditing standards generally accepted in the United States of America. Those standards require that we plan and perform the audit to obtain reasonable assurance about whether the financial statements are free of material misstatement. An audit includes consideration of internal control over financial reporting as a basis for designing audit procedures that are appropriate in the circumstances, but not for the purpose of expressing an opinion on the effectiveness of the Company’s internal control over financial reporting. Accordingly, we express no opinion. An audit also includes examining, on a test basis, evidence supporting the amounts and disclosures in the financial statements, assessing the accounting principles used and significant estimates made by management, as well as evaluating the overall financial statement presentation. We believe that our audits provide a reasonable basis for our opinion. In our opinion, the consolidated financial statements referred to above present fairly, in all material respects, the financial position of OMS National Insurance Company, Risk Retention Group and subsidiary as of December 31, 2009 and 2008, and the results of their operations and their cash flows for the years then ended in conformity with accounting principles generally accepted in the United States of America.
Springfield, Illinois April 16, 2010 McGladrey & Pullen LLP is a member firm of RSM International – an affiliation of separate and independent legal entities.
12 l OMSNIC Annual Report 2009

OMS National Insurance Company, Risk Retention Group
as of December 31, 2009 2008AssetsInvestment in available-for-sale securities, at fair value: Debt securities $249,887,617 $236,270,053 Equity securities 32,165,087 25,637,657
Total investments 282,052,704 261,907,710
Cash and cash equivalents 6,924,241 10,205,667 Accrued investment income 2,865,938 2,775,758 Premiums receivable 26,504,266 26,130,846 Deferred policy acquisition costs 5,932,878 6,163,540 Reinsurance recoverable 20,684,454 21,673,727 Deferred tax asset 4,921,361 9,117,016 Property and equipment, net 1,285,663 1,434,944 Other assets 558,640 746,771
Total assets $351,730,145 $340,155,979
LiabilitiesReserve for losses and loss adjustment expenses $167,731,255 $172,992,944Unearned premiums 44,609,467 49,161,907 Reinsurance premium payable 7,765,474 4,049,631 Accrued expenses and other liabilities 8,933,350 8,157,520 Income taxes payable 1,553,624 2,366,974 Payable for securities - 2,050,972
Total liabilities 230,593,170 238,779,948
Contingencies (Note 14)
Shareholders' EquityPreferred stock ($1.00 par value, authorized 1,000,000 shares, issued 997,901 shares) 997,901 997,901 Common stock ($1.00 par value, authorized 10,000 shares, issued 7,580 shares) 7,580 7,580 Additional paid-in capital 32,578,379 30,845,826 Retained earnings 86,659,835 73,376,568 Accumulated other comprehensive income, net of taxes of $4,718,889 in 2009 and $1,114,464 in 2008 8,763,651 2,069,718 Treasury stock, at cost (917 and 1,024 shares common stock and 851,885 and 853,663 shares preferred stock in 2009 and 2008, respectively) (7,870,371) (5,921,562)
Total shareholders' equity 121,136,975 101,376,031
Total liabilities and shareholders' equity $351,730,145 $340,155,979
The accompanying Notes to the Consolidated Financial Statements are an integral part of these statements.
Consolidated Financial StatementsConsolidated Balance Sheets
OMSNIC Annual Report 2009 l 13

OMS National Insurance Company, Risk Retention Group
for years ended December 31,
2009 2008Revenues Premiums earned $87,830,490 $81,311,181 Premiums ceded (15,146,912) (6,147,208)
Net premiums earned 72,683,578 75,163,973
Investment income 11,161,832 10,439,963 Net realized gains (losses) on securities 721,743 (11,136,741) Other income 394,237 336,806
Total revenues 84,961,390 74,804,001
Expenses Losses and loss adjustment expenses, net 46,971,458 41,161,940 Amortized policy acquisition expenses 11,402,934 10,283,234 Other underwriting expenses 8,473,538 9,567,858 Other expenses 367,008 354,900
Total expenses 67,214,938 61,367,932
Income before income taxes 17,746,452 13,436,069
Income tax expense 4,463,185 2,976,102
Net income $13,283,267 $10,459,967
The accompanying Notes to the Consolidated Financial Statements are an integral part of these statements.
Consolidated Income StatementsConsolidated Financial Statements
14 l OMSNIC Annual Report 2009

OMS National Insurance Company, Risk Retention Group
for years ended December 31, 2009 and 2008
Accumulated OtherComprehensive
Preferred Common Additional Retained Income (Loss), Treasury StockStock Stock Paid in Capital Earnings Net of Taxes Common Preferred Total
Balance, December 31, 2007 $997,901 $7,580 $29,167,537 $62,916,601 $2,262,452 ($1,168) ($4,576,437) $90,774,466
Net income - - - 10,459,967 - - - 10,459,967
Change in unrealized gains/losses, net of tax - - - - (192,734) - - (192,734)
Total comprehensive income (loss) - - - 10,459,967 (192,734) - - 10,267,233
Purchase of treasury stock - - - - - (103) (1,347,239) (1,347,342)
Sale of treasury stock - - 1,678,289 - - 247 3,138 1,681,674
Balance, December 31, 2008 $997,901 $7,580 $30,845,826 $73,376,568 $2,069,718 ($1,024) ($5,920,538) $101,376,031
Net income - - - 13,283,267 - - - 13,283,267
Change in unrealized gains/losses, net of tax - - - - 6,693,933 - - 6,693,933
Total comprehensive income - - - 13,283,267 6,693,933 - - 19,977,200
Purchase of treasury stock - - - - - (113) (1,953,877) (1,953,990)
Sale of treasury stock - - 1,732,553 - - 220 4,961 1,737,734
Balance, December 31, 2009 $997,901 $7,580 $32,578,379 $86,659,835 $8,763,651 ($917) ($7,869,454) $121,136,975
The accompanying Notes to the Consolidated Financial Statements are an integral part of these statements.
Consolidated Financial StatementsConsolidated Statements of Changes in Shareholders' Equity
OMSNIC Annual Report 2009 l 15

OMS National Insurance Company, Risk Retention Group
as of December 31,
2009 2008Cash Flows Provided by (Used in) Operating ActivitiesNet income $13,283,267 $10,459,967Adjustments to reconcile net income to net cash provided by (used in) operating activities
Net bond premium amortization 1,736,797 1,570,789 Depreciation and amortization 494,840 581,281 Amortization of deferred policy acquisition costs 11,402,934 10,283,234 Additions to deferred policy acquisition costs (11,172,272) (10,521,063) Realized (gains) losses on sales and calls of investments (721,743) 11,136,741
Deferred tax asset 591,230 (3,388,338) Increase/(decrease) in:
Accrued investment income (90,180) (189,411) Premiums receivable (373,420) (843,898) Reinsurance recoverable 989,273 (8,296,444)
Other assets 188,131 (106,321) Reserve for losses and loss adjustment expenses (5,261,689) 15,857,806 Unearned premiums (4,552,440) 2,387,546 Reinsurance premium payable 3,715,843 2,387,150 Accrued expenses and other liabilities 845,863 557,747
Income taxes payable (813,350) 3,589,418 Payable for securities (2,050,972) 2,050,972
Total adjustments (5,071,155) 27,057,209
Net cash provided by operating activities 8,212,112 37,517,176
Cash Flows Provided by (Used in) Investing ActivitiesProceeds from sales and calls of investments 49,225,485 54,297,153 Proceeds from maturity of investments 31,905,389 24,281,995 Purchase of investments (91,992,564) (112,049,379) Purchase of property and equipment (345,559) (858,843)
Net cash used in investing activities (11,207,249) (34,329,074)
Cash Flows Provided by (Used in) Financing Activities
Purchase of treasury stock (2,024,023) (1,336,107) Sale of treasury stock 1,737,734 1,681,674
Net cash (used in) provided by financing activities (286,289) 345,567 (Decrease) increase in cash and cash equivalents (3,281,426) 3,533,669 Cash and cash equivalents at beginning of year 10,205,667 6,671,998
Cash and cash equivalents at end of year $6,924,241 $10,205,667
The accompanying Notes to the Consolidated Financial Statements are an integral part of these statements.
Consolidated Financial StatementsConsolidated Statements of Cash Flows
16 l OMSNIC Annual Report 2009

OMS National Insurance Company, Risk Retention Group Notes to Consolidated Financial Statements December 31, 2009 and 2008
OMSNIC Annual Report 2009 l 17
1. Significant Accounting Policies a.) Basis of Presentation The accompanying consolidated financial statements include OMS National Insurance Company, Risk Retention Group
(“OMSNIC”) and its wholly owned subsidiary, Fortress Insurance Company (“Fortress”). Collectively they are referred to as “the Company” in these financial statements.
OMSNIC is a stock insurance and holding company, organized under the laws of the State of Illinois. OMSNIC operates
under the Federal Liability Risk Retention Act of 1986 and provides professional liability coverage on a national basis to members of the American Association of Oral and Maxillofacial Surgeons (“the Association”). Fortress is a stock insurance company organized under the laws of the State of Illinois. Fortress is licensed in 50 states and the District of Columbia and provides professional liability coverage to general dentals and dental specialists.
The Company primarily issues “claims-made” policies which insure against claims made during the policy period. A
claim is considered to be made when it is first reported to the Company or when specific circumstances are reported to the Company which the insured believes may give rise to a claim in the future. Fortress also issues “occurrence” policies which insure against claims arising from a wrongful act that took place during the period in which the policy was in force. For “occurrence” policies, the date on which the claim is actually made against the insured or reported to Fortress is irrelevant from the standpoint of triggering coverage. Rather, the terms and conditions of the policy that were in effect at the time the action giving rise to the claim actually took place will apply. This is in contrast to “claims-made” coverage, where the terms and conditions of the policy in force at the time the claim is made apply.
These financial statements are presented in conformity with accounting principles generally accepted in the United States
of America (“GAAP”). All material inter-company accounts and transactions have been eliminated in consolidation.
b.) Risks and Uncertainties Certain risks and uncertainties are inherent to the Company’s day-to-day operations and to the process of preparing its consolidated financial statements. The more significant of those risks and uncertainties are presented below and throughout the notes to the consolidated financial statements. Estimates - The preparation of the financial statements requires management to make estimates and assumptions that affect the reported amounts of assets and liabilities and disclosure of contingent assets and liabilities at the date of the financial statements and the reported amounts of revenue and expenses during the reporting period. Actual results could differ from these estimates. Loss Reserves – The Company estimates loss and loss adjustment expenses based on the accumulation of case estimates for direct claims reported, net of deductions of amounts for reinsurance ceded on reported claims and subsequent to consultation with the Company’s independent actuary. Actual results could differ from these estimates. Reinsurance – Reinsurance contracts do not relieve the Company from its obligations to its insureds. Failure of reinsurers to honor their obligations could result in losses to the Company; consequently, allowances are established for amounts deemed to be uncollectible, when necessary. The Company evaluates the financial condition of their reinsurers to minimize exposure to significant losses from reinsurer insolvencies. Management believes that any liability arising from this contingency would not be material to the Company’s financial position. External Factors – The Company is highly regulated by the state in which it is domiciled, as well as states in which they do business. Such regulations, among other things, limit the amount of dividends and impose restrictions on the amount and types of investments. Investments – The Company invests in a professionally managed portfolio that contains debt and equity securities of publicly-traded companies, US Government obligations, government agencies, state and local government obligations, mutual funds and money market funds. Such investments are exposed to various risks such as interest rate, market or credit. Due to the level of risk associated with such investments and the level of uncertainty related to changes in the value of such investments, it is at least reasonably possible that changes in risks in the near term would materially affect investment balances and the amounts reported in the consolidated financial statements.
OMS National Insurance Company, Risk Retention Group Notes to Consolidated Financial Statements December 31, 2009 and 2008
18 l OMSNIC Annual Report 2009
Risk-based Capital – The National Association of Insurance Commissioners (“NAIC”) has developed property-casualty risk-based capital (“RBC”) standards that relate an insurer’s reported statutory capital and surplus to the risks inherent in its overall operations. The RBC formula uses the statutory annual statement to calculate the minimum indicated capital level to protect the Company from the various risks that they face. The NAIC model law calls for various levels of regulatory action based on the magnitude of an indicated RBC capital deficiency, if any. The Company continues to monitor its internal capital requirements and the NAIC’s RBC requirements. The Company has determined that its capital levels are in excess of the minimum capital requirements for all RBC action levels. Management believes that the Company’s capital levels are sufficient to support the level of risk inherent in its operations.
c.) Concentrations of Geographic and Credit Risk The Company’s total direct gross written premium of $83,278,046 for the year ended December 31, 2009 included amounts written for insured parties in the States of New York (15.1%), Texas (10.0%), Florida (9.2%), California (5.2%), Pennsylvania (5.1%), and New Jersey (4.6%).
At December 31, 2009, approximately 28.8% and 17.4% of the Company’s consolidated investment portfolio is comprised of security issues in special revenues and political subdivisions, respectively, the vast majority of which are investment grade. This portfolio is widely diversified among various issuers and industries and is not dependent on the economic stability of one issuer and industry.
d.) Cash Equivalents Cash equivalents at December 31, 2009 and 2008 consist of short-term money market accounts and investments with an
original maturity of three months or less when purchased. The Company maintains cash balances that from time to time exceed the federally insured limits. The Company has not experienced any losses as a result of this concentration and believes it is not exposed to any significant credit risk on cash balances.
e.) Investments All debt and equity securities owned by the Company are considered available-for-sale and are included in the financial
statements at their fair value as of the statement date. See Note 2, Fair Value Measurements, for policies related to the determination of fair value. Realized gains and losses on securities sold during the year are determined using the specific identification method and included in investment income. Unrealized holding gains and losses, net of applicable income taxes, are included in accumulated other comprehensive income (loss).
Declines in fair value of invested assets below cost are evaluated to assess whether any other-than-temporary impairment loss should be recorded. In determining whether these losses are expected to be other-than-temporary, the Company considers severity of impairment, duration of impairment, forecasted recovery period, industry outlook, financial condition of the issuer, projected cash flows, issuer credit ratings and the intent and ability of the Company to hold the investment until the recovery of the cost.
When an other-than-temporary impairment loss is determined to have occurred on equity securities, the losses are
charged to realized losses in the income statement. The recognition method of other-than-temporary impairment losses on debt securities is dependent on the facts and circumstances related to the specific security. If the Company intends to sell a security or it is more likely than not that the Company would be required to sell a security prior to recovery of the amortized cost, the difference between amortized cost and fair value is recognized in the income statement as an other-than-temporary impairment. If the Company does not expect to recover the amortized cost basis, does not plan to sell the security and if it is not more likely than not that the Company would be required to sell a security before the recovery of its amortized cost, less any current period credit loss, the recognition of the other-than-temporary impairment is bifurcated. The Company recognizes the credit loss portion in the income statement and the noncredit loss portion in accumulated other comprehensive income (loss). The credit component of an other-than-temporary impairment is determined by comparing the net present value of projected cash flows with the amortized cost basis of the debt security. The net present value is calculated by discounting the Company’s best estimate of projected future cash flows at the effective interest rate implicit in the fixed income security at the date of acquisition. For mortgage-backed and asset-backed securities, cash flow estimates are based on assumptions regarding the underlying collateral including prepayment speeds, vintage, type of underlying asset, geographic concentrations, default rates, recoveries and changes in value. For all other debt securities, cash flow estimates are driven by assumptions regarding probability of default, including changes in credit ratings, and estimates regarding timing and amount of recoveries associated with a default. No other-than-temporary impairment write-downs were recognized in 2009 and therefore there was no computation
OMS National Insurance Company, Risk Retention Group Notes to Consolidated Financial Statements December 31, 2009 and 2008
OMSNIC Annual Report 2009 l 19
made to divide losses between credit and noncredit components. During 2008, the Company recorded other-than-temporary impairment write downs in the equity portfolio, resulting in a total realized loss of $7,450,238.
The Company has no investments in joint ventures, partnerships or limited liability companies.
The Company does not engage in any off-balance sheet, derivative or hedging activities. At year-end 2009, the Company has assessed their investment portfolio to determine subprime exposure. The Company
has determined they do not have any exposure for subprime mortgage related risks. OMSNIC owned $38,788,624 of agency-sponsored mortgage-backed securities. These holdings represented 19% of OMSNIC’s fixed-income portfolio. Fortress owned $8,648,181 and $2,119,374 of residential and commercial mortgage-backed securities, respectively. These holdings represented 25% of Fortress’ fixed-income portfolio. The individual mortgages which comprise these securities conform to strict underwriting standards, are considered AAA equivalents and carry an explicit agency guarantee as to repayment of principal and interest. In addition, with all bonds held in the portfolio, the Company monitors loans on an ongoing basis for delinquency and loss trends that could signal collateral deterioration.
f.) Premiums Premiums are deferred and earned on the daily pro rata basis over the terms of the respective policies. The standard term
of a policy is twelve months. Unearned premiums represent that portion of premiums written which is applicable to the unexpired terms of the policies in force as of the financial statement date or reserves established in anticipation of extended reporting endorsements available to eligible policyholders upon death, disability or retirement.
g.) Premiums Receivable The Company assesses the collectability of premiums receivable and the potential amount that may become
uncollectible. Premiums past due ninety days of the original due date are written off and coverage is cancelled. h.) Deferred Policy Acquisition Costs Certain costs of issuing and underwriting new and renewal business, which vary with and are directly related to the
production of such business, principally commissions, premium taxes and variable underwriting and policy issue expenses, have been deferred. Such costs are amortized as the related premium revenue is recognized. Policy acquisition costs of $11,172,272 and $10,521,063 were deferred in 2009 and 2008, respectively, and $11,402,934 and $10,283,234 were amortized in 2009 and 2008, respectively.
i.) Reinsurance The Company reinsures certain risks with other insurance organizations for the purpose of limiting their exposure to
losses on any single risk. In 2009 and 2008, OMSNIC retained the first $1,000,000 of each risk and reinsured amounts in excess of $1,000,000. In 2009 and 2008, Fortress retained the first $500,000 of each risk and reinsured amounts in excess of its retention. Although reinsurance agreements contractually obligate the Company’s reinsurers to reimburse the Company for the reinsurers’ share of losses, the reinsurance agreements do not discharge the primary liability of the Company for all claims.
Premiums ceded to reinsurers on these reinsurance contracts are based primarily on a percentage of premiums earned or
written on the underlying policies written by the Company. For certain contracts, the premiums ceded are subject to adjustment based on the actual losses incurred by reinsurers. Reinsurance recoveries due from reinsurers are reported as assets.
Accrued ceded premiums payable and amounts recoverable from reinsurers are based on actuarially developed estimates
of losses based upon past experience of the Company modified by certain industry data of ultimate developed costs, which may differ from case estimates. Changes in the assumptions used in making these estimates for such things as legal actions and changes in actual experience could cause these estimates to change in the near term. These estimates are reviewed by management and, as adjustments become necessary, such adjustments are reflected in results of operations in the period in which they are determined.
The Company evaluates the financial condition of its reinsurers to minimize its exposure to significant losses from
reinsurer insolvencies. The Company holds collateral as security under reinsurance agreements in the form of letters of credit for any reinsurers not subject to the regulation of the Illinois Department of Financial and Professional Regulation,

OMS National Insurance Company, Risk Retention Group Notes to Consolidated Financial Statements December 31, 2009 and 2008
20 l OMSNIC Annual Report 2009
Division of Insurance (“DOI”). In the opinion of management, all amounts due from reinsurers at December 31, 2009 and 2008 are considered recoverable.
In 2009 and 2008, cessions to Lloyd’s of London were 53% and 57%, respectively, of total reinsurance ceded.
j.) Income Taxes The Company files a consolidated federal income tax return as an insurance company subject to taxation under the Internal Revenue Code.
The Company accounts for deferred income taxes through an asset and liability approach. Income tax expense (benefit)
is the consequence, as measured by the provisions of enacted tax rates, of all events that have been recognized in the financial statements. The deferred tax liability or asset represents the amount of taxes payable or refundable in future years as a result of differences between the bases of assets and liabilities for financial reporting and tax purposes. Deferred tax assets are reduced, if necessary, by the amount of such benefits that are not expected to be realized based on available evidence.
The Company has not established a valuation reserve at December 31, 2009 and 2008, as they believe that all deferred
tax assets are fully realizable. The Company has a past history of profitability and anticipates future profitability. Income taxes paid during 2009 and 2008 were $5,675,000 and $2,721,595, respectively.
Effective January 1, 2009, the Company adopted the new accounting standard on accounting for uncertainty in income taxes which prescribes a recognition threshold and measurement process for financial statement recognition and measurement of a tax position taken or expected to be taken in a tax return, and also provides guidance on the derecognition of previously recorded benefits and their classification, as well as the proper recording of interest and penalties, accounting in interim periods, disclosures and transition. As of the January 1, 2009, date of adoption, and as of December 31, 2009, the Company had no unrecognized tax benefits and, accordingly, the standard did not have a significant impact on the Company’s consolidated financial statements. The Company does not anticipate that the amount of unrecognized tax benefits will significantly increase in the next 12 months. The Company’s policy is to recognize interest and penalties on unrecognized tax benefits as an element of income tax expense (benefit) in the consolidated statements of operations. The tax years which remain subject to examination by the taxing authorities are the years ended December 31, 2006, 2007, 2008 and 2009.
k.) Property and Equipment Equipment, furniture, leasehold improvements and internally developed software are recorded at cost less accumulated
depreciation or amortization. Equipment is depreciated on the straight-line method over three years. Furniture is depreciated on the straight-line method over five years and leasehold improvements are depreciated on the straight-line method over the remaining life of the lease. Internal and external costs incurred during the application development stage to develop internal-use computer software are capitalized and amortized on the straight-line method over three years. These costs include fees paid to third parties for services provided to develop the software and payroll-related costs incurred by employees directly associated with development.
Long-lived assets are evaluated for impairment whenever events or changes in circumstances indicate that the carrying
amount of such assets may not be recoverable. Long-lived assets evaluated for impairment are grouped with other assets to the lowest level for which identifiable cash flows are largely independent of the cash flows of other groups of assets and liabilities. If the sum of the projected undiscounted cash flows (excluding interest) is less than the carrying value of the assets, the assets will be written down to the estimated fair value in the period in which the determination is made. The estimated future cash flows are based upon, among other things, assumptions about expected future operating performance, and may differ from actual cash flows. Management has determined no impairment existed as of December 31, 2009 and 2008.

OMS National Insurance Company, Risk Retention Group Notes to Consolidated Financial Statements December 31, 2009 and 2008
OMSNIC Annual Report 2009 l 21
The following summarizes depreciable assets by class as of December 31, 2009 and 2008:
2009
Classification Basis
Accumulated Depreciation / Amortization
Depreciation / Amortization
ExpenseCarrying
BasisEquipment $1,309,124 $1,096,247 $146,546 $212,877Capitalized software 770,516 553,153 150,732 217,363 Internally developed software 2,618,036 2,350,587 61,792 267,449 Furniture 823,316 739,145 79,636 84,171 Leasehold improvements 880,324 376,521 56,134 503,803 Total $6,401,316 $5,115,653 $494,840 $1,285,663
2008
Classification Basis
Accumulated Depreciation / Amortization
Depreciation / Amortization
ExpenseCarrying
BasisEquipment $1,328,971 $1,082,716 $121,232 $246,255Capitalized software 736,600 424,037 112,342 312,563 Internally developed software 2,469,022 2,288,796 168,191 180,226 Furniture 823,316 659,510 119,299 163,806 Leasehold improvements 852,481 320,387 60,217 532,094 Total $6,210,390 $4,775,446 $581,281 $1,434,944
l.) Reserve for Losses and Loss Adjustment Expenses
The reserve for losses and loss adjustment expenses is based upon the accumulation of individual case estimates for reported losses, plus actuarially developed incurred but not reserved estimates, based upon past experience, modified by certain industry data of ultimate developed costs which may differ from case estimates. Changes in the assumptions used in making these estimates for such things as legal actions and changes in actual experience could cause these estimates to change in the near term. These estimates are reviewed by management and, as adjustments become necessary, such adjustments are reflected in results of operations in the period in which they are determined. In the opinion of the Company’s management, the reserve for losses and loss adjustment expenses is sufficient to meet the Company’s liability for future claims payments. However, since the reserve for losses and loss adjustment expenses is necessarily based upon estimates and derived, in part, from the Company’s historical experience, the ultimate settlement of these liabilities may be significantly greater or less than such estimates.
m.) Newly Adopted Accounting Pronouncements In June 2009, the Financial Accounting Standards Board (“FASB”) issued Statement No. 168, The FASB Accounting
Standards Codification and the Hierarchy of Generally Accepted Accounting Principles (“ASC”), which eliminated the current four levels of hierarchy of authoritative accounting and reporting guidance and provides one source for authoritative accounting and reporting recognized by FASB to be applied to nongovernmental entities. This statement is applicable to financial statements issued for interim and annual reporting periods ending after September 15, 2009 and, thus, was adopted by the Company effective December 31, 2009. This statement does not change existing GAAP and will have no effect on the Company’s consolidated financial condition, results of operations or cash flows.
In April 2009, the FASB issued new guidance which amends the other-than-temporary impairment guidance in U.S.
GAAP for debt securities to make the guidance more operational and to improve the presentation and disclosure of other-than-temporary impairments on debt and equity securities. This new guidance does not amend existing recognition and measurement guidance related to other-than-temporary impairments of equity securities. The Company did not hold any debt securities at the beginning of the period of adoption for which an other-than-temporary impairment had been previously recognized; therefore, no adjustment was made to retained earnings or to accumulated other comprehensive income (loss). The Company’s adoption of this guidance did not have a material impact on its consolidated financial position, results of operations or cash flows.

OMS National Insurance Company, Risk Retention Group Notes to Consolidated Financial Statements December 31, 2009 and 2008
22 l OMSNIC Annual Report 2009
In April 2009, the FASB issued additional guidance for estimating fair value when the volume and level of activity for the asset or liability have significantly decreased and includes guidance on identifying circumstances that indicate if a transaction is not orderly. The Company’s adoption of this guidance did not have a material impact on its consolidated financial position, results of operations or cash flows.
Effective January 1, 2009, the Company adopted the standard for using fair value to measure assets and liabilities for
nonfinancial assets and nonfinancial liabilities that are recognized or disclosed at fair value on a nonrecurring basis. The Company’s adoption of this standard did not have a material impact on its consolidated financial position, results of operations or cash flows.
In May 2009, FASB issued a pronouncement that establishes general standards for disclosure of events that occur after
the balance sheet date but before financial statements are issued or are available to be issued. The Company has adopted this standard as of December 31, 2009.
2. Fair Value Measurements
a.) Valuation Hierarchy Fair value is defined as the price that would be received to sell an asset or paid to transfer a liability in an orderly
transaction between market participants. GAAP requires the use of valuation techniques that are consistent with the market approach, the income approach and/or the cost approach. Inputs to valuation techniques refer to the assumptions that market participants would use in pricing the asset or liability. Inputs may be observable, meaning those that reflect the assumptions market participants would use in pricing the asset or liability developed based on market data obtained from independent sources, or unobservable, meaning those that reflect the reporting entity's own assumptions about the assumptions market participants would use in pricing the asset or liability developed based on the best information available in the circumstances. In that regard, a fair value hierarchy for valuation inputs is utilized that gives the highest priority to quoted prices in active markets for identical assets or liabilities and the lowest priority to unobservable inputs. The fair value hierarchy is as follows:
Level 1: Quoted prices (unadjusted) for identical assets or liabilities in active markets that the entity has the ability to
access as of the measurement date. The Company’s level 1 financial instruments primarily include actively traded equity securities and U.S. Treasury bonds.
Level 2: Significant other observable inputs other than level 1 prices such as quoted prices for similar assets or liabilities
in active markets or other inputs that are observable or can be corroborated by observable market data. The Company’s level 2 financial instruments primarily include fixed-income securities and other investments for which public quotations are not available but that are priced by third-party pricing services or internal models using observable inputs. The Company’s level 2 financial instruments primarily include certain government securities such as agency bonds, investment-grade corporate bonds and municipal obligations.
Level 3: Significant unobservable inputs that reflect a reporting entity’s own assumptions about the assumptions that
market participants would use in pricing an asset or liability. The Company holds no level 3 financial instruments. b.) Determination of Fair Value The following methods and assumptions were used to estimate the fair value of each class of financial instruments for
which it is practicable to estimate that value: Cash and cash equivalents: The carrying amount approximates fair value because of the short maturity of those
investments.
Equity securities: The fair values are determined using public quotations, when available. For equity securities that are not actively traded, estimated fair values are based on values of comparable issues.
Fixed securities: The fair values of fixed-income securities that are actively traded in the secondary market have been determined through the use of third-party pricing services using market observable inputs. Fixed-income securities where the Company does not receive a public quotation are valued based on values of comparable issues. Market rates used are applicable to the yield, credit quality and average maturity of each security.

OMS National Insurance Company, Risk Retention Group Notes to Consolidated Financial Statements December 31, 2009 and 2008
OMSNIC Annual Report 2009 l 23
The following summarizes financial instruments measured at fair value on a recurring basis as of December 31, 2009 and 2008, segregated by the level of the valuation inputs within the fair value hierarchy utilized to measure fair value.
2009 Level 1 Level 2 Level 3 Total Fair ValueFixed securities $2,292,267 $247,595,350 $ - $249,887,617Common stock 27,253,968 3,477,231 - 30,731,199Preferred stock - 1,433,888 - 1,433,888Cash and cash equivalents 6,924,241 - - 6,924,241 Total $36,470,476 $252,506,469 $ - $288,976,945
Fair Value Hierarchy Level
2008 Level 1 Level 2 Level 3 Total Fair ValueFixed securities $2,312,528 $233,957,525 $ - $236,270,053Common stock 22,010,982 2,176,020 - 24,187,002Preferred stock - 1,450,655 - 1,450,655Cash and cash equivalents 8,705,667 1,500,000 - 10,205,667 Total $33,029,177 $239,084,200 $ - $272,113,377
Fair Value Hierarchy Level
3. Investments The amortized cost, gross unrealized holding gains and losses and fair value of investments held at December 31, 2009
and 2008, are as follows:
Amortized Fair2009 Cost Gains Losses ValueDebt securities:
U.S. Treasury securities and obligationsof U.S. Government corporationsand agencies $7,757,510 $273,876 $14,804 $8,016,582
States, territories, and possessions 34,241,011 1,184,246 155,076 35,270,181 Political subdivisions of states, territories
and possessions 48,276,409 2,022,233 102,130 50,196,512Special revenue and assessments 80,410,335 3,164,387 427,669 83,147,053Industrial and miscellaneous 23,349,989 523,846 172,725 23,701,110Commercial - mortgage-backed /
asset-backed securities 2,146,257 2,743 29,626 2,119,374Residential - mortgage-backed /
asset-backed securities 45,809,286 1,695,203 67,684 47,436,805Equity securities 26,579,367 5,637,843 52,123 32,165,087
Total $268,570,164 $14,504,377 $1,021,837 $282,052,704
Gross Unrealized Holding

OMS National Insurance Company, Risk Retention Group Notes to Consolidated Financial Statements December 31, 2009 and 2008
24 l OMSNIC Annual Report 2009
Amortized Fair2008 Cost Gains Losses ValueDebt securities:
U.S. Treasury securities and obligationsof U.S. Government corporationsand agencies $10,445,856 $457,653 $ - $10,903,509
States, territories, and possessions 29,182,911 471,736 3,889 29,650,758 Political subdivisions of states, territories
and possessions 48,400,148 874,475 205,785 49,068,838Special revenue and assessments 89,119,369 1,576,326 584,700 90,110,995Industrial and miscellaneous 11,309,106 93,418 581,058 10,821,466Public utility 526,229 - 16,859 509,370Commercial - mortgage-backed /
asset-backed securities 5,174,147 - 491,227 4,682,920Residential - mortgage-backed /
asset-backed securities 39,101,075 1,421,122 - 40,522,197Equity securities 25,464,686 300,956 127,985 25,637,657
Total $258,723,527 $5,195,686 $2,011,503 $261,907,710
Gross Unrealized Holding
The amortized cost and fair value of debt securities held at December 31, 2009, by contractual maturity, are shown
below. Expected maturities may differ from contractual maturities because borrowers may have the right to call or prepay obligations with or without call or prepayment penalties:
2009Amortized
CostFair
ValueOne year or less $11,524,236 $11,652,468One year through five years 75,757,795 78,637,557 Five years through ten years 104,049,918 106,827,667 Ten years through twenty years 982,126 952,060 After twenty years 3,867,436 4,381,060 Mortgage-backed securities 45,809,286 47,436,805 Total $241,990,797 $249,887,617
The Company’s subsidiary, Fortress, has $4,819,791 of securities on deposit with insurance departments. The following summarizes the proceeds from sales of investments, excluding calls and maturities, and the gross realized
gains and losses on those sales for 2009 and 2008:
2009 2008 Proceeds from sales $41,193,513 $40,589,154 Gross realized gains 926,160 729,483 Gross realized losses 209,976 4,415,986
OMS National Insurance Company, Risk Retention Group Notes to Consolidated Financial Statements December 31, 2009 and 2008
OMSNIC Annual Report 2009 l 25
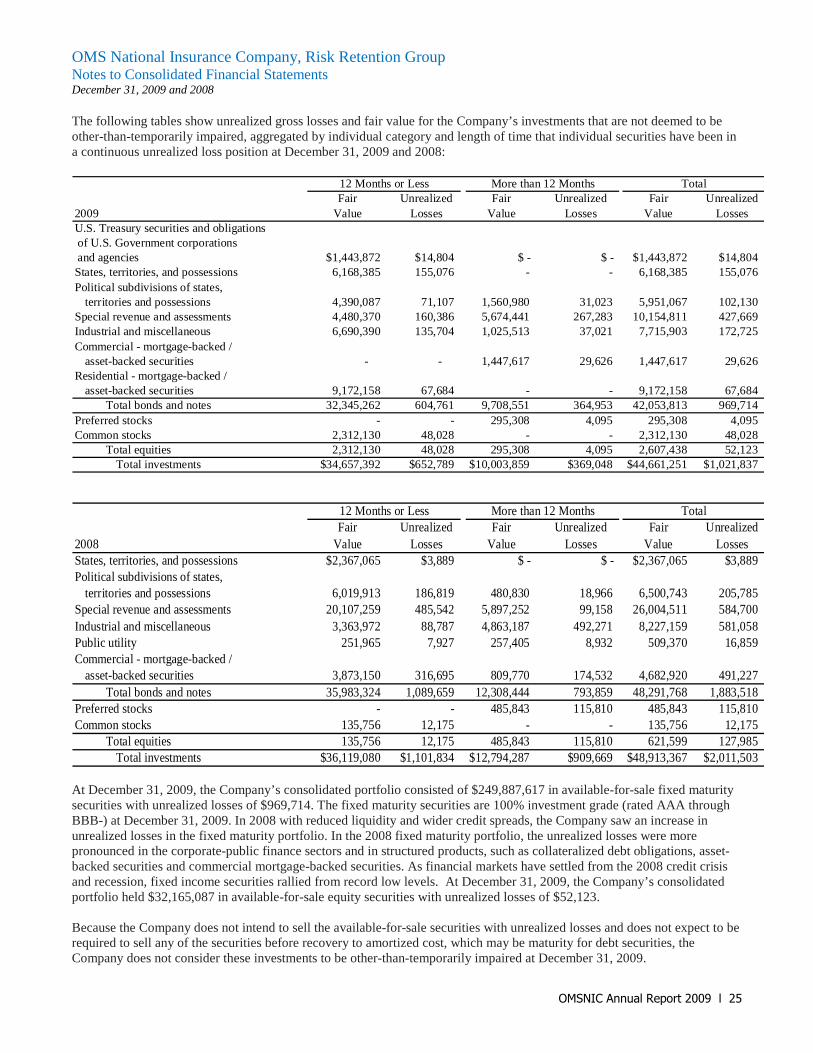
The following tables show unrealized gross losses and fair value for the Company’s investments that are not deemed to be other-than-temporarily impaired, aggregated by individual category and length of time that individual securities have been in a continuous unrealized loss position at December 31, 2009 and 2008:
Fair Unrealized Fair Unrealized Fair Unrealized2009 Value Losses Value Losses Value LossesU.S. Treasury securities and obligations of U.S. Government corporations and agencies $1,443,872 $14,804 $ - $ - $1,443,872 $14,804States, territories, and possessions 6,168,385 155,076 - - 6,168,385 155,076 Political subdivisions of states,
territories and possessions 4,390,087 71,107 1,560,980 31,023 5,951,067 102,130 Special revenue and assessments 4,480,370 160,386 5,674,441 267,283 10,154,811 427,669 Industrial and miscellaneous 6,690,390 135,704 1,025,513 37,021 7,715,903 172,725 Commercial - mortgage-backed /
asset-backed securities - - 1,447,617 29,626 1,447,617 29,626 Residential - mortgage-backed /
asset-backed securities 9,172,158 67,684 - - 9,172,158 67,684 Total bonds and notes 32,345,262 604,761 9,708,551 364,953 42,053,813 969,714
Preferred stocks - - 295,308 4,095 295,308 4,095Common stocks 2,312,130 48,028 - - 2,312,130 48,028
Total equities 2,312,130 48,028 295,308 4,095 2,607,438 52,123Total investments $34,657,392 $652,789 $10,003,859 $369,048 $44,661,251 $1,021,837
Total12 Months or Less More than 12 Months
Fair Unrealized Fair Unrealized Fair Unrealized2008 Value Losses Value Losses Value LossesStates, territories, and possessions $2,367,065 $3,889 $ - $ - $2,367,065 $3,889Political subdivisions of states,
territories and possessions 6,019,913 186,819 480,830 18,966 6,500,743 205,785 Special revenue and assessments 20,107,259 485,542 5,897,252 99,158 26,004,511 584,700 Industrial and miscellaneous 3,363,972 88,787 4,863,187 492,271 8,227,159 581,058 Public utility 251,965 7,927 257,405 8,932 509,370 16,859 Commercial - mortgage-backed /
asset-backed securities 3,873,150 316,695 809,770 174,532 4,682,920 491,227 Total bonds and notes 35,983,324 1,089,659 12,308,444 793,859 48,291,768 1,883,518
Preferred stocks - - 485,843 115,810 485,843 115,810 Common stocks 135,756 12,175 - - 135,756 12,175
Total equities 135,756 12,175 485,843 115,810 621,599 127,985 Total investments $36,119,080 $1,101,834 $12,794,287 $909,669 $48,913,367 $2,011,503
Total12 Months or Less More than 12 Months
At December 31, 2009, the Company’s consolidated portfolio consisted of $249,887,617 in available-for-sale fixed maturity securities with unrealized losses of $969,714. The fixed maturity securities are 100% investment grade (rated AAA through BBB-) at December 31, 2009. In 2008 with reduced liquidity and wider credit spreads, the Company saw an increase in unrealized losses in the fixed maturity portfolio. In the 2008 fixed maturity portfolio, the unrealized losses were more pronounced in the corporate-public finance sectors and in structured products, such as collateralized debt obligations, asset-backed securities and commercial mortgage-backed securities. As financial markets have settled from the 2008 credit crisis and recession, fixed income securities rallied from record low levels. At December 31, 2009, the Company’s consolidated portfolio held $32,165,087 in available-for-sale equity securities with unrealized losses of $52,123. Because the Company does not intend to sell the available-for-sale securities with unrealized losses and does not expect to be required to sell any of the securities before recovery to amortized cost, which may be maturity for debt securities, the Company does not consider these investments to be other-than-temporarily impaired at December 31, 2009.

OMS National Insurance Company, Risk Retention Group Notes to Consolidated Financial Statements December 31, 2009 and 2008
26 l OMSNIC Annual Report 2009
Investment income is as follows for 2009 and 2008, respectively:
2009 2008
Bonds and notes interest $10,525,968 $9,498,278
Cash and cash equivalents interest 30,580 55,782
Equities dividends 605,284 885,903
Total securities interest and dividends 11,161,832 10,439,963
4. Reinsurance The effect of reinsurance on premiums written and earned for 2009 and 2008 are as follows:
Written Earned Written EarnedGross $83,278,046 $87,830,490 $83,698,728 $81,311,181Ceded (15,153,214) (15,146,912) (6,165,846) (6,147,208)
Net $68,124,832 $72,683,578 $77,532,882 $75,163,973
2009 2008
5. Reserve for Losses and Loss Adjustment Expenses Activity in the reserve for losses and loss adjustment expenses is summarized as follows:
2009 2008Balance at January 1 $172,992,944 $157,135,138
19,764,648 11,387,619
Net balance at January 1 153,228,296 145,747,519Incurred related to - Current year 57,799,760 57,024,811 Prior years (10,828,302) (15,862,871) Total incurred 46,971,458 41,161,940 Paid related to -
Current year 3,571,846 3,504,064 Prior years 49,241,754 30,177,099 Total paid 52,813,600 33,681,163 Net balance at December 31 147,386,154 153,228,296
20,345,101 19,764,648
Balance at December 31 $167,731,255 $172,992,944
Less - Reinsurance recoverable net of unearned ceded premiums and other amounts receivable under reinsurance contracts of $1,909,079 and $1,989,664 at January 1, 2009 and 2008, respectively
Plus - Reinsurance recoverable net of unearned ceded premiums and other amounts receivable under reinsurance contracts of $339,353 and $1,909,079 at December 31, 2009 and 2008, respectively
In 2009 and 2008, the Company’s estimated cost of loss and loss adjustment expenses attributable to insured events of prior years decreased by a net $10,828,302 and $15,862,871, respectively. Direct loss and loss adjustment expense reserves were decreased in 2009 and 2008 due to recent loss development trends resulting in lower estimated ultimate loss and loss adjustment expenses relating to the Company’s claims-made policies impacting both the current accident year and prior accident years.

OMS National Insurance Company, Risk Retention Group Notes to Consolidated Financial Statements December 31, 2009 and 2008
OMSNIC Annual Report 2009 l 27
Increases or decreases of this nature occur as a result of claim settlements during the current year, and as additional information is received regarding unpaid individual claims. Recent loss development trends are also taken into account in evaluating the overall adequacy of unpaid losses and loss adjustment expenses.
6. Borrowed Money
As of December 31, 2009, the Company has no borrowed money outstanding. As of December 31, 2009, the Company has $2,600,000 lines of credit with JPMorgan Chase. There were no outstanding balances under the lines of credit during 2009. The interest rate on borrowings under the lines of credit will be at the borrower’s option of the LIBOR rate plus 2.0% or the Commercial Bank Floating rate. The Commercial Bank Floating rate is the higher of Prime rate or the One Month LIBOR rate plus 2.5%. At December 31, 2009, the following rates were:
· Prime Rate – 3.25% · LIBOR plus 2% - 2.23% · LIBOR plus 2.5% - 2.73%
The lines of credit expire on December 31, 2010. The Company is required to maintain a collateral security deposit for the lines of credit. OMSNIC’s market value of assets in such security deposits are 116% of its line of credit. Fortress’ market value of assets in such security deposits are 137% of its line of credit. The Company has investment securities with a market value of $3,143,447 held in security deposits at December 31, 2009.
7. Lease Commitments The Company has certain operating lease arrangements for office space which expire January 31, 2019. The Company
may terminate the lease effective December 31, 2012 with payment of a termination fee. Total rent expense under such arrangements was $739,499 in 2009 and $839,908 in 2008. The future minimum rental payments (before taxes and expenses) required under other operating leases as of December 31, 2009 that have initial or remaining non-cancelable lease terms are:
Year Amount 2010 $448,922 2011 432,544 2012 416,224 2013 428,145 2014 440,065
Thereafter 1,920,194 Total minimum payments required $4,086,094
The Company leases an automobile under a non-cancelable lease that expires on November 25, 2010. Rental expense for 2009 and 2008 was $7,021 for each year. Future minimum rental payments total $5,850 for 2010.
The Company leases various office equipment under non-cancelable leases that expire through September 2013. Rental
expenses for 2009 and 2008 were $44,985 and $44,526, respectively. Future minimum rental payments are as follows:
Year Amount 2010 $45,835 2011 41,186 2012 17,040 2013 8,520
Total minimum payments required $112,581 Certain office equipment rental commitments have renewal options extending through the year 2013.
OMS National Insurance Company, Risk Retention Group Notes to Consolidated Financial Statements December 31, 2009 and 2008
28 l OMSNIC Annual Report 2009
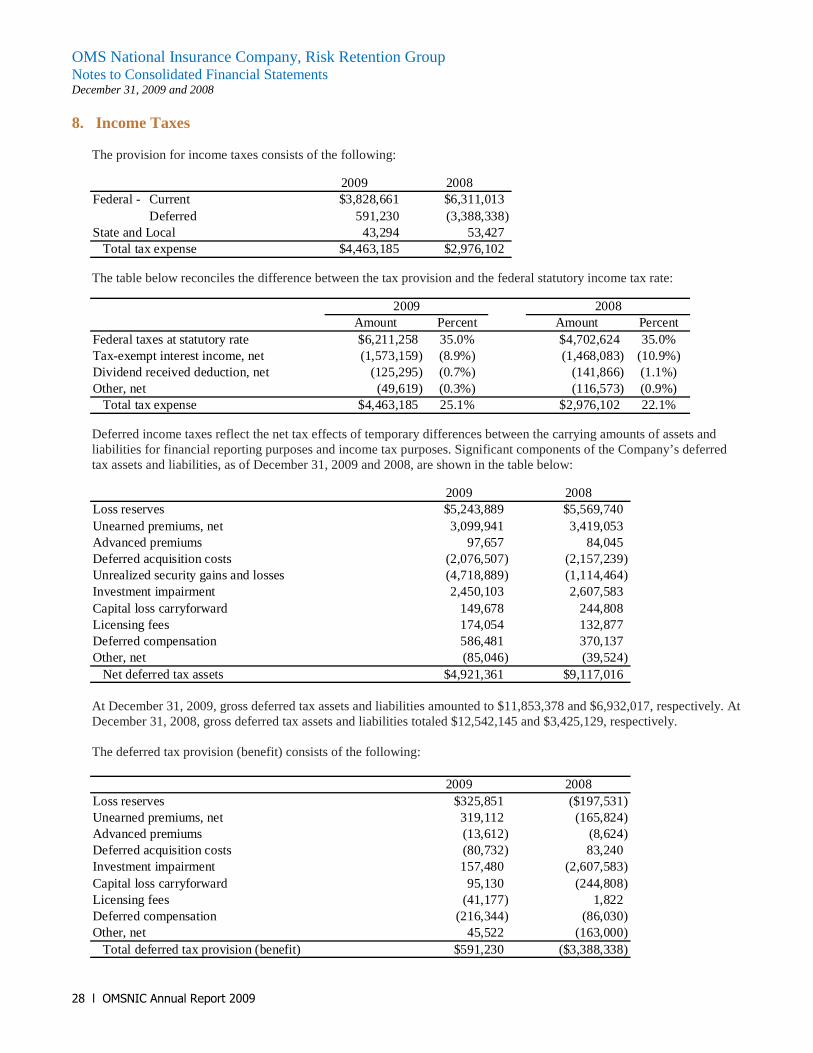
8. Income Taxes The provision for income taxes consists of the following:
2009 2008Federal - Current $3,828,661 $6,311,013 Deferred 591,230 (3,388,338)State and Local 43,294 53,427 Total tax expense $4,463,185 $2,976,102
The table below reconciles the difference between the tax provision and the federal statutory income tax rate:
Amount Percent Amount PercentFederal taxes at statutory rate $6,211,258 35.0% $4,702,624 35.0%Tax-exempt interest income, net (1,573,159) (8.9%) (1,468,083) (10.9%)Dividend received deduction, net (125,295) (0.7%) (141,866) (1.1%)Other, net (49,619) (0.3%) (116,573) (0.9%) Total tax expense $4,463,185 25.1% $2,976,102 22.1%
2009 2008
Deferred income taxes reflect the net tax effects of temporary differences between the carrying amounts of assets and
liabilities for financial reporting purposes and income tax purposes. Significant components of the Company’s deferred tax assets and liabilities, as of December 31, 2009 and 2008, are shown in the table below:
2009 2008Loss reserves $5,243,889 $5,569,740Unearned premiums, net 3,099,941 3,419,053Advanced premiums 97,657 84,045Deferred acquisition costs (2,076,507) (2,157,239)Unrealized security gains and losses (4,718,889) (1,114,464)Investment impairment 2,450,103 2,607,583Capital loss carryforward 149,678 244,808Licensing fees 174,054 132,877Deferred compensation 586,481 370,137Other, net (85,046) (39,524) Net deferred tax assets $4,921,361 $9,117,016
At December 31, 2009, gross deferred tax assets and liabilities amounted to $11,853,378 and $6,932,017, respectively. At
December 31, 2008, gross deferred tax assets and liabilities totaled $12,542,145 and $3,425,129, respectively. The deferred tax provision (benefit) consists of the following:
2009 2008Loss reserves $325,851 ($197,531)Unearned premiums, net 319,112 (165,824)Advanced premiums (13,612) (8,624)Deferred acquisition costs (80,732) 83,240Investment impairment 157,480 (2,607,583)Capital loss carryforward 95,130 (244,808)Licensing fees (41,177) 1,822Deferred compensation (216,344) (86,030)Other, net 45,522 (163,000) Total deferred tax provision (benefit) $591,230 ($3,388,338)

OMS National Insurance Company, Risk Retention Group Notes to Consolidated Financial Statements December 31, 2009 and 2008
OMSNIC Annual Report 2009 l 29
Deferred tax provision (benefits) of $3,604,425 and ($103,779) have been included in the change in unrealized gains and losses in accumulated other comprehensive loss in 2009 and 2008, respectively.
9. Related Party Transactions Other underwriting expenses include $575,076 and $545,300 in 2009 and 2008, respectively, due to the Association, under
an endorsement and royalty agreement in connection with the advertising, marketing, promotion and sale of professional liability insurance. Under the terms of the endorsement and royalty agreement, OMSNIC pays the Association a fee based on the number of active policyholders. The monthly fee amount per insured was $10.25 in 2009 and $9.95 in 2008.
Legal fees of $834,964 and $742,830 in 2009 and 2008, respectively, were paid to firms in which directors of Fortress
were partners. 10. Dividend Restrictions OMSNIC has a statutory surplus of $107,381,931 at December 31, 2009 and statutory net income of $13,698,772 for the
year then ended. At December 31, 2009, OMSNIC may pay up to $13,698,772 in dividends without the prior approval of the Director of the DOI. No dividends may be paid on common shares or preferred shares if payments for repurchases of preferred shares, as discussed in Note 11, are suspended by law, regulation, order of the DOI, the Board of Directors or if the number of shareholders is fewer than 1,000. Additionally, under OMSNIC’s bylaws, dividends cannot be paid on common stock unless dividends of at least $8.00 per share have been paid on preferred stock in that year. The annual maximum dividend payable on common stock is $.10 per share.
Fortress has a statutory surplus of $20,921,779 at December 31, 2009 and statutory net income of $378,799 for the year
then ended. At December 31, 2009, Fortress may pay up to $2,092,178 in dividends without prior approval of the Director of the DOI.
As required by the Illinois Insurance Code, the Company must maintain minimum capital of $1,000,000 and minimum
policyholders’ surplus of $500,000. In addition, the DOI has imposed RBC requirements. The regulation is based on a model adopted by the NAIC. An RBC
formula establishes capital requirements for insurance companies based on an individual company’s major areas of risk, including asset, credit, underwriting and off-balance sheet risk. The results are used by the NAIC and DOI to identify companies that merit regulatory attention or the initiation of regulatory action. At December 31, 2009 the Company had adjusted capital in excess of the minimum levels that would merit regulatory attention.
11. Capital Stock New insureds are required to purchase one common share plus preferred shares in an amount equal to 75% of the primary
fifth-year annual premium of the insured. There is not a market for the Company’s shares. The terms for the purchase and sale of shares are highly restricted. Such transactions are generally limited to the issuance of shares when a shareholder first becomes a policyholder and to the repurchase of shares when a policyholder terminates coverage. The transferability of common shares is restricted to the Company or another shareholder, and only at a price of $1.00 per share. Preferred shares are only transferable to the Company. Preferred shares are non-voting.
Common and preferred shares are repurchased by the Company when a policyholder terminates his or her insurance
coverage. The repurchase price for common shares is $1.00 per share. Subject to specific exceptions enumerated in the Articles of Incorporation and By-laws of the Company, the repurchase price for preferred shares is the price per share as of the termination date, or, if lower, at the time of the policyholder’s death, disability or retirement. The preferred share price is calculated each April 1 as the prior year’s ending statutory surplus adjusted for the difference in market value versus carrying cost of investments and certain other adjustments as defined in the Company’s Amended and Restated Articles of Incorporation. As of December 31, 2009, the preferred share price was $686.66 per share. Payment for repurchased shares is deferred until death, disability or retirement of the policyholder. Repurchased common and preferred shares are held as treasury stock.

OMS National Insurance Company, Risk Retention Group Notes to Consolidated Financial Statements December 31, 2009 and 2008
30 l OMSNIC Annual Report 2009
At December 31, 2009 and 2008, the Company has a liability of $2,094,058 and $2,164,091, respectively, for repurchases of preferred shares made on cessation of coverage for reasons other than death, disability or retirement.
In liquidation of the Company, the holders of preferred shares are entitled to receive all liquidation proceeds up to
$100.00 per share before the holders of common shares receive $1.00 per share. All remaining liquidation proceeds then go to holders of preferred shares.
12. Other Comprehensive Income (Loss) The following table sets forth the components of other comprehensive income (loss) and the related tax effect for 2009
and 2008:
2009 Total
Income Tax Benefit
(Expense) NetAvailable-for-sale securities:
Net unrealized holding gainsarising during the period $11,020,101 ($3,857,035) $7,163,066
Less: reclassification for net realizedgains included in income (721,743) 252,610 (469,133)
Other comprehensive income (loss) $10,298,358 ($3,604,425) $6,693,933
2008 Total
Income Tax Benefit
(Expense) NetAvailable-for-sale securities:
Net unrealized holding lossesarising during the period ($11,433,254) $4,001,638 ($7,431,616)
Less: reclassification for net realizedlosses included in income 11,136,741 (3,897,859) 7,238,882
Other comprehensive income (loss) ($296,513) $103,779 ($192,734) 13. Defined Contribution Plan and Deferred Compensation Plan The Company has established an employee 401(k) plan for which all employees who have attained the age of 21 are eligible to
participate on a voluntary basis. The 401(k) plan calls for the Company to match employee contributions up to 4% of an employee’s compensation, limited to the maximum allowed under federal tax laws, which was $9,800 and $9,200 per employee for 2009 and 2008, respectively. The Company funds its full obligation under the 401(k) plan annually. The Company’s contributions to the 401(k) plan were $219,000 and $221,000 for the year ended December 31, 2009 and 2008, respectively. At December 31, 2009, the fair value of the 401(k) plan assets was $4,267,000.
The Company has established a Deferred Compensation Plan for all employees. Under the terms of the plan, units are credited
to eligible employees in an amount equal to 5% of an employee’s base annual salary as of April 1 of the grant year, divided by the price per share of the Company’s preferred stock. An employee vests in phantom stock awards on the fifth anniversary of the grant. Grants of deferred compensation units that have not vested are forfeited upon termination of employment except in the case of death, disability or retirement. In connection with the establishment of the plan, grants were made to certain employees as if the plan had been in effect in prior years. The plan is not funded.

OMS National Insurance Company, Risk Retention Group Notes to Consolidated Financial Statements December 31, 2009 and 2008
OMSNIC Annual Report 2009 l 31
The following summarizes the units granted, paid and forfeited in 2009 and 2008:
2009 2008 Units outstanding at January 1 2,769.15 2,472.51 Plus: units granted 512.29 575.45 Less: units paid (373.63) (85.17) Less: units forfeited (497.25) (193.64) Units outstanding at December 31 2,410.56 2,769.15
Payment of vested amounts is made on the vesting date unless an employee elects to defer payment to a later date. Payment of all
unpaid vested amounts is made upon termination of employment. Payments of $256,220 and $51,430 were made to employees for vested units under the plan in 2009 and 2008.
The total cost of the deferred compensation units granted is expensed pro rata over the five-year vesting period. Adjustments
due to changes in the price per share which is used in the deferred compensation calculation or forfeitures are expensed in the year of the change. Included in loss adjustment expenses and salary expense for 2009 are $91,787 and $157,558 and for 2008 are $82,797 and $214,114, respectively, for units granted. As of December 31, 2009 and December 31, 2008, $1,050,659 and $1,057,534 were included in other liabilities relating to the plan. The total cost of compensation for unvested units that have not yet been included in expense is $604,577.
Assuming no forfeitures or terminations of employment and using the share price at December 31, 2009, the scheduled payout
of grants as of December 31, 2009, adjusted for elective employee deferrals, is as follows:
Year Deferred Compensation Units Amount 2010 160.52 $110,223 2011 342.46 $235,154 2012 542.88 $372,774 2013 386.22 $265,202 2014 428.11 $293,966
After 2014 550.37 $377,917
14. Contingencies
The Company is periodically involved in various legal actions and proceedings arising from the normal course of operations. Management believes, based on known facts, that the ultimate liability, if any, not covered by insurance, arising from all the legal actions and proceedings will not have a material adverse effect upon the financial position of the Company. The Company is subject to insurance guaranty laws in the states in which it writes business. These laws provide for assessments against insurance companies for the benefit of policyholders and claimants in the event of insolvency of other property and casualty insurance companies. The Company currently estimates any guaranty fund assessments for known insolvencies will be immaterial to the consolidated financial statements.
15. Subsequent Events
All of the effects of subsequent events that provide additional evidence about conditions that existed at the consolidated balance sheet date, including the estimates inherent in the process of preparing the consolidated financial statements, are recognized in the consolidated financial statements. The Company does not recognize subsequent events that provide evidence about conditions that did not exist at but arose after the consolidated balance sheet date and before the consolidated financial statements are available to be issued. In some cases, nonrecognized subsequent events are disclosed to keep the consolidated financial statements from being misleading. Subsequent events have been evaluated through April 16, 2010, which is the date that the consolidated financial statements were available to be issued.

6133 N. River Road • Suite 650 • Rosemont, Illinois 60018-5173
Phone 847-384-0041 or 800-522-6670 • Fax 847-384-0048
www.dds4dds.com


![[MS-OMS]: Office Mobile Service Protocol Specification · 2016. 5. 11. · [MS-OMS] — v20121003 ... Microsoft programming tools and environments you are free to take advantage of](https://static.documents.pub/doc/80x56/5fd062bb71d355619a3913e4/ms-oms-office-mobile-service-protocol-specification-2016-5-11-ms-oms-a.jpg)


