Page 1
THE ONTOGENY OF RESPIRATION IN HERRING
AND PLAICE LARVAE
by
Celine D. de Silva, B.Sc. (Ceylon)
Thesis submitted for the degree of
Doctor of Philosophy
in the
University of Stirling
February 1973
Page 2
IMAGING SERVICES NORTH Boston Spa, Wetherby
West Yorkshire, LS23 7BQ
www.bl.uk
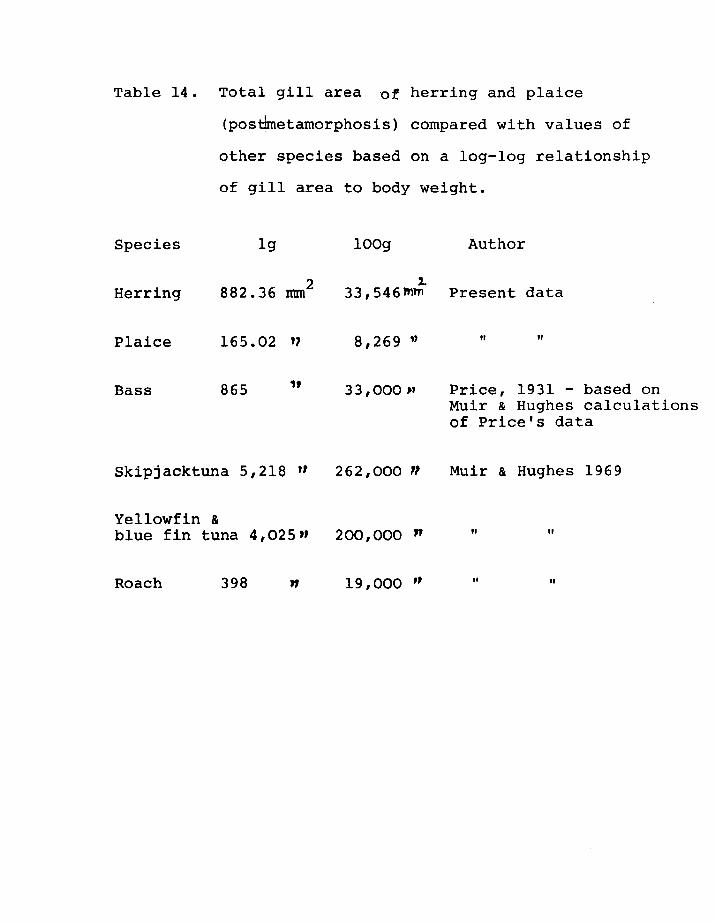
CONTAINS
PULLOUTS
Page 3
i.
ACKNOWLEDGEMENTS
I would like to thank my supervisor Dr. Peter Tytler
for his advice and encouragement in the course of this
work and also Professor F.G.T. Holliday for his interest.
I also wish to thank the Director and staff of the
Dunstaffnage Marine Research Laboratory where this
work was carried out, and in particular Dr. John Blaxter
for his unfailing interest, encouragement and advice
throughout the project: Miss Shona Smith for typing
the manuscript and last but certainly not least, my
husband Sena for his help with the rearing of larvae,
his patience and inspiration.
Page 4
ii.
TABLE OF CONTENTS
GENERAL INTRODUCTION
MATERIALS
Incubation of eggs
Rearing Techniques
PART ONE. TOLERANCE AND SURVIVAL AT LOW OXYGEN
TENSIONS
I.i. Introduction
I.2. Methods
I.3. Results
I.3.i. Statistical procedures for lethal
oxygen experiments
I.3.2. Behaviour of larvae during lethal
experiments
PAGE I
4
6
9
10
12
14
I.3.3. Lethal oxygen level and resistance time 14
I.4. Discussion 15
PART TWO. OXYGEN UPTAKE AT NORMAL OXYGEN CONCENT-
RATION
II.i. Introduction 18
II.2. Methods 20
II.3. Results 22
II.4. Discussion 24
PART THREE. OXYGEN UPTAKE AT REDUCED OXYGEN
CONCENTRATION
III.i. Introduction 30
Page 5
PART
iii.
III.2. Methods
III. 3. Results
III.4. Discussion
FOUR. MORPHOLOGICAL MEASUREMENTS OF THE SURFACE
AREA OF THE BODY AND GILLS IN RELATION TO
DEVELOPMENT
IV.i. Introduction
IV.2. Methods
IV.3. Results
IV.3.i. Relationships between surface area and
length
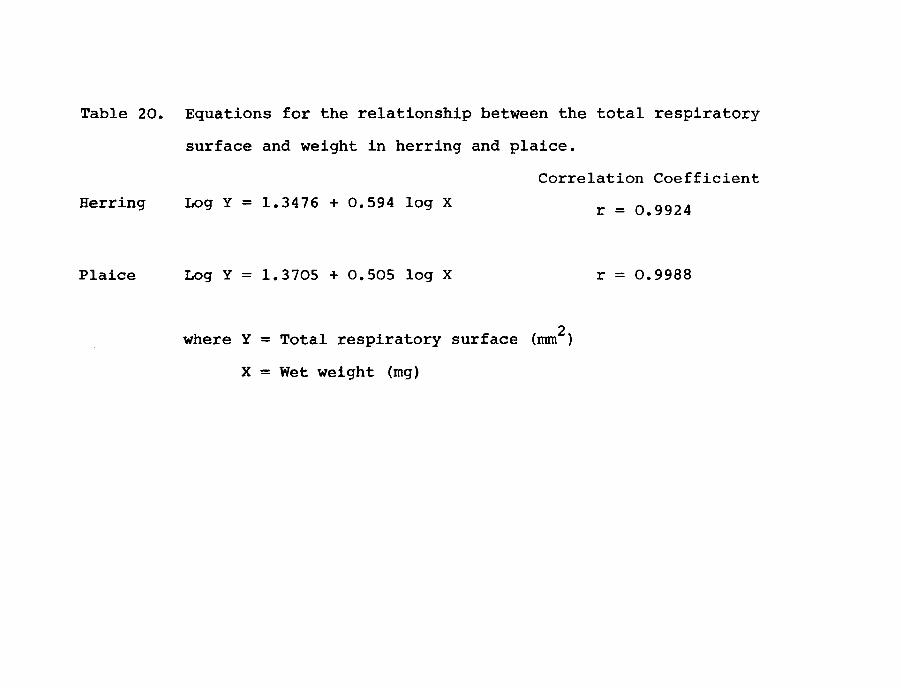
IV.3.2. Relationships between surface area and
weight
IV.3.3. Relationships between body weight and
total gill area
IV.3.4. Factors influencing the changes in gill
area during development
IV.4. Discussion
PART FIVE. THE DEVELOPMENT OF HAEMOGLOBIN
V.i. Introduction
V.2. Methods
V.2.i. Histochemical Identification
V.2.2. Spectrophotometric measurement
31
33
34
35
37
43
45
48
50
57
64
65
65
Page 6
iv.
V.3. Results
V.3.i. Histochemical Identification
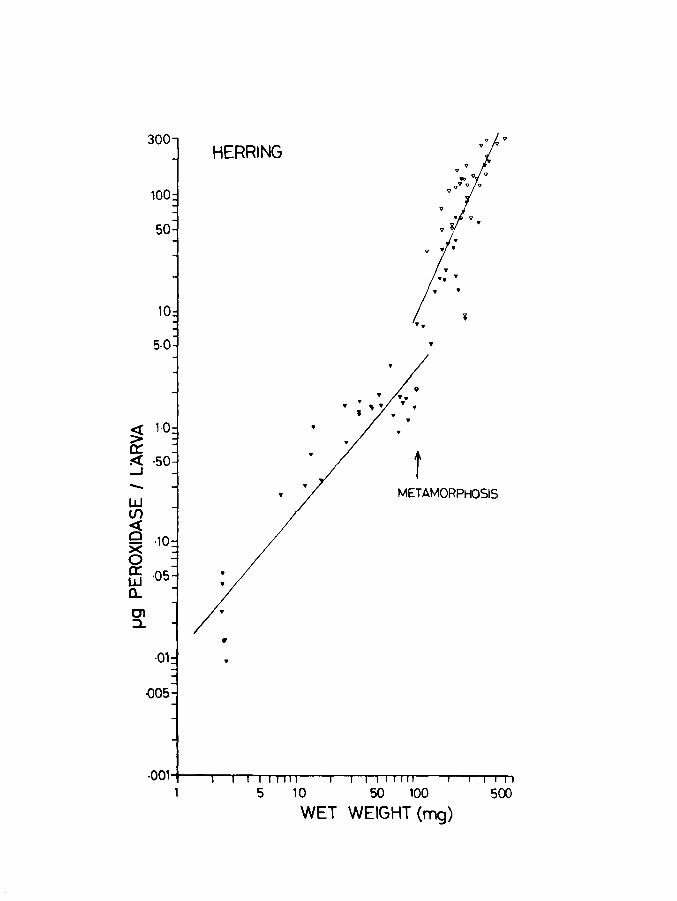
V.3.2. Quantitative measurement
V.4. Discussion
GENERAL DISCUSSION
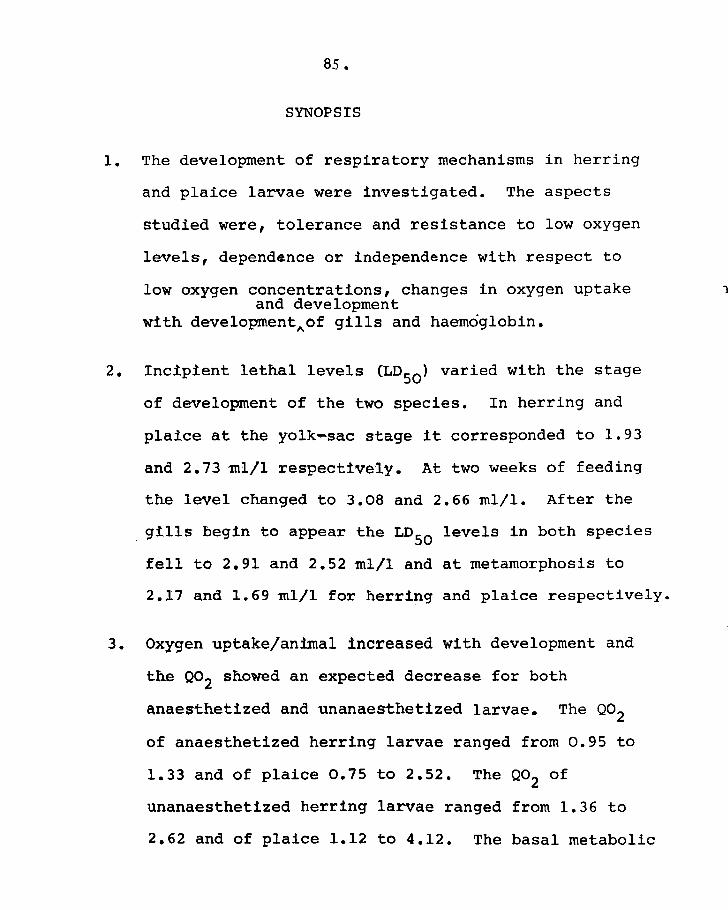
SYNOPSIS
BIBLIOGRAPHY
APPENDICES
66
67
68
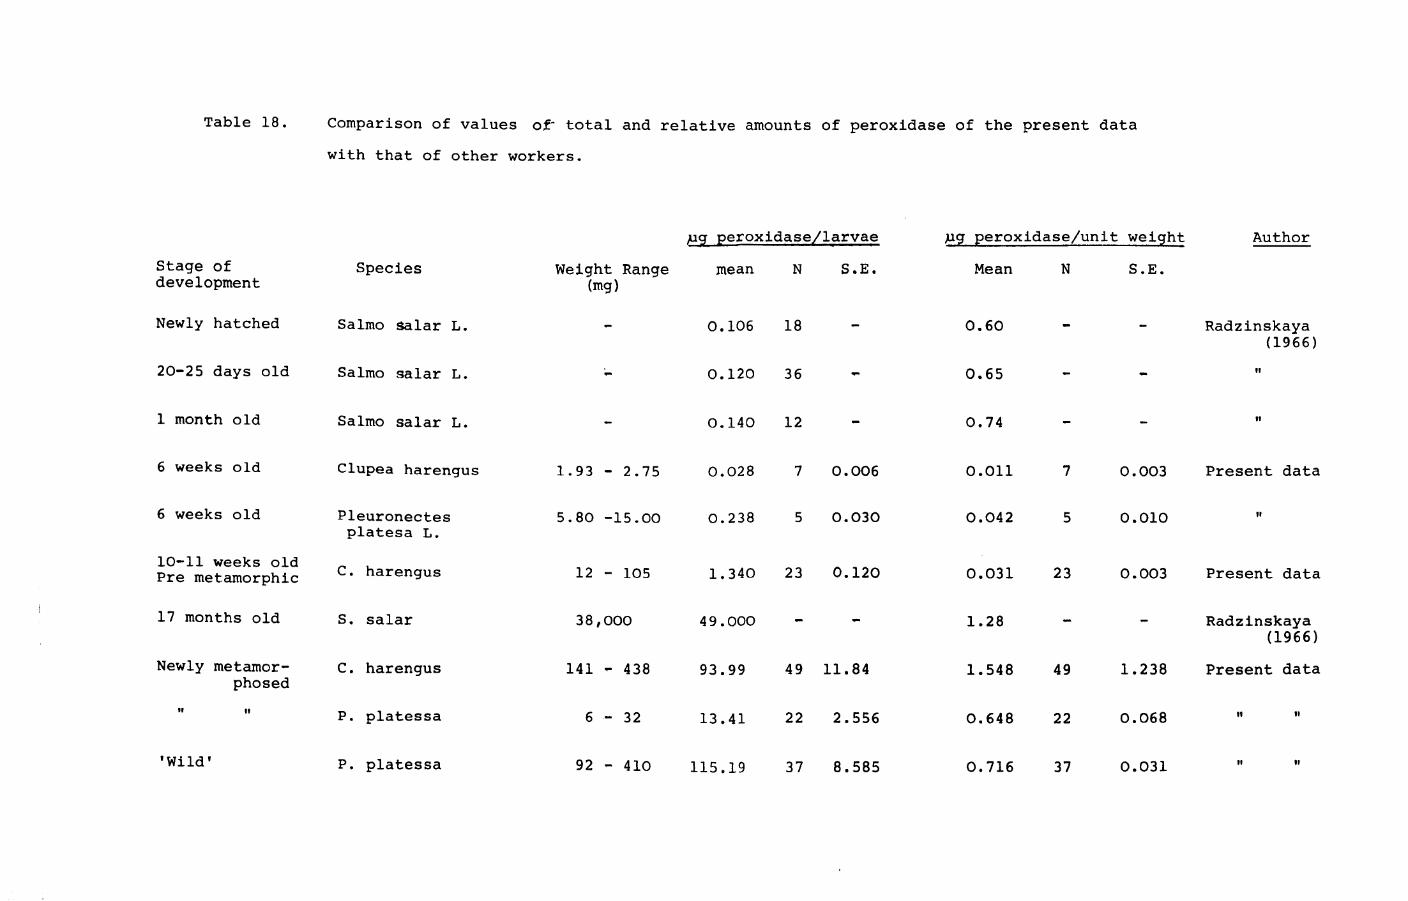
72
85
91
110
Page 7
1.
GENERAL INTRODUCTION.
The study of larvae, their behaviour & physiology has
gathered momentum in recent years due to the development of
improved techniques of rearing during the past decade. Many
marine larvae have been successfully reared in the laboratory
(Shelbourne, 1964; Schumann, 1967; Blaxter, 1968,1969; Houde
& Palko, 1970; Futch & Detwyler, 1970; Lasker, Feder,
Theilacker & May, 1970). Fish larvae, in particular those
of most marine species form an important tool for research
in that at hatching they only possess the rudiments of most
organs. Thus they are ideal material for ontogenetical
studies.
Although the respiratory mechanisms of adult fish have
been the subject of a great deal of investigation from the
point of view of gas exchange (see Randall 1970) gill
structure (Hughes, 1966; Hughes & Grimstone, 1965; Newstead,
1967; to name a few) and dimensions (see Muir, 1969) gill
ventilation and perfusion (see Shelton, 1970) circulatory
systems (see Randall, 1970) bioenergetics, (see Brett, 1970)
the respiratory systems of larvae have not been investigated
in any great detail. Apart from a few studies on oxygen
uptake (see Blaxter, 1969) and Harder (1954) on the
development of branchial elements, no detailed study of
the development of respiratory mechanisms have been made
in marine fish larvae.
Page 8
2.
The purpose of this study was to investigate the
development of respiration in two species of marine larvae
viz. the herring (Clupea harengus L.) and the plaice
(Pleuronectes plates sa L.) These two species are well
separated taxonomically and both adults and young have
very different life histories. Herring lay demersal eggs,
the plaice pelagic ones. The yolk-sac larvae of both
species are planktonic, later feeding on diatoms and
copepod nauplii and much later copepods. Adult herring
are pelagic, living in mid water as juveniles and moving
into deeper water with age, ranging from offshore to about
200m. They perform migrations partly caused by the
distribution and density of food organisms. In contrast
to this plaice at metamorphosis show an interesting asymmetry
in that one eye migrates over the head and comes to lie
against its opposite number. At this stage pelagic life
ceases and the young fish assumes a bottom-living existence.
Other features associated with asymmetry are secondary to
the migration of the eye and follow on from the adoption
of the benthic mode of life. They range from the shoreline
when young to lOOOm feeding on bottom living organisms.
During development the mechanism of respiration changes
from a cutaneous one to gill respiration typical of the
adult form. There is apparently no respiratory pigment
in the early stages but the blood becomes pink at
Page 9
3.
metamorphosis.
The problem was approached from a morphological and
a physiological viewpoint. The main parts of the study
are as follows.
(1) The survival times in water of low oxygen
concentrations.
(2) The oxygen uptake at normal oxygen concentrations.
(3) The oxygen uptake at low oxygen concentrations.
(4) Measurement of the body surface area as well as
the gill area available for respiration.
(5) The appearance of haemoglobin and its quantitative
measurement.
Page 10
Incubation of Eggs
Herring.
4. MATERIALS
The larvae used for the experiments were reared from
eggs. Gonads were obtained from spawning fish captured by
trammel net on the Ballantrae bank in the Firth of Clyde.
Gonads were dissected out immediately after capture and
individually placed in small glass jars. These were stored
on a small amount of ice in a vacuum flask during transport
ation to the laboratory. Care was taken to ensure that the
ovaries did not come into contact with water as this tended
to make the eggs sticky and clump together during the
subsequent dispersion on to glass plates.
Eggs were fertilized in the laboratory according to
the method of Blaxter (1968). Ground glass plates of
approximately 20 x 50 cm were placed singly on the bottom
of rectangular white plastic tanks containing sea water.
The eggs from one ovary were removed in groups using a
scalpel and gently dispersed in the water, care being taken
to wipe the scalpel dry before each group of eggs was taken.
This was repeated until the plates were more or less uniformly
covered with eggs but not crowded. Some eggs were dispersed
on to glass slides to facilitate easy removal of eggs for
some experiments. The plates were then transferred back to
back, to a second tank containing the milt suspension. The
Page 11
5.
latter was obtained from the gonads of three to four male
fish. The plates were removed after about 10 minutes and
rinsed several times to remove excess milt by dipping them
in clean sea water. They were then placed vertically
around the sides of a black Darvic tank in water which
had been left standing overnight. The tanks were covered
with black plastic sheeting to keep out light. Plates
with eggs were transferred daily to fresh sea water until
a peak of hatching was observed. The eggs from one
female were kept separate for some experiments, while
the rest were mixed.
Plaice.
Fertilized eggs were obtained from the White Fish
Authority at Hunterston, and Ardtoe, as well as from Port
Erin, Isle of Man. The eggs were transported to the
laboratory in sea water contained in plastic jars, stored
on a little ice in a vacuum flask. At the laboratory the
temperature was allowed to rise until it reached that of
the sea water in the incubation tanks, which was about
9-10oC. These tanks contained antibiotics (sodium
penicillin and streptomycin sulphate) in the concentrations
recommended by Shelbourne (1964). The eggs were left in
these tanks until hatching occurred. Time to hatching
varied from 3 - 12 days depending on the stage of development
Page 12
6.
at which they were obtained. Eggs from one female were
kept separate for some experiments while the rest were mixed.
Rearing techniques.
At hatching the larvae were removed by means of wide-
mouthed pipettes and glass beakers, and transferred to
black plastic tanks with a matt finish. The tanks varied
in size from 20 to 2000 1. The former were used for plaice
due to their smaller spatial requirements, while the larger
ones were used for herring. In both species the larvae from
one female were kept separate and reared in 200 1 rectangular
tanks made of "Darvic" (an leI plastic) in a constant
o temperature room at 10 C for some experiments. About
200 plaice larvae were transferred to each small tank,
while about 3000 herring larvae were placed an the large
tanks. This reduced the occurrence of fish nipping at one
another. Light was supplied by an 80W fluorescent tube and
situated about 1 m above the tanks in an alcove in the
general aquarium area. Since the light appeared to be too
strong, as apparent from the tendency of larvae to swallow
air bubbles, translucent paper was used to cover them. This
reduced the mortality of the larvae. A circular fluorescent
tube was used in the constant temperature room. Time clocks
were used in the alcove and constant temperature room to
turn the lights on and off about an hour before sunrise and
Page 13
7.
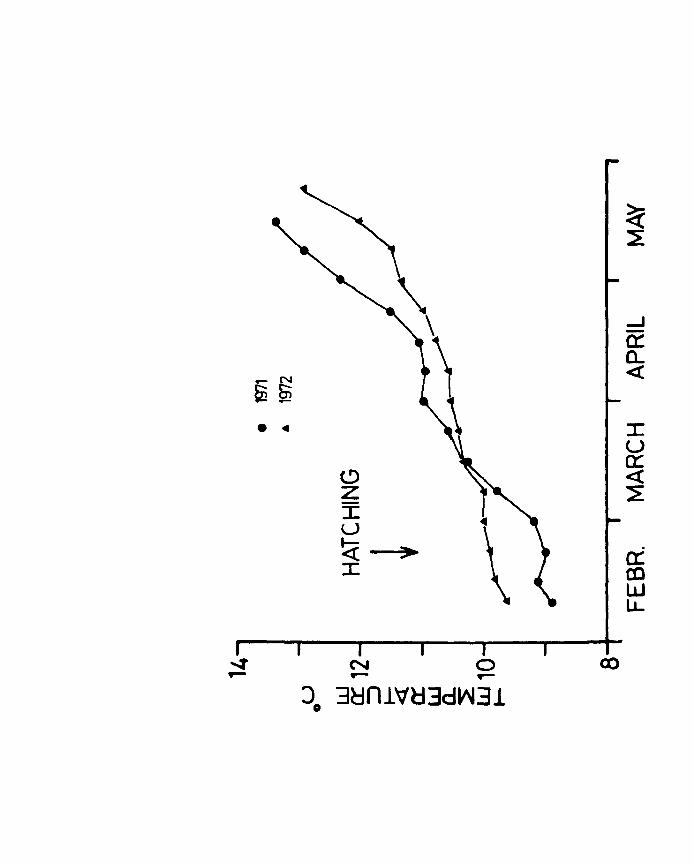
sunset respectively. At the end of the yolk sac stage only, for 2 - 3 weeks
day length was increased to promote commencement of feeding. ~
Temperature of the water was recorded during '71 and '72
and the general temperature patterns are shown in Fig.l. All
the tanks were supplied with running sea water. The flow
rate was about 2 l/h in the small tanks, the rate being
increased in the large tanks. Water entered in at the bottom
and left at the surface. A perspex ring of about 7 cm diameter
and 6 cm high which had fine meshed plankton netting glued to
its lower side, was fixed at the outlet to prevent loss of
larvae. The mesh was cleaned daily to prevent clogging.
Sea water entered the tanks in the alcove via a 2 1
constant level container (Ehrlich, 1972) containing a seive
with synthetic fibre wool. This could supply about six
tanks with an uniform flow of water.
Tanks were cleaned daily for the first few weeks after
hatching, by siphoning off the debris and dead larvae from
the bottom. The bacterial film at the surface was removed
by skimming with a beaker. Some plaice were lost from one
tank following a growth of ciliates on the bottom. The
reason for the death of the larvae is unknown. It is
possible that the ciliates may have stung the larvae or tV
alterna~lY released toxic substances into the water. The
rest of the larvae were transferred into a new tank to
reduce mortality.
Page 14
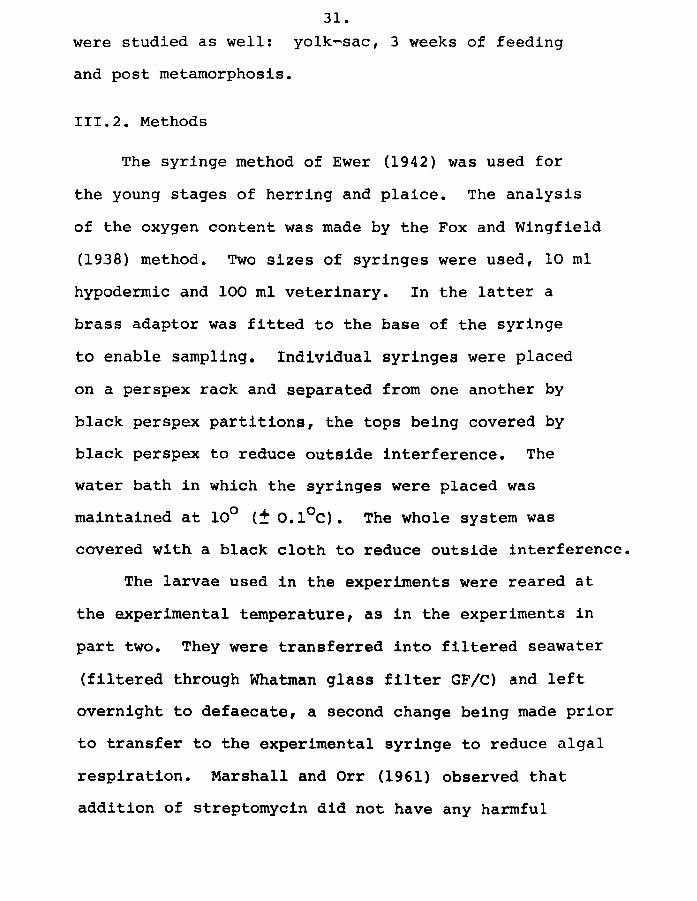
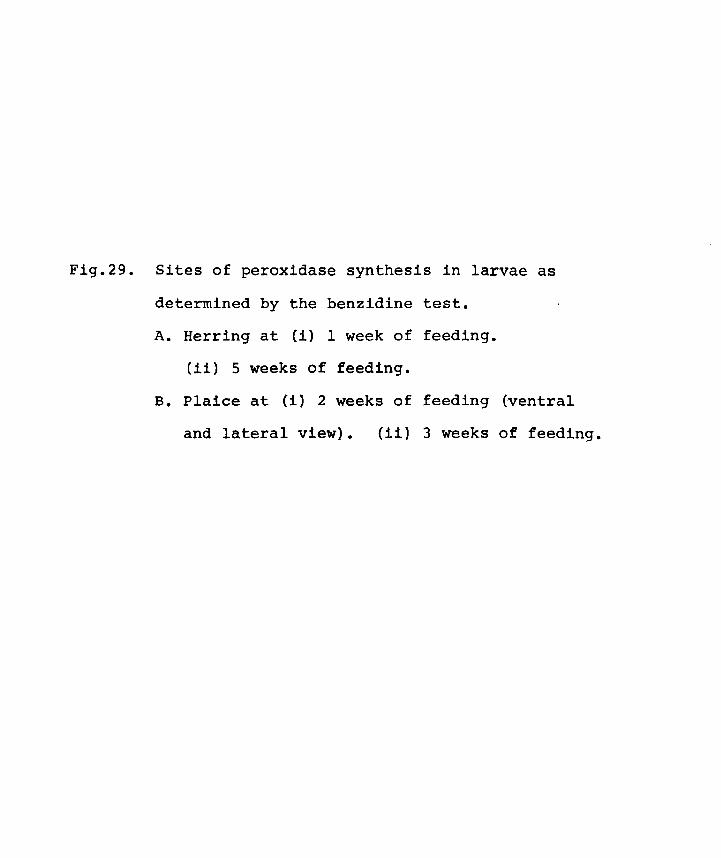
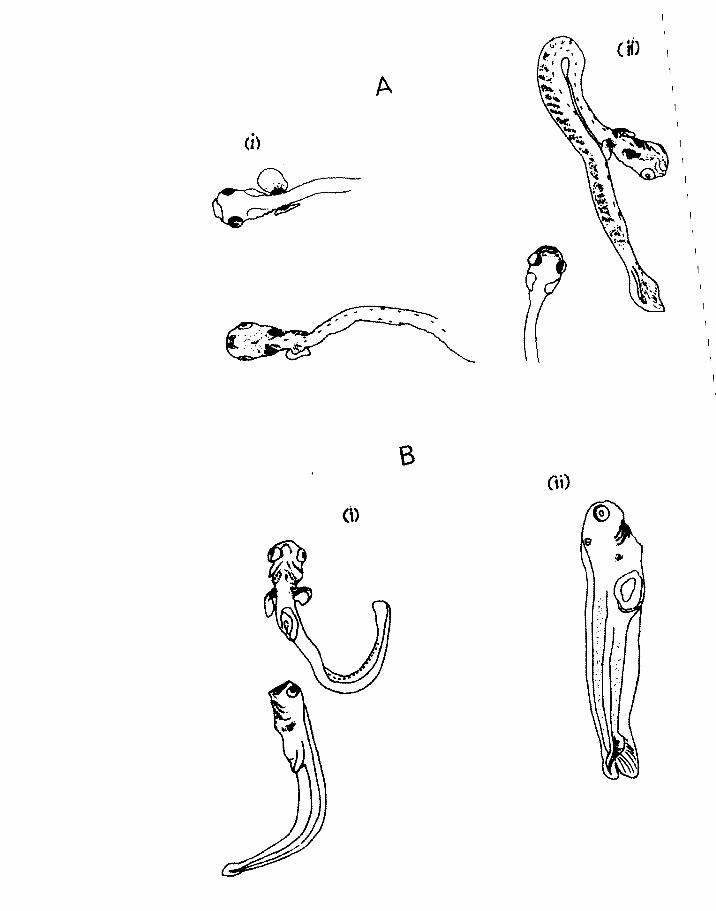
Fig.l. Pattern of temperature changes in the rearing
tanks during the 1971 and 1972 season.
Page 15
....J 0:: CL
_ N « ~~ • 4 :r:
U 0::
~ « z ~ ::r: u ~ >- a: :::r: CO
W l.L
co
Page 16
8.
Herring larvae were fed Balanus nauplii initially.
Egg sacs were removed from the adult barnacles and forced
through a sieve into sea water. This served to break up
the egg masses and release the nauplii. Later Artemia
nauplii and sieved natural plankton was used. The Artemia
eggs from San Fransisco Bay were incubated in 2 1 beakers
of sea water at 26 0 C with vigorous aeration. Nauplii were
separated from the egg cases using their phototactic
properties. Plaice were fed on Artemia nauplii and
natural plankton up to metamorphosis. Both species
were fed on a diet of chopped mussel, squid and mysids
after metamorphosis.
Page 17
9.
PART ONE. TOLERANCE AND SURVIVAL AT LOW OXYGEN TENSIONS
1.1. Introduction.
The dissolved oxygen requirements of marine fishes
have not been adequately investigated. Most of the work
has been limited to freshwater and anadromous species
(see Doudoroff & Shumway, 1970). Bishai (1960) however
studied the effect of reduced oxygen on herring larvae
as well as that of salmonids, while Saksena & Joseph (1972)
determined oxygen requirements of the larvae of the striped
blenny (Chasmodes bosquianus), naked goby (Gobiosoma bosci)
and skillet fish (Gobiesox strumosus).
The effects of a decreasing environmental oxygen
tension on metabolic rate of teleost fish have been
adequately dealt with by many authors such as Fry (1957),
Winberg (1960), Brett (l962) and more recently by Fry (1971).
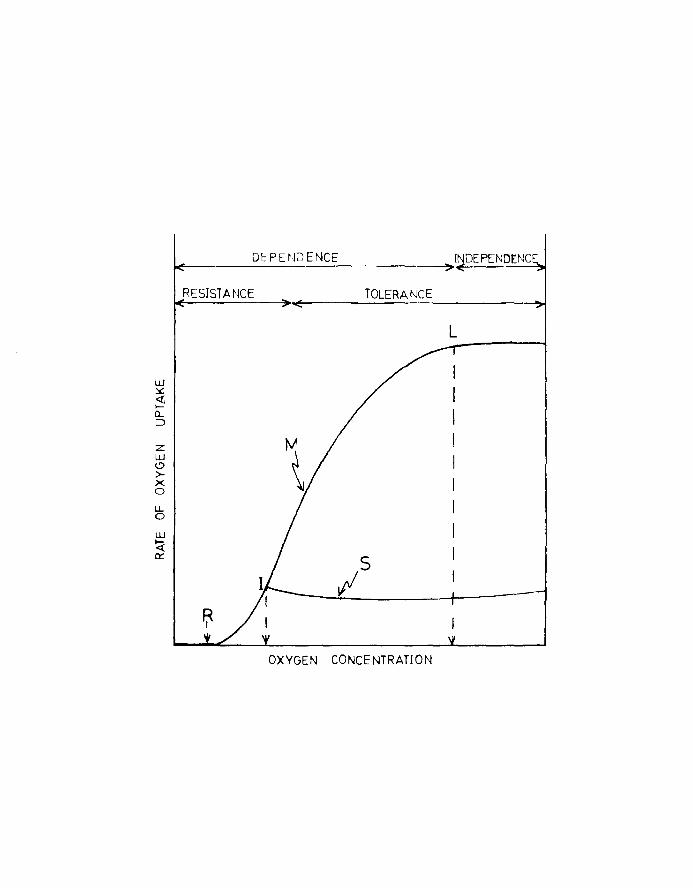
Below a critical level, the incipient limiting level, the
rate of oxygen uptake is directly dependent on the oxygen
tension of the environment (see Fig.2).
Oxygen tensions above this level form the zone of
respiratory independence while tensions below it form the
zone of respiratory dependence. At a second critical
level in the zone of respiratory dependence the maximum
rate of oxygen uptake is reduced to a point where it is
Page 18
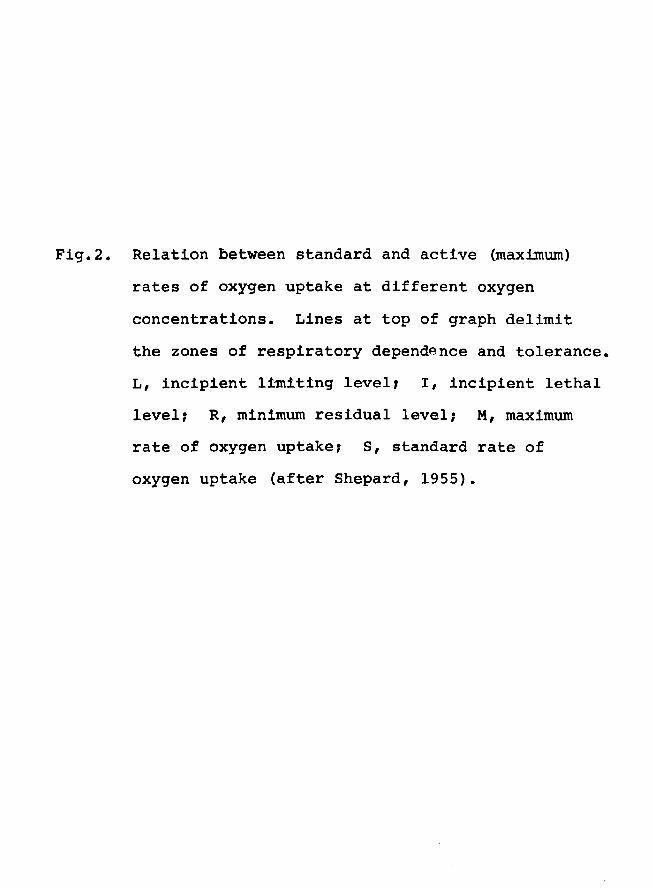
Fig.2. Relation between standard and active (maximum)
rates of oxygen uptake at different oxygen
concentrations. Lines at top of graph delimit
the zones of respiratory dependence and tolerance.
L, incipient ll~ltlng levelJ I, incipient lethal
level, R, minimum residual level, M, maximum
rate of oxygen uptake, S, standard rate of
oxygen uptake (after Shepard, 1955).
Page 19
DEPUJDENCE >~DEPENDrNc
RESISTANCE TOLERANCE
L
w :,.:: <t r-CL :::J
Z W t!)
>-x 0
u.. 0
L.LJ
~ C!: ;5
OXYGEN CONCENTRATION
Page 20
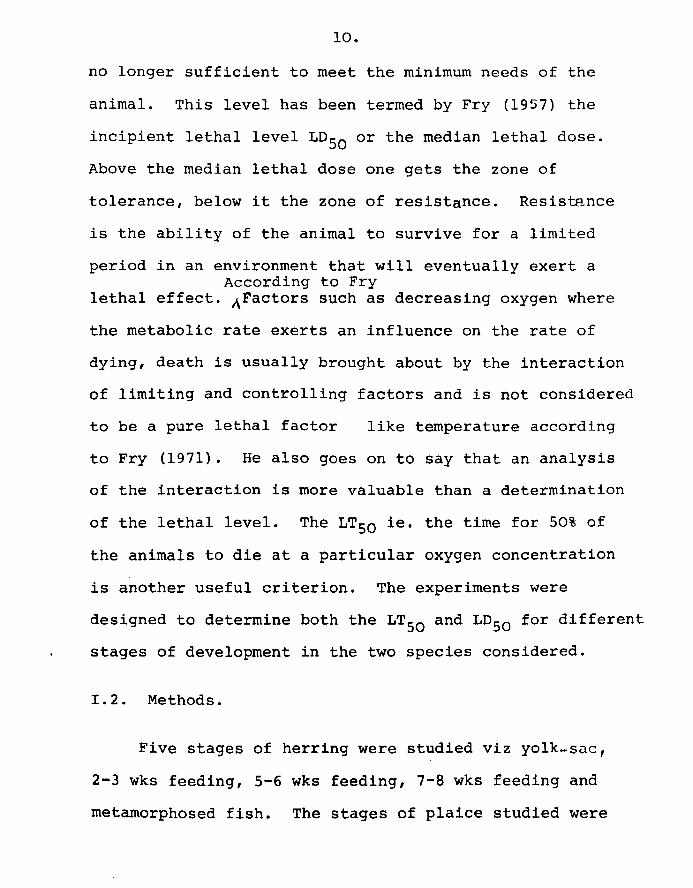
10.
no longer sufficient to meet the minimum needs of the
animal. This level has been termed by Fry (1957) the
incipient lethal level LDSO or the median lethal dose.
Above the median lethal dose one gets the zone of
tolerance, below it the zone of resistance. Resistance
is the ability of the animal to survive for a limited
period in an environment that will eventually exert a According to Fry
lethal effect. AFactors such as decreasing oxygen where
the metabolic rate exerts an influence on the rate of
dying, death is usually brought about by the interaction
of limiting and controlling factors and is not considered
to be a pure lethal factor like temperature according
to Fry (1971). He also goes on to say that an analysis
of the interaction is more valuable than a determination
of the lethal level. The LTso ie. the time for 50% of
the animals to die at a particular oxygen concentration
is another useful criterion. The experiments were
designed to determine both the LTSO and LDso for different
stages of development in the two species considered.
1.2. Methods.
Five stages of herring were studied viz yolk-sue,
2-3 wks feeding, 5-6 wks feeding, 7-8 wks feeding and
metamorphosed fish. The stages of plaice studied were
Page 21
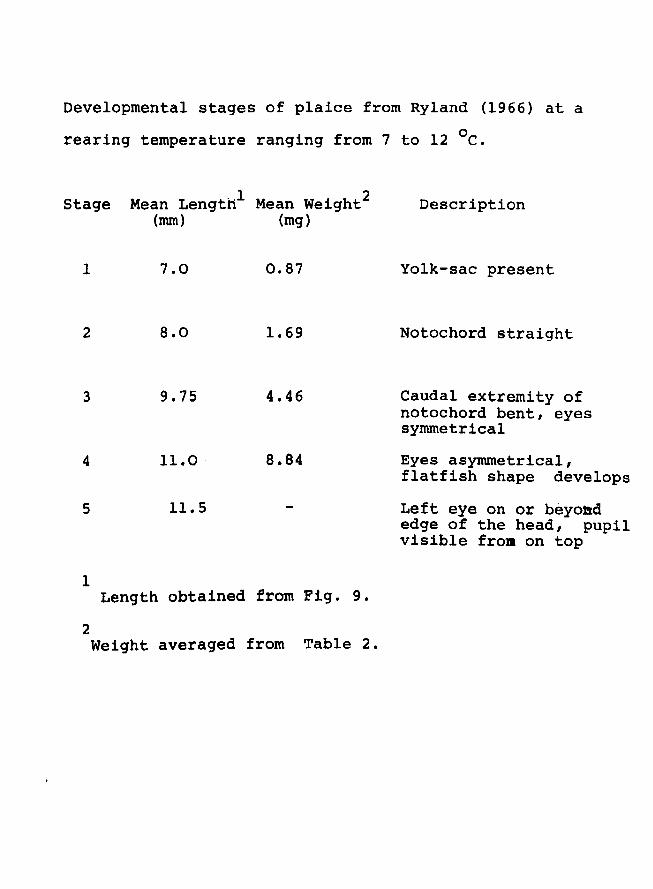
Developmental stages of plaice from Ryland (1966) at a
rearing temperature ranging from 7 to 12 °e.
Stage Mean Lengthl Mean weight2
(mm) (mg)
1 7.0 0.87
2 8.0 1.69
3 9.75 4.46
4 11.0 8.84
5 11.5
1 Length obtained frornFig. 9.
2 Weight averaged from Table 2.
Description
Yolk-sac present
Notochord straight
Caudal extremity of notochord bent, eyes symmetrical
Eyes asymmetrical, flatfish shape develops
Left eye on or beyoad edge of the head, pupil visible from on top
Page 22
II.
yolk-sac, 2-3 wks feeding, (stage 2 (see Shelbourne,
19S7), 5-6 wks feeding( stage 4-4b} and 3-4 wks after
metamorphosis (see Ryland, 1966, for duration of stages).
All the experiments were performed during the 1971 rearing
season except those on metamorphosed plaice which were
performed in the 1972 season.
Larvae which were abnormal looking or deformed, for
example blue finned yolk_sac herring larvae were not
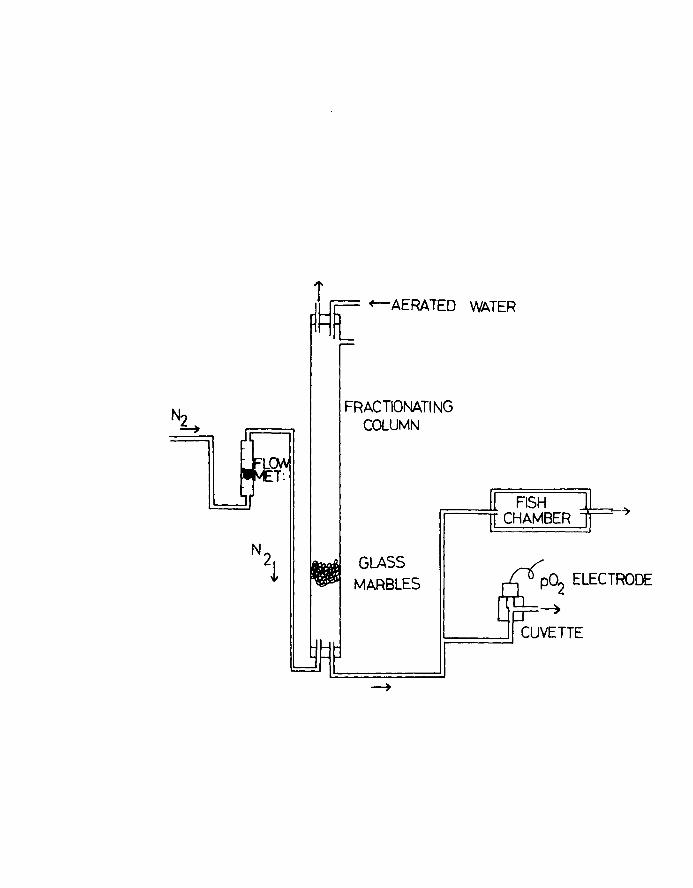
used for experiments. The larvae were transferred by
pipette in the early stages and later usinga beaker
into a rectangular chamber (25cm x llcm x 7cm) into
which deoxygenated water entered from a fractionating
column. Fry's (19SI) system was used where purified
N2 gas was bubbled in at the bottom of the column and
aerated water entered at the top (Fig.3). The flow rate
of nitrogen was measured using a GAP flowmeter while a
Beckman model No.777 laboratory oxygen analyser was used
to monitor the deoxygenated water (as % of air saturation)
flowing out of the column. Oxygen content was calculated
as m102/1 at NTP, by reference to a standard table of oxygen
saturation values (Carpenter, 1966).
A sample of fish ranging from ten to fifteen was used
in each experiment. A few experiments were repeated at
oxygen concentrations well below the LDSO level and there
was good agreement between the LTSO values in the replicate
Page 23
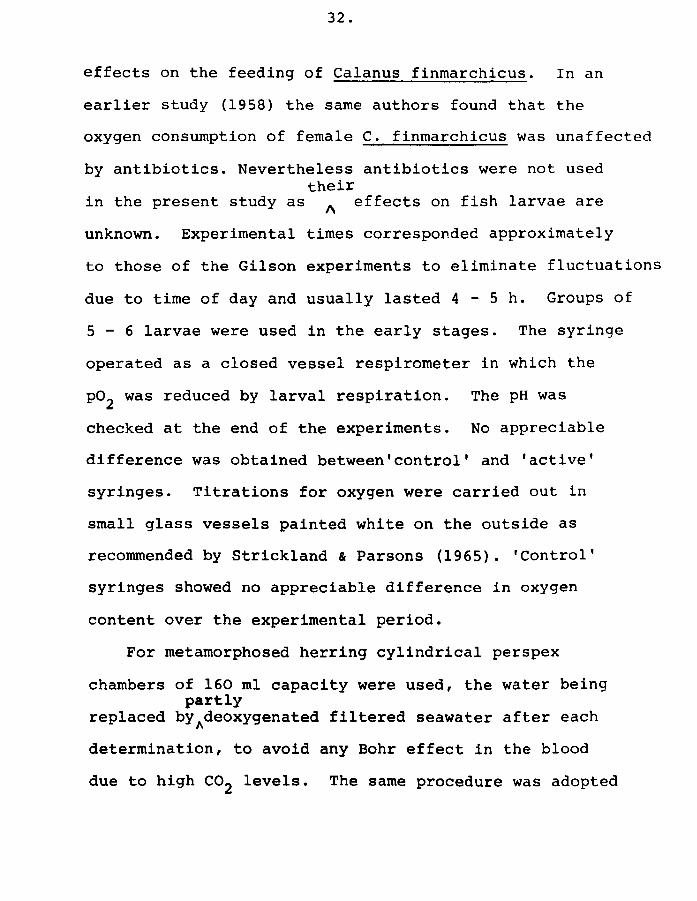
Fig.3. Apparatus used for the LOSO experiments.
Page 24
FRACTIONATI NG COLUMN
GLASS MARBLES
FISH CHAMBER
Page 25
12.
experiments. The temperature range of the experimental
water corresponded to the temperature at which the larvae
were reared and ranged from SO - l30 C over the full
rearing period. Temperature changes throughout the
experimental period of 12 h was O.50 C which was about
equivalent to the temperature ranges of the rearing
tanks during the same time. Fish were observed
continuously during the lethal experiments and at ha1f
hourly intervals during the higher oxygen levels. An
experimental period of l2h was chosen because of the
problems of rapidly growing larvae and as such a dosage
period of 96h which is postulated as being the best time
interval for large fish (Fry, 1971) would not be practical.
I.3. Results.
I.3.l. Statistical procedures for lethal oxygen experiments
When larvae are exposed to lethal levels of oxygen the
pattern of mortality was found to be similar to that of
other time-effect relations e.g. bioassay work of Bliss
(1952), studies of lethal temperature relationships by
Brett (1952), lethal oxygen level by Sheppard (1955).
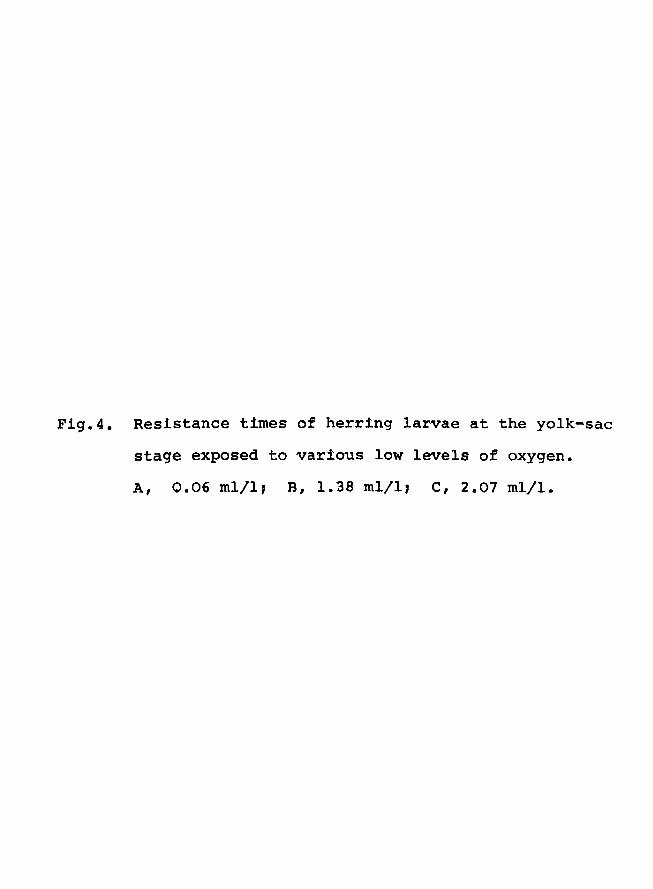
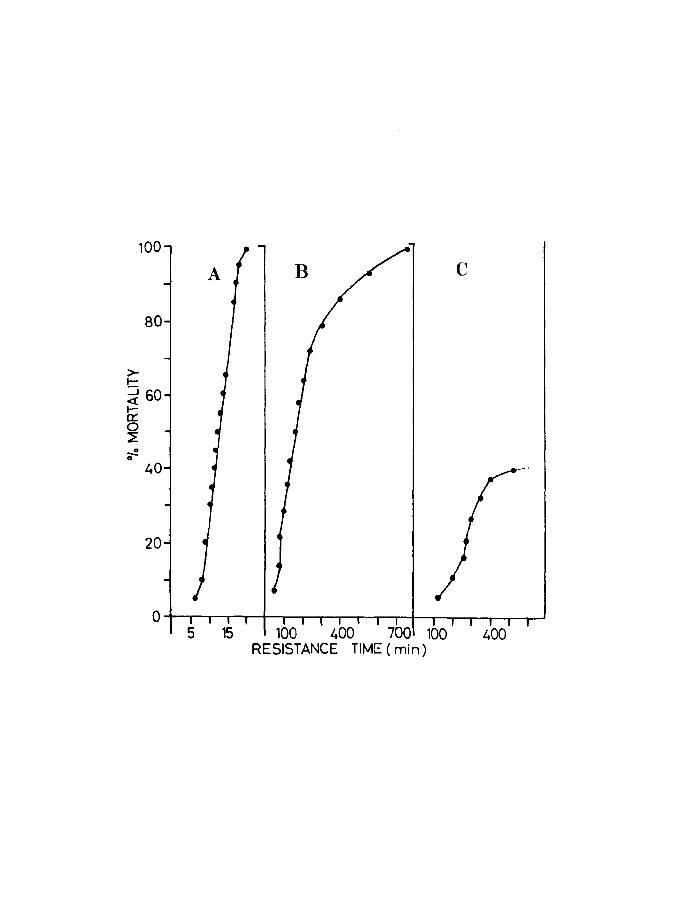
The mortality curves are basically
of 3 types (see Fig.4). At very lethal levels of oxygen,
mortality occurs rapidly and uniformly throughout the
experiment (Curve A). At slightly higher levels of oxygen
Page 26
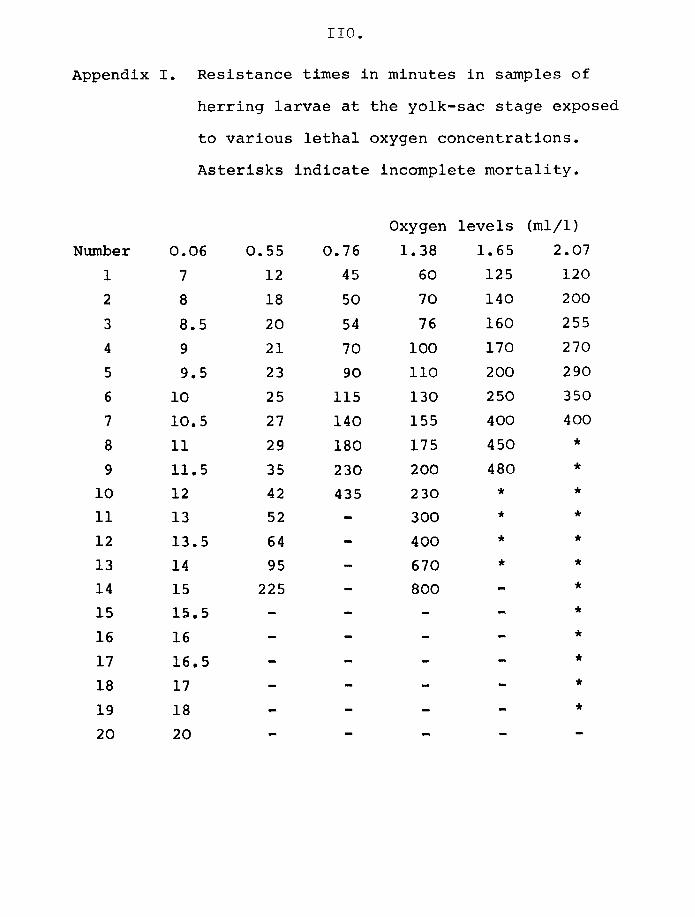
Fig.4. Resistance times of herring larvae at the yolk-sac
stage exposed to various low levels of oxygen.
A, 0.06 m111, a, 1.38 m1/1, C, 2.07 mIll.
Page 27
>I-
100
80
<t 60 Ia::: o ~
40
20
A c
5 15 100 400 700 100 400 RESISTANCE TIME (min)
Page 28
13.
(Curve B) 100% mortality takes place but the intervals
between successive deaths increases throughout the
experiment. This set of points shows the typical
asymmetrical sigmoid curve characteristic of many
experiments where the animals are exposed to lethal
conditions. At relatively higher oxygen concentration
(Curve C) there is incomplete mortality during the
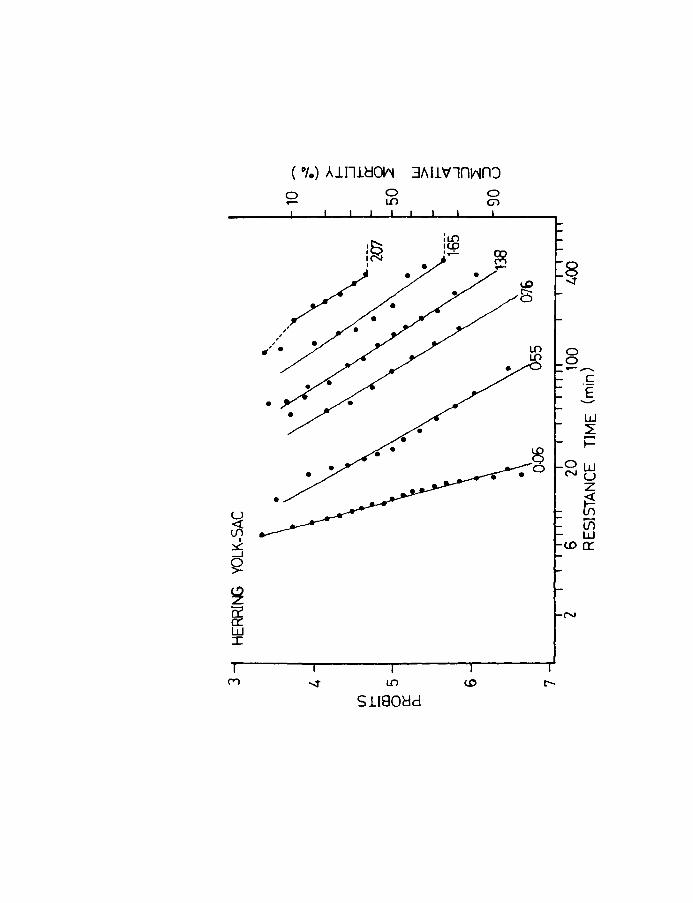
experimental period. When the data in Fig.4 is replotted
with the cumulative mortality expressed as units of
standard deviation (probits) and the resistance times
transposed into logarithms of time the points can be
resolved into approximate straight lines (Fig.S).
As is evident the best fit is obtained in the range
of 4 - 6 probits i.e., between 16 and 84% mortality.
The slopes of the lines tend to decrease as the
resistance times increase. From this graph the LTSO
or the time to SO% mortality for each dose can be
obtained. The median effective dose i.e., the dose
which will produce a response in half the population in
12 hours, which is thus the mean tolerance limit or LDSO
and its confidence limits were determined by the bioassay
technique of Litchfield & Wilcoxen (1947 & 1949). The
method is comparable to the dosage mortality of Bliss
(1935,1937, as cited by Sheppard, 1955).
Page 29
Fig.5. Time mortality curves for herring larvae at the
yolk-sac stage exposed to various dosages of
lethal oxygen concentration. Note that mortality
is-expressed as cumulative % dying and as a
probit. Broken line indicates incomplete mortality.
Oxygen concentration is given in ml/l.
Page 30
( °/.) Allll~~ 3AI1'VlnHnJ
o o LC1
S1I80tid
o Ci)
LC1 0 0 ..... ,....
.~ E
w ~ ;::
Ow NU
Z ~ U)
Vi w
lOa::
N
Page 31
14.
I.3.2. Behaviour of larvae during lethal experiments
When exposed to lethal oxygen concentrations the
larvae tended to swim around very actively. As the
oxygen content decreased further the rate of ventilation
increased in the older larvae, the operculae described
wider arcs and in the later developmental stages (mainly
metamorphosed fish) both herring and plaice tended to
swim upside down. Following cessation of respiratory
movements in the metamorphosed fish the opercula fanned
out and the mouth was opened to its widest extent. The
metamorphosed plaice which tended to lie on the bottom
on exposure to lethal oxygen concentrations tended to
swim in short bursts, lying on the bottom between each
successive burst of swimming, but with time tended to
show continuous active swimming movements finally turning
upside down. The latter is repeated a number of times
before cessation of respiratory movement. The larvae
were considered to be 'dead' when the brain became opaque
and there was no movement.
I.3.3. Lethal oxygen level and resistance time
In general the resistance to low oxygen varied directly
with the oxygen concentration of the environment and at very
low oxygen concentrations mortality occurred rapidly. The
results of a typical series of experiments for herring and
Page 32
15.
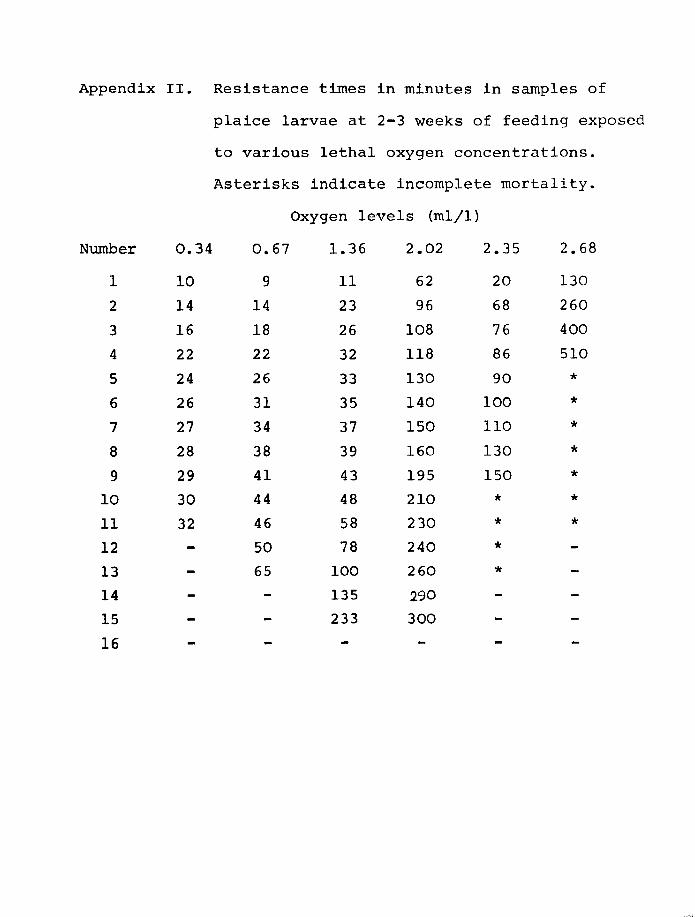
plaice are shown in Figs 5 and 6 and Appendix I and 2.
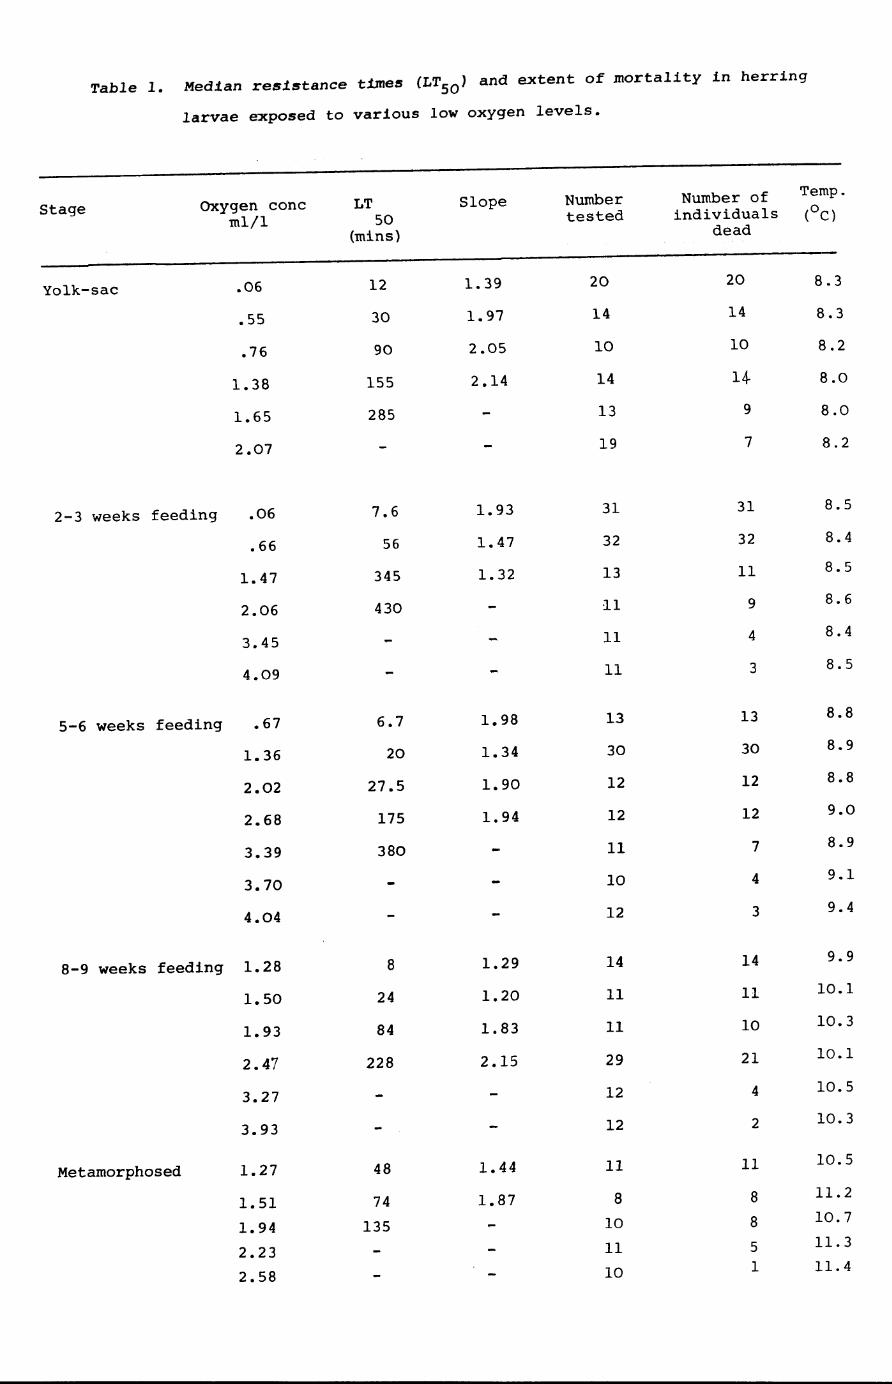
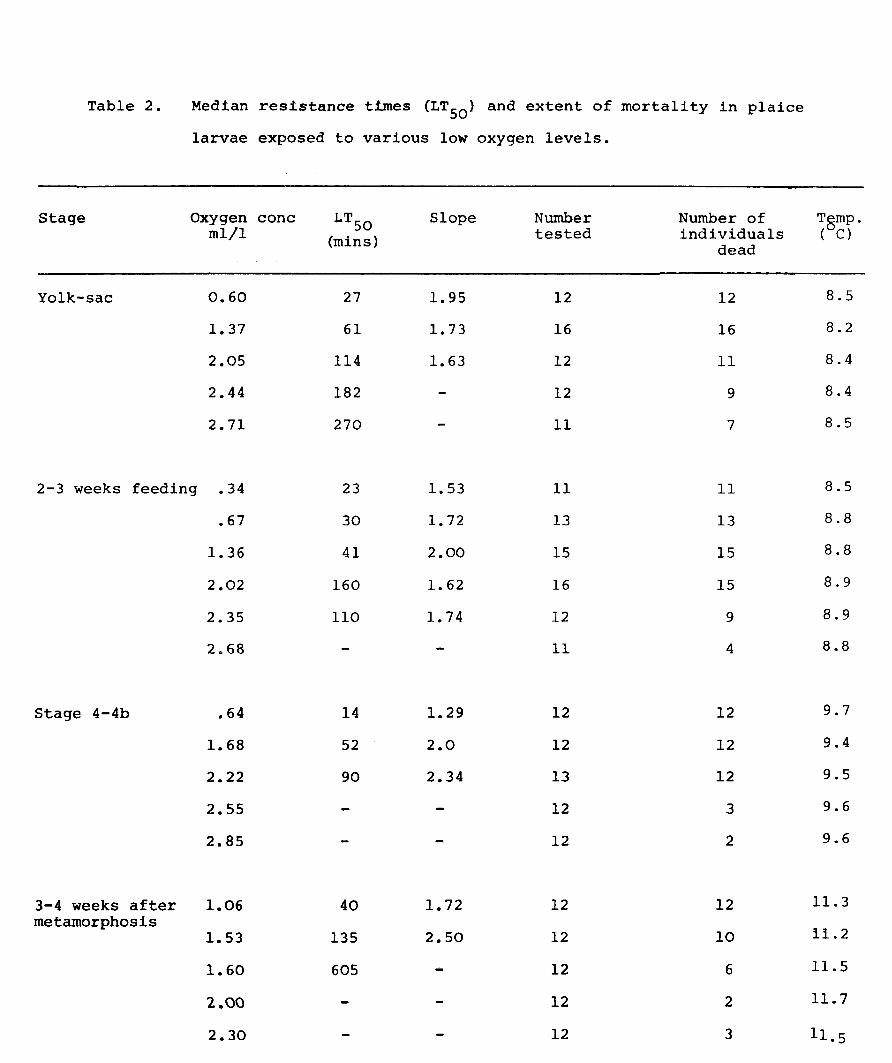
The full LTSO results are given in Table 1 for herring
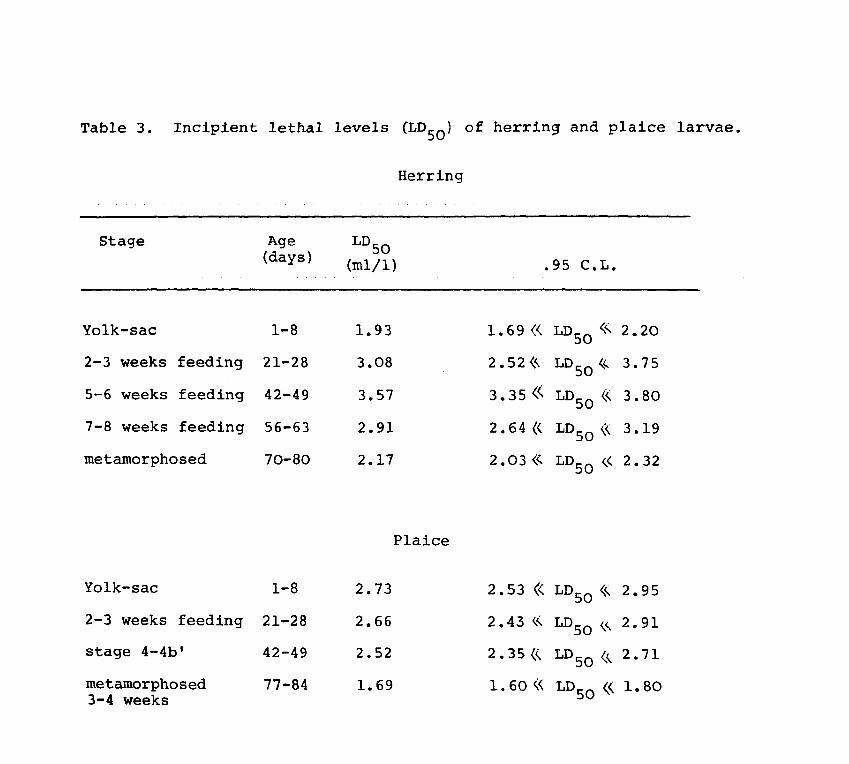
and Table 2 for plaice. The LDSO values and their
confidence limits for both species are given in Table 3.
From Table 3 it is evident that there is a change
in the incipient lethal level or LDSO with development in
both species. An increase in the LDSO value is obtained
up to 5 wks of feeding in herring and a decrease thereafter.
In plaice there is a decrease in the LDso levels with time
but the LDSO levels are not very significantly different
in the young larvae when compared to the later stages.
The survival time below the LDSO in the later stagesw~s
much lower than in the earlier developmental stages in
both species. This appears to be a contradiction but can
be explained on the basis of the difference in size at
these stages. In the early developmental stages larvae
are much smaller and their oxygen requirements are small
and therefore they will be able to survive for a longer
time below the median lethal dose. In the older larvae
the oxygen requirements will be greater resulting in a
shorter survival time below the LDSO level.
1.4. Discussion.
The results show a considerable degree of tolerance
to low oxygen especially in herring. It is interesting
Page 33
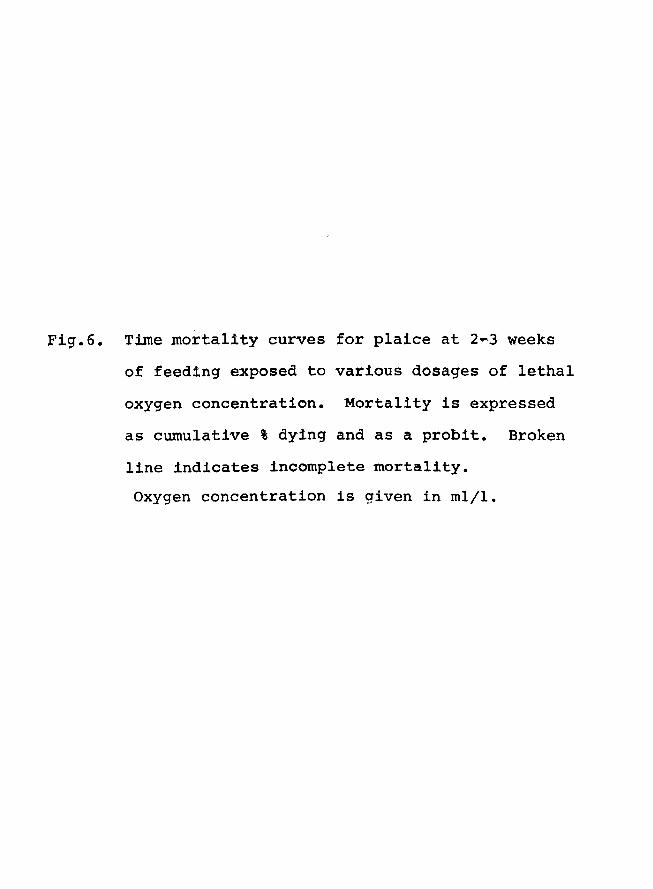
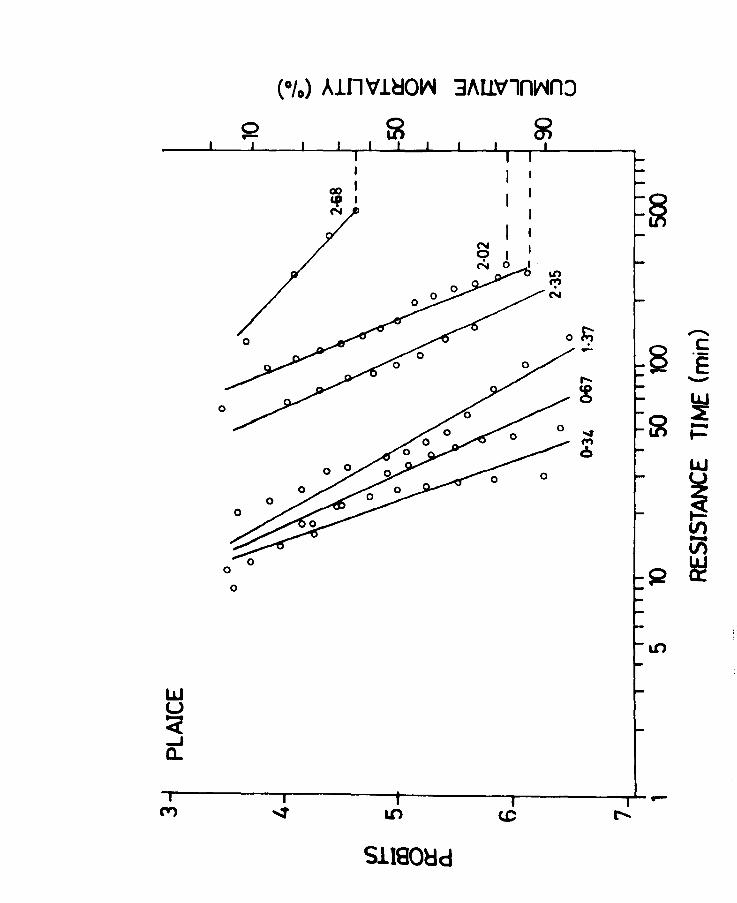
Fig.6. Time mortality curves for plaice at 2~3 weeks
of feeding exposed to various dosages of lethal
oxygen concentration. Mortality is expressed
as cumulative % dying and as a probit. Broken
line indicates incomplete mortality.
Oxygen concentration is given in ml/l.
Page 34
LaJ U
< ....J a..
0
0
(%) A1Il 'V l~O~ 3AllVln~nJ
>2 @ ~
I I
~
":' N
o I:;
,... ~
~ ,.., 0
s;2
,---------,---------~------------------~-Ll')
Sl180~d
~
c: "E
"'-'"
~ -t-LaJ
~ en Vi ~
Page 35
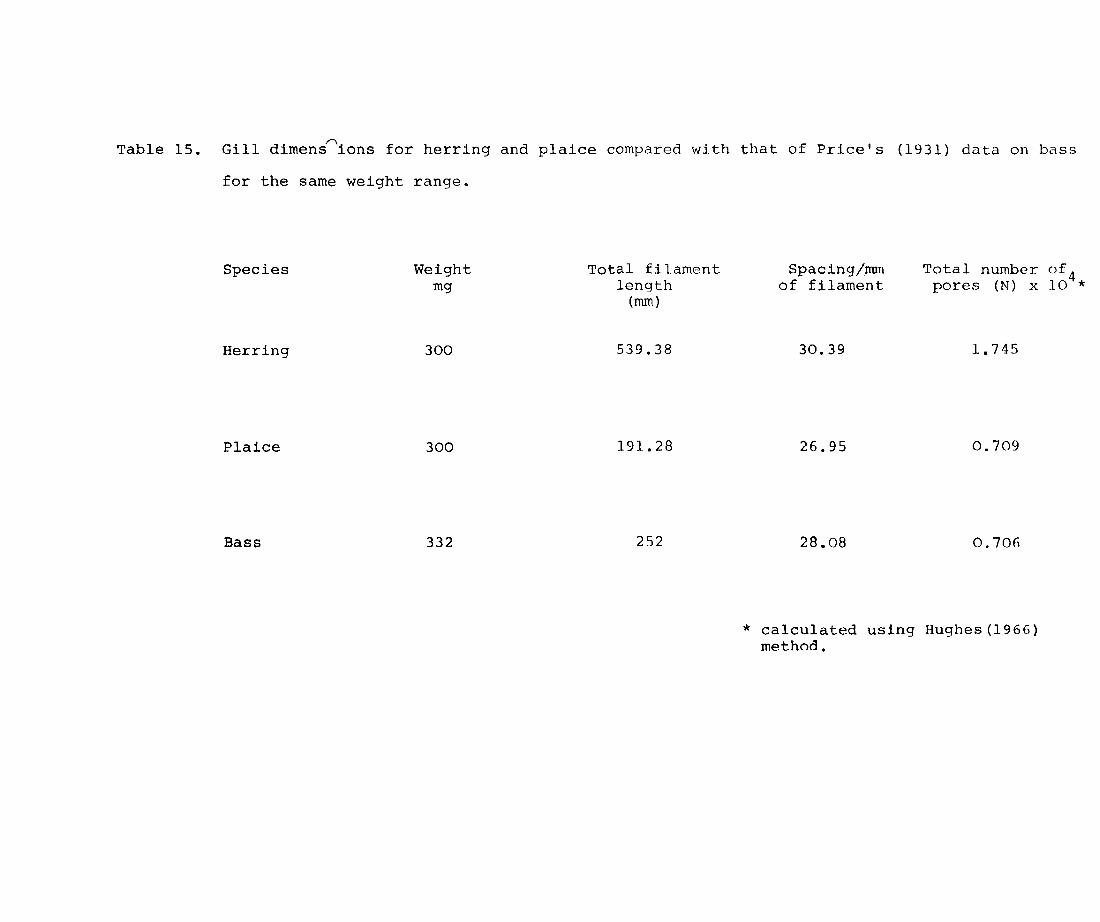
Table 1. Median resistance times (LTSO) and extent of mortality in herring
larvae exposed to various low oxygen levels.
Stage OXygen cone LT Slope Number Number of Temp.
mIll 50 tested individuals (oC)
(mins) dead
Yolk-sac .06 12 1.39 20 20 8.3
.55 30 1.97 14 14 8.3
.76 90 2.05 10 10 8.2
1.38 155 2.14 14 14- 8.0
1.65 285 13 9 8.0
2.07 19 7 8.2
2-3 weeks feeding .06 7.6 1.93 31 31 8.5
.66 56 1.47 32 32 8.4
1.47 345 1.32 13 11 8.5
2.06 430 11 9 8.6
3.45 11 4 8.4
4.09 11 3 8.5
5-6 weeks feeding .67 6.7 1.98 13 13 8.8
1.36 20 1.34 30 30 8.9
2.02 27.5 1.90 12 12 8.8
2.68 175 1.94 12 12 9.0
3.39 380 11 7 8.9
3.70 10 4 9.1
4.04 12 3 9.4
8-9 weeks feeding 1.28 8 1.29 14 14 9.9
1.50 24 1.20 11 11 10.1
1.93 84 1.83 11 10 10.3
2.47 228 2.15 29 21 10.1
3.27 12 4 10.5
3.93 12 2 10.3
Metamorphosed 1.27 48 1.44 11 11 10.5
1.51 74 1.87 8 8 11.2
1.94 135 10 8 10.7
2.23 11 5 11.3
2.58 10 1 11.4
Page 36
Table 2.
Stage
Yolk-sac
Median resistance times (LT50 ) and extent of mortality in plaice
larvae exposed to various low oxygen levels.
Oxygen cone l.TSO Slope Number Number of mIll (mins) tested individuals
dead
0.60 27 1. 95 12 12
1. 37 61 1. 73 16 16
2.05 114 1.63 12 11
2.44 182 12 9
2.71 270 11 7
2-3 weeks feeding .34 23 1. 53 11 11
Stage 4-4b
3-4 weeks after metamorphosis
.67
1.36
2.02
2.35
2.68
.64
1.68
2.22
2.55
2.85
1.06
1.53
1.60
2.00
2.30
30
41
160
110
14
52
90
40
135
605
1. 72 13 13
2.00 15 15
1. 62 16 15
1. 74 12 9
11 4
1.29 12 12
2.0 12 12
2.34 13 12
12 3
12 2
1.72 12 12
2.50 12 10
12 6
12 2
12 3
Tbrnp. ( C)
8.5
8.2
8.4
8.4
8.5
8.5
8.8
8.8
8.9
8.9
8.8
9.7
9.4
9.5
9.6
9.6
11. 3
11.2
11.5
11.7
11.5
Page 37
Table 3. Incipient lethal levels (LOS 0 , of herring and plaice larvae.
Stage
Yolk-sac
2-3 weeks feeding
5-6 weeks feeding
7-8 weeks feeding
metamorphosed
Yolk-sac
2-3 weeks feeding
stage 4-4b'
metamorphosed 3-4 weeks
Age (days)
1-8
21-28
42-49
56-63
70-80
1-8
21-28
42-49
77-84
LDSO (m1/1)
1.93
3.08
3.57
2.91
2.17
Herring
Plaice
2.73
2.66
2.52
1. 69
.9S C.L.
1.69« LDSO <<.. 2.20
2 • S2 <<. LDSO ,<- 3.75
3.3S ,< LD50 « 3.80
2.64« LD50 (<. 3.19
2 • 03 (<' LDSO <.< 2. 32
2.S3 « LDSO <<.. 2.95
2 • 43 <.<. LD50 <.<... 2.91
2 • 35 <<. LD 50 (, 2. 71
1. 60« LDSO ( 1.80
Page 38
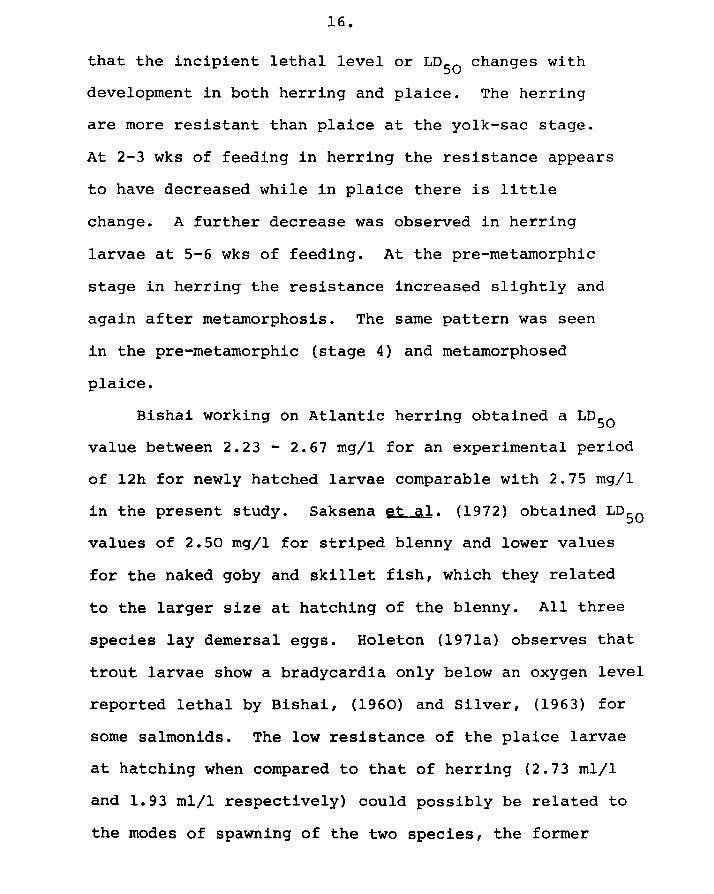
16.
that the incipient lethal level or LDSO changes with
development in both herring and plaice. The herring
are more resistant than plaice at the yolk-sac stage.
At 2-3 wks of feeding in herring the resistance appears
to have decreased while in plaice there is little
change. A further decrease was observed in herring
larvae at 5-6 wks of feeding. At the pre-metamorphic
stage in herring the resistance increased slightly and
again after metamorphosis. The same pattern was seen
in the pre-metamorphic (stage 4) and metamorphosed
plaice.
Bishai working on Atlantic herring obtained a LOso
value between 2.23 - 2.67 mg/l for an experimental period
of l2h for newly hatched larvae comparable with 2.75 mgll
in the present study. Saksena et al. (1972) obtained LDSO
values of 2.50 mgJl for striped blenny and lower values
for the naked goby and skillet fish, which they related
to the larger size at hatching of the blenny. All three
species lay demersal eggs. Holeton (197la) observes that
trout larvae show a bradycardia only below an oxygen level
reported lethal by Bishai, (1960) and Silver, (1963) for
some salmonids. The low resistance of the plaice larvae
at hatching when compared to that of herring (2.73 mIll
and 1.93 mIll respectively) could possibly be related to
the modes of spawning of the two species, the former
Page 39
17.
laying pelagic and the latter demersal eggs. Thus there
is a greater chance of yolk-sac herring larvae finding
themselves in water of low oxygen concentration in and
around the layers of eggs on the spawning ground.
The decrease in the survival time (LTSO) below the
LOSO levels in the older larvae is associated with the
increased oxygen requirements at these stages.
The changes in LOSO with age in both species could be
explained on the basis of development of the branchial
apparatus. In herring the secondary lamellae appear
on the gill filaments at about the 20mm stage (Harder,
1954; see Part four of this study) corresponding to
about S weeks of feeding. In plaice it appears at
about 4 weeks of feeding (stage 3). There is a rapid
growth of the gills of both species up to metamorphosis,
after which it slows down. The increased resistance
after metamorphosis could be explained in terms of the
development of respiratory pigment at this stage (see
part five of this study).
Page 40
18.
PART TWO. OXYGEN UPTAKE AT NORMAL OXYGEN CONCENTRATION
11.1. Introduction
The respiratory rates of demersal and planktonic
eggs and larvae of marine fish give an assessment of
oxygen requirements. Yet measurements of oxygen uptake
of planktonic fish eggs and larvae have been confined
to very few species e.g. the plaice (Burfield, 1928).
Lasker & Theilacker (1962) measured oxygen consumption
in relation to salinity changes in the embryo of the
Pacific sardine (Sardinops caerulea), while Alderdice
& Forrester (1968) studied oxygen uptake in eggs of the
English sole (Parophrys vetulus~. Demersal fish eggs and
larvae have been studied by a few workers such as Hymen
(1921) and Amberson & Armstrong (1933) on Fundulus
heteroclitus. Of particular interest to the study are
the measurements of oxygen uptake of herring larvae
made by Marshall, Nicholls & Orr (1937) who compared
the uptake in relation to light and darkness. Holliday,
Blaxter & Lasker (1964) compared O2 uptake in relation to
rearing salinity to test the effects of osmotic stress.
More recently Stelzer, Rosenthal & Siebers (1971) measured
the effect of dinitrophenol (inhibitor of oxidative
phosphorylation) on the oxygen uptake of the herring embryo.
Page 41
19.
A number of observations have been made on freshwater
species. Nakano (1953 cited by Blaxter, 1969) worked on
oxygen uptake during maturation and fertilization in
Oryzias latipes. Ivlev (1960) studied metabolic
intensity in salmon fry(Salmo sa1ar ),while Hayes, Wilmot
and. Livingstone (1951) studied the uptake of
salmon eggs.
Oxygen consumption measurements have been used almost
universally to determine the metabolic rate of fish.
Nevertheless, Fry (1971) says that "it cannot be assumed
that all fish are obligate aerobes and that a measure of
oxygen consumption is always a measure of the metabolic
rate". Fry (1957 in Brown) distinguished between three
levels of oxygen consumption.
(1) Standard
(2) Routine
(3) Active
Standard oxygen consumption is the oxygen consumption
in the post absorptive state and when exhibiting zero
locomotor activity.
Routine oxygen consumption is the rate of oxygen
consumption of an organism when exhibiting natural
spontaneous locomotor activity.
Active oxygen consumption is the rate of oxygen
consumption at maximum locomotor activity.
Page 42
20.
In this study measurements of routine uptake was
made for both species of larvae.
11.2. Methods
The oxygen uptake of both species was measured in
a Gilson differential respirometer at 100C (~O.loC).
A temperature of lOoe was chosen as this seemed to be
the average temperature experienced by the larvae from
hatching to metamorphosis. The larvae were reared at
the experimental temperature of 100e in a constant
temperature room. The temperature never varied by
+ 0 more than - 0.2 C.
In the early stages flasks of 16 ml capacity each
containing 10 larvae in 5 ml of water were used. The
number was decreased as the larvae grew older. An
equilibration time of 1 hour was allowed prior to the
start of the experiment. Thermoblanks were run with
each experiment to correct for ambient temperature
changes (Carver & Gloyne, 1971). Flasks of 85 ml capacity
containing 30 m1 of water were used for the larger herring
larvae and for the metamorphosed plaice, flasks of 25 m1
capacity with 7 m1 of water. Readings were taken hourly for
a maximum period of 5 h. The larvae were transferred to
filtered (Whatman glass filters GF/C) seawater overnight
to defaecate. A second transfer was made before final
Page 43
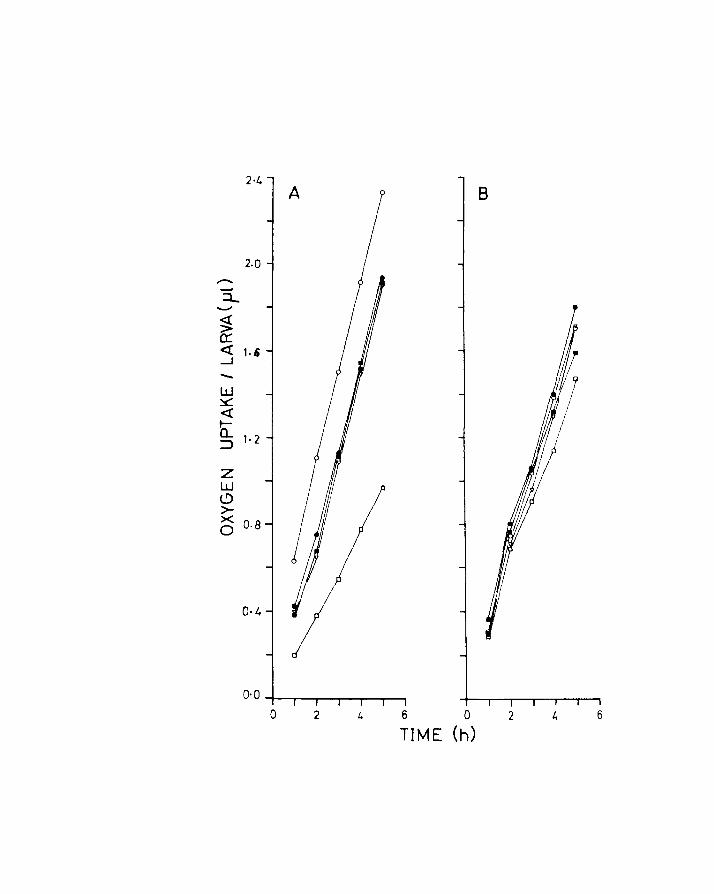
21.
transfer to the experimental vessels. Uptake over the
5 h period was fairly uniform (Figs 7A & B), at all the
stages, except for the pre-metamorphic herring where
the experiments were terminated after 1 or 2 readings,
the larvae being very active at these stages. In fact
it was necessary to anaesthetize the larvae before
transfer to the experimental vessel, readings being
taken after recovery from the anaesthetic.
In an attempt to obtain a measure of the basal
metabolism the larvae were placed in an anaesthetic
solution (1:20,000 MS 222 SANDOZ). The concentration
was varied with age, the level of anaesthesia produced
corresponding approximately to stage 1 in the classification
proposed by McFarland (1960). Routine metabolism (Fry,
1957) was obtained from unanaesthetized larvae in flasks
which were only shaken during a brief equilibration
period at the end of each hourly interval.
Many authors (Fry, 1957; Winberg, 1960; Brett, 1962;
Paloheimo & Dickie, 1966) have drawn attention to the
need for homogeneity of material in any measurements of
oxygen uptake in fish. For herring, all the larvae used
were from one female even though egg size and larval size
from one female may vary by a factor of 1.5 (Blaxter &
Hempel,1963). Larvae from two different stocks were
used in the case of plaice, due to the lack of large
Page 44
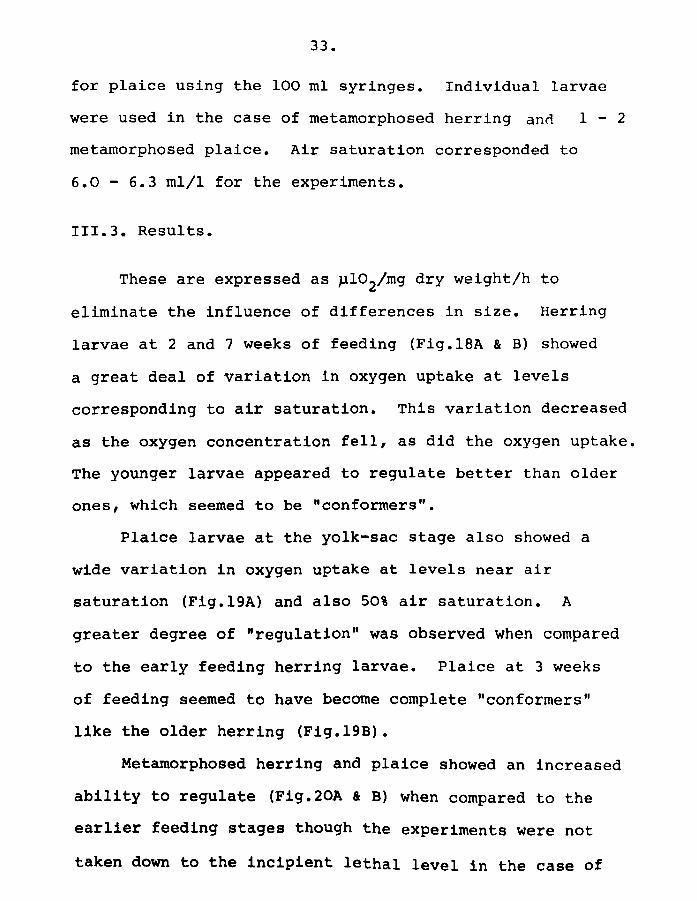
Fig.7. Uptake of oxygen over a 5 h period of unanaesthetized
larvae at the yolk-sac stage. Each flask is denoted
by a different symbol. Each pOint represents the
average value for a larva for that particular flask.
A. Herring
B. Plaice
Page 45
A 8
2·0 ..-..
:::l.... ........
~ 0: <l: ...J
,., -W ~
< I-CL '·2 ~
Z W (!) >-X 0·8 0
0·4
o 2 t.. 6 0 6
TIME (h)
Page 46
22.
numbers of larvae from one stock. Larvae were matched
for size in the experiments.
At the end of the experiments the organisms were
weighed after drying to constant weight in an oven at
60o
C.
In the early eggs the chorion only was removed,
and therefore the dry weights included both embryos and
yolk. In later eggs and in yolk-sac larvae, the yolk
was dissected out after fixation of the larva in
formalin 0 The larval bodies were then washed in
distilled water and dried to constant weight. Weighing
of eggs and small larvae were made on a Beckman
Microbalance Model EMBl and larger larvae on a Mettler
Balance Model HlO/H20. Thus the 002 (uI02/mg dry wt/h)
could be calculated based on actively respiring tissue
except in the case of early stage eggs.
II.3. Results
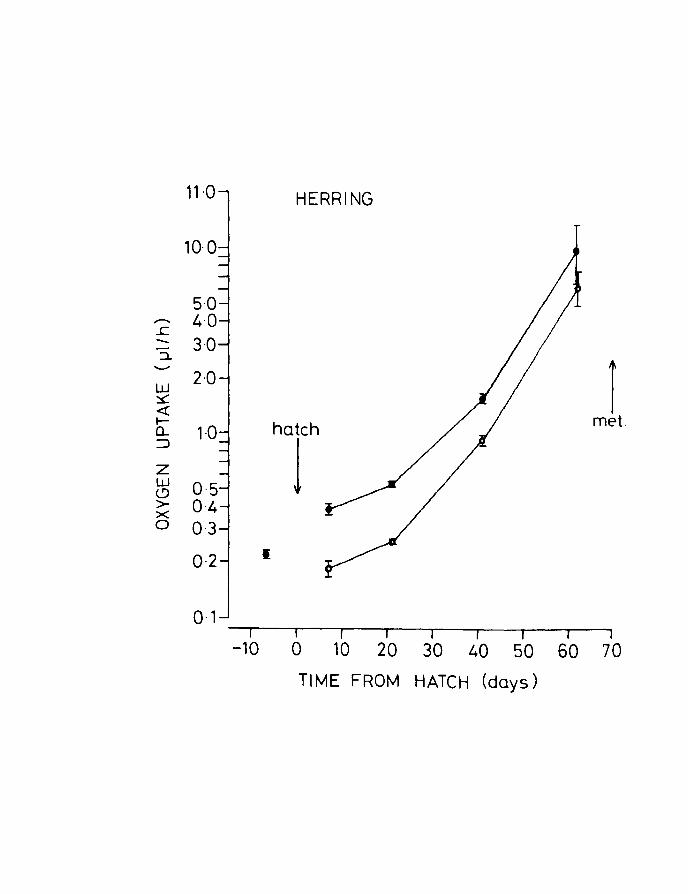
The combined results obtained from eggs, unanaesthetized
and anaesthetized larvae of herring are shown in Fig.B. An
increase in uptake per larva was observed with development,
there being an increase in the slope of the relationship
after the commencement of feeding. Variability also
Page 47
Fig.8. Oxygen uptake of eggs and larvae of herring with
age at 10oe. Upper line, unanaesthetized larvae;
lower line, anaesthetized larvae. Vertical lines
+ indicate - 2 S.E. Larvae started feeding between
5 and 10 days post hatching. Egg dry weight includes
yolk.
Page 48
11·0 HERRI NG
10. 0
5·0 ;--. 4·0 ..!: - 3·0 ::1.
I ..........
w 2·0 ~ «
met. I- hatch 0... 1 ·0 :::J
1 z w 0·5 <.? > 0·4 >< 0 0·3
0·2 I
0·1 r I r I r r r I I
-10 0 10 20 30 40 50 60 70
TIME FROM HATCH (days)
Page 49
23.
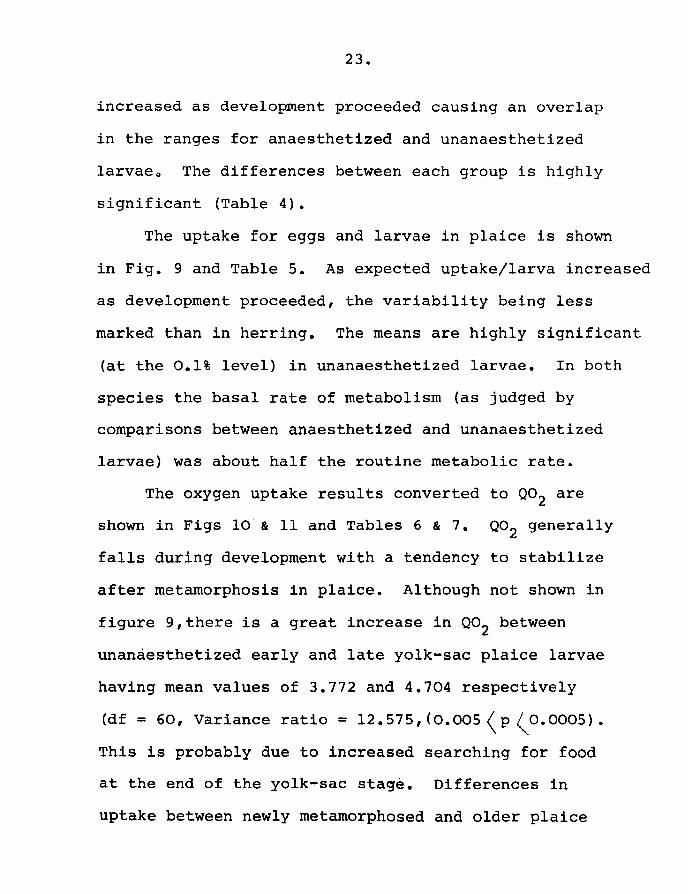
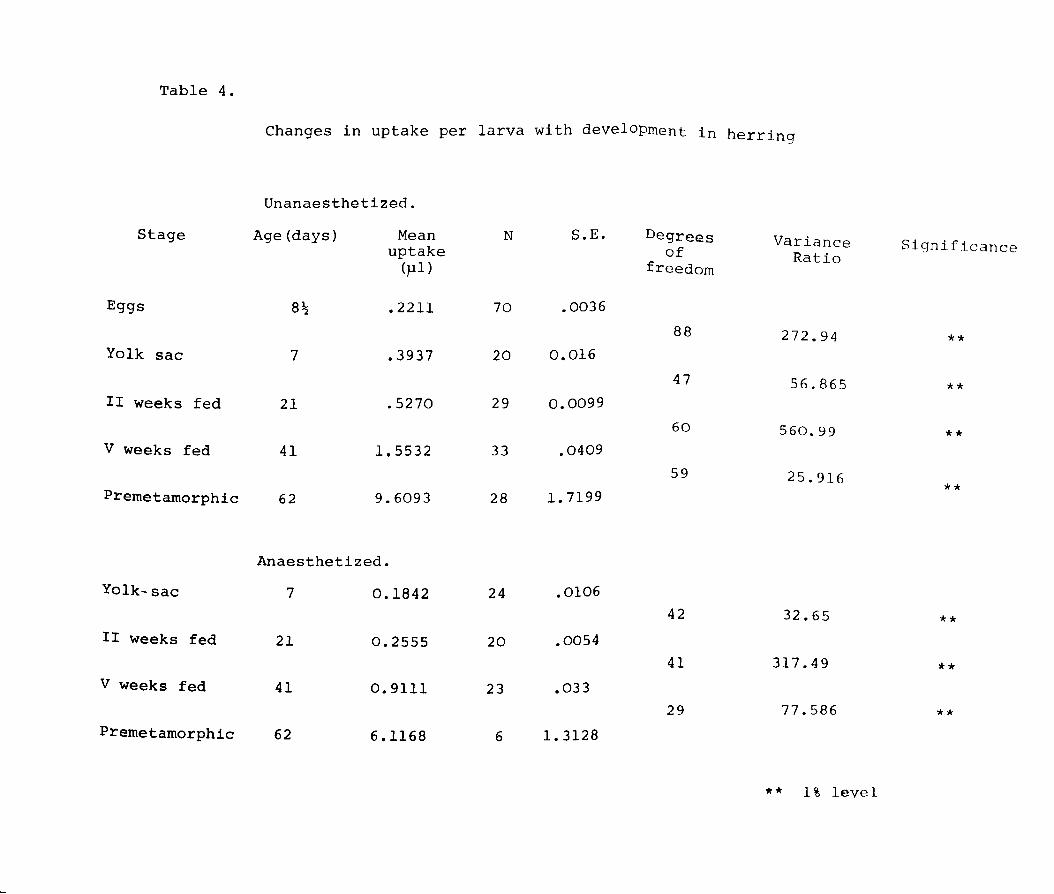
increased as development proceeded causing an overlap
in the ranges for anaesthetized and unanaesthetized
larvae o The differences between each group is highly
significant (Table 4).
The uptake for eggs and larvae in plaice is shown
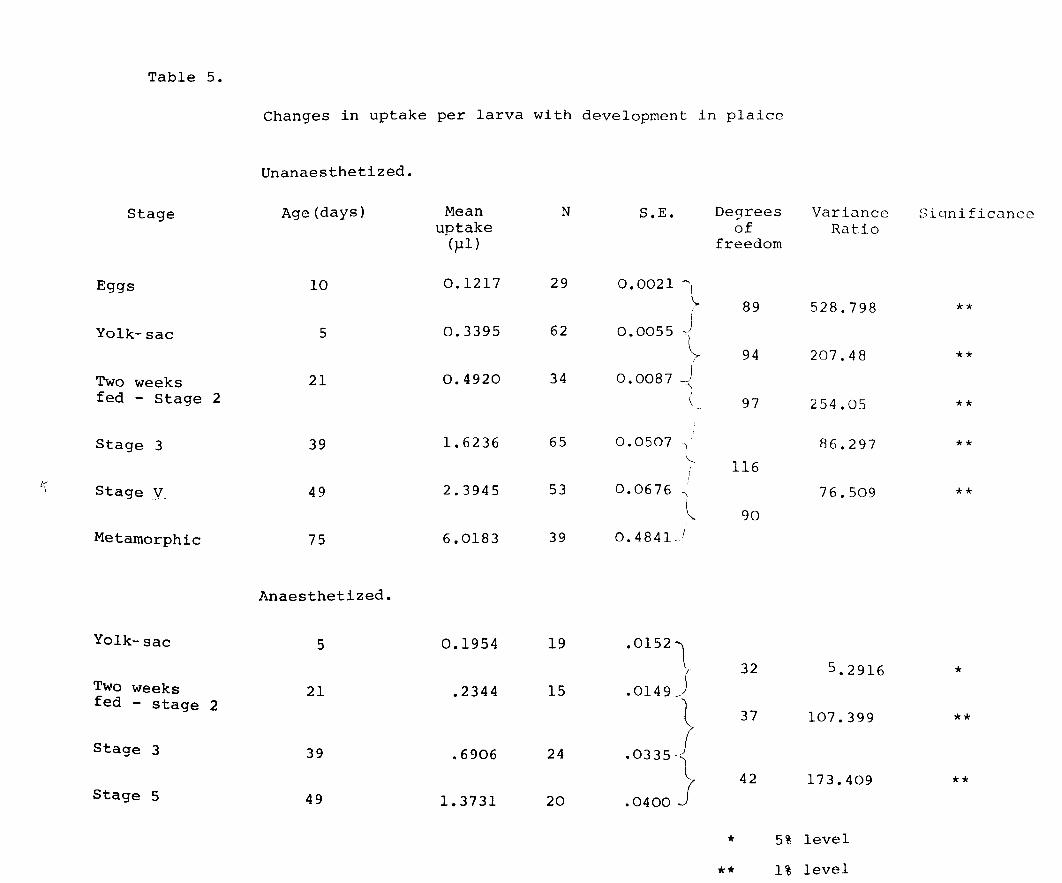
in Fig. 9 and Table 5. As expected uptake/larva increased
as development proceeded, the variability being less
marked than in herring. The means are highly significant
(at the 0.1% level) in unanaesthetized larvae. In both
species the basal rate of metabolism (as judged by
comparisons between anaesthetized and unanaesthetized
larvae) was about half the routine metabolic rate.
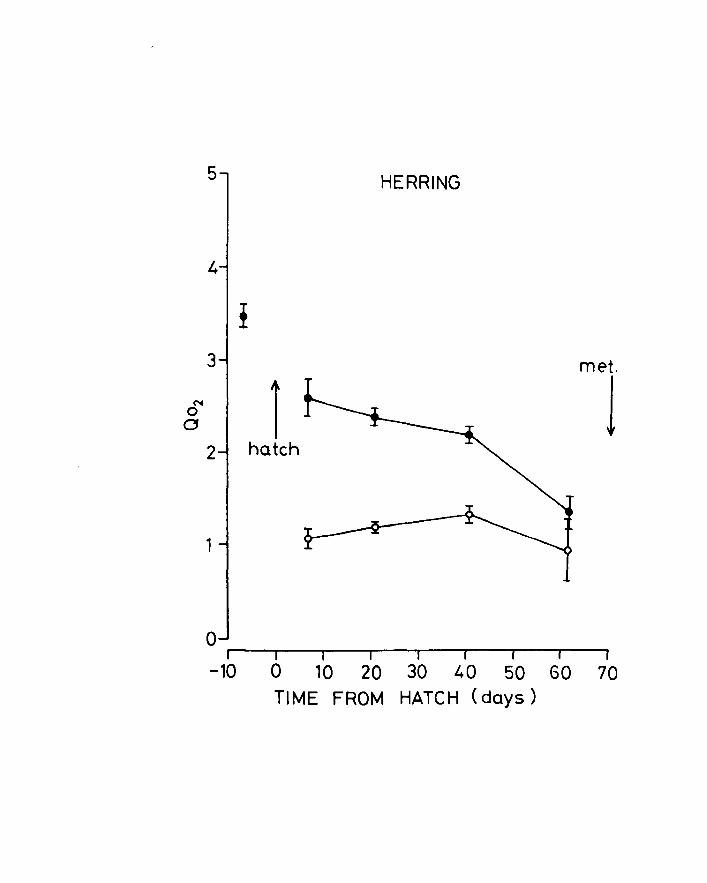
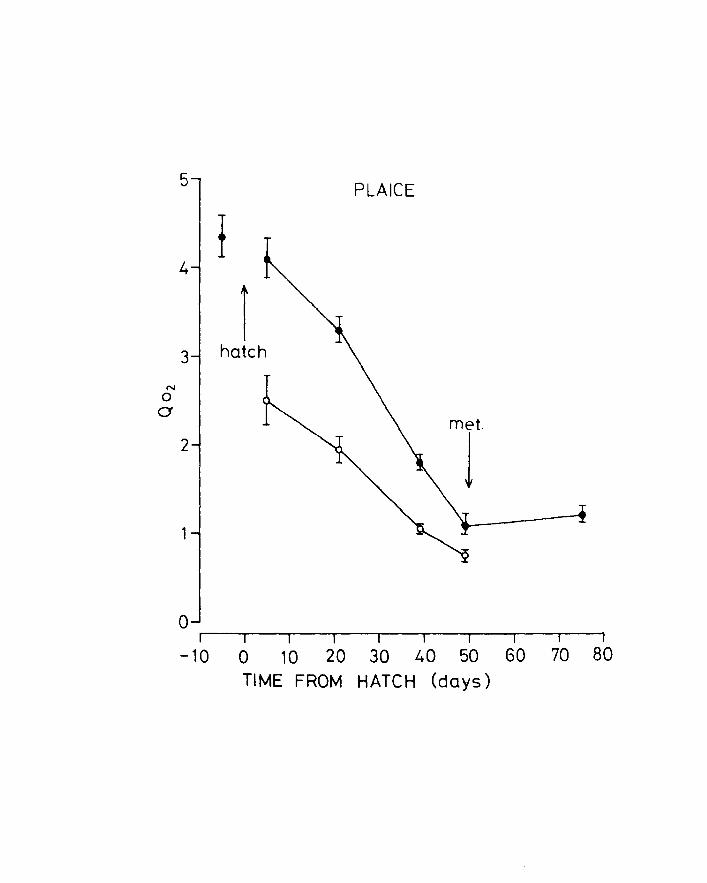
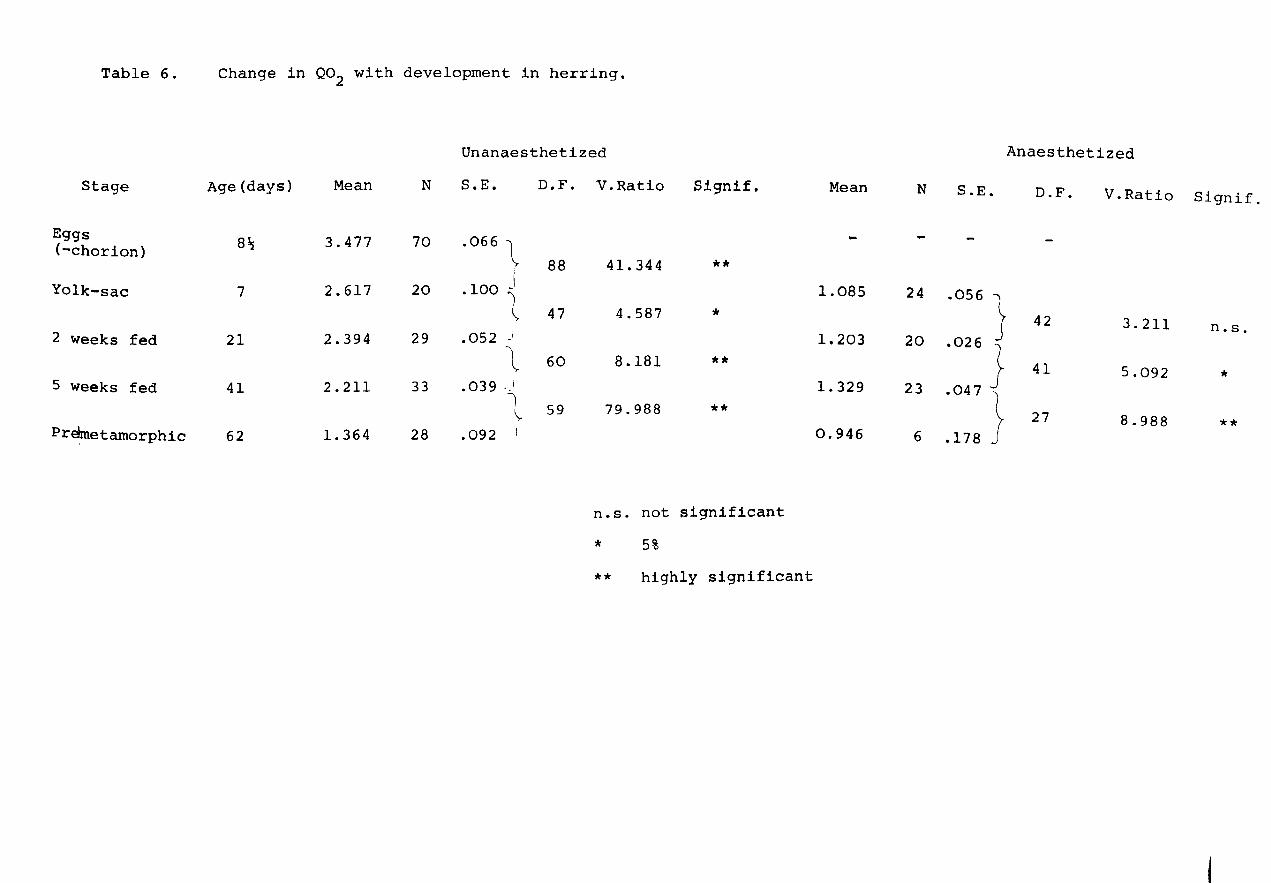
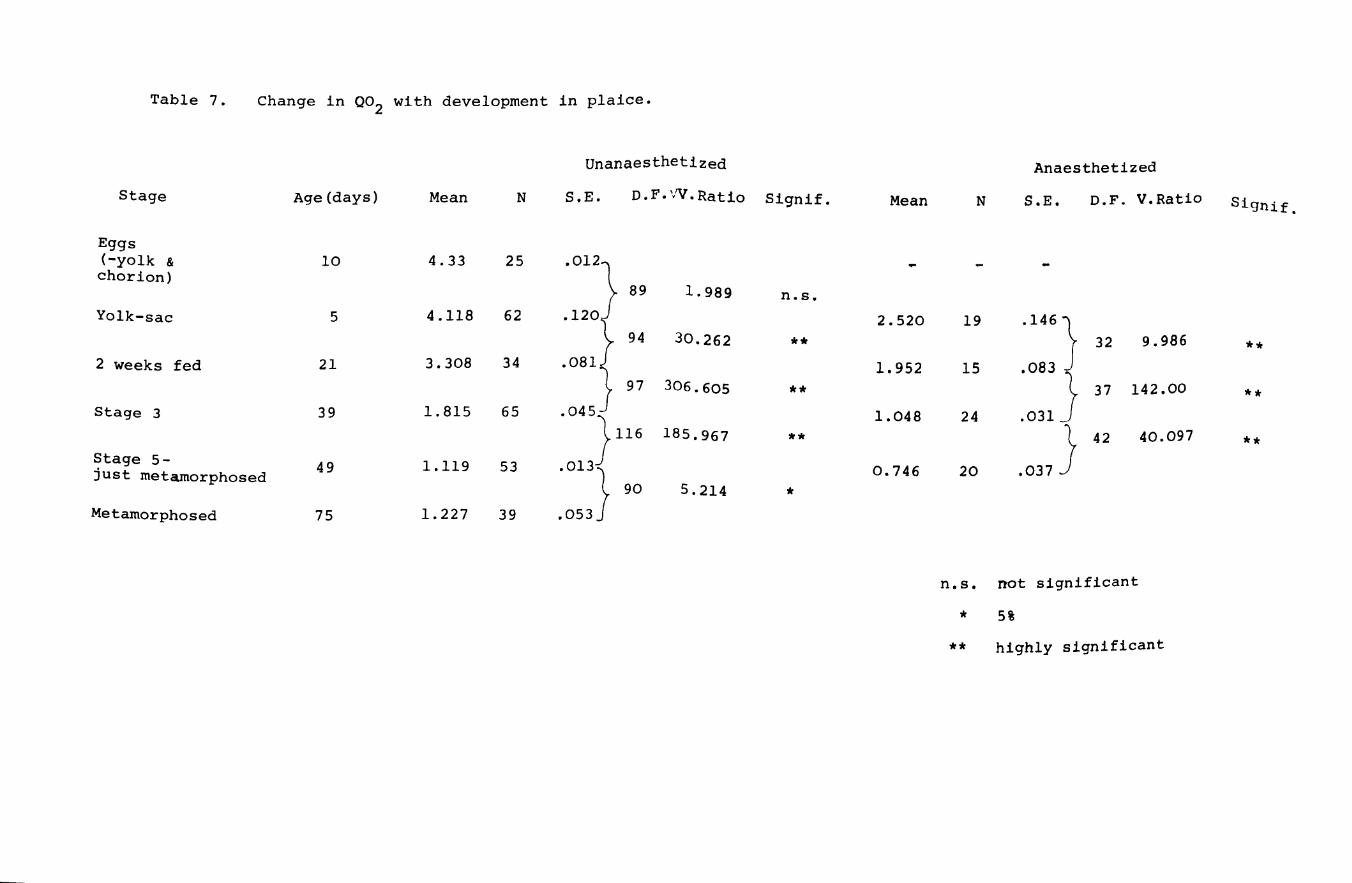
The oxygen uptake results converted to Q02 are
shown in Figs 10 & 11 and Tables 6 & 7. Q02 generally
falls during development with a tendency to stabilize
after metamorphosis in plaice. Although not shown in
figure 9,there is a great increase in Q02 between
unanaesthetized early and late yolk-sac plaice larvae
having mean values of 3.772 and 4.704 respectively
(df = 60, Variance ratio = 12.575, (0.005 (p (0.0005).
This is probably due to increased searching for food
at the end of the yolk-sac stage. Differences in
uptake between newly metamorphosed and older plaice
Page 50
Table 4.
Changes in uptake per larva with development in herring
Unanaesthetized.
Stage Age (days) Mean N S.E. Degrees Variance Significance uptake of Ratio (pI) freedom
Eggs 8~ .2211 70 .0036
88 272.94 ** Yolk sac 7 .3937 20 0.016
47 56.865 ** II weeks fed 21 .5270 29 0.0099
60 560.99 ** V weeks fed 41 1. 5532 33 .0409
59 25.916 ** Premetamorphic 62 9.6093 28 1. 7199
Anaesthetized.
Yolk-sac 7 0.1842 24 .0106
42 32.65 ** II weeks fed 21 0.2555 20 .0054
41 317.49 ** V weeks fed 41 0.9111 23 .033
29 77.586 ** Premetamorphic 62 6.1168 6 1. 3128
** 1% level
Page 51
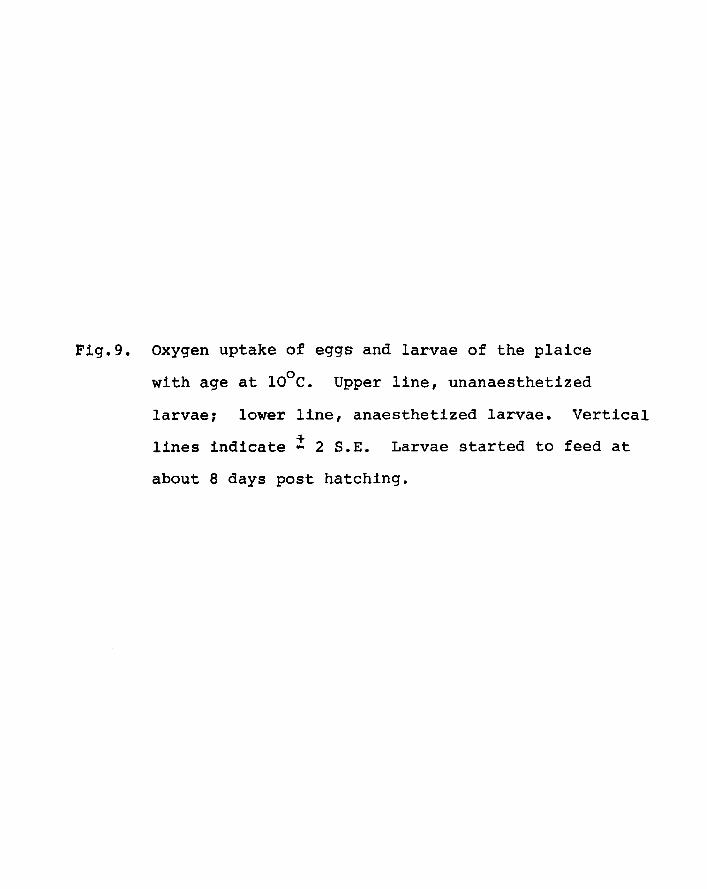
Fig.9. Oxygen uptake of eggs and larvae of the plaice
o with age at 10 C. Upper line, unanaesthetized
larvae; lower line, anaesthetized larvae. Vertical
lines indicate! 2 S.E. Larvae started to feed at
about 8 days post hatching.
Page 53
Table 5.
Changes in uptake per larva with development in plaice
Unanaesthetized.
Stage Age (days) Mean N S.E. De9rees Variance Sicrnificunco uptake of Ratio
(}-II) freedom
Eggs 10 0.1217 29 0.0021 '""' l 89 528.798 ** I
Yolk-sac 5 0.3395 62 0.0055 J -~
94 207.48 ** Two weeks 21 0.4920 34 0.0087 !
-'" fed - Stage 2 ( 97 254.05 **
Stage 3 39 1. 6236 65 0.0507 I R6.297 ** \-.
116 I--
Stage _y 2.3945 53 0.0676 ) 49 -, 76.509 ** l 90
Metamorphic 75 6.0183 39 0.4841. 1
Anaesthetized.
Yolk-sac 5 0.1954 19 • 0152 ~ 32 5.2916 *
Two weeks 21 .2344 15 .0149 ) fed - stage 2
00335? 37 107.399 **
Stage 3 39 .6906 24
42 173.409 ** Stage 5 49 1.3731 20 .0400 j
* 5% level
** 1% level
Page 54
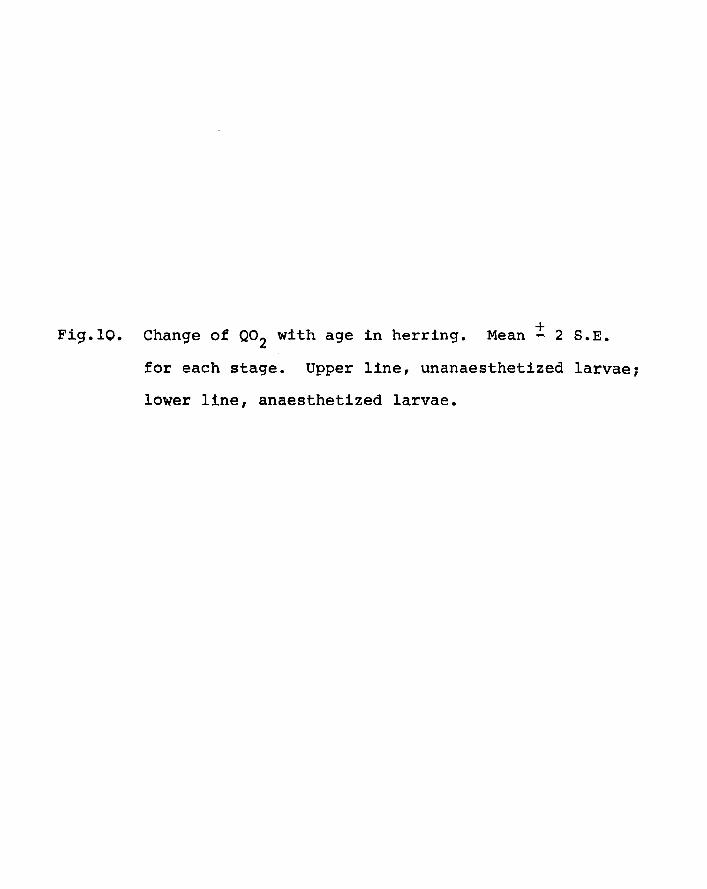
Fig.lO. Change of Q02 with age in herring. + Mean - 2 S.E.
for each stage. Upper line, unanaesthetized larvae;
lower line, anaesthetized larvae.
Page 55
5 HERRING
4
! 3 met.
N 1 1 0 0
2 hatch
1
o ~I --~I--~I---I~~I---'I--'I~-'I--~I
-10 0 10 20 30 40 50 60 70 TIME FROM HATCH (days)
Page 56
Fig .11. Change of Q02 with age in plaice. + Mean - 2 S.E.
for each stage. Upper line, unanaesthetized larvae;
lower line, anaesthetized larvae.
Page 57
o ~I --~--~I--~I --~--~--~~I~~I--~I
-10 0 10 20 30 40 50 60 70 80 TIME FROM HATCH (days)
Page 58
Table 6.
Stage
Eggs (-chorion)
Yolk-sac
2 weeks fed
5 weeks fed
Pre;metamorphic
Change in Q02 with development in herring.
Age (days) Mean N
8~ 3.477 70
7 2.617 20
21 2.394 29
41 2.211 33
62 1. 364 28
Unanaesthetized
S.E.
.066 ~
I .100 ")
~ . 052 J
-~
.039 ._1
1 \.
.092
D.F.
88
47
60
59
V.Ratio Signif.
41.344 **
4.587 *
8.181 **
79.988 **
n.s. not significant
* 5%
** highly significant
Mean
1.085
1.203
1.329
0.946
N
24
20
23
6
S.E.
.056 }
.026 J
.047 }
.178
Anaesthetized
D.F. V.Ratio Signif.
42 3.211 n.s .
41 5.092 *
27 8.988 **
Page 59
Table 7. Change in Q02 with development in plaice.
Unanaesthetized Anaesthetized
Stage Age (days) Mean N S.E. D.F.VV.Rat!o Signif. Mean N S.E. D.F. V.Ratio Signif.
Eggs (-yolk & 10 4.33 25 001) chorion)
89 1.989 n.s. Yolk-sac 5 4.118 62 0120} 2.520 19 0146}
94 30.262 ** 32 9.986 ** 2 weeks fed 21 3.308 34 0081} 1.952 15 0083 J 97 306.605 ** 37 142.00 ** Stage 3 39 1.815 65 0045} 1.048 24 .031
116 185.967 **
0037 } 42 40.097 **
Stage 5-49 1.119 53 00l3} 0.746 20 just metamorphosed
90 5.214 * Metamorphosed 75 1. 227 39 .053
n.s. not significant
* 5%
** highly significant
Page 60
24.
were significant only at the 5% level.
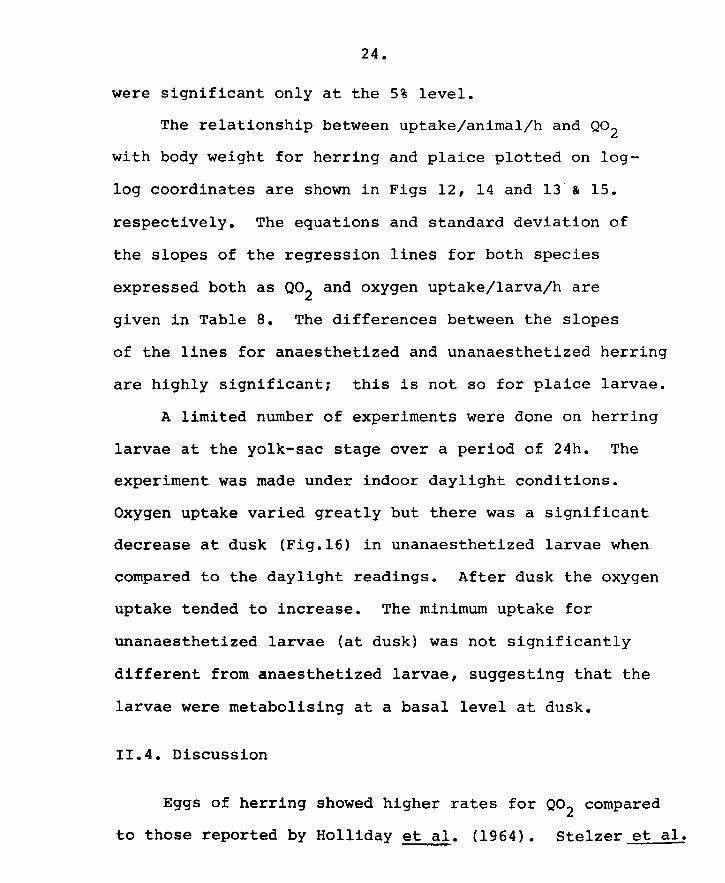
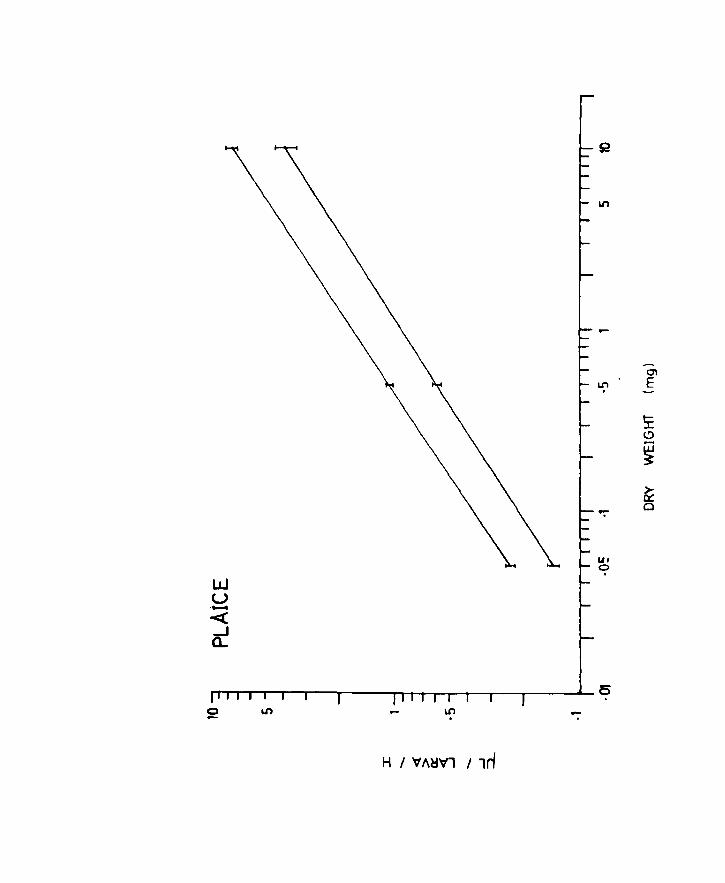
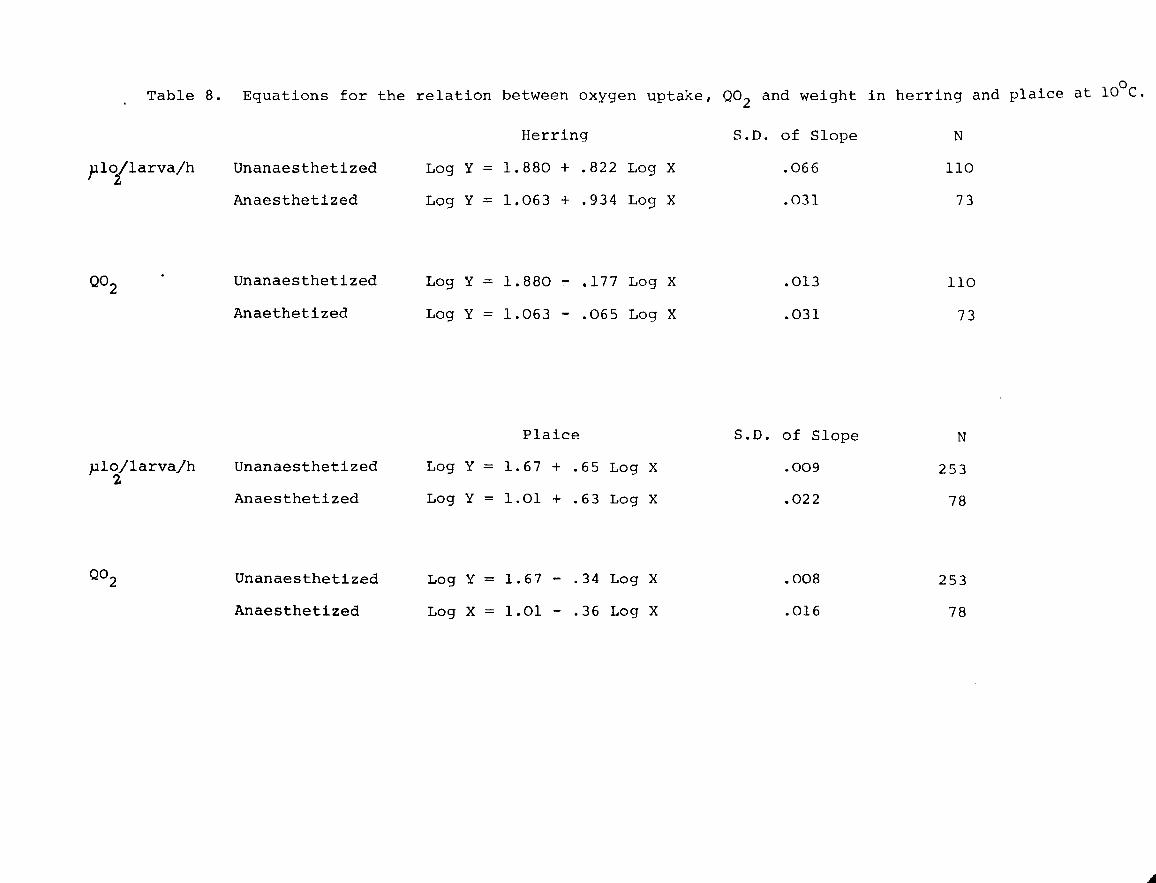
The relationship between uptake/animal/h and Q02 with body weight for herring and plaice plotted on log
log coordinates are shown in Figs 12, 14 and 13 & 15.
respectively. The equations and standard deviation of
the slopes of the regression lines for both species
expressed both as Q02 and oxygen uptake/larva/h are
given in Table 8. The differences between the slopes
of the lines for anaesthetized and unanaesthetized herring
are highly significant; this is not so for plaice larvae.
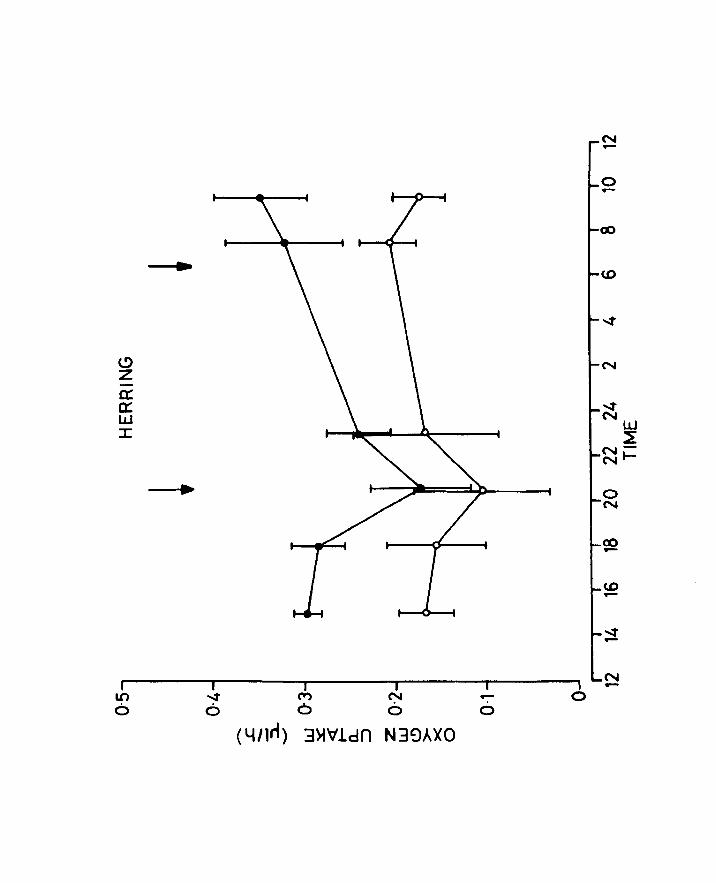
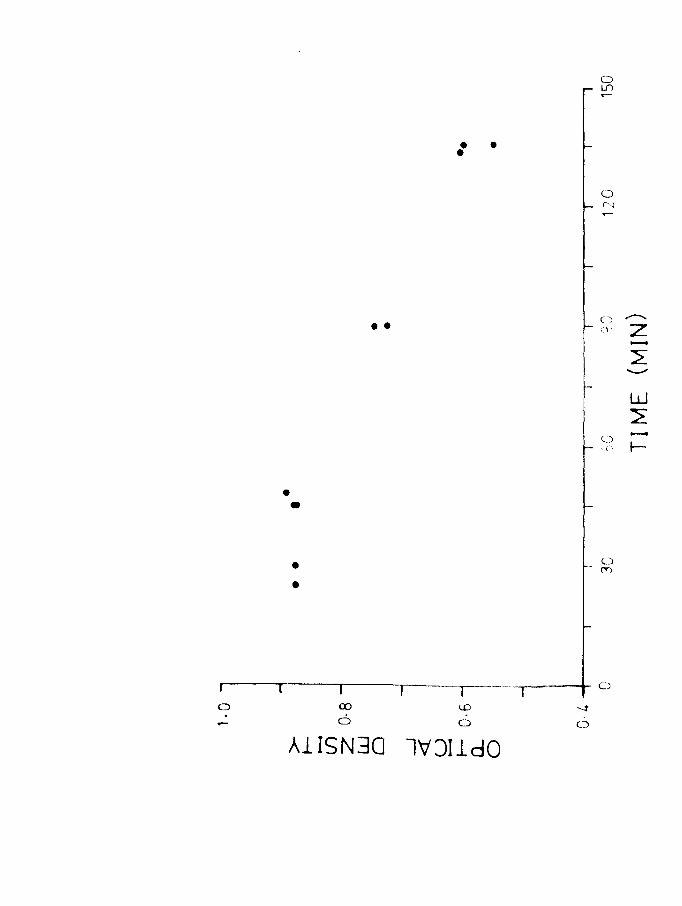
A limited number of experiments were done on herring
larvae at the yolk-sac stage over a period of 24h. The
experiment was made under indoor daylight conditions.
Oxygen uptake varied greatly but there was a significant
decrease at dusk (Fig.16) in unanaesthetized larvae when
compared to the daylight readings. After dusk the oxygen
uptake tended to increase. The minimum uptake for
unanaesthetized larvae (at dusk) was not significantly
different from anaesthetized larvae, suggesting that the
larvae were metabolising at a basal level at dusk.
II.4. Discussion
Eggs of herring showed higher rates for Q02 compared
to those reported by Holliday et ale (1964). Stelzer et ale
Page 61
Fig.12. Uptake per larva related to body weight in
herring. Lines of best fit for the oxygen
uptake of unanaesthetized (upper line) and
anaesthetized (lower line) larvae at IOoe.
Vertical lines at the ends and centre indicate
95% confidence limits.
Page 62
c:7I E
If1 l-I C) .... UJ ~
>-a: 0
-l!) U')
Z 9 -a: a: w ::x::
H I VA~V' I lrf
Page 63
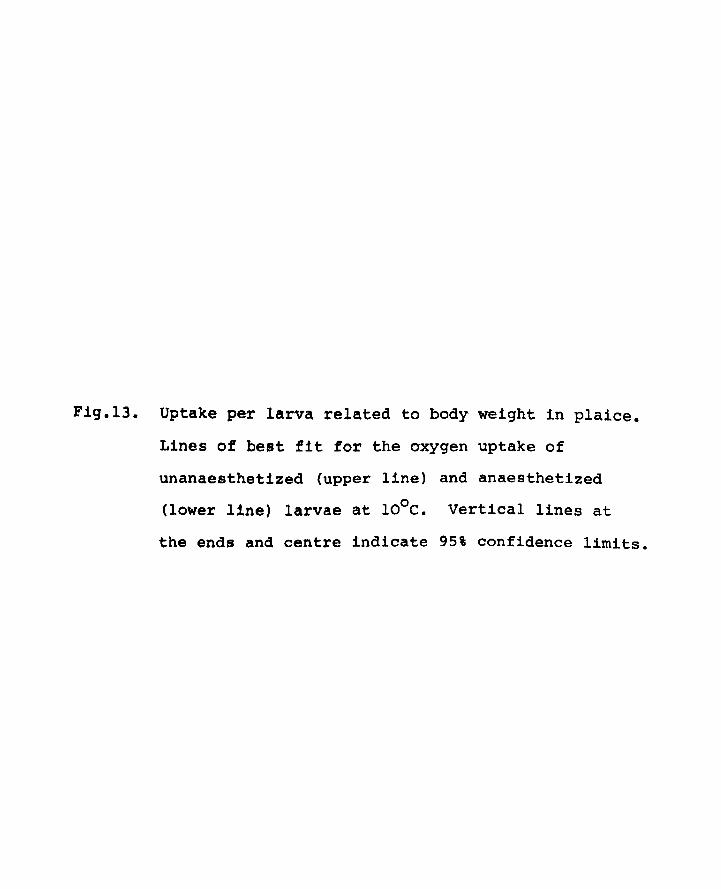
Fig.l3. Uptake per larva related to body weight in plaice.
Lines of best fit for the oxygen uptake of
unanaesthetized (upper line) and anaesthetized
(lower line) larvae at looe. Vertical lines at
the ends and centre indicate 95' confidence limits.
Page 64
01 II"l E .
s: ~
~ ~
-:- 0
u. 0
W U .--< .-J a..
5
-H I 'O'''~V1 I In
Page 65
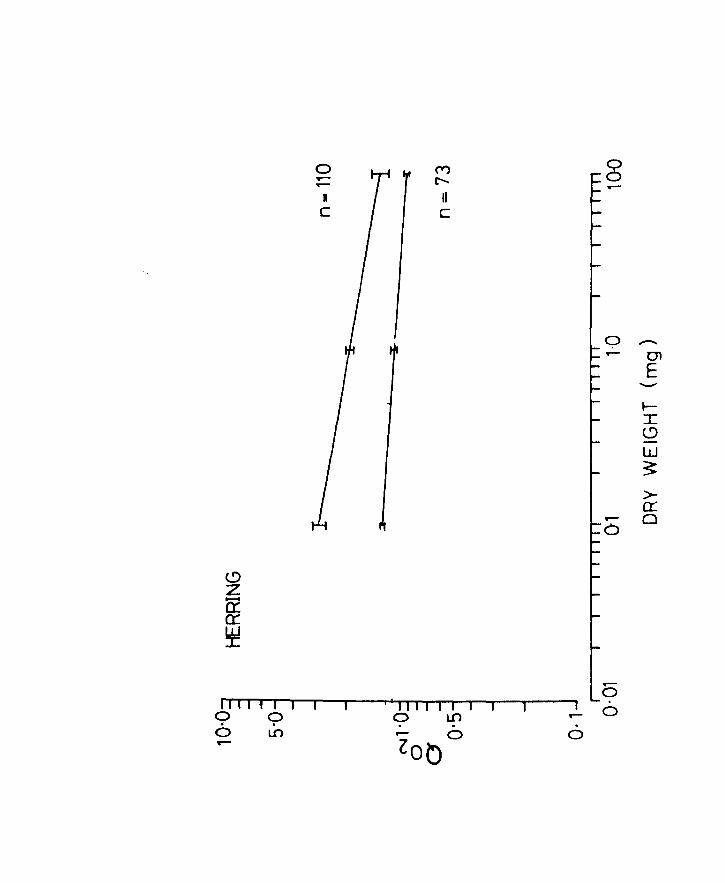
Fig.l4. Q02 related to body weight in herring. Lines
of best fit for the oxygen uptake of unanaesthetized
(upper line) and anaesthetized (lower line) larvae
at lOoC. Vertical lines at the ends and centre
indicate 95' confidence limits. n = number of
observations.
Page 66
II II t I I o 0 . . o LO ..-
("") r-....
Ii C
i I III I I I I o Lfl . . - 0 lOt)
-
o ..-.... - (J)
E -
> 0:::
- 0 a
5 .- 0
o
Page 67
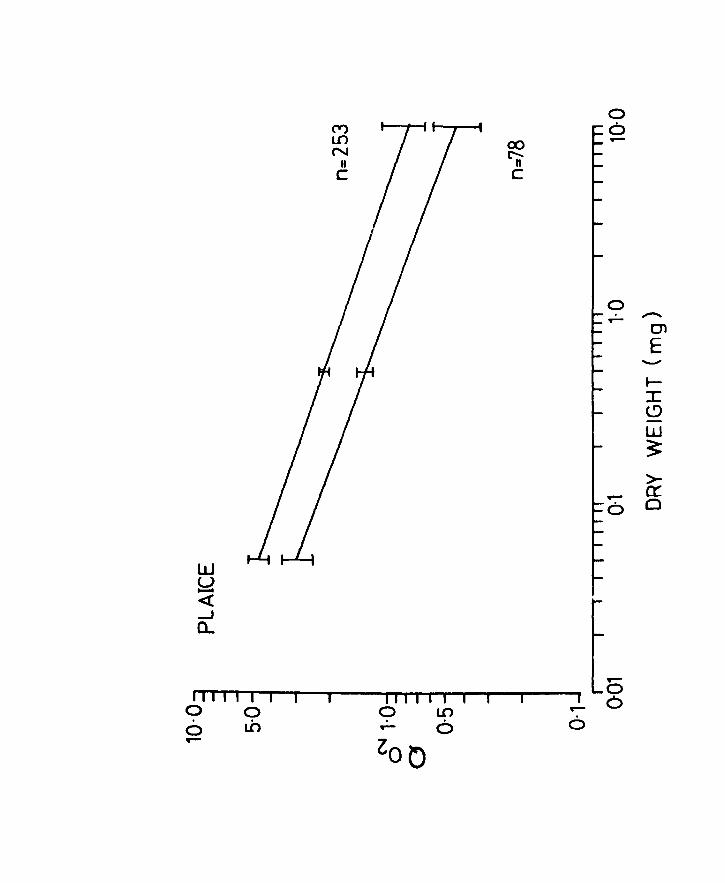
Fig.lIS. Q02 related to body weight in plaice. Lines
of best fit for the oxygen uptake of unanaesthetized
(upper line) and anaesthetized (lower line) larvae
at 10oC. Vertical lines at the ends and centre
indicate 9S% confidence limits. n = number of
observations.
Page 68
II II I I I a a o Lh .--
("I") LD N
II C
I I I I I I I o LO .-- 6
lOO
00 en c
o o .--
0 .--
.--6
.--o .-- 0 o
-01 E
'-'"
.-:c t9 lJJ ~
>-a:: 0
Page 69
a Table 8. Equations for the relation between oxygen uptake, Q02 and weight in herring and plaice at 10 C.
plo/larva/h 2
Unanaesthetized
Anaesthetized
Unanaesthetized
Anaethetized
Unanaesthetized
Anaesthetized
Unanaesthetized
Anaesthetized
Herring
Log Y = 1.880 + .822 Log X
Log Y = 1.063 + .934 Log X
Log Y = 1.880 - .177 Log X
Log Y = 1.063 - .065 Log X
Plaice
Log Y = 1.67 + .65 Log X
Log Y = 1.01 + .63 Log X
Log Y = 1.67 - .34 Log X
Log X = 1.01 - .36 Log X
S.D. of Slope N
.066 110
.031 73
.013 110
.031 73
S.D. of Slope N
.009 253
.022 78
.008 253
.016 78
Page 70
Fig.16. Effect of time of day on the oxygen uptake of
herring larvae 10 days old, at 10oe. ., un
anaesthetized, a anaesthetized. Arrows
correspond to sunrise and sunset.
Page 71
l!> Z a:: ex: w I
I I I I I ~ ~ M N -6 6 660
(4/1n) 3}4Vldn N3~AXO
i 0
N -o -
N
....;t N
W ~
N-N ......
0 N
co -(J) -....;t -N -
Page 72
25.
(1971) found that herring embryos showed respiratory
bursts. Such bursts giving temporarily high Q02's in
the egg could also explain the disparity between egg
and yolk-sac larval Q02's.
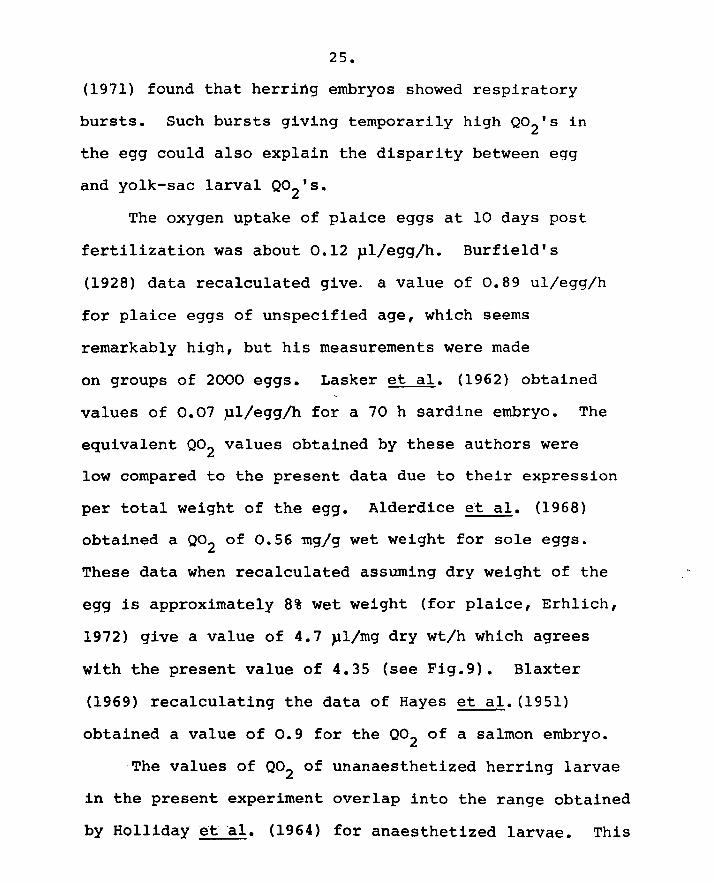
The oxygen uptake of plaice eggs at 10 days post
fertilization was about 0.12 pI/egg/h. Burfield's
(1928) data recalculated give. a value of 0.89 u1/egg/h
for plaice eggs of unspecified age, which seems
remarkably high, but his measurements were made
on groups of 2000 eggs. Lasker et ale (1962) obtained
values of 0.07 pl/egg/h for a 70 h sardine embryo. The
equivalent Q02 values obtained by these authors were
low compared to the present data due to their expression
per total weight of the egg. Alderdice et al. (1968)
obtained a Q02 of 0.56 mg/g wet weight for sole eggs.
These data when recalculated assuming dry weight of the
egg is approximately 8% wet weight (for plaice, Erh11ch,
1972) give a value of 4.7 pl/mg dry wt/h which agrees
with the present value of 4.35 (see Fig.9). Blaxter
(1969) recalculating the data of Hayes et ale (1951)
obtained a value of 0.9 for the Q02 of a salmon embryo.
The values of Q02 of unanaesthetized herring larvae
in the present experiment overlap into the range obtained
by Holliday et al. (1964) for anaesthetized larvae. This
Page 73
26.
could be due to a difference in the level of anaesthesia
in the experiments or to lack of continuous shaking.
Generally unanaesthetized larvae took up oxygen at about
twice the rate of anaesthetized larvae. This may be
compared with the data of Lasker et ale (1962) who found
that swimming increased oxygen uptake up to 3 times the
quiescent value, while Holliday et ale (1964) obtained
active values of up to 10 times the resting value. Ivlev
(1960) stated that oxygen uptake of Salmo salar could
increase up to 14 times during bursts of activity. He
obtained Q02 values of 1.6 - 2.0 for salmon fry and
Lasker et al. a value of 1.33 for sardine larvae •
. Plaice larvae at the end of the yolk-sac stage showed
an expected higher uptake/larva, compared to the early
yolk-sac stage. 002's were also higher, being significantly
different at the 1% level. This is in agreement with
Lasker et ale (1962) who found that swimming activity
increased as the yolk-sac was consumed and the eyes
pigmented in sardine larvae.
The 002's of the egg of both herring and plaice
when compared to that of the yolk-sac larvae were
remarkably high. This is unusual for Volodin (1956) and
Fry (1957) suggested that the presence of the chorion
might inhibit gaseous exchange. Nevertheless they could
Page 74
27.
be explained on the basis of the observations of Stelzer
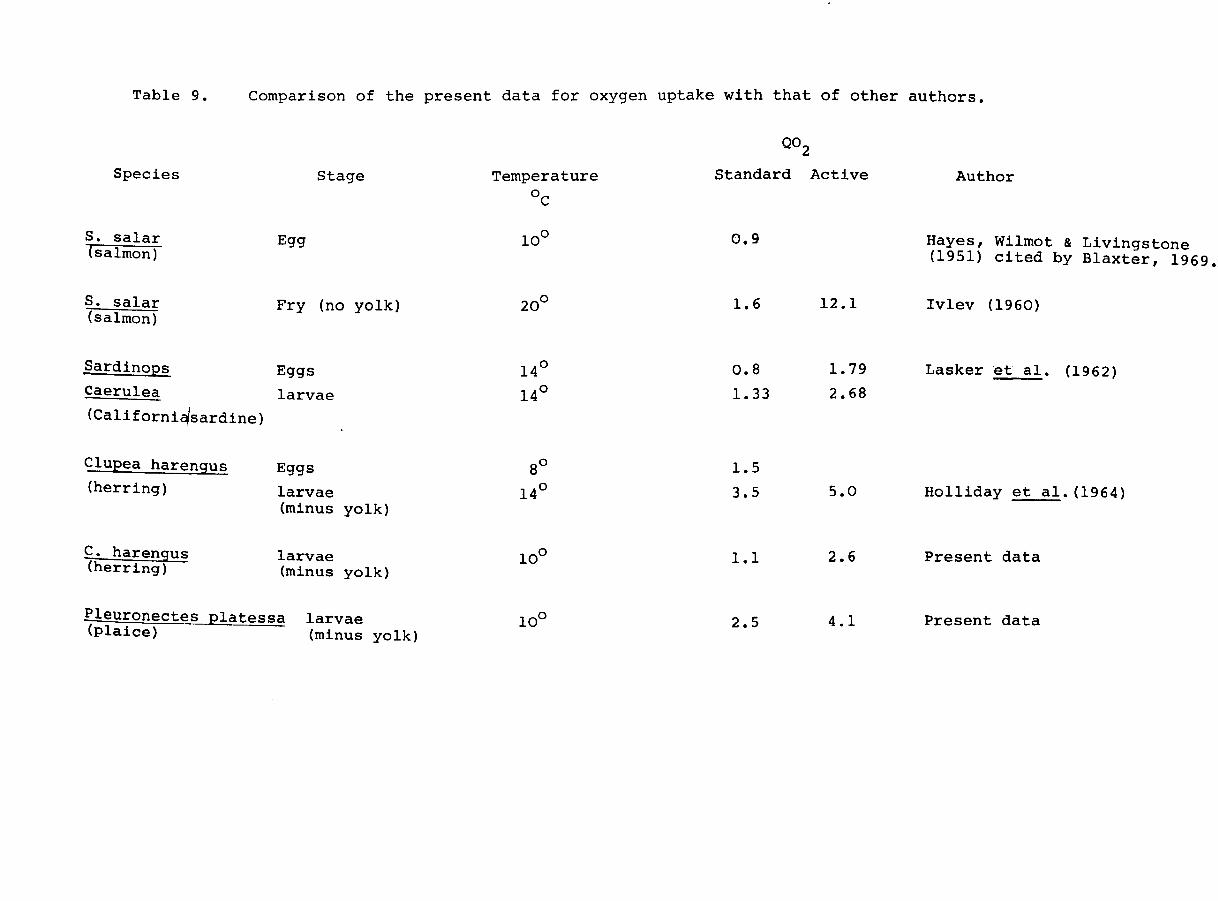
et ale (1971) of respiratory bursts. Table 9 gives a
comparison of the present data with values obtained by
other authors for different species. Devillers (1965)
suggests that increases in oxygen uptake with age in
eggs may be expressed by the exponential equation.
kt Q = ae
when t is time and a and k are constants.
The differences in the slopes shown in Table 8 of
0.82 and .93 respectively for unanaesthetized and
anaesthetized herring larvae during development suggest
a relative decrease in routine metabolism at least up
to the pre-metamorphic stage. The differences in the
values of la' for unanaesthetized and anaesthetized
herring of 1.88 and 1.06 suggest a higher routine and
basal rate of metabolism when compared to the values
of 1.67 and 1.01 for plaice. Winberg (1960), reviewing
the earlier literature, concluded that in general for
resting metabolism the equation
adequately expresses the results. From the present study
the weight exponents in the relationship between oxygen
Page 75
Table 9. Comparison of the present data for oxygen uptake with that of other authors.
Species
S. salar (salmon)
S. salar (salmon)
Sardinops
Caerulea
(Californi~sardine)
CluEea harengus (herring)
C. harengus (herring)
Stage
Egg
Fry (no yolk)
Eggs
larvae
Eggs
larvae (minus yolk)
larvae (minus yolk)
Pleuronectes ~latessa larvae (plaice) (minus yolk)
Temperature
°c
14°
14°
8°
14°
10°
10°
Q02
Standard Active
0.9
1.6 12.1
0.8 1.79
1.33 2.68
1.5
3.5 5.0
1.1 2.6
2.5 4.1
Author
Hayes, Wilmot & Livingstone (1951) cited by Blaxter, 1969.
Ivlev (1960)
Lasker et ale (1962 )
Holliday et ale (1964)
Present data
Present data
Page 76
28.
uptake and weight were found to be 0.82 and 0.65 for
herring and plaice respectively. Paloheimo and Dickie
(1966) conclude that although the value of b = 0.8
is adequate, variations in 'a' dependent on the
environment and condition of the animal are too
great for the prediction of a single value to be
useful. The biological meaning of 'b' is still
obscure in spite of the hypotheses of Zeuthen (1947,
1953) and von Bertallanfy (195l) among others.
Edwards, Finlayson and Steele (1969) measuring the
metabolic rate of '0' group plaice obtained exponent
values of 0.72. Beamish and Mookherjii (1964)
pOinted out that in many of the earlier experiments
spontaneous activity alon increases the respiration
above a basal or resting value. In the present
experiments 'routine' metabolism as measured by
unanaesthetized larvae showed a considerable variation
attributable to spontaneous activity and was approximately
double the basal value as measured by anaesthetized
larvae. Beamish (1964) def;lned the "scope for activity"
as the difference between active and resting metabolism.
In the present experiments the scope for activity in
herring as judged by the difference between
unanaesthetized and anaesthetized larvae is shown
Page 77
29.
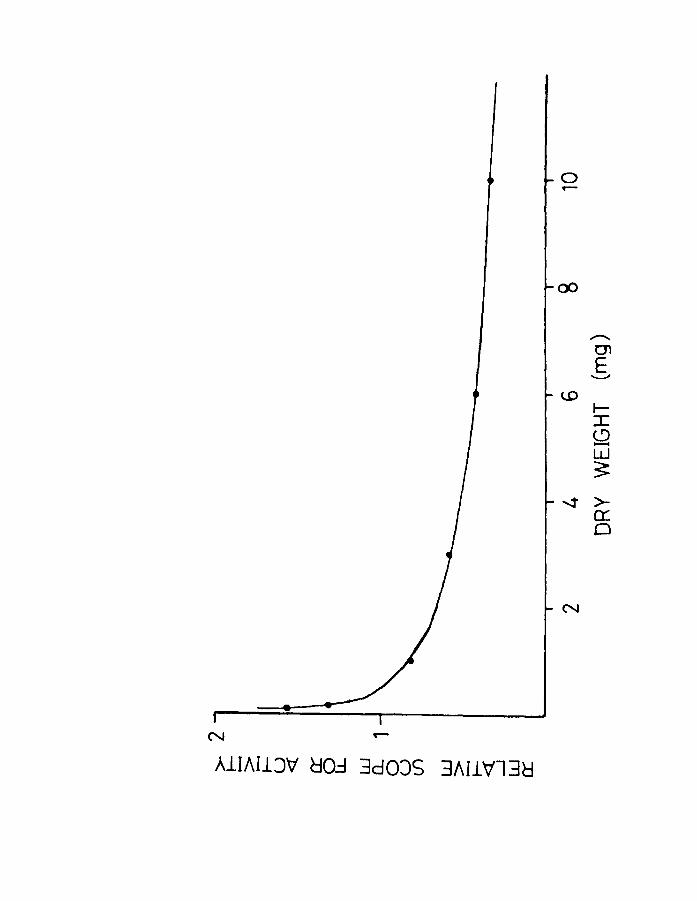
in Fig.17. As evident from the figure the "scope for
activity" appears to decrease at least up to the pre
metamorphic stage in herring.
The oxygen uptake of spontaneously active yolk-sac
herring larvae at 100e was about 0.60 pI for a larva of
wet weight 1.53 mg (from Table 8)Q The uptake per day
would then correspond to 0.014 ml/day. Using Winberg's
(1960) oxycalorific coefficient of 4.77 the calorific
requirements per day for routine metabolism would amount
to 0.067 cals. This agrees reasonably well with the
calculated values of 0.082 for active larvae at the same
weight by Blaxter (1966). For routinely active plaice
larvae of mean wet weight 0.49 mg at the yolk-sac stage,
uptake per larva per h was about 0.34 pI at looe. Thus
consumption per day would amount to 0.0082 ml per day
and calorific requirements would amount to 0.039 cals
a day, using the Winberg coefficient.
Page 78
Fig.17. Scope for activity related to body weight in
herring. The scope for activity is calcu~ated
by subtracting the Q02 for anaesthetized
larvae from the Q02 for unanaesthetized larvae
(see Fig.7).
Page 79
........... 0)
E ~
<..0 ....... :r: <.9 -w ~
....r >-a: 0
N
AIIAIIJ'V ~O.:J 3dOJS 3AI1'Vl3C:i
Page 80
30.
PART THREE. OXYGEN UPTAKE AT REDUCED OXYGEN CONCENTRATIONS.
111.1. Introduction
The ideal way to distinguish between regulation and
conformity with respect to oxygen is to measure oxygen
concentration (or pressure) in the tissues of an animal
in different environmental oxygen concentrations (Prosser
in Prosser & Brown, 1969). Technically this is difficult,
therefore the alternative is to measure oxygen
consumption as a function of environmental oxygen.
When the animal regulates its oxygen consumption
down to some critical pressure below which its oxygen
consumption declines rapidly, it is called a regulator,
i.e. it shows a wide range of oxygen independence.
Alternatively its oxygen consumption may increase
as the environmental oxygen concentration goes up
ioe. it is a conformer.
The only previously published information on the
influence of oxygen concentration on the respiratory
rate of fish larvae is the work of Hayes (1949) on
salmonids.
In the present work three developmental stages of
herring were used: 2 weeks of feeding, 7 weeks of
feeding and post metamorphosis. Three stages of plaice
Page 81
31.
were studied as well: yolk-sac, 3 weeks of feeding
and post metamorphosis.
III.2. Methods
The syringe method of Ewer (1942) was used for
the young stages of herring and plaice. The analysis
of the oxygen content was made by the Fox and Wingfield
(1938) method. Two sizes of syringes were used, 10 ml
hypodermic and 100 ml veterinary. In the latter a
brass adaptor was fitted to the base of the syringe
to enable sampling. Individual syringes were placed
on a perspex rack and separated from one another by
black perspex partitions, the tops being covered by
black perspex to reduce outside interference. The
water bath in which the syringes were placed was
maintained at 100 (± O.loC). The whole system was
covered with a black cloth to reduce outside interference.
The larvae used in the experiments were reared at
the experimental temperature, as in the experiments in
part two. They were transferred into filtered seawater
(filtered through Whatman glass filter GF/C) and left
overnight to defaecate, a second change being made prior
to transfer to the experimental syringe to reduce algal
respiration. Marshall and Orr (1961) observed that
addition of streptomycin did not have any harmful
Page 82
32.
effects on the feeding of Calanus finmarchicus. In an
earlier study (1958) the same authors found that the
oxygen consumption of female C. finmarchicus was unaffected
by antibiotics. Nevertheless antibiotics were not used their
in the present study as A effects on fish larvae are
unknown. Experimental times corresponded approximately
to those of the Gilson experiments to eliminate fluctuations
due to time of day and usually lasted 4 - 5 h. Groups of
5 - 6 larvae were used in the early stages. The syringe
operated as a closed vessel respirometer in which the
p02 was reduced by larval respiration. The pH was
checked at the end of the experiments. No appreciable
difference was obtained between 'control , and 'active'
syringes. Titrations for oxygen were carried out in
small glass vessels painted white on the outside as
recommended by Strickland & Parsons (1965). 'Control'
syringes showed no appreciable difference in oxygen
content over the experimental period.
For metamorphosed herring cylindrical perspex
chambers of 160 ml capacity were used, the water being partly
replaced bYAdeoxygenated filtered seawater after each
determination, to avoid any Bohr effect in the blood
due to high CO2 levels. The same procedure was adopted
Page 83
33.
for plaice using the 100 ml syringes. Individual larvae
were used in the case of metamorphosed herr ing ann 1 - 2
metamorphosed plaice. Air saturation corresponded to
6.0 - 6.3 mIll for the experiments.
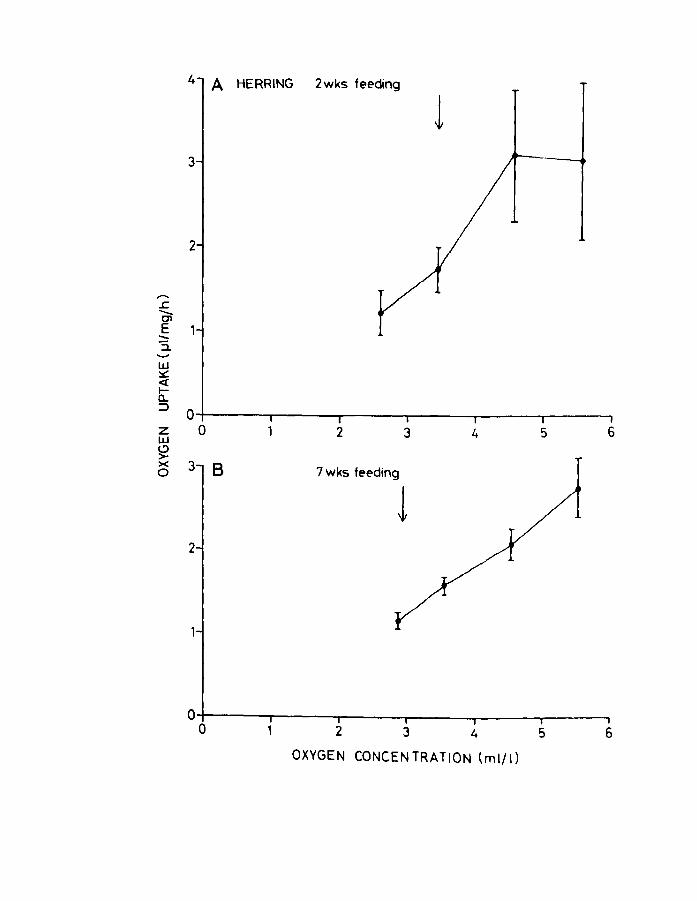
III.3. Results.
These are expressed as pl02/mg dry weight/h to
eliminate the influence of differences in size. Herring
larvae at 2 and 7 weeks of feeding (Fig.l8A & B) showed
a great deal of variation in oxygen uptake at levels
corresponding to air saturation. This variation decreased
as the oxygen concentration fell, as did the oxygen uptake.
The younger larvae appeared to regulate better than older
ones, which seemed to be "conformers".
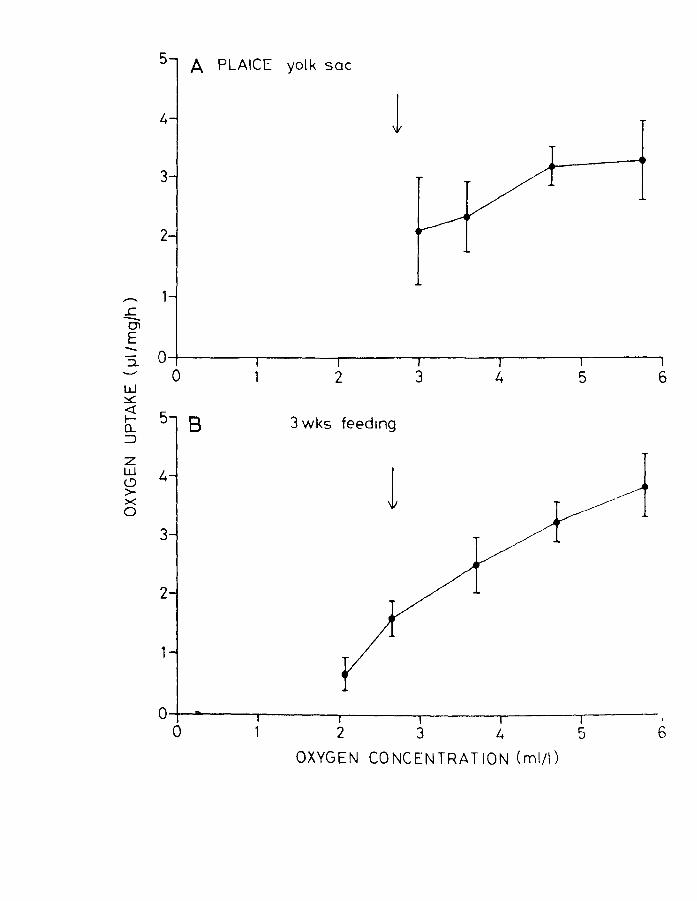
Plaice larvae at the yolk-sac stage also showed a
wide variation in oxygen uptake at levels near air
saturation (Fig.19A) and also 50% air saturation. A
greater degree of "regulation" was observed when compared
to the early feeding herring larvae. Plaice at 3 weeks
of feeding seemed to have become complete "conformers"
like the older herring (Fig.19B).
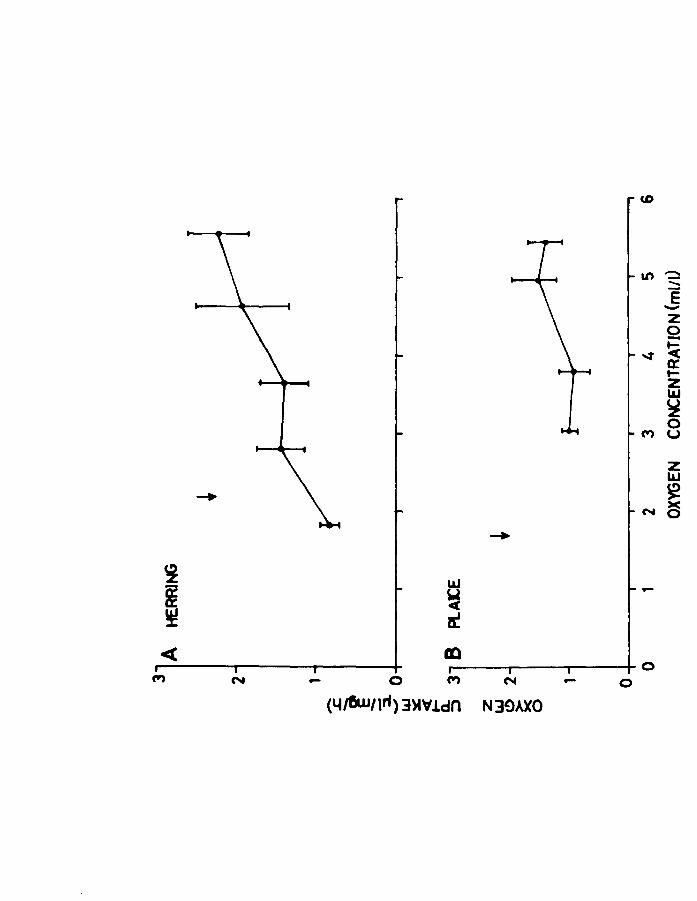
Metamorphosed herring and plaice showed an increased
ability to regulate (Fig.20A & B) when compared to the
earlier feeding stages though the experiments were not
taken down to the incipient lethal level in the case of
Page 84
Fig.1B. Effect of oxygen concentration on oxygen uptake
for herring larvae at A. 2 weeks of feeding and
o B. 7 weeks of feeding at 10 C. Arrow indicates
incipient lethal level (LO SO).
Page 85
4 A HERRING 2wks feeding
1 3
2
,-... £ -Cl E -"3-w ~ « ~ a.. :::>
0 z 0 2 3 4 5 6 w ~ > x 3 B 7 wks feeding 0
1 2
O+-----~----~----~r_----~----,_----, o 2 3 4 5 6
OXYGEN CONCEN TRATION (mill)
Page 86
Fig.19. Effect of oxygen concentration on oxygen uptake
of plaice larvae at A. yolk-sac and B. 3 weeks
of feeding. Arrow indicates incipient lethal
level (LD SO>.
Page 87
5 A PLAICE yolk SQC
4 1 3
2
......... s: -01 E - 0 :l.
0 2 3 4 5 6 w ~ <! 5 l- S 3 wks feeding D... ::J
Z w 4 1 C) >->< 0
3
2
04-~----~------~----~~----~-------.-------, o 2 3 4 5 6
OXYGEN CONCENTRATION (mill)
Page 88
Fig.20. Effect of oxygen concentration on oxygen uptake
for A.
B.
+ metamorphosed herring (1 = 50 - ~)
+ metamorphosed plaice (1 = 18 - lmrn).
Arrows indicate the incipent lethal level
Page 89
&n~ -E -z 0 -
...r ~ a: ... z LU
~ 0
("') U
Z LU
~ N S
'2 UJ .... I ~ ~ ~
~ dl 0
("') N ..- 0 ("') N .... 0
(4/f5wllrl ) 3)1'1.ldn N3!)AXO
Page 90
34.
the plaice. Nevertheless at levels near 50% air saturation
the plaice appeared to regulate better than the herring.
III.4. Discussion
Dependence on environmental oxygen tensions appears
to increase with age in both herring and plaice up to
metamorphosis. The oxygen uptake at the incipient lethal
level in the larval feeding stages of both species
corresponded approximately to the uptake of the
anaesthetized larvae as measured by the Gilson
experiments (see Figs 8 & 9; and Tables 4 & 5). This
shows that larvae survived at lower oxygen levels by
reducing their activity with no apparent oxygen debt
being incurred. Hayes (1949) also observed conformity
in relation to lowered oxygen tensions in sa1monid
larvae. The apparent later independence (regulation)
of the metamorphosed fish could be explained on the
basis of the respiratory pigment which is present at
this stage.
Animals from high oxygen environments have higher
oxygen consumption at air levels and higher critical
pressures than animals from low oxygen environments
(Prosser in Prosser and Brown, 1969). This is observed
in some invertebrates (Fox, Wingfield and Simmonds, 1937)
and as shown here appears to hold for marine fish larvae as well.
Page 91
35.
PART FOUR. MORPHOLOGICAL MEASUREMENTS OF THE SURFACE
AREA OF THE BODY AND GILLS IN RELATION TO
DEVELOPMENT.
IV.l. Introduction.
The present work was an attempt to determine the
respiratory surface available to the developing larva
of plaice and herring, which at hatching possess only
gill .. bars in the case of plaice, even these being
absent in the case of herring. Correlated with this,
the gill area was determined from its time of appearance
up to and beyond metamorphosis in both species. The
surface area of the body including the fins was also
measured as a means of determining the surface area
available for cutaneous respiration.
Many workers have attempted to measure the surface
area of the body in an attempt to relate it to metabolism.
The general relationship between surface area and weight,
is expressed by the equation '1
S=KWl"
where S equals the surface area, W the weight and K is a
constant for a particular species. Benedict (1938)
reviewing his own work and that of others, said that
with the exception of animals that become spherical or
greatly elongated, 'K' is in the neighbourhood of 10,
Page 92
36.
this being the best value for 21 species of a total of
30 birds and mammals. This was reviewed in turn by
Zeuthen (1947) and Kleiber (1947) who called attention
to variations and discrepancies in the literature.
Kleiber (1947) suggested the use of 0.75 power of the
weight as being representative of metabolic size.
Later Gray (1953) obtained lower values of K for round
fishes while depressed or compressed fishes gave
correspondingly higher values.
Measurements of gill dimensions have been made for
a large number of fish species by many authors. Reiss
(1881) was the first to measure accurately the gill
surface in pike. Putter (1909) observed that the
respiratory surface is proportional to body surface but
not to body weight, as maintained by Reiss. Price
(1939) studied the development of gills in small mouthed
bass Micropterus dolomieu. Schottle (193l) compared the
gills of terrestrial gobiiform fishes and strictly aquatic
species. More recently gill areas have been investigated
by Byckowska-Smyk, (1957, 1958, 1959) Gray (1954), who
tried to correlate it to body surface area, Hughes (1966)
Muir (1969) Saunders (1962) Hurrhpp, l'nc1 ';hp-, ton
rq62) Hughes and Gray (1972) Muir and Hughes (1969).
Several of these authors have tried to correlate gill
Page 93
37.
area with metabolic rate and activity. So far no
attempt has been made to study gill development in
young fish larvae, apart from Harder (1954) who
measured the development of elements of the branchial
region.
IV.2. Methods.
Larvae were anaesthetized with MS 222 SANDOZ
(Ij 15,000) and immediately the outline of the body
and fins was drawn on graph paper using a WILD M5
binocular microscope with a camera lucida attachment.
The width was not measured due to the problem of
handling delicate larvae with forceps which would
have damaged them and thus prevented a proper measurement
of the wet weight which was made immediately afterwards
on a Beckmann EMB 1 microbalance. Larvae were rinsed
in distilled water, placed on filter paper and immediately
a stopwatch was started. They were then transferred to
small boats made of foil and weighed at one minute
intervals. Later the weight was extrapolated back
to zero time. They were then frozen for ~ an hour,
freeze dried and stored till the dry weight was determined.
In herring the body surface area was calculated as
Page 94
38.
being equal to a cylinder, i.e. IT dl where d is the
average depth of five measurements taken at the following
positions along the body.
(a) Behind the eye.
(b) Halfway between the eye and insertion of
the dorsal fin.
(c) At the insertion of the dorsal fin.
(d) Just posterior to the anus.
(e) Base of the caudal fin.
The average measurement thus obtained corresponded very
closely to an average measurement of the depth measured
at the insertion of the dorsal fin and the true width.
A total of 89 herring larvae were examined, the
observations being grouped into length classes to
facilitate handling of the data.
Seventy fish were studied in the case of plaice.
For the later stages of plaice the value obtained for
the surface area of one side was doubled to give the
total surface area. The method used for the herring
larvae was used for the earlier stages of plaice. A
point to be noted is that epithelial respiration at
least in the very early stages may also be taking place
through the intestinal and buccal epithelia. No attempt
was made to determine these proportions with development.
Nevertheless a measure of the relative change of the
Page 95
39.
available respiratory surface with development could be
obtained.
The material for the gill measurements was fixed in
10% seawater-formalin, after the length was measured.
The wet weight was computed for these lengths from the
surface area and weight relationships. This method
was adopted due to the time involved in weighing small
larvae, length being used as a indicator of body size
by extrapolation. This avoided the time consuming
weighing procedures. For the larger plaice and herring
fixed long after metamorphosis both the wet weight and
length was determined before fixation.
Prior to measurement the gills and pseudobranch of
the left side were dissected out in herring, and the
arches separated. In plaice since the left eye migrates,
the gills of the right side were dissected instead. All
the measurements were made under a WILD M5 binocular
microscope with a micrometer eyepiece. No allowance
was made for shrinkage but Gray (1954) and Hughes (1966)
measuring the gills of large fish observe that shrinkage
is slight. The total length of each arch was measured
by summing up the lengths of the epibranch, ceratobranch
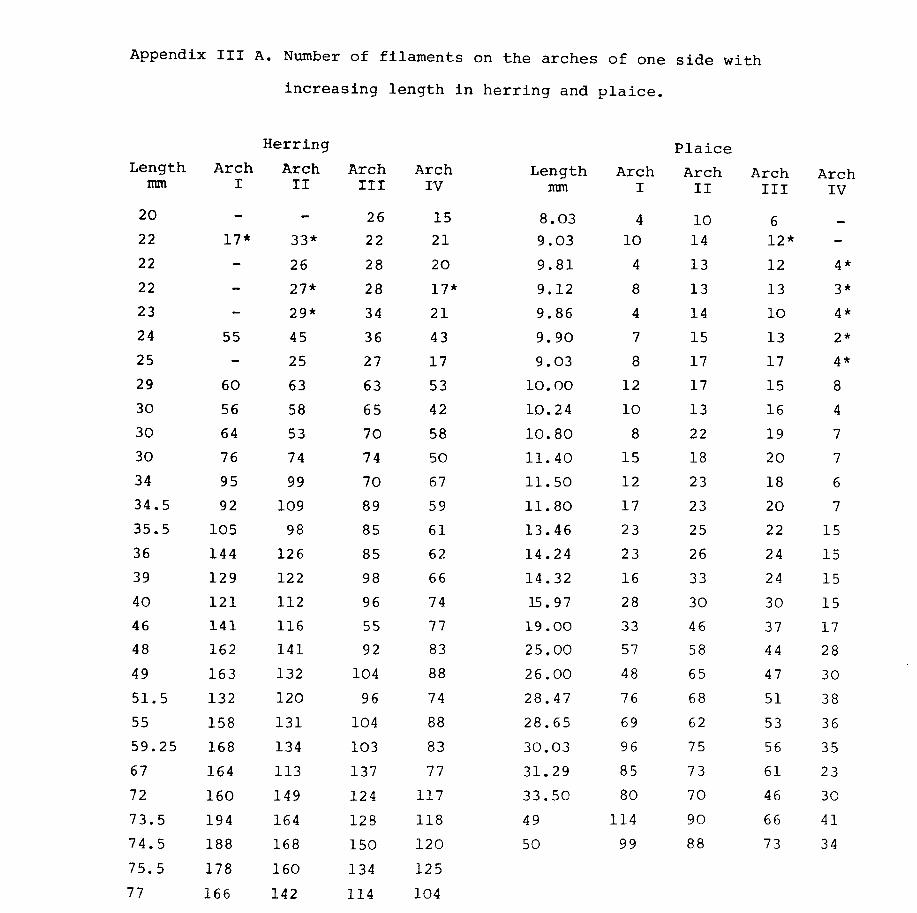
and hypobranch. The total number of filaments were
counted on each side of the arch. In the earliest stages
Page 96
40.
examined, only those filaments with visible lamellae
were counted. Since the gills were just starting to
develop the methods used by Hughes (1966) and Muir
and Hughes (1969) where detailed measurements on the
filaments of the second arch were extrapolated to give
the gill area of the whole fish could not be used.
Preliminary investigation showed a considerable
variation not only in the filament length along the
length of the arch, but also in the length of the inner
and outer filaments.
As these were at the rapidly developing stage when
measurements were being made at nearly the limit of the
binocular light microscope the following procedure was
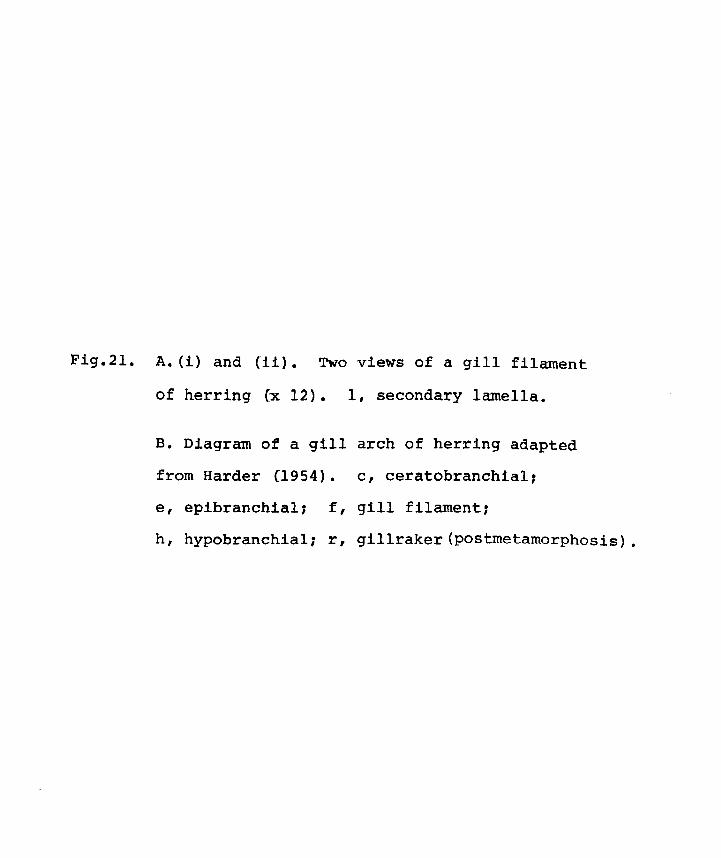
adopted. The length of every fifth or sixth filament
was measured on the epibranchial, ceratobranchial and
hypobranchial (see Fig.2l). This was done for both
inner and outer filaments. The average of all these
measurements was taken as the filament length for that
particular arch. In addition the longest filaments on
the epibranchial and ceratobranchial as well as the
shortest filament at the junction of the epibranchial and
ceratobranchial and the filament at the junction of the
ceratobranchial and hypobranchial were used to measure
the following: the height (1) of the secondary lamella,
Page 97
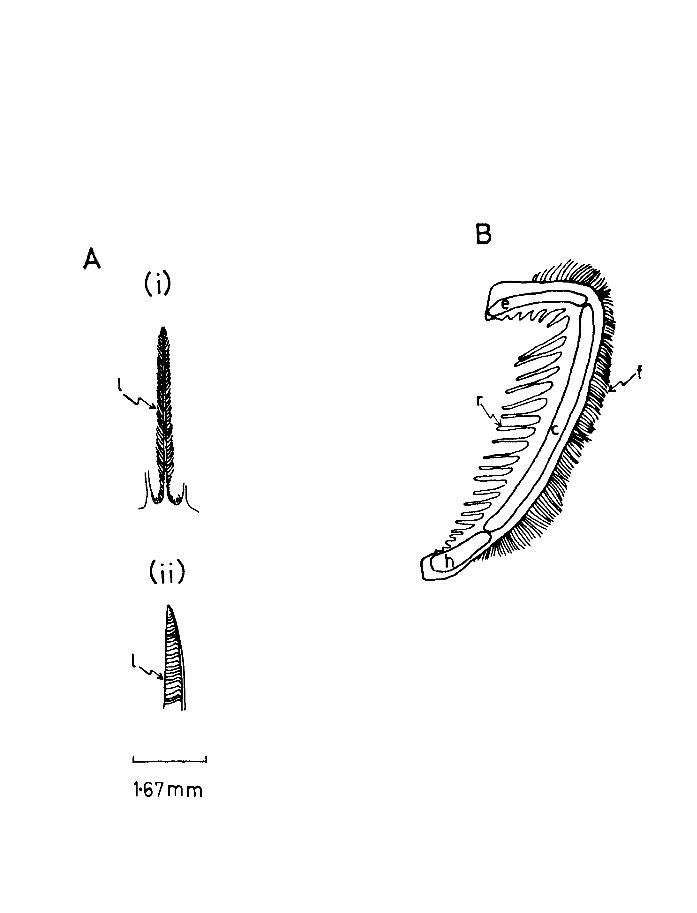
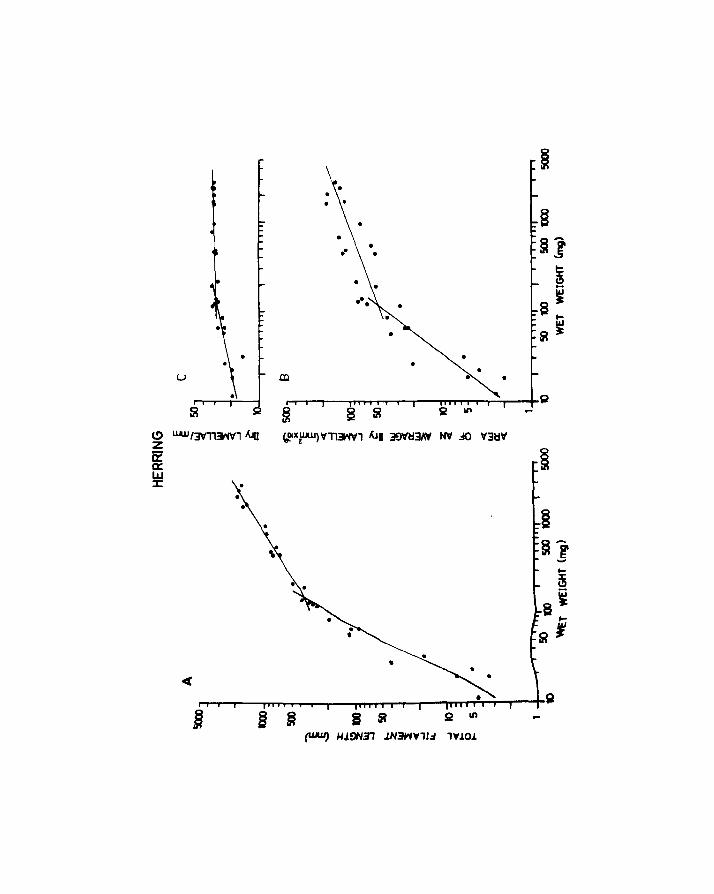
Fig.21. A. (i) and (ii). Two views of a gill filament
of herring ex 12). 1, secondary lamella.
B. Diagram of a gill arch of herring adapted
from Harder (1954). c, ceratobranchia11
e, epibranch1a1: f, gill filament:
h, hypobranchial: r, gillraker(postmetamorphOSis).
Page 99
41.
the number of lamellae falling into the field of part
of the micrometer eyepiece, so as to obtain the
spacing (d) at the middle region of the filament, and
after dissection of the filament from the arch, the
width (b) of the lamella was noted.
Since preliminary examination showed that the
pseudobranch was well developed in these early stages
and Harder (1954) believes it to be active in herring
respiration the lamellar area of the pseudobranch was
determined in both species. The average filament
length was obtained by measuring the lengths of the
filaments halfway between the longest filament (at
the middle of the arch) and the end of the arch. The
average of these two measurements was taken as the
average filament length for the pseudobranch. More
detailed checks have shown that this is satisfactory.
The height, depth and spacing of the secondary lamellae
on these two filaments were determined in the same manner
as for the gills.
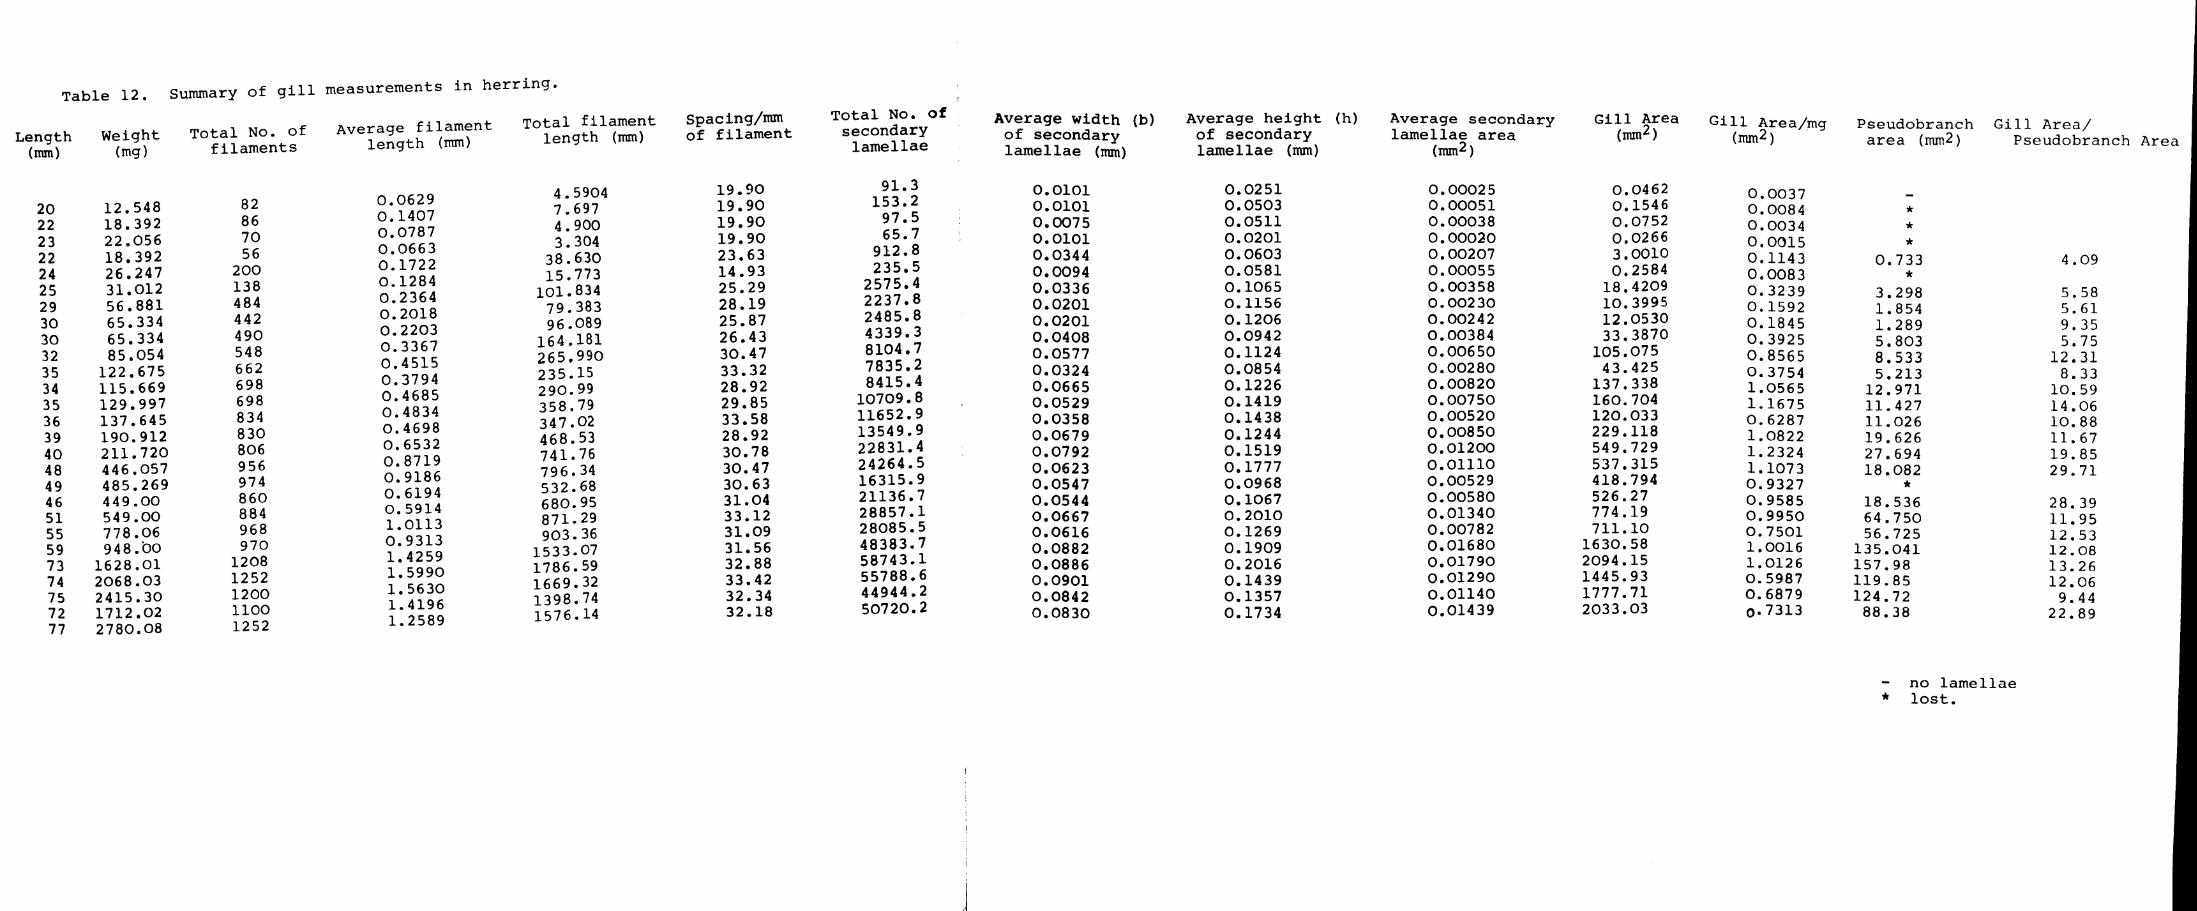
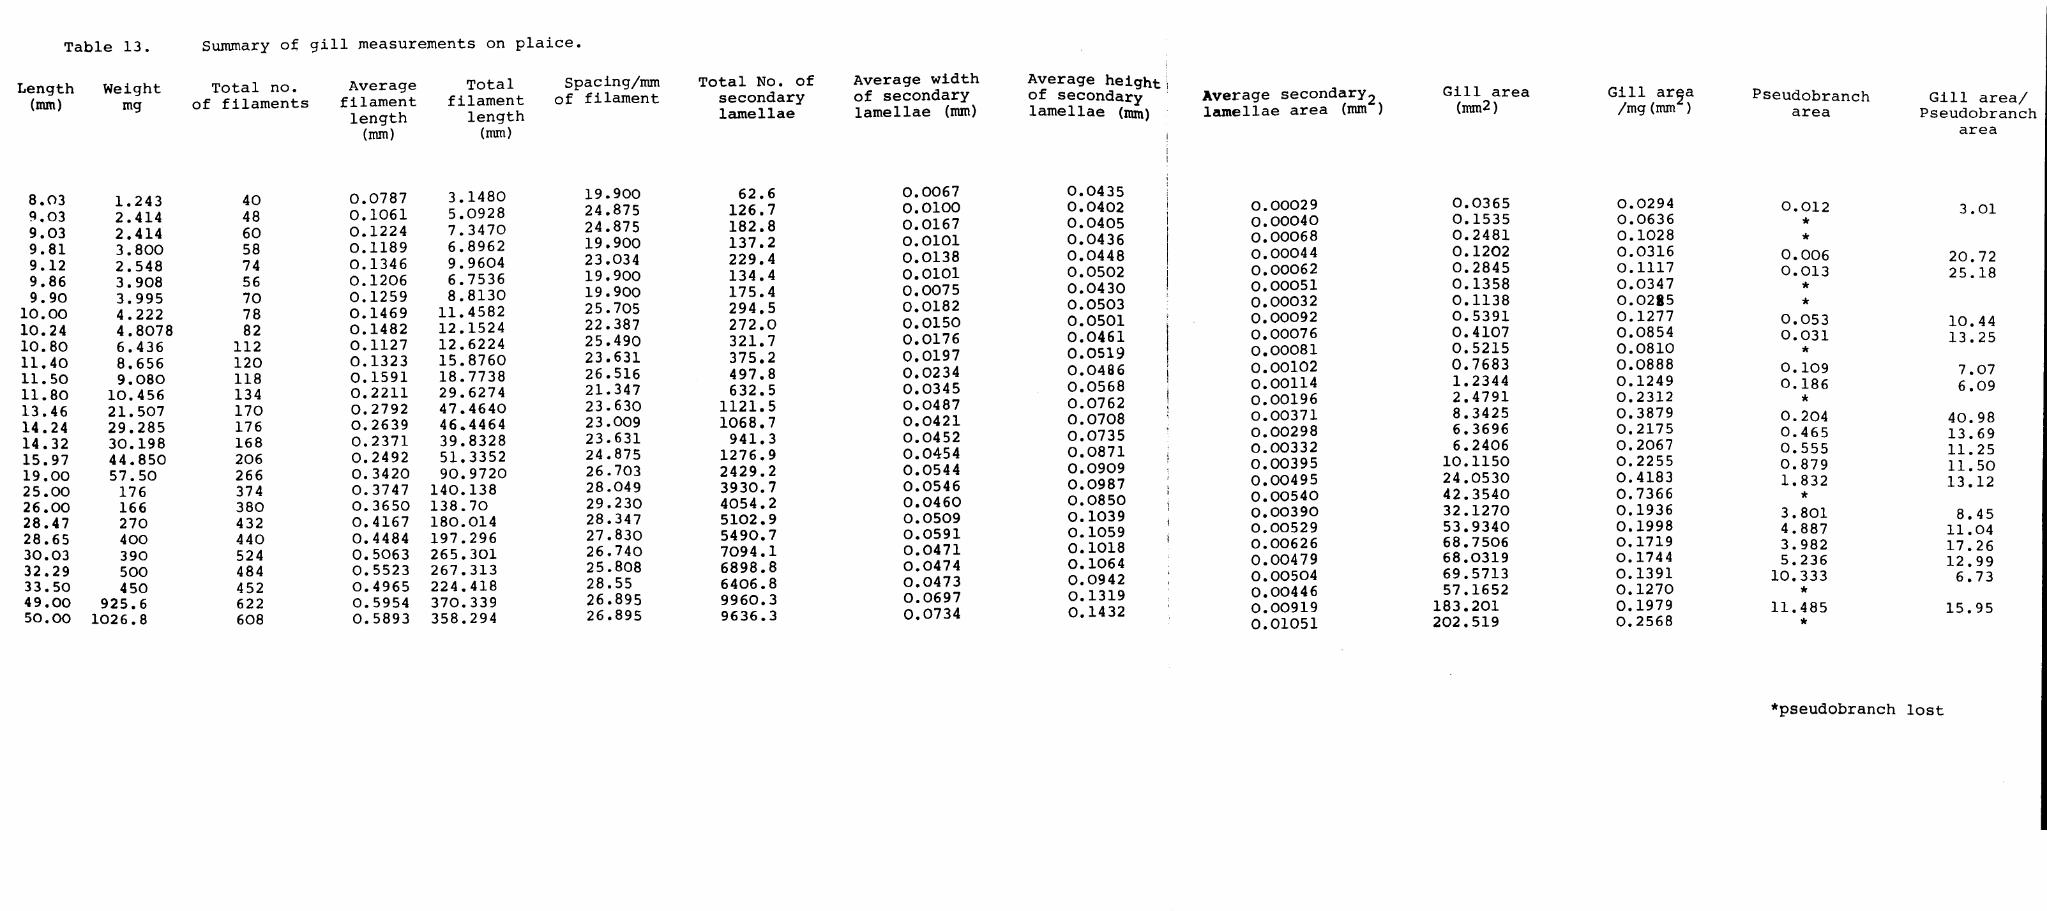
The gill area was calculated from these measurements
as follows. The measurements made on each gill arch were
averaged to give values representative for that particular
arch. The measurements for each arch were then averaged
to obtain a value for all four arches. Since the secondary
Page 100
42.
lamellae are roughly triangular in shape the area of one
side of an average secondary lamella would equal half the
average height (1) multiplied by the average depth (b)
i.e. ~ 1 x b. As both sides of the lamella are used for
gaseous exchange the total area would be twice the area
of one side i.e. 2( ~ 1 x b) = 1 x b. For the whole arch
the area of an average secondary lamella would equal the
product of the weighted height (1) and the weighted depth
(b).
The total no. of lamellae for the arches of one side
which is equal to the average length (L) for the whole
side multiplied by the product of the weighted spacing
Cd) and the total number of filaments for the four
arches (N). This is then multiplied by 2 due to the
fact that lamellae are present on either side of the
filament.
i.e. the total number of lamellae for the arches of
one side : 2 ( L x d x N )
The total number of lamellae for both sides of the arch
= 4 ( L x d x N)
Total gill area would be equal to the area of the secondary
lamellae which is equal to the product of the total number
of secondary lamellae and the weighted area of a secondary
lamella. i.e. = 4 (L x d x N) (b x I)
Page 101
43.
The secondary lamellar area of the pseudobranch was
calculated in a similar manner.
Some material was also fixed for histological examination.
The fixatives used were Bouins solution and 10% buffered
formalin. After 12 hours the specimens were transferred
to 70% alchohol and after several changes the material
was subsequently stored in alcohol of the same concentration.
For older larvae the duration of fixation was extended.
The specimens were embedded in paraffin wax and sections
cut at 4-6 p on a rotary microtome. Sections were cut in
two planes at right angles to one another, namely,
parallel to the length of the larva and transversely
to the length. These sections gave further confirmation
of some of the measurements made on fixed material.
Most of the sections were stained in Mayers haemalum.
Some were stained in Mallory Aniline Blue and Heidenhain
Iron Haematoxylin.
Computations were greatly aided by the use of a
Hewlett Packard desk computor 9l00B.
rv.3. Results.
IV.3.l. Relationships between surface area and length.
The relationships between surface area and length (viz.
Page 102
total
shown
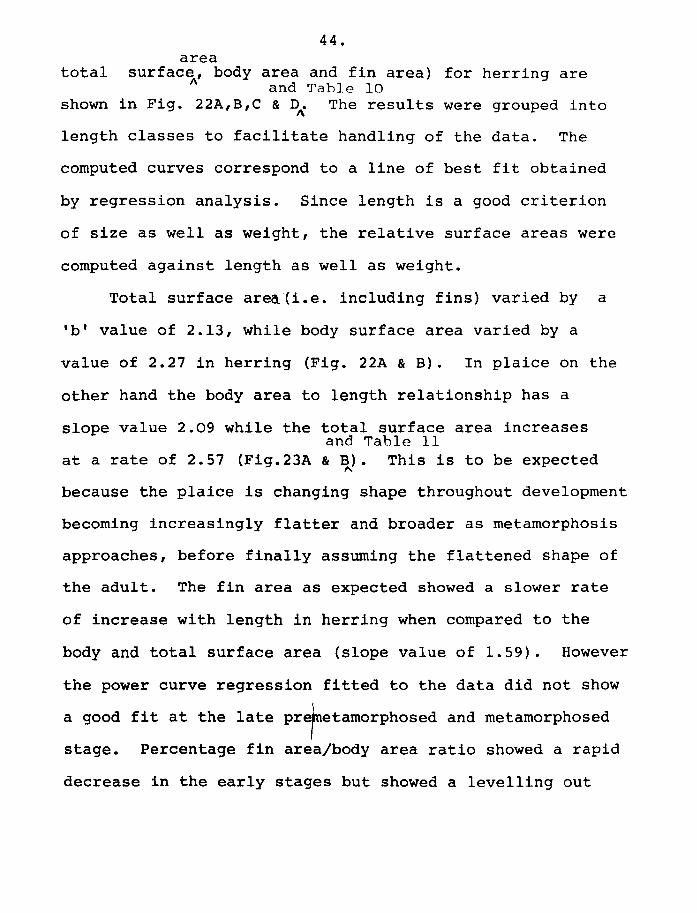
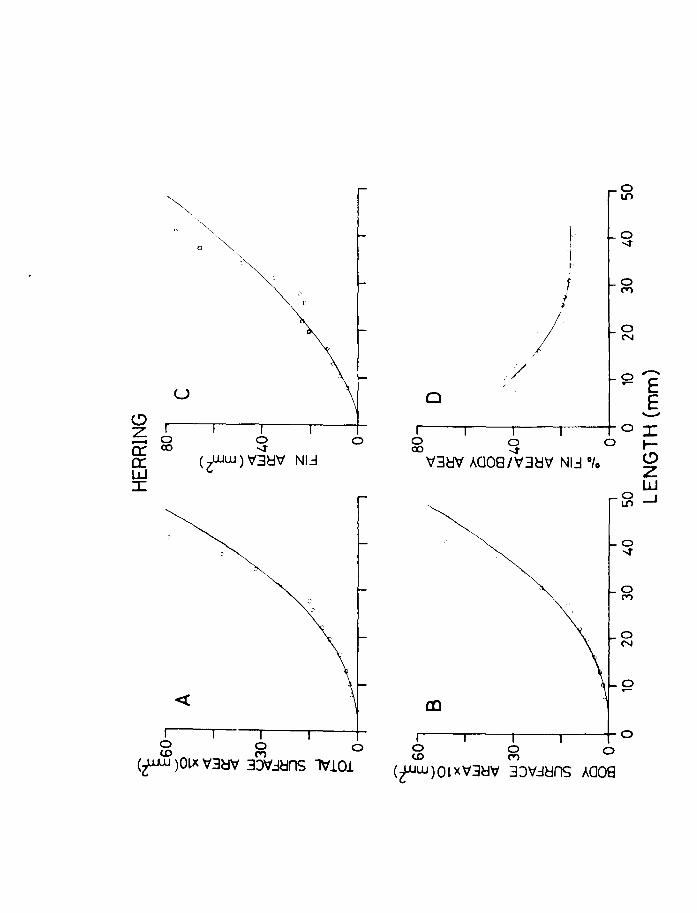
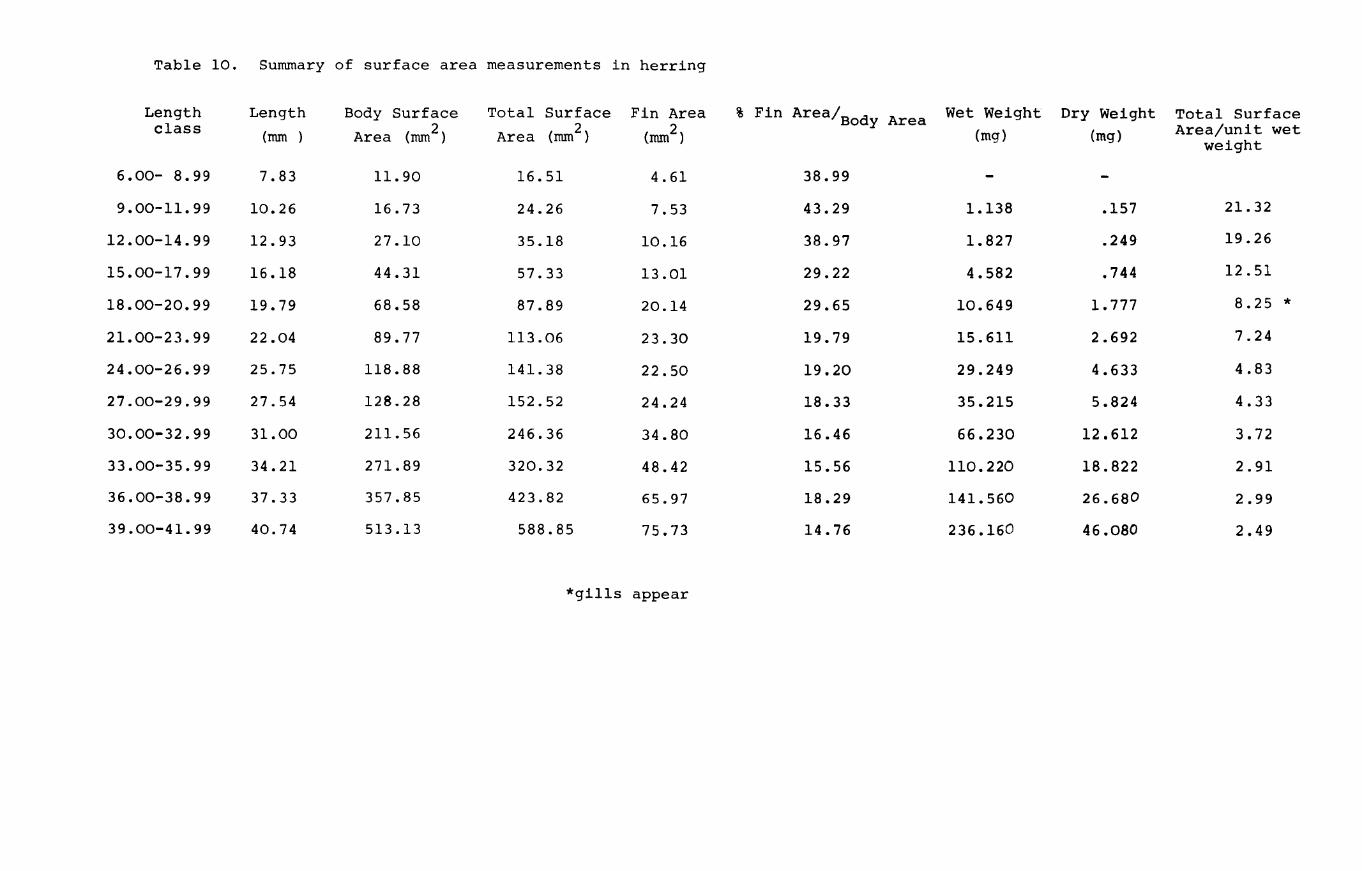
44. area
surface, body area and fin area) for herring are A and Table 10
in Fig. 22A,B,C & D. The results were grouped into A
length classes to facilitate handling of the data. The
computed curves correspond to a line of best fit obtained
by regression analysis. Since length is a good criterion
of size as well as weight, the relative surface areas were
computed against length as well as weight.
Total surface area"(i.e. including fins) varied by a
'b' value of 2.13, while body surface area varied by a
value of 2.27 in herring (Fig. 22A & B). In plaice on the
other hand the body area to length relationship has a
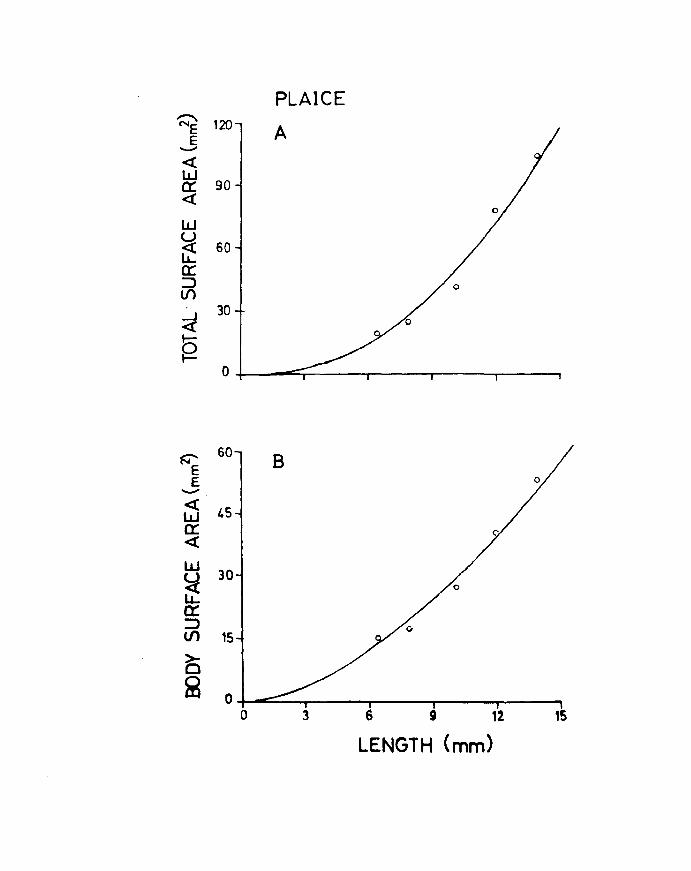
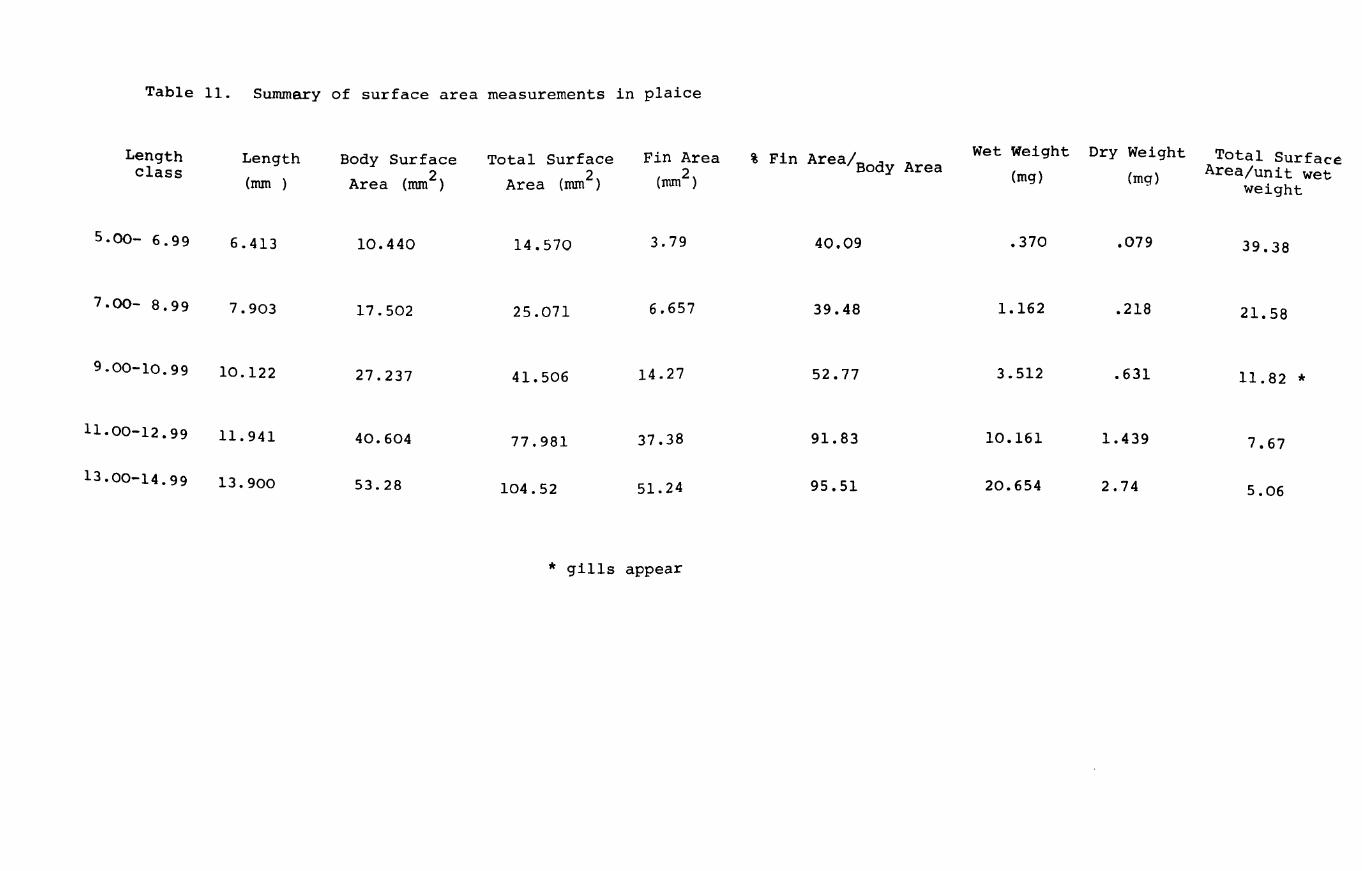
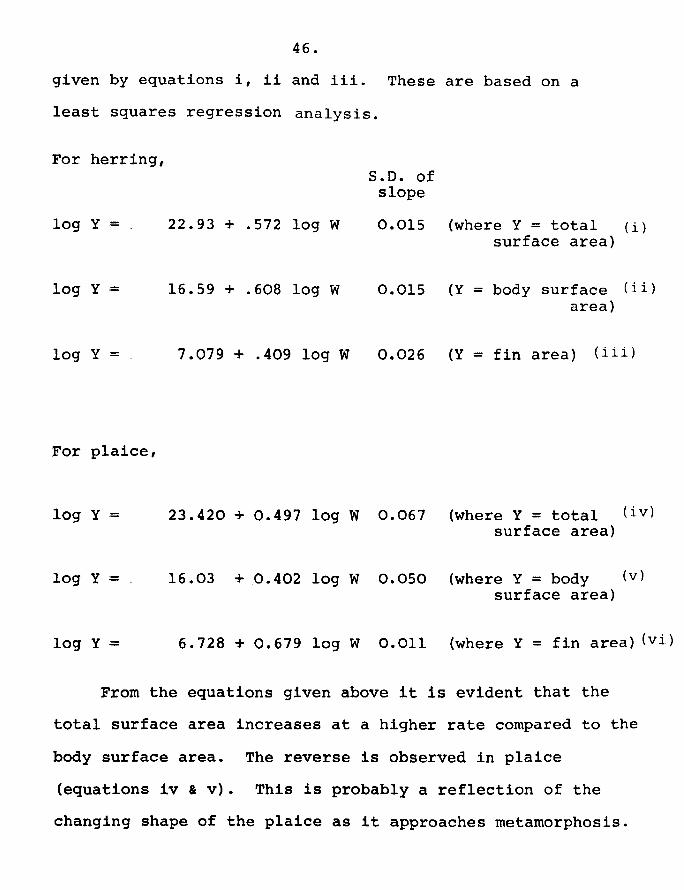
slope value 2.09 while the total surface area increases and Table 11
at a rate of 2.57 (Fig.23A & B). This is to be expected A
because the plaice is changing shape throughout development
becoming increasingly flatter and broader as metamorphosis
approaches, before finally assuming the flattened shape of
the adult. The fin area as expected showed a slower rate
of increase with length in herring when compared to the
body and total surface area (slope value of 1.59). However
the power curve regression fitted to the data did not show
a good fit at the late preretamorPhosed and metamorphosed
stage. Percentage fin area/body area ratio showed a rapid
decrease in the early stages but showed a levelling out
Page 103
Fig.22. Relationship between surface area and length
in herring.
A. Total surface area and length.
B. Body surface area and length.
c. Fin surface area and length.
D. Percentage fin area/body area ratio with
length.
Page 104
u (9 Z 0 - CO
o 0:: 0:: W I
I 000 W M
(~)OlX V'3H'V' 3JV'~ns 1't101
0 Ll")
1, 0 ~
I ~.
t 0 C"")
J
/ 0 N
/
/ 0""'" r- E
Cl E ......., ~-~-----r-----Y--I0J:
o r (9 Z W
~-l
o ~
o C"')
o N
o r-
~-~----r-----,.--t- 0
Page 105
Table 10. Summary of surface area measurements in herring
Length Length Body Surface Total Surface Fin Area % Fin Area/BOdy Area Wet Weight Dry Weight Total Surface class (mm ) Area (mm2 ) Area (mm2 ) (mm2 ) (mg) (mg) Area/unit wet
weight
6.00- 8.99 7.83 11. 90 16.51 4.61 38.99
9.00-11. 99 10.26 16.73 24.26 7.53 43.29 1.138 .157 21.32
12.00-14.99 12.93 27.10 35.18 10.16 38.97 1.827 .249 19.26
15.00-17.99 16.18 44.31 57.33 13.01 29.22 4.582 .744 12.51
18.00-20.99 19.79 68.58 87.89 20.14 29.65 10.649 1.777 8.25 *
21. 00- 2 3 • 99 22.04 89.77 113.06 23.30 19.79 15.611 2.692 7.24
24.00-26.99 25.75 118.88 141. 38 22.50 19.20 29.249 4.633 4.83
27.00-29.99 27.54 128.28 152.52 24.24 18.33 35.215 5.824 4.33
30.00-32.99 31.00 211. 56 246.36 34.80 16.46 66.230 12.612 3.72
33.00-35.99 34.21 271.89 320.32 48.42 15.56 110.220 18.822 2.91
36.00-38.99 37.33 357.85 423.82 65.97 18.29 141.560 26.680 2.99
39.00-41.99 40.74 513.13 588.85 75.73 14.76 236.160 46.080 2.49
*gills appear
Page 106
Fig.23. Relationship between surface area and length in
plaice.
A. Total surface area and length
B. Body surface area and length.
Page 107
PLAICE ~ 120 A E
E ---« w a:: 90 « w u ~ 60
a:: ::J If)
<l 30
0 ~
0
~ 60 B
E ---« 45 W a:: « w
30 ~ LL. a:: :::J til 15
l5 ~ 0
0 3 6 9 11 15
LENGTH (mm)
Page 108
Table 11. Summery of surface area measurements in plaice
Length class
5.00- 6.99
7.00- 8.99
9.00-10.99
11. 00-12 . 99
13.00-14.99
Length
(rom )
6.413
7.903
10.122
11. 941
13.900
Body Surface
Area (rom2)
10.440
17.502
27.237
40.604
53.28
Total Surface 2
Area (rom )
14.570
25.071
41.506
77.981
104.52
3.79
6.657
14.27
37.38
51.24
* gills appear
% Fin Area/Body Area
40.09
39.48
52.77
91.83
95.51
Wet Weight
(mg)
.370
1.162
3.512
10.161
20.654
Dry Weight
(mg)
.079
.218
.631
1.439
2.74
Total Surface Area/unit wet
weight
39.38
21. 58
11.82 *
7.67
5.06
Page 109
45.
from about the 22 rom stage onwards (Fig.22D). Significantly
this is the time of appearance of the gills (Harder, 1954,
and the present study). Plaice did not show this pattern
probably due to its different body proportions. The
equations expressing the relationships with length on the
X axis in a log-log transformation of the data are as
follows:
For herring
Log Y =
Log Y =
Log Y =
0.162 + 2.135 log X where Y = total surface area
0.0869 + 2.267 log X where Y = body surface area
0.167 + 1. 589 log X where Y = fin surface area
For plaice
Log Y = .1188 + 2.579 log X where Y = total surface area
Log Y = .2201 + 2.093 log X where Y = body surface area
IV.3.2. Relationships between surface area and weight.
The general relationship is given by the equation
Y = awl> or log Y = log a + b log W,
where Y = surface area, a, the surface area of a 1 mg
larva , W, the weight in mg, 'b' the regression coefficient.
The relationships between total surface area and weight,
body surface area and fin area with weight in herring are
Page 110
46.
given by equations i, ii and iii. These are based on a
least squares regression analysis.
For herring,
log Y =
log Y =
log Y =
For plaice,
log Y =
log Y =
log Y =
S.D. of slope
22.93 + .572 log W 0.015 (where Y = total ( i) surface area)
16.59 + .608 log W 0.015 (Y = body surface (i i)
area)
7.079 + .409 log W 0.026 (Y = fin area) (i i i)
23.420 + 0.497 log W 0.067 (where Y = total (iv) surface area)
16.03 + 0.402 log W 0.050 (where Y = body (v) surface area)
6.728 + 0.679 log W 0.011 (where Y = fin area) (vi)
From the equations given above it is evident that the
total surface area increases at a higher rate compared to the
body surface area. The reverse is observed in plaice
(equations iv & v). This is probably a reflection of the
changing shape of the plaice as it approaches metamorphosis.
Page 111
47.
Similarly the fin area increases at a higher rate in plaice
compared to herring (equations vi & iii, respectively).
Length-weight relationships calculated on a log-log
basis for herring and plaice are given by equations vii,
viii and iv & x. These relationships expressed as a power
curve regression are illustrated in Fig.24 (A,B,C,D). The
general equation is
Y=aw b
or log Y = log a + b log W,
where Y = wet weight in mg, a = total weight of a 1 mg larva,
b = the regression coefficient, W = the length in mm.
For herring with length,
Log Y = 0.0001 + 3.96 log X (vii) where Y = wet weight
Log Y = 0.00001 + 4.19 log X (viii) where Y = dry weight
For plaice with length,
Log Y = 0.000024 + 5.18 log X (ix) where Y = wet weight
Log Y = 0.000016 + 4.58 log X (x) where Y = dry weight.
As mentioned earlier no attempt was made to evaluate the
extent of respiration through the gut with development.
Page 112
Fig.24. Length-weight relationships in herring and
plaice.
A. Length - wet weight relationship in herring.
B. Length - dry weight relationship in herring.
c. Length - wet weight relationship in plaice.
D. Length - dry weight relationship in plaice.
Page 113
o
w u < ....J a..
u
~ N N ~
C!) Z -ex: 0:: W I
(6w)lH~13M 13M
S 2 N (6w) 1H~13M 13M
o
o
N <.D M ..,;..
(OW)lH~13M AtlO
........ E
ME -:r: I
oc!) o Z
W ....J
o M
o N
o
r---~------------~O ~ N ~ N
o ( OW ) IH~13M AtlQ
Page 114
48.
Nevertheless some measurements on yolk-sac larvae of herring
and plaice show that this is about 25% of the body surface
area in herring andll% in plaice. Expressed as a % of the
total surface area in herring and plaice this becomes equal
to 17% and B% respectively.
IV.3.3. Relationships between body weight and total
gill area.
A plot of gill area and weight on log-log co-ordinates
showed a curve at the upper ends of the graph in both herring
and plaice. Closer visual examination revealed what appeared
to be a curve with a continuously changing slope, the maximum
change occuring at a length roughly corresponding to
metamorphosis in both species. A power curve regression
of the same data also revealed a poor fit at the upper ends
of the curve. Hence it was decided to extend the curve in were
the upper range. This was done in 1972 and the dataAreplotted
with separate lines fitted to the data up to metamorphosis
and beyond it. The results are summarised in Tables 12 & 13.
Lines were fitted by least squares regression to the points.
(Figs 25 & 26).
The general equation for this relationship is
Y=a~
or log Y = log a + b log W,
where Y = total secondary lamellar area in mm2 , a = total
Page 115
Fig.25. Relationship between gill area and weight in
herring.
Page 116
2000
1000
500
100
50
-~ 10 E
< 5 W 0:: « .....J .....J (!) 1·0
-50
·10
·05 0
HERRING
o o
o
o
o
·0 1 +--,.--r-r-r-.-T"T'T'1----,----,-,-,-"T'T1rrr--,--'T""'T.,...,.TTM
10 50 100 500 1000 5000 WET WEIGHT ( mg )
Page 117
Fig.26. Relationship between gill area and weight in
plaice.
Page 118
3cxx) PLAICE
;/ cO
1000
r:OO
500 /)'
0
0
0 ..--.. N 10
~ )( 100 NE
0
E 50 /
« / w 0::: /
0 <II:{ !
....J c/
, ....J 10 - / <.!)
0
5 0 ,0
0 'f
0 0
/ 0 ':)
5 10 50 100 500 1000
WET WEIGHT (mg)
Page 119
Table 12. suromary of gill measurements in herring.
Total filament Length Weight Total No. of Average filament
length (mm) length (rom) (rom) (mg) filaments
4.5904 20 12.548 82 0.0629
7.697 22 18.392 86 0.1407
4.900 23 22.056 70 0.0787
3.304 22 18.392 56 0.0663
38.630 24 26.247 200 0.1722
15.773 25 31. 012 138 0.1284
101. 834 29 56.881 484 0.2364
79.383 30 65.334 442 0.2018
96.089 30 65.334 490 0.2203
164.181 32 85.054 548 0.3367
265.990 35 122.675 662 0.4515
235.15 34 115.669 698 0.3794
290.99 35 129.997 698 0.4685
358.79 36 137.645 834 0.4834
347.02 39 190.912 830 0.4698
468.53 40 211. 720 806 0.6532
741. 76 48 446.057 956 0.8719
796.34 49 485.269 974 0.9186
532.6B 46 449.00 860 0.6194
680.95 51 549.00 884 0.5914
871. 29 55 778.06 968 1.0113
903.36 59 948.bo 970 0.9313
1533.07 73 1628.01 1208 1.4259
1786.59 74 2068.03 1252 1. 5990
1669.32 75 2415.30 1200 1.5630
1398.74 72 1712.02 1100 1. 4196
1576.14 77 2780.08 1252 1.2589
Spacing/rom Total No. of Average width (b) Average height (h) of filament secondary of secondary of secondary
lamellae lamellae (rom) lamellae (rom)
19.90 91. 3 0.0101 0.0251 19.90 153.2 0.0101 0.0503 19.90 97.5 0.0075 0.0511 19.90 65.7 0.0101 0.0201 23.63 912.8 0.0344 0.0603 14.93 235.5 0.0094 0.0581 25.29 2575.4 0.0336 0.1065 28.19 2237.8 0.0201 0.1156 25.87 2485.8 0.0201 0.1206 26.43 4339.3 0.0408 0.0942 30.47 8104.7 0.0577 0.1124 33.32 7835.2 0.0324 0.0854 28.92 8415.4 0.0665 0.1226 29.85 10709.8 0.0529 0.1419 33.58 11652.9 0.0358 0.1438 28.92 13549.9 0.0679 0.1244 30.78 22831. 4 0.0792 0.1519 30.47 24264.5 0.0623 0.1777 30.63 16315.9 0.0547 0.0968 31.04 21136.7 0.0544 0.1067 33.12 28857.1 0.0667 0.2010 31.09 28085.5 0.0616 0.1269 31.56 48383.7 0.0882 0.1909 32.88 58743.1 0.0886 0.2016 33.42 55788.6 0.0901 0.1439 32.34 44944.2 0.0842 0.1357 32.18 50720.2 0.0830 0.1734
J
Average secondary Gill Area Gill Arealmg lamellae area (mm2 ) (rnm2 ) .
(mro2 )
0.00025 0.0462 0.0037 0.00051 0.1546 0.0084 0.00038 0.0752 0.0034 0.00020 0.0266 0.0015 0.00207 3.0010 0.1143 0.00055 0.2584 0.0083 0.00358 18.4209 0.3239 0.00230 10.3995 0.1592 0.00242 12.0530 0.1845 0.00384 33.3870 0.3925 0.00650 105.075 0.8565 0.00280 43.425 0.3754 0.00820 137.338 1.0565 0.00750 160.704 1.1675 0.00520 120.033 0.6287 0.00850 229.118 1. 0822 0.01200 549.729 1. 2324 0.01110 537.315 1.1073 0.00529 418.794 0.9327 0.00580 526.27 0.9585 0.01340 774.19 0.9950 0.00782 711.10 0.7501 0.01680 1630.58 1.0016 0.01790 2094.15 1.0126 0.01290 1445.93 0.5987 0.01140 1777.71 0.6879 0.01439 2033.03 0. 7313
Pseudobranch Gill Areal area (rom2 ) Pseudobranch
,., ,.,
* 0.733 4.09
* 3.298 5.58 1. 854 5.61 1. 289 9.35 5.803 5.75 8.533 12.31 5.213 8.33
12.971 10.59 11. 427 14.06 11. 026 10.88 19.626 11. 67 27.694 19.85 18.082 29.71
* 18.536 28.39 64.750 11. 95 56.725 12.53
135.041 12.08 157.98 13.26 119.85 12.06 124.72 9.44
88.38 22.89
no lamellae * lost.
Area
Page 120
Table 13. Swrunary o~ gill measurements on plaice.
Length Weight Total no. Average Total Spacing/nun Total No. of Average width Average height
(nun) mg of filaments filament filament of filament secondary of secondary of secondary Average secondarY2 Gill area Gill ar2a Pseudobranch
length length lamellae lamellae (mm) lamellae (I1I1l\) lamellae area (nun ) (mm2 ) /mg(mm ) Gill areal
area Pseudobranch (nun) (mm) area
8.03 1.243 40 0.0787 3.1480 19.900 62.6 0.0067 0.0435
9.03 2.414 48 0.1061 5.0928 24.875 126.7 0.0100 0.0402 0.00029 0.0365 0.0294 0.012
9.03 2.414 60 0.1224 7.3470 24.875 182.8 0.0167 0.0405 0.00040 0.1535 3.01
0.0636 * 9.81 3.800 58 0.1189 6.8962 19.900 137.2 0.0101 0.0436 0.00068 0.2481 0.1028 * 9.12 2.548 74 0.1346 9.9604 23.034 229.4 0.0138 0.0448 0.00044 0.1202 0.0316 0.006 20.72
9.86 3.908 56 0.1206 6.7536 19.900 134.4 0.0101 0.0502 0.00062 0.2845 0.1117 0.013 25.18
9.90 3.995 70 0.1259 8.8130 19.900 175.4 0.0075 0.0430 0.00051 0.1358 0.0347 *
10.00 4.222 78 0.1469 11.4582 25.705 294.5 0.0182 0.0503 0.00032 0.1138 0.0285 * 10.24 4.8078 82 0.1482 12.1524 22.387 272.0 0.0150 0.0501 0.00092 0.5391 0.1277 0.053 10.44
10.80 6.436 112 0.1127 12.6224 25.490 321. 7 0.0176 0.0461 0.00076 0.4107 0.0854 0.031 13.25
11. 40 8.656 120 0.1323 15.8760 23.631 375.2 0.0197 0.0519 0.00081 0.5215 0.0810 * 11. 50 9.080 118 0.1591 18.7738 26.516 497.8 0.0234 0.0486 0.00102 0.7683 0.0888 0.109 7.07
11.80 10.456 134 0.2211 29.6274 21.347 632.5 0.0345 0.0568 0.00114 1.2344 0.1249 0.186 6.09
13.46 21. 507 170 0.2792 47.4640 23.630 1121. 5 0.0487 0.0762 0.00196 2.4791 0.2312 * 14.24 29.285 176 0.2639 46.4464 23.009 1068.7 0.0421 0.0708 0.00371 8.3425 0.3879 0.204 40.98
14.32 30.198 168 0.2371 39.8328 23.631 941. 3 0.0452 0.0735 0.00298 6.3696 0.2175 0.465 13.69
15.97 44.850 206 0.2492 51. 3352 24.875 1276.9 0.0454 0.0871 0.00332 6.2406 0.2067 0.555 11. 25
19.00 57.50 266 0.3420 90.9720 26.703 2429.2 0.0544 0.0909 0.00395 10.1150 0.2255 0.879 11. 50
25.00 176 374 0.3747 140.138 28.049 3930.7 0.0546 0.0987 0.00495 24.0530 0.4183 1. 832 13.12
26.00 166 380 0.3650 138.70 29.230 4054.2 0.0460 0.0850 0.00540 42.3540 0.7366 * 28.47 270 432 0.4167 180.014 28.347 5102.9 0.0509 0.1039 0.00390 32.1270 0.1936 3.801 8.45
28.65 400 440 0.4484 197.296 27.830 5490.7 0.0591 0.1059 0.00529 53.9340 0.1998 4.887 11.04
30.03 390 524 0.5063 265.301 26.740 7094.1 0.0471 0.1018 0.00626 68.7506 0.1719 3.982 17.26
32.29 500 484 0.5523 267.313 25.808 6898.8 0.0474 0.1064 0.00479 68.0319 0.1744 5.236 12.99
33.50 450 452 0.4965 224.418 28.55 6406.8 0.0473 0.0942 0.00504 69.5713 0.1391 10.333 6.73
49.00 925.6 622 0.5954 370.339 26.895 9960.3 0.0697 0.1319 0.00446 57.1652 0.1270 * 50.00 1026.8 608 0.5893 358.294 26.895 9636.3 0.0734 0.1432 0.00919 183.201 0.1979 11.485 15.95
0.01051 202.519 0.2568 *
*pseudobranch lost
Page 121
49.
secondary lamellar area for a 1 mg fish in mm2 , W = weight
of fish in mg, b = regression coefficient or slope. The
equations obtained with the 95% confidence intervals for
the regression are,
Herring (up to 40 rom, n = 16 points)
Log Y = : 0.000006918 + 3.36 log W; (2.8(b(3.82) - (1)
Plaice (up to 12 rom, n = 13 points)
Log Y = _ 0.03122 + 1.59 log Wi (1.0(b(2.18) - (2)
Beyond metamorphosis,
Herring (n = 11 points)
Log Y = - 3.764 + 0.79 log W; (0.62(b(0.97) - (3)
Plaice (n = 16 points)
Log Y = 0.465 + 0.85 log Wi (0.79(b(0.90) - (4)
The wide confidence limits are to great extent a
reflection of the small number of points, as well as the
restricted size range examined. From equations (1) and
(3) there appears to be a sharp change in the value of the
slope at metamorphosis in herring but examination of
Fig. 25 shows that this is not so. There is a gradual
change in the slope at metamorphosis but for convenience
Page 122
50.
the two stages are treated separately. The same explanation
holds for the plaice data.
rv.3.4. Factors influencing the changes in gill area
during development.
The effect of size on a number of gill dimensions can
be determined from the data summarised in Tables 12 & 13.
By reference to the formula on page 42 it can be observed
that the values for gill area were computed from 3 sets
ot ~easurements viz. i) the total filament length which is
equal to ILl x N x 4; ii) the average secondary lamellar
area which is equal to b x 1; iii) and the average spacing/rom
of filament Id l • Logarithmic transformations gave the best
approximations to a straight line, wet weight again being
used as a convenient expression of body size.
(i) Total fl1ament length.
The total filament length was plotted against weight
on a log-log scale for both species (Figs 27A & 28A).
The lines were obtained by regression analysis.
The general equation is
Log 1 = log a + b log W
The equations obtained together with the 95% confidence
limits are as follows:
Herring (up to 40 rom, n=16)
Page 123
Fig.27. Relationship between gill dimensions and
weight in herring.
A. Total filament length and weight.
B. Area of an average secondary lamella and
weight.
C. Secondary lamellae/rom of filament and
weight.
Page 124
• §
• ~j •
• i ai
~
• SI~
• u L:Q •
g
~ SI 5i! II>
~X~)V113WY' ~n ~3"V N'( .:10 '13t:1'1
•
•
(IUU') HJJJN31 ./.N3W't1I.:l WlOi
Page 125
Fig.28. Relationship between gill dimensions and
weight in plaice.
A. Total filament length and weight.
B. Area of an average secondary lamella
and weight.
C. Secondary lamellae/rom filament and
weight.
Page 126
u
~
I" i I
8 Q
•
• • •
• I
•
•
I i 0 0 Lf)
•
• • •
•
• • •
• •
•
•
•
en
• •
•
" I I f i i i 0 0 0 Lf)
(WW) Hl~N3l
• •
• •• • •• •
•
~~
. . ''''' " II t t ( i \ ,
'-..' Lf)
IN3~'V'li.=j l\1101
C> C> s
~
0 0
o~ Lf) (J'I
$2
Lf)
o o S?
o o Lf)
E ~
I 0 w ~ f-w ~
Page 127
51.
Log L = 0.0342 + 1.84 log W (l.56( b( 2.12) - (5)
Plaice (up to 12 mm, n=13)
Log L = 0.3586 + 0.88 log W (0.64( b( 1.12) - (6)
Beyond metamorphosis,
Herring (n=ll)
LogL= 20.89+0.5710gW (0.44(b(0.70) - (7)
plaice (n=16)
Log L -= 6.609 + 0.59 log W (0.55( b( 0.61) - (8)
The wide confidence intervals are to some extent due to
the smaller number of points and probably due to the
variation observed in the population as well.
Filaments with lamellae first appear on arch
III and IV in herring. This is followed soon after by
their appearance on arch II and lastly on arch I. Although
the filaments appear last on arch I the number of filaments
increase rapidly until after the 35 rom stage, arch I has the
greatest number of filaments.
The detailed patterns are given in Appendices III A & B.
In plaice the patterns are rather different. Filaments
are present on arch I, II and III at hatching. Later
(about 9 rom) the filaments appear on arch IV, and secondary
Page 128
52.
lamellae on arch III. Lamellae appear first on arch II
followed by arch I. It is evident from Appendix III A
that from the start arch II has the largest number of
filaments in contrast to herring. Detailed patterns
of development are given in Appendix III A & B.
(b) Area of a single secondary l'ame11a.
The weighted average lamellar area was plotted
against weight on log-log coordinates for all the
individuals studied in Doth species (Fig. 27B & 28B).
Each point represents the total area of a single average
lamella i.e. for both sides of the lamella obtained as
described in section rv.2., for that particular larva.
As in the previous section all the points were found to
fallon a curve whether they are. plotted against length I'
----or weight, and therefore as in the previous section the
two groups were separated out and the points plotted on
log-log coordinates as before.
The general equation is
Log Y = log a + b log W
where Y = area of an average secondary lamella 0mm2), a=
area of an average secondary lamella for a 1 mg fish, b =
the slope and W = weight of fish in mg.
Page 129
53.
The equation and 95% confidence intervals for the slopes
are as followS1
For herring (up to metamorphosis), n=16)
log Y = 0.0000098 + 1.3014 log W (1.01< b < 1.59) - (9)
For plaice (up to 12 mm, n=13)
log Y = 0.00024 + 0.71 log W (0.43<b(1.85) - (10)
Beyond metamorphosis,
Herring,
log Y = 0.00088 + 0.36 log W (0.04 < b < 0.68) - (ll)
J?laice,
. log Y = 0.00163 + 0.21 log W (O.17( b< 0.26) - (l2)
From the values for 'a' in the above equations it is
evident that a 1 mg plaice has a higher average secondary
lamellar area than a herring of equal weight. In contrast
the rate of development of the secondary lamellar area is
higher in herring than in plaice.
(c) Spacing of the 's'e'conda'ry lam'e'llae.
The average spacing per mm of filament was plotted
against weight on log-log coordinates as before. OVer the
size ranges examined the spacing did not increase
significantly in both species. The lines obtained by
regression analysis are shown in figs .. (27C & 28C).
Page 130
54.
The general equation is as follows;
log Y = log a + b log W
where Y = spacing/mm of filament, a = spacing for a 1 mg
fish, b = the weight exponent and W the weight in mg.
The equations obtained with the 95% confidence intervals
for the slopes are as follows:
Up to metamorphosis,
Herring (up to 40 mm, n = 16 points),
log Y = 10.65 + 0.201 log W (0.13<b<0.27) - (13)
Plaice (up to 12 mm, n = 13 points)
log Y = 21.21 + 0.045 log W (-0.07 < b <: 0.11) - (14)
Beyond metamorphosis,
Herring (n = 11 points),
log Y = 24.89 + 0.035 log W (0.02( b< 0.04) - (15)
Plaice (n = 16 points),
log Y = 21.45 + 0.040 log W (0.05 < b <:: 0.03) - (16)
From the above equations it is evident that in the early
stages the spacing for 1 mg of wet weight in herring is
about half that of plaice. Beyond metamorphosis however
the spacing per mm of filament for 1 mg of weight as
denoted by the 'a' values are approximately equal.
Comparison of the slopes gives a different pattern. In
herring there is an initial high rate of development in
Page 131
55.
the spacing per rom filament when compared to plaice,
(b values of 0.20 & 0.05 respectively). After
metamorphosis the rate slows down in herring to
approximately the same rate as in plaice.
The pseudobranch is rather difficult to dissect out
especially in the early stages of its development and
hence some were lost in the process of dissection. The
results for both species are given in Tables 12 & 13.
It is evident from these values that the pseudobranch
does not keep pace with gill development and its
contribution towards uptake of oxygen as measured by
its surface area in the pre-metamorphic stages of both
species is very small.
From histological sections it was evident that the
skin of newly hatched larvae of both species was extremely
thin confirming the observations of other workers on these
two species. At the pre-metamorphic stage in herring
around 31 mm the skin is slightly thickened being about
1 - 2 cells in thickness. In newly metamorphosed fish
it is about 3 - 5 cells in thickness. Plaice also show
a thickening of the skin at metamorphosis (Roberts et ale
Page 132
56.
1973, and the present study).
Newly hatched herring larvae show no evidence
of corpuscles in the blood even though the heart starts
to beat prior to hatching and a circulatory system is
present in the larvae. From histological sections it
was evident that at about l4rnm there was still no
evidence of corpuscles, however, in the cavity of
the ventricle and around the gut region a matrix
was present which stained light green with Mallorys
trichrome stain. Later (l6mm) definite corpuscles
were present but it was not possible to distinguish
between erythrocytes and leucocytes. At about 29mm
both erythrocytes and leucocytes could be distinguished.
The number of corpuscles were present in greater
concentration in metamorphosed fish and the different
types of leucocytes were also easily distinguished.
Plaice larvae show no corpuscles in the blood at
hatching as in herring, nor at the start of feeding.
Corpuscles of both types are observed at about lomm as
the larvae metamorphose.
Page 133
57.
IV. 4. Discussion.
The general surface area to length relationships in
herring and plaice show isometric growth (page 44 & 45)
according to Huxley and Teissiers (1936) terminology
(cited by von Berta11anfy, 1938).
Dry weight-length relationships for herring are
similar to that of Marshall, NichoUs and Orr (1937), who
obtained a slope value of 4.52 for spring spawned larvae
in the C1yde o Ehrlich (1972) obtained a value of 4.54 for
the slope in larvae reared up to the pre-metamorphic stage.
These are comparable to the value of 4.19 in the present
study which included metamorphosed fish as well.
Ryland (1966) assumed a slope value of 3 for the dry
weight length relationship for plaice larvae based on the
data of Meek (1903). Ehrlich (1972) obtained a slope value
of 3.92 for plaice up to 25 mm, as compared to 4.58 in the also
present study which included only newly metamorphosed fish. A
The fins appear to play an important role in cutaneous
respiration in the early stages as is evident from the
slowing down of the fin area proportional to body weight
and the subsequent gill development in herring. An inverse
relationship is observed between fin area and gill area in
the pre~etamorphic stages in both species. Ho1eton (197la)
Page 134
58.
found that in young trout larvae the rhythmic movement
of the pectoral fins tended to create considerable currents
of water around them. The pectoral fins probably act as
accessory ventilatory organs in the early stages.
In both speoiea , the slope of in the early stages of its d velopment
the gill area body weight relationship is greater,than that several weeks
obtained long after metamorphosis In 1\
herring it decreases from a value of 3.36 to 0.79 while
in plaice it decreases from 1.59 to 0.85. The values for
the slope after metamorphosis are similar to those of the
oxygen consumption to weight relationships. For the herrin g
and plaice larvae the values are 0.82 and 0.6 5 respectively,
But included only newly metamorphosed fish (see Part Two) .
unlike the gill area work.
Li), .... C·ArJ (1 96() weight relationship
l(~r l.v~d (). f'l of he O2 consumption/body
':lfi t.l ·11 t (')1' "Itt,.
(1t)I')U ) oDr.ul"vcr1 tl <It 0.80 h '('~c l. 1"'1 f'd mosl- l:PPL: , j( , ~;.
1: c r~., Ul. " ',,'- u. '('Cdt ( _ill) V'l jnl:ion f1'" !lI I h"; It Inc
tlF't sp ci ~ro Clria l:l n ).' 1 tl\ ,·, J1' II t .... rr'i. -0 \v€.d.~Jh ,
1.'8.dtionship COllI be :x ·' ctc...!a (', '1.'1(' 1.
HOW0Vc.r 1 t ,(\1.lt~' b , po, 'I.' nt('cl (lIt '[-,11c' t 'Ill! [In, 'om i,C il.1
"une - i rm,l i\l:'.n ( !' 'V.' ) 1. -' :i.s
TIl -imt
Page 135
59..
(1966) es -tirnated that the r spira-tory sur:Cn.ce 'ra s bct';/een
(;O-7V6 of the totRl lmnel1ar surface, based 0 -Lhe ar a 0 C
blood channels in the secondary lamellae. Shunt 1nech' 11.15111:;
-too , may cmue into o pera-tion and therefor - tJ: e fun,,:: L.lona
area may be sX'llaller than 60 - 70% of the] antellar f;ur a c ,)'CC"
(Randall, 1970b), since alternate non resp.i.ra-to ry p().th\."'ly . ~
that: 811..1 yt blood },2St the !Oeconc1ary lmnellae c n b(~ US(~rl roo
deCreaGE; lari:211a:t:- ~")lood flow (8 l.:eel and J<l1. YSS8, 1964 •
Price (1931) obtained values of 0.78 and 2.38 for the
slope in the gill area to weight and_ gill area to length
relationship in fish of a size range of 2-40 cm. This
compares favourably with the values of 2.76 and 2.61 for
the gill area to length relationship in herring and plaice
respectively. Ursin (1967) analysing Gray's (1954) data
reported values of 0.82 for the slope of the gill area to
weight relationship. Muir and Hughes (1969) obtained
values of 0.85 for three species of tuna and 0.90 for
the blue fin tuna alone. Comparison of equations (3)
and (4) shows that a lmg herring has a correspondingly
higher gill area than a plaice of equal weight. This is
to be expected as a herring is comparatively more active
than plaice, also borne out by the high proportion of red
to white muscle in herring, which is correlated with the
activity of the fish (Love, 1970). Red muscle has not
been recorded for plaice. Nevertheless it may be
Page 136
60.
significant that the slope value for '0' group plaice
is higher than that of herring though not significantly
different (f = 0.23, P(0.05). It is therefore
tentatively concluded that the high rate of gill
development may be of some adaptive value, young plaice
being known to migrate up to the shallower parts of
bays (Macer, 1967; R. Gibson, personal communication).
Table 14 gives a comparison of the present data with
that of other authors for fish of the same weight. It is
evident that a 19 herring and bass have approximately the
same gill area while that of a plaice is five times less.
Tunas on the other hand have gill areas about five times
that of a herring or bass. The roach has a gill area about
half that of a herring or bass. Many authors have
commented on the relationship between gill area and the
activity of a fish. Gray (1954) found that the gill area
per g of weight of an active fish Brevoortia tyranus was
10 times greater than that of a slow moving fish (Opsanus
tau). In herring after metamorphosis the gill area per
unit weight is about 3.5 times that of plaice.
Price's (1931) observation that in the early stages
an increase in the gill area is brought about mainly by
an increase in the total filament length, is confirmed in
the present data. From equations (7) and (8) the total
Page 137
Table 14. Total gill area of herring and plaice
(pos~etamorphosis) compared with values of
other species based on a log-log relationship
of gill area to body weight.
Species 19 100g Author
mm2 2-Herring 882.36 33,546JrlITl Present data
Plaice 165.02 '7 8,269 " " "
Bass 865 " 33,000 " Price, 1931 - based on Muir & Hughes calculations of Price's data
Skipjacktuna 5,218 " 262,000 11 Muir & Hughes 1969
Ye110wfin & blue fin tuna 4,025" 200,000 " " "
Roach 398 19,000 " " "
Page 138
61.
filament length for a Ig herring and plaice was found to l'I1In, mnt
be 107\~and 389 Arespectively giving a ratio of 2.75. Table
15 gives a comparison of the present data with that of
Price who studied some fish in the size range investigated
here.
One interesting observation is that the spacing per rom
of filament increases with size, in the size range examined
for both species. In other species of fish studied the
spacing decreases (Muir and Hughes, 1969; Muir, 1969). Price on bass
(1931) who has made the only other developmental study has '\
not observed this either, probably due to his grouping of m
the data. From the present data \g herring and plaice
possess spacings of 31 and 28 lamellae per rom of filament
respectively as compared to Price's value of 40 per rom,
but since the slopes are positive it is possible that an
initial increase in the spacing per rom of filament is
followed by a decrease later on. The spacing of the
secondary lamellae varies greatly in different species
of fish. 'Hughes, (1966) and Hughes & Shelton (1962) have
considered its significance from an ecological viewpoint.
They state that in general, the more active fish possess
a larger number of filaments of greater length, (borne
out by the results in Tables 12 & 13) and therefore a
greater number of secondary lamellae. Further the secondary
Page 139
62.
lamellae are smaller and more closely packed than those
of a more sluggish fish. The smaller pore size in the
active species is believed to be advantageous in that
the diffusion distance is decreased although the gill
resistance will be increased. Thus more sluggish fish
have widely spaced lamellae and a reduced total filament
length, the resistance to flow relative to area being
less in these species. From Table 15 it is evident that
larval herring and plaice show their similarity to the
'active' and 'sluggish' category from a comparative as regards snacinr: 0 f -1['1r,lpl-1nc \t
viewpoint ~the por~ size of 1.S
metamorphosed herring and plaice whichAO.058 and 0.77 rom
respectively, (determined from. histological sections).
Harder (1954) believes that the pseudobranch
contributes towards gas exchange in herring. However,
in the early stages of its development in herring and
plaice the surface area is too small to make a
significant contribution towards gas exchange. It may
be doing so in the post~etamorphic stages, but one
cannot make definitive conclusions about it. Unlike the
gill area to weight relationship where a change was
observed in the slope around metamorphosis, no such
change was observed in the case of the pseudobranch.
As the pseudobranch is believed to have an osmoregulatory
Page 140
Table 15. Gill dimensnions for herring and plaice compared with that of Price's (1931) data on bass
for the same weight range.
Species
Herring
Plaice
Bass
Weight mg
300
300
332
Total filament length
(mm)
539.38
191.28
252
Spacing/nun of filament
30.39
26.95
28.08
Total number of pores (N) x 10
4*
1. 745
0.709
0.706
* calculated using Hughes (1966) method.
Page 141
63.
function its relationship with size is bound to be a
reflection of this parameter as well.
It is between the time of appearance of the gills
and metamorphosis that the gills must develop in
structure and function to take on the role of the
primary gas exchange organs. Correlated with this
there is a rapid development of gills initially in
both species, with a slowing down in the rate after
metamorphosis. The gill area of newly hatched trout is
small and gas exchange after hatching probably takes
place through the vascularised surface of the yolk sac
(Holeton, 197Ia). Here too, a rapid growth and development
of the respiratory pumps was observed during the first
18 days after hatching, similar to the gill development
in the present study. The skin is extremely thin in
newly hatched plaice (Roberts et ale 1973 ) and
herring (Jones et ale 1966). At metamorphosis the skin
is thickened in herring and in plaice (Roberts et ale
1973 ) to take on the protective function of the adult.
Page 142
64.
PART FIVE. THE DEVELOPMENT OF HAEMOGLOBIN.
V.I. Introduction.
Although the haematology of adult fish is well
documented (see Hunn, 1959; Mawdesley-Thomas, 1969;
Hawkins and Mawdesley - Thomas, 1972; ) in recent
years its importance has increased due to its value
as a tool in the diagnosis of fish diseases (Larsen
& Snieszko, 1961; Snieszko, 1960; Sumrnerfelt, 1967)
particularly in view of fish farming. In addition
fish are increasingly being used as a test species
in toxicological screening particularly in pollution
studies (Mawdesley - Thomas 1971). Thus many workers
have stressed the need for establishing normal
haematological values for fish. In contrast to this
haematological parameters in young fish larvae have
been sorely neglected. Radzinskaya (1960) attempted
to determine the first appearanc~f haemoglobin in
embryonic sturgeon, while Ostroumova (1962) determined
its appearance in embryo.l s of rainbow trout. Later
Radzinskaya U966, 1968) measured its concentration in
embryonic and juvenile salmon (Salmo salar L.). (a)
The present investigation was an attempt to determine
" (a) the time of appearance of haemoglobin using the method
of Slonimski(1927) and (b) measure it quantitatively using
Page 143
65.
the pyridine-resorcin micromethod of Korzhuev and Radzinskaya
(1957). The above methods involve the use of the peroxidase
properties of haemoglobin. These properties of haemoglobin
have been used by many authors for its determination, both
qualitatively and quantitatively when it is present in very cited by Radzinskaya 1960
low concentrations (Crosby and Furth, 1956) and form~ the A
basis of the benzidine and pyridine-resorcin method. Other
derivatives of haemoglobin such as methemoglobin, oxyhaemo-
globin and carboxyhaemog1obin also give a peroxidase reaction,
while other iron containing haemin compounds such as cytochrome,
cytochrome oxidase, catalase and myoglobin also possess
peroxidase properties (Radzinskaya, 1960).
V.2. Methods.
(a) Histochemical identification.
The benzidine method of Slonimski and Lapinski (1932)
as cited by Radzinskaya (1960) was used with slight modification
(refer Appendix XV). Drawings were made of the stained larvae
and some photographs were also taken.
(b) Spectrophotometric determination.
The method of Korzhuev and Radzinskaya (1957) which
involved a visual matching of colours was used with modification
for the spectrophotometric metho~of analysis. Haemoglobin acts
as a catalyst in the oxidation process where hydrogen peroxide
oxidises the pyramidon giving a violet colour. During the
Page 144
66.
reaction the haem group is believed to form an intermediate
compound which is coloured violet by the hydrogen peroxide.
Details of the standards used and the analytical method are
given in Appendix IV & V.
V.3. Results.
V.3.l. Histochemical identification.
The results are summarised in Table 16 and are
illustrated by Fig.29A & B. According to Radzinskaya
(1960) the slight bluish colour observed in the early
stages is not a true peroxidase reaction, the bluish
green colour being the true one. Peroxidase synthesis
appears to take place very early in development in both
species (Table 16). Plaice at stage 4b (Shelbournei
1957) show no visible pink colouration of the body and
no peroxidase activity is observed. There is however a
light pink colouration of the cardiac region particularly
above (dorsal to) the ventricle which is thought to arise
from haemoglobin or a precursor in the pericardial fluid.
The fluid when released gives a deep blue colour with the
benzidine reagent. In stage 5 plaice (i.e. just
metamorphosed) the blood corpuscles in the vessels to the
gills turn a visible pink colour. In addition the paired
dorsal aortae are also pink at this stage. The fluid from
Page 145
Fig.29. Sites of peroxidase synthesis in larvae as
determined by the benzidine test.
A. Herring at (i) 1 week of feeding.
(ii) 5 weeks of feeding.
B. Plaice at (i) 2 weeks of feeding (ventral
and lateral view). (ii) 3 weeks of feeding.
Page 147
Table 16. Summary of the staining characteristics of the two species using the benzidine test of Slonimski (1927).
Stage of development
Eggs
Yolk-sac
1 week of feeding
2 weeks feed-ing
3 weeks feed-ing
4 weeks feed-ing
5 weeks feed-ing
Species
Herring
Plaice
Herring
Plaice
Herring
Plaice
Plaice
Herring
Herring
Staining characteristics
48-68 h eggs show a slight bluish reaction at the region of the blastopore, and at the attachment discs. 4 day old eggs show a more intensive staining of membrane but not of larvae. Later ( 10 days ) membranes stained very rapidly (2-3 mins) and after about 5 mins the larva took on the stain. Separation of the larva from the egg membrane showed that the region of the body just behind the head and until about the last quarter of the body gave a slightly bluish stain. No stain was observed in the heart region or connection to the yolk sac, indicating the absence of peroxidase in these areas.
Membranes do not give a reaction in 3 day old eggs, but the larva gives a slight reaction. Later stage eggs (10 days old) give a more intense stain in the larva.
Gill region and heart give a bluish green colour, within 1-2 mins rest of the body took on a light green stain.
" " " " " " " " " " " " " " " " " "
Similar to the yolk-sac sta~e. In addition branches of the mandibular arterial arch also gave a stain, and at the base of~pectoral fins an intense stain appearsin the form of granules (Fig.29 A(i». Similar to yolk-sac stage except that gill and heart region stain more intensely, and blood vessels to gill and ventral head region take on the stain as well (Fig.29 B(i».
The ventricle does not stain probably due to a thickening of its wall, but sinus venosus stains intensely, as well as the blood vessels of gill and ventral part of the head. In addition the base of the caudal fins also give an intense stain. (Fig.29 B(ii».
Similar to 1 week of feeding. Gills staining more intensely than heart, probably due to increased muscle development in or around the heart.
Similar to 4 weeks feeding. In addition an intense staining was observed at the base of the caudal fin (Fig.29 B(ii».
Page 148
67.
these vessels give a deep blue colour when released. It
is probable that both corpuscles and fluid give the reaction
although no attempt was made to distinguish between them.
In herring the following changes are observed around
metamorphosis.
(a) At about 32 rom there is no visible pink colour in the
heart or gills and the larva is still transparent.
(b) Later (35-36 rom) the heart is light pink in colour,
the gills being lighter. Slight pigmentation was observed
dorsally and there was no silvery colour on the body (i.e.
no scales are present).
(c) At 37-38 rom the heart and gills are bright pink in
colour. The belly region is silvery at this stage. The
pericardial fluid when released gives a dark blue colour
with the benzidine reagent.
(d) About the 44 rom stage the heart and gills are bright
red in colour and the vessels along the length of the body
are a deep reddish pink. The dorsal part of the body is
deeply pigmented at this stage and the branchiostegal
apparatus is silvery in colour.
V.3.2. Quantitative measurements.
The results are expressed graphically as total
peroxidase concentration/larva and peroxidase concentration/
unit weight against weight on a log-log scale (Figs 30, 31 &
32 and Table 17). In herr1n~ the concentrat!on per
Page 149
Fig.30. Relationship between peroxidase concentrations per
larva and weight in herring.
v - I97I
'Y - I972
Page 150
300 HERRING
Q
'"' 100
V ~v V Q
Q . Q
50 Q 3 . Q • •
• ' .. •
10 i ' .
5·0 •
9 • '. . ... ,. . • , ~ 1·0 • •
0::
t :« ·50 ...J - • METAMORPHOSIS • W (/')
~ ·10 X 0 0:: ·05 • W • a.. 0'1 • :L
• ·01
{)05
·001 +--'--I'"""T''"T''T'T'TTT--'''-'''-'-T"T1"TTT--,--,-..,-,-n 5 10 50 100 500
WET WEIGHT (mg)
Page 151
Fig.3l. Relationship between peroxidase concentration per
larva and weight in plaice.
Page 152
500
100
~ 50 ::> 0:: « ...J -W (/') «10 9 X
~ 5 W 0..
lO
0'4
0·'
PLAICE
2 5 10
•
WET SO
• ••• •
REARED 9-1971 ·-1972
100 WEIGHT (mg)
WILD 0-1971 ·-1972
Page 153
Fig.32. Relationship of peroxidase concentration per
unit weight, to weight in A. Herring.
B. Plaice.
Page 154
HERRING 0 A ·50 RE~Dl971
o. 00
• m2
0
• • ·10 ••
• • •
,. • ·05 • • •
• • • • •
• • • -.-- .. ,
·01 • METAMORPHOSIS
• ·005 • r-J: s.2 w 3: r- 001 W 1 5 10 50 100 500 1000 3: 0'1 E
PLAICE - B W REARED WI.D >1 (/) 10 o 1971 •
0 ... '. ~ ~
• A~ 6
• 1972 • 6!: ... '" . ~ . >< - . '. '" ·05 o • .. t ••
~ • W • • a.. 0\ • :::l. t • ·01
METAMORPHOSIS
·005
• • •
·001 1 5 10 50 100 500 1000
WET WEIGHT (mg)
Page 155
Table 17. Equations for the relationship between concentration of peroxidase and wet weiqllt in herrinq
and plaice.
Herring Equation S. D. of Slope N _.
}lg Peroxidase/Larvae Reared - up to met. Log Y = 0.110 + 1.222 Log X 0.08 31
metamorphosed Log Y = 0.002 + 2.267 Log X 0.22 49
pg/mg Wet Wt. Reared - up to met. Log Y = 0.110 + 0.214 Log X 0.08 31
metamorphosed Log Y = 0.002 + 1. 262 Log X 0.22 49
Plaice
pg Peroxidase/Larvae Reared Log Y = 0.089 + 2.353 Log X 0.28 27
pg/rng Wet Wt. Reared Log Y = 0.090 + 1. 356 Log X 0.28 27
pg Peroxidase/Larvae Wild Log Y = 1. 521 + 0.848 Log X 0.10 37
pg/rng Wet Wt. Wild Log Y = 0.662 + 0.009 Log X 0.10 37
Page 156
68.
larva increases rapidly from its time of appearance up
to metamorphosis, followed by an apparent further increase
in the slope in newly metamorphosed fish. This difference
is significant (p)0.0005). reared
In plaice the slope decreases after metamorphosis as A
compared with 'wild' plaice caught locally. The difference
is highly significant (p>0.0005).
Peroxidase expressed per unit weight shows an increase
in the slope at metamorphosis in herring (Fig. 32A and
Table 17) which is highly significant. (p)O.0005). Plaice
on the other hand, show a decrease in the slope after
metamorphosis (P/O.0005) (Fig.32B and Table 17). Comparison
of the relative amounts of peroxidase shows these values to
be higher in plaice than in herring.
V.4. Discussion.
The sites of peroxidase activity in herring and plaice
larvae are similar to the observations of Radzinskaya (1960,
1962) on embryonic sturgeon and salmon, and Ostroumova (1962)
on embryonic rainbow trout. The slight reaction observed in
the egg membranes are probably due to other respiratory enzymes
such as cytochrome, cytochrome oxidases and catalases, since
they are the sites of gas exchange at these stages
(Radzinskaya, 1960). The staining of the body musculature
as well as the intensive staining at the base of the pectoral
Page 157
69.
and caudal fins is probably indicative of myoglobin or
its precursors in the feeding stages. This may probably
playa respiratory role in the life of the larva.
Quantitative measurements show a higher rate of
haemoglobin synthesis per individual at the pre-metamorphic
stage in plaice when compared to herring, but not at
metamorphosis. It is evident that even in the early
stages of its appearance both absolute and relative
values of peroxidase are higher in plaice than in herring.
The change in the slope at the post-metamorphosis
stage in plaice (Fig.32 and Table 17) is indicative of
a slowing down of its rate, initially from 3.00 to 0.95.
The high rate of haemoglobin synthesis around metamorphosis
in herring as compared to the pre-metamorphic stages
(Fig.30 and Table 17) is probably a reflection of the
increasing activity of the fish at these stages. It may
also be possible that the role of haemoglobin in the
inflation of the swim bladder acts as a contributory for its increase
factor~in the post metamorphosis stages.
A comparison of the present data with that of
Radzinskaya (1966) on salmon larvae is shown in Table 18.
Although the total concentration of haemoglobin in
Radzinskaya's data is low compared with the present
data, expressed as a ratio of weight it appears to be
Page 158
Table 18. Comparison of values o~ total and relative amounts of peroxidase of the present data
with that of other workers.
,u2 peroxidase/larvae ,11g peroxidase/unit weight Author
Stage of Species Weight Range mean N S.E. Mean N S.E. development (mg)
Newly hatched Sa1mo sa1ar L. 0.106 18 0.60 Radzinskaya (1966)
20-25 days old Salmo salar L. - 0.120 36 0.65 "
1 month old Salmo sa1ar L. 0.140 12 0.74 "
6 weeks old Clupea harengus 1. 93 - 2.75 0.028 7 0.006 0.011 7 0.003 Present data
6 weeks old Pleuronectes 5.80 -15.00 0.238 5 0.030 0.042 5 0.010 " plates a L.
10-11 weeks old C. harengus Pre metamorphic 12 - 105 1.340 23 0.120 0.031 23 0.003 Present data
17 months old S. sa1ar 38,000 49.000 1.28 Radzinskaya (1966)
Newly metamor- C. harengus 141 .. 438 93.99 49 11.84 1.548 49 1.238 Present data phosed
" " P. plates sa 6 32 13.41 22 2.556 0.648 22 0.068 " " -
'Wild' P. plates sa 92 - 410 115.19 37 8.585 0.716 37 0.031 " "
Page 159
high at least in comparison to the values for herring.
Houston and DeWilde (1972) observe that in the adult
carp no significant correlation was obtained between
haemoglobin concentration (in the blood) and weight.
Nevertheless statistically significant correlations
were obtained between these two parameters for these
young larvae. Unfortunately Radzinskaya's data do~ so
not give the weights of the larvae that graphical
relationship cannot established. for oxygen
Haemoglobin increases the affinity and oxygen "
carrying capacity of the blood even at low pO's 2
(Wittenburg, 1959, 1963; Hemmingsen, 1963; Moll, 1966).
Fox (1954) concluded that many fish must use their
haemoglobin only in emergencies while Holeton (197lb)
observes that active fish need the use of their
haemoglobin even for resting respiration. Nevertheless
there is an increasing body of evidence that fish,
especially those from temperate environments are not as
as dependent on their quantity of functioning haemoglobin much A
as a homeotherm. The most striking observation is the
discovery by Ruud (1954) of the haemoglobin-free fish
of the antarctic (the chaenichthyids) whose blood has
an oxygen capacity no higher than that of sea water.
Further most species of fish appear to have the ability
to lose most of their haemoglobin without suffering any
Page 160
71.
great damage. Steen and Berg (1966) and Ryback (1960)
give reports of fish with severe anaemia but otherwise
appearing normal. Many authors have used carbon monoxide
to block more than 90% of the oxygen carrying capacity of
the haemoglobin in a variety of fish without any harmful
effects (Nicloux, 1923; Anthony, 1961; Holeton, 1971b)
and also fish larvae (Holeton, 1971a~ Fish from higher
latitudes appear to have lower levels of haemoglobin
(Everson and Ralph, 1967). Holeton (1972) suggests that
in the red blooded fish of the antarctic the haemoglobin
may serve primarily for the uptake of oxygen from a
hypoxic environment, emphasising the qualitative rather
than the quantitative aspects of haemoglobin.
Thus in fish larvae, the lack of a respiratory pigment
in the early stages of development in the plankton where no
oxygen depletion is likely to occur would not greatly affect
the metabolic requirements of the animal, this being offset
by the high body surface area to weight ratio (see Part Four).
Around metamorphosis when activity increases in an inverse
proportion to diminishing body surface area the appearance
of gills followed by the appearance of respiratory pigment
offsets any disadvantages that might otherwise accrue,
especially under hypoxic conditions (de Silva and Tytler,
1972).
Page 161
72.
GENERAL DISCUSSION.
Although the study of larvae is a very rewarding one
in that it is a relatively new field, considerable
difficulties lie in the seasonal nature of the material and
the rearing of larvae which is very time-consuming. From the
present study it appears that the early feeding stages of both
species are sensitive to low oxygen from the point of view of
their oxygen requirements as shown by the high LDS0 values at
these stages. Survival at low oxygen tensions was achieved in
the early feeding stages of both species by a fair degree of
"regulation" that is , as pointed out earlier they regulate
their oxygen consumption down to some critical pressure,
followed by "conformity" in the later feeding stages where
the oxygen consumption increases with increasing environmental
oxygen concentration. A certain degree of switching back to
regulation was observed in the metamorphosed fish due to the
appearance of haemoglobin at metamorphosis. This results in the
metamorphosed fish being more resistant to lowered oxygen
concentrations due to the increased oxygen-carrying capacity of
the blood. The development of both gill area and haemoglobin
concentration (measured as peroxidase) show similar patterns
in that the relationships of these parameters with size show
a change in the slope around metamorphosis. The peroxidase
concentration per unit weight is higher in plaice than in herring
but the gill area to body weight ratio is lower, probably
Page 162
73.
offsetting the haemoglobin concentration in metamorphosed
fish.
One cannot say whether the gills are functional after the
appearance of the secondary lamellae at 3 weeks and 5 weeks
of feeding in plaice and herring respectively, but it is highly
probable that they play a role in respiration however slight
as the external surface area is decreasing considerably in
relation to body size. Further, the skin thickens as
metamorphosis takes place in herring and plaice as shown in the
present study. This has also been reported for plaice by
Roberts et ale (1973). The gills will presumably have to
take over the major respiratory role at this time. It may
also be significant that even in the early stages of gill
development the longest filaments are found on that part of the
gill arch where maximum water flow occurs.
Gill area to body weight relationships for both species
up to metamorphosis have high slope values of 3.36 and 1.59
for herring and plaice respectively. When the total respiratory
surface area, including that of the gills when they appear
( Table 19 & 20 ), is plotted against body weight on a log-log
basis, slope values of 0.59 and 0.51 are obtained for herring
and plaice. since~Biygen uptake to body weight relationship
has been found to be similar to that of the gill area to body
weight relationship for adult fish the total respiratory surface
Page 163
Table 19. Total respiratory surface with development in herring and plaice.
Herring
Total Surface Gill Total Surface Wet Area Area Area + Gill Area Weight (nun2 ) (111Il\2 ) (mrn2 ) (mg)
24.268 24.268 1.138
35.199 35.199 1. 827
57.330 57.330 4.583
87.899 87.899 10.649
113.065 0.071 113.136 15.612
141. 38 0.591 141.97 29.249
152.52 1.102 153.60 35.215
246.36 9.201 255.56 66.230
320.32 50.944 371.26 110~220
423.82 118.102 541. 92 141.560
(588.85) 659.282 659.282 236.160
Plaice
Total Surface Gill Total Surface Wet Area Area Area + Gill Area Weight (mrn2 ) (mm2 ) (nun2 ) (mg)
14.57 14.57 0.370
25.07 25.07 1.163
41. 51 .229 41. 74 3.512
77.98 1. 245 79.23 10.161
104.52 3.846 108.37 20.654
Page 164
Table 20. Equations for the relationship between the total respiratory
Herring
Plaice
surface and weight in herring and plaice.
Correlation Coefficient
Log Y = 1.3476 + 0.594 log X
Log Y = 1.3705 + 0.505 log X
where Y 2 = Total respiratory surface (mm )
X = Wet weight (mg)
r = 0.9924
r = 0.9988
Page 165
74.
to body weight relationship should also be similar. The lower J .. -'
values obtained in the present instance ~ therefore surprising
but other information such as the diffusion rates and the I" ,I,,·r.. ~ :~: - .w.. .,. 'f" it I
rate of ventilation .naeds-tqne--hown,as well as the thickness
of the water - blood pathway uraqu1red before definitive
conclusions are reached.
r: '/') " ~;,- I Vaz.netsov (1953! quoted by Tesch, 1968 ) says that
during their development fish typically pass through several
phases each of which has its own length-weight relationship,
that is with a change in the 'be value (slope). Tesch
suggests that these may be "crises" in the life history,
metamorphosis being an example. Such a change in the slope is
evident from the work of Marshall, Nicholls & Orr (1937 & 1939)
on herring larvae and juveniles, and Le Cren (1951) on perch.
The present study reveals that such changes were also evident
in other relationships, for example that of gill area to body
weight and haemoglobin concentration to body weight. There
may well be other similar developmental events.
The lack of well developed respiratory structures would
not be a disadvantage immediately after hatching as the external (, t .... ~
surface area is high compared to size, but as development
proceeds and the larvae begin to feed and generally increase
in activity it may become a critical factor. As the larvae
increase in size the demand for oxygen increases and therefore
the larvae are more susceptible to decreasing oxygen
1
Page 166
75.
concentration. This is illustrated by the high LOso values in
the early stages. Further, the absence of blood corpuscles in
these stages would mean a decreased blood viscosity and
improved blood flow, but the lack of haemoglobin means that the
oxygen-carrying capacity is low. The present study has not
revealed whether stages prior to haemoglobin formation are at a
disadvantage due to its absence. The appearance of haemoglobin
around metamorphosis may be due to the normal course of
events, taking place at a .particular length, or it may also
be due to a functional need due to increasing activity at this
time. Herring larvae start to shoal about 25-28 mm (Rosenthal,
1968) and plaice begin to move into inshore waters at metamorpho-
sis (Gibson, personal communication). To summarise the above:
Young
Advantages (l)High surface area
jbody weight ratio. (2)Oxygen transport
over short distance to site of requirement.
(3)Low blood viscosity.
Disadvantages (l)Poor oxygen carry
ing capacity. (2)Active.
Herring
Intermediate
Gills starting to develop Low blood viscosity.
Metamorphosed
Gills increase area for gas exchange. Hb - increases oxygen carrying capacity.
Poor oxygen carrying capacity. Increasingly active.
High blood viscosity.
Highly active, pelagic, shoaling.
Surface areal body weight ratio decreasing.
Low surface area/body weight ratio
Page 167
76.
In plaice the stages are similar to herring except in the
metamorphosed fish where at metamorphosis they settle down on
the bottom and lead a benthic existence.
The tolerance levels of herring and plaice larvae to
water of low oxygen concentration can be correlated with their
respective ecological niches. Herring lay demersal eggs and the
low L050 values for yolk-sac herring is probably advantageous
when the larvae find themselves in water of .. low oxygen
concentration in or around the layers of eggs on the spawning
beds. Parrish et ale (1959) observed that eggs were 4-8 layers
thick on the spawning bed~the Firth of Clyde while Bowers ~ (1969) observed that it was 2-9 eggs deep in one patch off the
Isle of Man. Plaice on the other hand lay pelagic eggs
(Simpson,195l; Shelbourne, 1957) and therefore the larvae when
hatched are more likely to find themselves in regions of high
oxygen content.
Adult fish respond to hypoxia by both circulatory and
respiratory adjustments. Some of these responses are observed
in fish larvae. Holeton (l97la) observed a bradycardia in
trout larvae at oxygen levels below the lethal limit reported
~or these species by other workers. In addition, ventilation
rates may also increase as shown by the present study and by
Holeton(l97la). In the early feeding stages there is a
certain amount of regulation in the two species followed by
conformity at the later feeding stages.
It has been pointed out by some workers (see Satchell,
Page 168
77.
1971) that the response of independent and dependent species
of adult fish (regulators and conformers respectively) may n
each offer specific advantages under certain enviromental ,
conditions. Independent species (regulators) with their ability
to increase ventilation to offset lowered oxygen content in
inspired water can maintain the supply of oxygen to their
tissues, and as such are well suited to survive hypoxia of
short duration. On the other hand dependent species (conformers)
may be better able to survive longer term hypoxia. The
reduced rate of oxygen consumption by the older larvae may be
one of the courses open to them for survival during a time of
switching over either partially of completely, to gill respiration
especially if the energy involved in extracting oxygen from
water of low oxygen content. is too great to be maintained. Wt
One interesting aspect must be discussed at this stage is A
the behavioural response to water of low oxygen content. It I
is well known fo~large fish that activity is reduced by a \
reductionpf swimming speed in hypoxic water. Davis et ale
(1963) observed a decrease in the swimming ;perforrnance of
Pacific salmon in response to hypoxia as did Kutty(1968)
working on goldfish and rainbow trout. From oxygen consumption
studies at low oxygen concentration it was evident that when
........ ,.,... ~ ... 4uce:fhetr aotivity _ by
reducing their oxygen consumption. It might seem important
for organigrns to increase their activity in progressively
Page 169
78.
hypoxic conditions to increase the chance 0 fescape before
the oxygen concentration reached a lethal level.
Rosenthal & Hempel (1970) estimated that herring larvae
at the yolk-sac stage move about 12-36 m/h and larger larvae
(18-20 rom) move 36-72 m/h. Further, the yolk-sac larvae show
more intermittent movement followed by periods of rest and slow ~ sinking, whereas larger larvae swam more continuo/ly. Larvae
also swam much faster before feeding. Blaxter (1962) observed
that the maximum swimming velocities in herring larvae
increased from 3 cm/sec at 8 rom to 30 em/sec in 20 mm larvae,
Rosenthal & Hempel{1970) observed that the velocity of darting
increases with increasing length of the larvae from about 6 cm
/sec in yolk-sac larvae of the herring to 25 cm/sec in larvae
of 14 mm l~ngth. Plaice larvae were found to have darting
speeds of 4-12 cm/sec (Ryland, 1963). This darting ability
would be of great advantage to larvae in escaping from
hypoxic conditions.
Some authors have estimated the ability to search for prey
by using the cruising speeds of the larvae. Blaxter & Staines
(197l) calculated that the volume searched by herring larvae
ranged from 0.3 to 2.0 llh at lengths of 8 to 16 mm and in
plaice larvae from 0.1 to 1.8 l/h at lengths of 6 to 10 mm.
Rosenthal & Hempel (1970) obtained higher values of 1.5 1 to
10 1 for the volumes searched, from the early stages of herring
larvae up to 4 weeks post hatching. In contrast to this plaice
larvae showed a 90% reduction in the volume searched at
Page 170
79.
metamorphosis. (Blaxter & Staines,197l). Under conditions of
hypoxia herring which are more active, especially at
metamorphosis would be able to escape more easily than
plaice which are considerably less active.
It would be appropriate to consider
the relationships between fecundity, egg size and the type
of young produced among the fishes. The most primitive
condition is observed in some marine fishes where the eggs
and sperms are released into the open sea, fertilization
being external and large numbers of eggs are produced to
make up for predation and mortality that takes place. On the
other hand where the eggs are laid in protected situations
and there is parental care, the number of eggs produced is
reduced as in some littoral species and most fresh water fish.
Parental care reaches its highest expression in viviparous
forms where the young a~e protected and nourished within the
body of the female parent. Here the young that are born are
at a well developed stage able to fend for themselves.
In pelagic food fish such as the herring fecundity
ranges from 20,000 to 80,000 in Cly.de herring (Baxter,1959)
and in gadoids such as cod it ranges from 500,000 to 9,000,000
(May, 1967) while in plaice it ranges from 50,000 to 300,000
in the Clyde (Bagenal,1958). Further, the fecundity also changes
with latitude,areaand season (Baxter,1959). In these fish,
the larvae are small at hatching ranging from 4-8 mm (see
Blaxter, 1969). Respiration takes place mainly through the
Page 171
80.
skin (Fry, 1957). The surface area to body weight ratio is
extremely high and thus oxygen is transferred rapidly by
diffusion to the tissues. Further, the larvae are transparent
and this serves for camouflage from predators.
On the other hand in most fresh water and littoral fish
fewer eggs are produced. In salmonids fecundity ranges from
about 2,000 to 15,000 per fema~e "(Mllls,1971). A high fecundity
is not essential as in herring or plaice since the eggs are
laid in nests under several inches of gravel. The young which
hatch out are large in comparison to marine fish larvae, and
also possess fUnctional gills and haemoglobin absent in the
latter.
Gibson (1969) who has reviewed the biology of littoral
fish observes that littoral fish in general lay demersal eggs.
These are attached to stones where they are guarded by the
male parent. Many adaptations are seen for retaining the eggs
in one place such as the constructing of nests among weeds,
in burrows and in crevices. In the sea-horse Hippocampus the
eggs~re attached to the male parent enclosed in a brood pouch.
The low fecundity of littoral fish ranging from a few hundred
to several thousand (Gibson, 1969) can be associated with the
care given to laying eggs in protected places and the consequent
guarding of the eggs to prevent predation.
Parental care reaches its highest stage of development
Page 172
81.
among OVoviviparous and viviparous forms. In the former
the female parent serves only for protection, while in the
latter respiratory and excretory demands are also met. In
general viviparous forms produce a small number of
large young, relatively independent at birth. If the young
are more developed and larger at birth, their surface to volume
ratio will be low and the distance between the respiring tissues
and the source of oxyge~ould be great. --- Under such conditions ~
the development of a respiratory pigment ~d.J)e of selective
advantage. Among the fishes, only the elasmobranchs and
teleosts have achieved true viviparity (Hoar, 1969). In the
skates and rays ovoviviparity is the rule. In Pteroplatea,
the "trophonemata" serve to connect the maternal tissue
with that of the embryo (Amoroso, 1960). Viviparity reaches
its highest expression in some selachians with the development
of a yolk-sac placenta. In the teleosts viviparity is
confined to two orders and all grades of maternal
dependence are observed as in the elasmobranchs.
Associated with viviparity a foetal-maternal shift
1s observed in the oxygen affinity of the Ihaemoglobin.
During the gestation period of 22 to 23 months of the spiny
dogfish Sgualus suckleyi the foetal haemoglobin was
found to have a higher oxygen affinity than the adult
Page 173
82.
pigment (Manwell, 1963). The oviparous ray has a transient
embryonic haemoglobin of high oxygen affinity during the
first few months of development (see Manwell, 1960).
Apparently foetal haemoglobin has appeared several times
in vertebrate evolution and hence it is believed to be
significant for the success of viviparity (Prosser, 1969).
In viviparous forms the transfer of oxygen takes place
from air to maternal blood to foetal blood to foetal tissue.
Instances of marine fish larvae possessing haemoglobin
at hatching are rare. One example is the grunion Leuresthes
tenuis. It spawns just after the turn of the high tide at
certain times of the year, literally out of water (Lagler,
et al., 1967). Eggs and sperms are deposited in pockets in
the wet sand high up on the shore so that they are washed
away by the next high tide two weeks later. When the waves
come up the eggs hatch almost immediately and go out with
the waves before the tide recedes. The blood corpuscles
are coloured red, long before hatching (David, 1939) and
at hatching the gill lamellae are visible.
Among the amphibia similar trends are observed in
forms with direct development. In species that accord no
parental care , large numbers of eggs are produced as in the
common frog Rana, wit~ progressive decrease in the numbers
of young produced with increasing parental care and tendencies
Page 174
83.
towards viviparity. Parental care takes many forms such
as the eggs being wrapped round the legs of the male in Alytes
or carried in pits on the back of the female in Pipa, or
in a sac on the back in Gastrotheca (Young, 1962). In one
species of the latter calcareous plates give extra protection.
Vivipary is common among the Apoda. Mouthbreeding which
is observed in several fishes , is present only in one
amphibian species, Hylarnbates brevirostris (Cochran,1961;
cited by Etkin & Gilbert, 1968). Where there is no direct
development as in some Urodeles, many adults retain a
number of larval characters such as external gills and
partial or complete absence of limbs. In this group
the dramatic changes observed at metamorphosis in the
Anurans are lacking. Among the fishes too, metamorphosis
is not a dramatic change, comparatively speaking except
among a few groups such as the Pleuronectidae.
It would be interesting to find out whether
haemoglobin in newly metamorphosed ,'herring and plaice
is functional at levels corresponding to air saturation,
using carbon monoxide which serves to incapacitate the
haemoglobin and therefore alter the oxygen-carrying capacity
of the blood. Furthe'r it would be useful to find out
if the appearance of haemoglobin could be accelerated
by rearing larvae in water of low oxygen concentration.
,
Page 175
84.
In many invertebYates, decrease of environmental oxygen
concentration has been found to increase the haemoglobin
concentration in the animal. In Daphnia the haemoglobin
concentration increases in oxygen-deficient water. Similar
observations have been made on insect larvae such as
Anatopynia and Chironomus and also Artemia and Planorbis
(Fox, 1954, 1955). In Chironomus plumosus larvae Weber
(1965; cited by Weber,1971) has shown that increased
concentrations of respiratory pigmp.nt may be of vital
significance since larvae that are rich in haemoglobin
survive gradual depletion of oxygen more successfully
than their paler counterparts. It is evident that more
work needs to be done on fish larvae so as to obtain a
deeper insight into their respiratory mechanisms.
Page 176
85.
SYNOPSIS
1. The development of respiratory mechanisms in herring
and plaice larvae were investigated. The aspects
studied were, tolerance and resistance to low oxygen
levels, dependence or independence with respect to
low oxygen concentrations, changes in oxygen uptake and development
with deve1opment~of gills and haemoglobin.
2. Incipient lethal levels CLDSO> varied with the stage
of development of the two species. In herring and
plaice at the yolk-sac stage it corresponded to 1.93
and 2.73 m1/1 respectively. At two weeks of feeding
the level changed to 3.08 and 2.66 mIll. After the
. gills begin to appear the LDSO levels in both species
fell to 2.91 and 2.52 m1/1 and at metamorphosis to
2.17 and 1.69 m1/1 for herring and plaice respectively.
3. Oxygen uptake/animal increased with development and
the Q02 showed an expected decrease for both
anaesthetized and unanaesthetized 1arvaeD The Q02
of anaesthetized herring larvae ranged from 0.95 to
1.33 and of plaice 0.75 to 2.52. The Q02 of
unanaesthetized herring larvae ranged from 1.36 to
2.62 and of plaice 1.12 to 4.12. The basal metabolic
1
Page 177
86.
rate, as assessed from anaesthetized larvae, was
approximately half the routine rate as determined
from the oxygen uptake of unanaesthetized larvae.
4. Routine metaoolism could be represented by the
equation y= 1.88 X 0.82 and Y = 1.67 xO• 65 for
herring and plaice respectively where Y = pl/larva/h
and X= dry weight in mg. Basal metabolism could be
represented by the equations Y = 1.063 xO. 93 and
Y = 1.01 X 0.63 for herring and plaice respectively.
5. The early stages of larvae of both species showed
some degree of "regulation" of oxygen uptake as
the oxygen concentration fell, i.e. they maintained
their uptake to that at the air saturation level.
Later feeding larval stages showed "conformity",
i.e. the oxygen uptake decreased with the oxygen
concentration of the surrounding water. After
~etamorphosls and the appearance of respiratory
pigment a degree of "regulation" re-appeared.
6. Relationships of surface area to length in herring
and plaice show isometric growth, and are represented
oy the equations Y= 0.16 x2 • l4 and Y = 0.09 X 2.27 1
for herring and Y = 0.12 X 2.58 and Y = 0.22 x2 •09 1
Page 178
87.
for plaice where Y and Yl are the total surface area
and body surface area respectively in mm2 , x = length
in rom.
7. Relationships between surface area and weight in
herring are expressed by the following equations
Y = 22.93 W 0.57, Y1
= 16.59 W 0.61, Y2 = 7.08 W 0.41.
For plaice relationships between surface area and
weight are expressed by the following equations,
Y = 23.42 W 0.50, ~ = 16.03 W 0.40 and Y2
= 6.73 W 0.68
where Y, Y1 and Y2 are total surface area, body
surface area and fin area respectively in rnm2 , W being
the wet weight in mg.
8. Length-weight relationships could be expressed by the
following equations, Y = 0.00001 X 4.19 and
Y = 0.000016 X 4.58 for herring and plaice
respectively where Y = dry weight in mg and X = length
in mm.
9. Secondary lamellae begin to appear on the gill
filaments at about 9 mm and 22 mm in plaice and
herring respectively.
Page 179
88.
10. Gill area to weight relationships in both species
show a change in the slope around metamorphosis.
In herring up to 40 mm, Y = 0.000007 W 3.36~
beyonq 40 mm, Y = 3.76 W 0.79, where Y = gill
area in mm2 and W = wet weight in mg. In plaice,
the gill area to weight relationships, up to and
beyond metamorphosis are represented by the equations,
Y = 0.03 W 1.59 and Y = 0.47 W 0.85 respectively where
Y = gill area in mrn2 and W = wet weight in mg. It
is evident that gill development slows down after
metamorphosis in both species.
11. Similar changes in the slope at metamorphosis are
observed with gill dimen~sions such as the total
filament length and area of an average secondary
lamella with size in both species. Such a change
was also evident in the spacing of the secondary
lamellae with increasing size in herring but not in
plaice.
12. Histological sections revealed a thickening of the
skin in the two species at metamorphosis.
13. There was no evidence of corpuscles in the blood
of newly hatched herring and plaice larvae.
Page 180
R9.
Corpuscles of both types viz. lencocytes and
erythrocytes were observed at about 10 rom and
29 mm in plaice and herring respectively.
14. Peroxidase precursors were present in the early
feeding stages of both species as demonstrated by
the benzidine reaction. Total peroxidase concentration
in both species showed a change in the slope at the
post metamorphosis stages. Relationship of total
peroxidase concentration per larva with increasing
size in herring is given by the following equations,
Y = 0.11 W 1.22 and Y1= 0.002 W 2.27 up to and beyond
metamorphosis respectively where Y = peroxidase
concentration in pg and W = wet weight in mg.
15. In reared plaice the total peroxidase concentration
per larva is given by the equation Y = 0.09 W 2.35.
For 'wild' plaice Y = 1.52 W 0.848 where Y = peroxidase 1
concentration in pg and W = wet weight in mg.
16. Peroxidase expressed per unit weight in herring show
an increase in the slope against weight on a log-log
basis at metamorphosis from 0.21 to 1.26. Plaice,
on the other hand, show a decrease in the slope from
Page 181
90.
1.36 to 0.01. These differences are highly
significant. Comparison of the relative amounts
of peroxidase show these values to be higher in
plaice than in herring.
Page 182
91.
BIBLIOGRAPHY
Alderdice, D.F., & C.R. Forrester, 1968. Some effects of
salinity and temperature on the early development and
survival of English sole, (Parophrys vetulus). J. Fish.
Res. Bd Can.2Sc 495-521
Amberson, W.R. & P.B. Armstrong, 1933. The respiratory
~etaoolism of Fundulus heteroclitus during embryonic
development. J. cell. compo Physiol 2: 381-397.
Amoroso, E.C., 1960. Viviparity in fishes. Symp. Zool.
Soc. London l~ 153-181.
Anokhina, L.E., 1963. Some aspects of the fecundity of
the herring in the White Sea. Rapp. Cons. Explor.
Mer, 154: 123-127.
Anthony, E.H., 1961. Survival of goldfish in presence of
carbon 1ll0noxide. J. exp. BioI. 38: 109-125.
Bagenal, T.B., 1958. The fecundity of Clyde plaice.
a. mar. oio1. Ass. U.K. 37: 309-313.
Baxter, I.G., 1959. Fecundities of winter-spring and
summer~utumn herring spawners. J. Cons. perm. into
Explor. Mer, 25: 73-80.
Beamish, F.W.H., 1964. Respiration of fishes with special
emphasis on standard oxygen consumption. II Influence
Page 183
-Q 2.
of weight and temperature on the respiration of
several species. Can. J. Zool. 42: 177-188.
Beamish, F.W.H. & P.S. Mookerjii, 1964. Respiration of
fishes with special emphasis on standard oxygen
consumption. I. Influence of weight and temperature
on respiration of goldfish Carassius auratus. Can.
J. Zool. 42: 161-175.
Benedict, F.G. 1938. Vital energetics, a study in
comparative basal metabolism. Carnegie Institution
of Washington, Publication, 503.
von Berta11anfy, L., 1938. A quantitative theory of
organic growth (Inquiries on growth laws II). Human
Biology. 10(2): 181-213.
von Berta11anfy, L., 1951. Metabolic types and growth
types. Amer. Nat. 85: 111-117.
Bishai, H.M. 1960. The effect of the gas content of water
on larval and young fish. Zeit. wiss. Zool. 163:
37-64.
Bishai, H.M. 1962. Reactions of larval and young salmonids
to water of low oxygen concentration. J. Cons. perm.
int. Exp1or. Mer 27: 167-179.
B1axter, J.H.S., 1962. Herring rearing - IV. Rearing
beyond the yolk-sac stage. Mar. Res., 1962(1), l8pp.
B1axter, J.H.S., 1966. The effect of light intensity on
the feeding ecology of the herring. Syrnp. Brit. Eco1.
Page 184
93.
Soc. 6: 393-409.
Blaxter, J.H.S., 1968. Rearing herring larvae to metamorphosis
and beyond. J. mar. bioI. Ass. U.K. 48: 17-28.
Blaxter, J.H.S., 1969. Development eggs and larvae. In:
W.S. Hoar & D.J. Randall. Fish Physiology Vol III:
Academic Press Inc., New York: 178-252.
B1axter, J.H.S. & G. Hempel, 1963. The influence of egg
size on herring larvae (Clupea harengus L.). J. Cons.
into Explor. Mer, 28: 211-240.
Blaxter, J.H.S. & M. Staines, 1971. Food searching potential
in marine fish larvae. Fourth. Europ. Mar. BioI. Symp.
Ed. D.J. Crisp. Cambridge University Press. 467-485.
Bliss, C.I., 1952. The statistics of bioassay with special
reference to the vitamins. Academic Press Inc., New
York: 628pp.
Bowers, A.B., 1969. Spawning beds of Manx autumn herrings.
J. Fish BioI. I: 355-359.
Brett, J.R., 1952. Temperature tolerance in young pacific
salmon,genus Onc"hor"hyn'c"hus. J. Fish. Res. Bd Can. 9:
265-323.
Brett, J.R., 1962. Some considerations in the study of
respiratory metabolism in fish particularly salmon.
J. Fish. Res. Bd Can. 19: 1025-1038.
Brett, J.R., 1970. Fish .. The energy cost of living. In:
W.J. McNeil. Marine Aquiculture. Oregan State
Page 185
94.
University press. 37-52.
Burfield, S.T., 1928. The absorption of oxygen by plaice
eggs. J. exp. BioI. 5: 177-184.
Byczkowska-Smyk, W., 1957. The respiratory surface of the
gills in teleosts. Part I: The respiratory surface of
the gills in the flounder. Pleuronectes platessa, and
perch, Perca fluviatilis. Zoologica Pol. 8: 91-111.
Byczkowska-Smyk, W., 1958. The respiratory surface of the
gills in teleosts. Part II: The respiratory surface of
the gills in the eel· (Anguilla anguilla L.), the loach
(Misgur·n·u·s· ·fossilis L.l. and the perch - pike· (Lucioperca
lUcioperca L.). Acta bioI. cracov. I: 83-97.
Byczkowska-Smyk, W., 1959. The respiratory surface of the
gills in teleosts. Part III: The respiratory surface of
the gills in the tench(Tinca ·tinca L.), the silver
bream (B'licC'a bjoe'rkna L.) and the chondros toma
(Chondrostomanasus L.). Acta,biol. cracov. 2: 73-88.
Carver, M.F.F. & A.R. Gloyne, 1971. The effects of variation
in ambient temperature on the Gilson differential
respirometer. Lab. Pract. 20= 5.
Carpenter, J.H., 1966. New Measurements of oxygen solub
ility in pure and natural waters. Limnol. Oceanogr. 11:
264-177.
David, L.R., 1939. Embryonic and early larval stages of the
Page 186
95.
grunion, Leuresthes tenuis, and of the sculpin,
:Scorpaena guttata. Copeia, 2: 75-81.
Davis,G.E., J. Foster, C.E.Narren & P.Doudoroff, 1963. The
influence of oxygen concentration on the swimming
performence of juvenile Pacific salmon at various
temperatures. Trans. Am.Fisheries Soc. 92: 111-124.
De Silva,C.D.& P. Tytler, 1972. The influence of reduced
environmental oxygen on the metabolism and survival of
herring and plaice larvae, 7th Europ. Mar. BioI. Symp.
Texel.
Doudoroff, P. & D.L. Shumway, 1970. Dissolved oxygen
requirements of freshwater fishes. F.A.O. Technical
paper No. 86.
Dragesund, 0., 1970. Recruitment studies of Norwegian spring
spawning herring. Fisk Dir. Skr. Sere HavUnders., 15:
381-554.
Edwards, R.R.C., D.M. Finlayson & J.H.Steele, 1969. Ecology
of '0' group plaice and common dabs in Loch Ewe. II
Experimental studies of metabolism. T. expo mar. BioI.
Ecol. 3: 1-17.
Ehrlich, K.F., 1972. Morphometrical, behavioural and chemical
changes during growth and starvation of herring and plaice
larvae. Ph.D. Thesis, University of Stirling, Scotland.
Etkin,W. & L.I.Gilbert, 1968. Metamorphosis a problem in
developmental biology. Appleton-Century Crofts. New
York. 459pp.
Everson,I. & R.Ralph., 1968. Blood analyses of some
Page 187
96.
Antarctic fish. Br. Antarctic. Surv. Bull. No 15:
59-62.
Ewer, R.F., 1942. On the function of haemoglobin in Chironomus.
J. exp. BioI. 18(3): 197-205.
Fox, H.M. 1954. Oxygen and haem in invertebrates. Nature,
Lond., 174: 355.
Fox, H.M., 1955. The effect of oxygen on the concentration
of haem in invertebrates. Proc. roy. Soc. B., 143:
203-214.
Fox, H.M., & C.A. Wingfield, 1938. A portable apparatus for
the determination of oxygen dissolved in a small
quantity of water. J. exp. BioI. 15: 437-445.
Fox, H.M., C.A. Wingfield & B.G. Simmonds, 1937. Oxygen
consumption by aquatic insects fram different
environments. J. exp. BioI. 14: 210-218.
Fry, F.E.J., 1951. A fractionating column to provide water
of various dissolved oxygen content. Can. J. Technol.
29: 144-146.
Fry, FoE.J., 1957. The aquatic respiration of fish. In:
M. Brown. The physiology of fishes Vol 1: Academic
Press Inc., New York: 1-63.
Fry, F.E.J., 1971. The effect of environmental factors on
the physiology of fish. In: W.S. Hoar & D.J. Randall.
Fish Physiology Vol VI: Academic Press Inc., New York:
1-98.
Page 188
97.
Gibson, R.N., 1969. The biology and behaviour of littoral
fish. Oceanogr. Mar. BioI. Ann. Rev., 7: 367-410.
Gray, I.E., 1953. The relation of body weight to body
surface in marine fish. BioI. Bull. mar. bioI. Lab.,
Woods Hole. 105: 285-288.
Gray, I.E., 1954. Comparative study of the gill area of
marine fishes. BioI. Bull. mar. bioI. Lab., Woods
Hole. 107: 219-225.
Harder, W., 1954. Die Entwicklung der Respiration-sorgone
beim Hering. (Clupea harengus L.) Z. Anat. EntwGesch.
118: 102-123.
Hawk, P.B., B.L. Oser & W.J. Summerson, 1954. Practical
Physiological Chemistry. McGraw-Hill, New York: 1-439.
Hawkins, R.I. & L.E. Mawdesley-Thomas, 1972. Fish haematology
- A bibliography. J. Fish BioI. 4(1): 193-232.
Hayes, F.R. 1949. The growth, general chemistry and
temperature relations of salmonid eggs. Q. Rev. BioI.
24: 281-308.
Hemmingsen, E.A., 1963. Enhancement of oxygen transport by
myoglobin. Compo Biochem. Physio!. 10: 239-244.
Hjort, J. 1914. Fluctuations in the great fisheries of
northern Europe viewed in the light of biological
research. Rapp.P.-v. Reun. Cons. perm. into Explor.
Mer. 20: 1-228.
Hoar, W.S., 1969. Reproduction. In: W.S. Hoar & D.J. Randall.
Page 189
98.
Fish Physiology Vol III: Academic Press Inc., New York.
1-72.
Holeton, G.F., 1971a. Respiratory and circulatory responses
of rainbow trout larvae to carbon monoxide and to
hypoxia, J. expo BioI. 55: 683-694.
Holeton, G.R., 1971b. Oxygen uptake and transport by the pxnosure
rainbow trout aurin.'?; to carbon monoxide.
Holeton, G.R.,1972. Gas exchange in fish with and without
haemoglobin. Respir. Physiol. 14: 142-150.
Holliday, F.G.T., J.H.S. Blaxter & R. Lasker, 1964. Oxygen
uptake of developing eggs and larvae of herring. J. mar.
bioI. Ass. U.K. 44: 711-723.
Houde, E.D. & B.J. Palko, 1970. Laboratory rearing of the
clupeid fish Har'e'n'gUla l?en's'a'co'lae from fertilized
eggs. Mar. BioI. 5: 354-358.
Houde, E.D., C.R. Futch & R. Detwyler, 1970. Development
of lined sole from laboratory reared and Tampa Bay
specimens. Dept. of Natural Resources. Tech. Sere
no 62.
Houston, A.H. & M.A. DeWilde, 1972. Some observations
on the relationship of microhaematocit values to
haemoglobin concentration and erythrocyte numbers
in the carp Cyprinus carpio L. and brook trout
Salvelinus fontinalis (Mitchell) J. Fish BioI. 4:
109-116.
Page 190
99.
Hughes, G.M. 1966. The dimensions of fish gills in relation
to their function. J. expo BioI. 45: 177-195.
Hughes, G.M. & G. Shelton, 1962. Respiratory mechanisms
and their nervous control in fish. Adv. compo Physiol.
Biochem. I: 275-346.
Hughes, G.M. & I.E. Gray, 1972. Dimensions and ultra
structure of toadfish gills. Biol.Bull. 143:
150-161.
Hunn, J.B. 1959. Bibliography on the blood chemistry
of fishes. Res. Rep. U.S. ~ish Wildl. Servo 72:
1-32.
Hymen, L.H., 1921. The metabolic gradients of vertebrate
embryos BioI. Bull. mar. bioI. Lab., Woods Hole. 40:
32-72.
Ivlev, V.S., 1960. Active metabolic intensity in salmon
fry (Salmo salar L.) at various rates of activity.
Paper no.2l3 (mimeo). Salmon and Trout committee.
Int. Coun. Explor. Mer.
Jones, M.P., F.G.T. Holliday & A.E.G. Dunn, 1966. The
ultrastructure of the epidermis of larvae of the
herring (Clupea harengus) in relation to the
rearing salinity. J. mar. bioI. Ass. U.K. 46:
235 .... 239.
Page 191
100.
Kleiber, M., 1947. Body size and metabolic rate. Physiol.
Rev., 27: 511-547.
Korzhuev, P.A. & L.I. Radzinskaya, 1957. A micromethod of
haemoglobin determination. Vop. Iktiol 9: 192-196.
Kutty, M.N., 1968. Respiratory quotients in goldfish and
rainbow trout. J. Fish. Res. Bd Can. 25: 1689-1728.
Lagler, K.F., J.E. Bardach & R.R. Miller. 1967. Ichthyology.
John Wiley & Sons Inc., New York. 545 pp.
Larsen, H.N. & S.F. Snieszko, 1961. Comparison of various
methods of determination of haemoglobin in trout blood.
Progve Fish Cult. 23: 8-17.
Lasker, R., 1963. The physiology of pacific sardine embryos
and larvae. Rep. Calif. Coop. oceanic Fish. 10:
96-101.
Lasker, R. & G.H. Theilacker, 1962. Oxygen consumption and
csmo-regulation by single pacific sardine eggs and
larvae. (Sardinops caerulea Girard). J. Cons. perm.
into Explor. Mer. 27(1): 25-33.
Lasker, R., H.M. Feder, G.H. Theilacker & R.C. May, 1970.
Feeding, growth and survival of Engraulis tnordax
larvae reared in the laboratory. Mar. BioI 5 : 345-353.
Le Cren, E.D. 1951. The length-weight relationship and
seasonal cycle in gonad weight and condition in the
perch ° (PercafTuViaotiTis). J. Anim. Ecol. 20: 201-210.
Litchfield, J.T., 1949. A method for graphic solution of
Page 192
101.
time-percent effect curves. J. Pharmac. exp. Ther.
97: 399-408.
Litchfield, J.T. & F. Wilcoxen, 1949. A simplified method
for evaluating dose-effect experiments. J. Pharmac.
exp. Ther. 95: 99-113.
Love, M., 1970. The Chemical Biology of Fishes. Academic
Press. New York. 547 pp.
Macer, C.T., 1967. The food web in Red Wharf Bay (North
Wales) with particular reference to young plaice
(P1euronectes p1atessa). He1go1ander wiss. Meeresunters.
15: 560-573.
Manwell, C. 1960. Respiratory pigments. Ann. Rev. Physiol.
22: 191-244.
Manwell, C. 1963. Foetal and adult haemoglobins of the
spiny dogfish Squalus suckley!. Archs Biochem. Biophys.
101: 504-511.
Marshall, S.M., & A.P. Orr, 1958. Some uses of antibiotics
in physiological experiments in sea water. J. mar. Res.,
17: 341-346.
Marshall, S.M., & A.P. Orr, 1961. On the biology of
. Calanus 'finma'r'chic'us XII. The phosphorus cycle:
excretion, egg production and autolysis. J. mar. bioI.
Ass. U.K., 41: 463-488.
{ i Marshall, S.M., A.G. NicholS & A.P. Orr, 1937. On the growth "
and feeding of the larval and post larval stages of the
Page 193
102.
Clyde herring. J. mar. bioI. Ass. U.K. 22: 245-267.
Marshall, S.M., A.G. Nicho~s & A.P. Orr, 1939. On the
growth and feeding of young herring in the Clyde.
J. mar. bioI. Ass. U.K. 23: 427-455.
Matsuura, F. & K. Hashimoto, 1958. Chemical studies on
blood haemoglobins of fish. Jap. Soc. Sci. Fish 21:
1158-1162.
Mawdesley-Thomas, L.E., 1969. Neoplasia in fish - A
bibliography. J. Fish BioI. I: 187-207.
Mawdesley-Thomas, L.E., 1971. Toxic chemicals - the risk
to fish. New Scientist 49: 74-75.
McFarland, W.N., 1960. The use of anaesthetics for the
handling and transport of fishes. Calif. Fish Game
46(4): 407-431.
Meek, A., 1903. A contribution to our knowledge of the
growth of the plaice. Rep. Northumb. Sea Fish. Comm.,
1903: 40-41.
Mills, D. 1971. Salmon and Trout: A resource, its ecology,
conservation and management. Oliver and Boyd, Edinburgh.
351 pp.
Moll, W., 1966. The diffusion coefficient of haemoglobin
Respir. Physiol. 1: 357-365.
Muir, B.S., 1969. Gill dimensions as a function of fish size.
J. Fish. Res. Bd Can. 26: 166-170.
Page 194
103.
Muir, B.S. & G.M. Hughes, 1969. Gill dimensions for three
species of tunny. J. expo BioI. 51: 271-285.
Newstead, J.D., 1967. Fine structure of respiratory lamellae
of teleostean gills. Z. Zellforsch. Mikrosk, Anat., 79:
396-428.
Nicloux, M., 1923. Action de l'oxyde carbone sur les
poissons et capacite respiratoire du sang de ces
animaux. C.r.Seanc. Soc. BioI. 89: 1328-1331.
Ostroumova, I.N., 1962. The first appearance of haemoglobin
in the embryo's of the rainbow trout. Dokl. Akad.
Nauk SSSR 147: 263-264.
Paloheirno, J.E. & L.M. Dickie, 1966. Food and growth of
fishes. II. Effect of food and temperature on relation
between metabolism and body weight. J. Fish. Res. Bd
Ca~ 23: 869-908.
Parrish, B.B., A. Saville, R.E. Craig, I.G. Baxter &
R. priestley, 1959. Observations on herring spawning
and larval distribution in the Firth of Clyde in 1958.
J. mar. bioI. Ass. U.K. 38: 445-453.
Pearcy, W.G., 1962. Ecology of an estuarine population of
winter flounder, Pseudopleuronectes americanus (Walbaum)
III Distribution, Abundance, Growth and Production of
Juveniles, Survival of larvae and Juveniles. Bull.
Bingham oceanogr. ColI. l8~ 39-64.
Price, J.W., 1931. Growth and gill development in the small
Page 195
104.
mouthed black bass, Micropterus dolomieu Lacepede.
Ohio State University Stud, 4: 46 pp.
Prosser, C.L. & P.A. Brown, 1969. Comparative Animal
Physiology. Sec. Ed. W.B. Saunders, Philadelphia.
Putter, A., 1909. Die Ernahrung der Wassertiere. Jena.
Radzinskaya, L.I., 1960. The peroxidase reaction and the
formation of haemoglobin during the embryonic devel
opment of sturgeon. Dokl. Akad. Nauk SSSR. 130:
1173-1176.
Radzinskaya, L.I., 1966. Changes in the blood indices of
young and spawning Neva Salmon (~almo salar L.) Vop.
Iktiol. 6: 568-572.
Radzinskaya, L.I. 1968. Localization and amount of
peroxidase in the embryonic development of Neva
Salmon (SalIDo salar L.) Vop. Iktiol. 8: 304-306.
Randall, D.J. 1970a. The circulatory system. In W.S. Hoar
and D.J. Randall. Fish Physiology Vol IV: Academic
Press Inc., New York: 133-172.
Randall, D.J. 1970b. Gas exchange in fish. In W.S. Hoar
and D.J. Randall. Fish Physiology Vol IV : Academic
Press Inc., New York: 253-292.
Roberts, R.J., M. Bell & H. Young, 1973. Studies on the
skin of plaice (P1euronectes p1ate •• a L.) II. The
development of larval plaice skin. J. Fish BioI.
5: 103-108.
Page 196
105.
Rosenthal, H. 1968. Beobachtungen uber das
Verhalten der Seezungenbrut. Helgolander wiss.
Meeresunters. 13: 213-228.
Rosenthal, H. & G. Hempel, 1970. Expertmental studies in
feeding and food requirements of herring larvae
(C1upea harengus L.) in Marine Food Chains. Ed. J.H.
Steele. Oliver and Boyd, Edinburgh. 344-364.
l Rurid, J.T., 1954. Vertebrates without erythrocytes and
blood pigment. Nature, Lond. 173: 848-853.
Ryback, B., 1960. A pale hag-fish. Nature, Lond. 185: 777
Ryland, J.S. 1963. The swtmming speeds of plaice larvae.
J. expo BioI. 40: 285-299.
Ryland, J.S. 1966. Observations on the development of
larvae of the plaice, P1euronectes plates sa L., in
aquaria. J. Cons. perm. into Explor. Mer 30: 177-195.
Saksena, V.P. & E.B. Joseph, 1972. Dissolved oxygen
requirements of newly hatched larvae of the striped
blenny . (Chas:mOde bo·squianus) the naked goby . (Gobiosoma
. bosci) and the skillet fish (Go·bies·o·xstrumosus)
Chesap. Sci. 13(1): 23~28.
Satchell, G.H., 1971. Circulation in fishes. Cambridge
University Press. 131 pp.
Saunders, R.L. (1962). The irrigation of gills in fishes.
II. Efficiency of oxygen uptake in relation to
respiratory flow activity and concentrations of oxygen
and carbon dioxide. Can. J. Zool. 40: 817-862.
Page 197
106.
Schottle, E., 1931. Morphologie und Physiologie der
Atmung bei wasser-, schlamm- und landlebenden
Gobiiformes. Zeitschr. f. wiss. Zool., 140: 1-115.
Schumann, G.O., 1967. La Jolla first to raise mackerel
and sardines to advanced juvenile stage. Com.
Fisheries Rev. 29: 24-25.
Shelbourne, J.E., 1957. The feeding and condition of
plaice larvae in good and bad plankton patches.
J. mar. bioI. Ass. U.K. 36: 539-552.
Shelbourne, J.E., 1964. The artificial propagation of
marine fish. Adv. mar. BioI. 2: 1-83.
Shelton, G., 1970. The regulation of breathing. In:
W.S. Hoar & D.J. Randall. Fish Physiology Vol IV:
Academic Press Inc., New York: 293-360.
Sheppard, M.P., 1955. Resistance and tolerance of young
speckled trout (Salvelinus fontinalis) to oxygen
lack, with special reference to low oxygen acclimation.
J. Fish. Res. Bd Can. 12: 387-446.
Silver, S.J., C.E. Warren & P. Doudoroff, 1963. Dissolved
oxygen requirements of developing steelhead, trout and
chinook salmon embryos at different water velocities.
Trans. Am. Fish. Soc. 92: 327-343.
Simpson, A.C., 1951. The fecundity of the plaice. Fishery
Invest., Lond., Ser.2, Vol.17: 27 pp.
Slonimski, P., 1927. Sur une modification de L' "ultra
Page 198
107.
micro-rnethode" de Wu- HSien, et son application
a la recherche de l' haemoglobine dans les disques
germinatifs des Oiseaux. Soc. Polonaise BioI. 96:
1496-1497.
Snieszko, S.F., 1960. Microhaematocrit as a tool in
fishery research. Special Scientific Report -
Fisheries No. 341, U.S. Dept. of the Interior,
Fish and Wildlife Service.
Steen, J.B. & A. Krysse, 1964. The respiratory function
of te1eostean gills. Compo Biochem. Physio1. 21:
127-142.
Steen, J.B. & T. Berg, 1966. The gills of two species of
haemoglobin-free fishes compared to those of other
teleosts - with a note on severe anaemia in an eel.
Compo Biochem. Physiol 18: 517-526.
Stelzer, R., H. Rosenthal & D. Siebers, 1971. Einflub
von 2:4 dinitrophenol auf die atmung und die
Konzentration einiger Metabolite bei Embryonen des
Herings C. harengus. Mar. Bio1. 11(4): 369-378.
Strickland, J.D.H., & T.R. Parsons, 1965. A manual of
sea water analysis. Bull. Fish. Res. Bd Can. No. 125.
Ed. J.C. Stevenson.
Summerfelt, R.C., 1967. Measurement of same haemato1ogical
characteristics of the goldfish. Progve Fish Cult.
29: 13-20.
Page 199
108.
Tesch,F.W. 1968. Age and growth. In: W.E.Ricker, Methods
for the assessment of Fish Production in Fresh Waters.
I.B.P. Handbook No.3. 93-123.
Ursin, E., 1967. A mathematical model of some aspects of
fish growth, respiration and mortality. J. Fish. Res.
Bd Can. 24: 2355-2453.
Vo10din, V.M., 1956. Embryonic development of the autumn
baltic herring and their oxygen requirement during
the course of development. Fish. Res. Bd Can. Trans1.
No. 252. (From Russian Vop. Iktio1 7: 123-133).
Weber, R.E., 1971. Oxygenationa1 properties of vascular and
coelomic haemog1obins from Nephtys hombergii (Polychaeta)
and their functional significance. Neth. J. Sea Res.
5: 240-251.
Winberg, G.G., 1960. Rate of metabolism and food
requirements of fishes. Fish. Res. Bd Can. Trans1. No.
194.
Wintrobe,M.M •. 1967. Clinical Haemato10gy. Lea and Febinger
Philadelphia: 1287 pp.
Wittenburg,J.B. 1959. Oxygen transport - a new function
proposed for myoglobin. BioI. Bull. 117: 402-403.
Wittenburg,J.B., 1963. Facilitated diffusion of oxygen
through haemerythrin solutions. Nature, Lond.199:8l6-817.
Young,J.Z.,1962. The Life of Vertebrates. Oxford University
Press. 820 pp.
Page 200
109.
Zeuthen,E., 1947. Body size and metabolic rate with special
regard to the marine microfauna. C.R. Lab. Carlsberg,
(Chemical Series) 26: 71- 161.
Zeuthen,E., 1953. Oxygen uptake as related to body size in
organisms. Q. Rev. BioI. 28: 1-12.
Page 201
IIO.
Appendix I. Resistance times in minutes in samples of
Nwnber
1
2
3
4
5
6
7
8
9
10
11
12
13
14
15
16
17
18
19
20
herring larvae at the yolk-sac stage exposed
to various lethal oxygen concentrations.
Asterisks indicate incomplete mortality.
Oxygen levels (mIll)
0.06 0.55 0.76 1.38 1.65 2.07
7 12 45 60 125 120
8 18 50 70 140 200
8.5 20 54 76 160 255
9 21 70 100 170 270
9.5 23 90 110 200 290
10 25 115 130 250 350
10.5 27 140 155 400 400
11 29 180 175 450 * 11.5 35 230 200 480 * 12 42 435 230 * * 13 52 300 * * 13.5 64 400 * * 14 95 670 * * 15 225 800 * 15.5 * 16 * 16.5 * 17 * 18 * 20
Page 202
Appendix II. Resistance times in minutes in samples of
plaice larvae at 2-3 weeks of feeding exposed
to various lethal oxygen concentrations.
Asterisks indicate incomplete mortality.
Oxygen levels (mIll)
Number 0.34 0.67 1.36 2.02 2.35 2.68
1 10 9 11 62 20 130
2 14 14 23 96 68 260
3 16 18 26 108 76 400
4 22 22 32 118 86 510
5 24 26 33 130 90 * 6 26 31 35 140 100 * 7 27 34 37 150 110 * 8 28 38 39 160 130 * 9 29 41 43 195 150 *
10 30 44 48 210 * * 11 32 46 58 230 * * 12 50 78 240 * 13 65 100 260 * 14 135 290
15 233 300
16
.....
Page 203
Appendix III A. Number of filaments on the arches of one side with
increasing length in herring and plaice.
Herring Plaice Length Arch Arch Arch Arch Length Arch Arch Arch Arch
nun I II III IV nun I II III IV
20 26 15 8.03 4 10 6 22 17* 33* 22 21 9.03 10 14 12*
22 26 28 20 9.81 4 13 12 4*
22 27* 28 17* 9.12 8 13 13 3*
23 29* 34 21 9.86 4 14 10 4*
24 55 45 36 43 9.90 7 15 13 2*
25 25 27 17 9.03 8 17 17 4*
29 60 63 63 53 10.00 12 17 15 8
30 56 58 65 42 10.24 10 13 16 4
30 64 53 70 58 10.80 8 22 19 7
30 76 74 74 50 11. 40 15 18 20 7
34 95 99 70 67 11. 50 12 23 18 6
34.5 92 109 89 59 11.80 17 23 20 7
35.5 105 98 85 61 13.46 23 25 22 15
36 144 126 85 62 14.24 23 26 24 15
39 129 122 98 66 14.32 16 33 24 15
40 121 112 96 74 15.97 28 30 30 15
46 141 116 55 77 19.00 33 46 37 17
48 162 141 92 83 25.00 57 58 44 28
49 163 132 104 88 26.00 48 65 47 30
51. 5 132 120 96 74 28.47 76 68 51 38
55 158 131 104 88 28.65 69 62 53 36
59.25 168 134 103 83 30.03 96 75 56 35
67 164 113 137 77 31.29 85 73 61 23
72 160 149 124 117 33.50 80 70 46 30
73.5 194 164 128 118 49 114 90 66 41
74.5 188 168 150 120 50 99 88 73 34
75.5 178 160 134 125
77 166 142 114 104
Page 204
Appendix IIIB. Pattern of development of filaments in herring and plaice.
HERRING
Length rom
22 - 29
35 - 40
45 - 50
70 - 75
Arch I
Filaments of anterior hemibranch only.
Both sets of fil.aments present but filaments of posterior hemibranch are very short all along the arch except at the end of the hypobranch.
Arch II
Filaments of anterior hemibranch only.
Similar pattern to arch I.
Arch III
Filaments of anterior and posterior hemibranchs present but those of the anterior filaments are longer.
Both sets of filaments present but the filaments of the posterior hemibranch are increasing in length along the ceratobranchial region as well as on the hypobranch.
Arch IV.
Filaments of anterior hemibranch only.
Both sets of filaments present, but the filaments of the posterior hemibranch are longer than those of the anterior filaments in the region of the hypobranch.
Both sets of filaments present. Filaments of the posterior hemibranch are shorter than tho~of the anterior hemibranch except on the hypobranch where they are longer and also greater in number. Further on the epibranch 1 - 2 extra filaments are present on the posterior hemibranch, except in arch IV where 5 - 6 extra filaments are observed.
In all four arches the filaments on the posterior hemibranch are shorter than those of the anterior hemibranch, except at the origin of the epibranch and the end of the hypobranch where they are longer. The total number of filaments on the posterior hemibranch exceeds those of the anterior hemibranch.
Page 205
PLAICE
I Length ~I .
9
14 - 18
25 - 28
50
Arch I
Both sets of filaments present though ~~ are found on epibranch, only on ceratobranch and hypobranch.
"
Both sets of filaments present, but still no filaments on epibranch.
S~ilar to above, in addition filaments of the anterior hemibranch are present on the epibranch
Arch II
Similar to arch I
"
Similar to arch I. In addition filaments of the anterior hemibranch are present in the epibranchial region
Arch III
Similar to arch I
Similar to above, in addition a few filaments of the anterior hemibranch are present in the epibranchial region.
"
Similar to above but both sets of filaments are present on the epibranch
"
Arch IV.
Only filaments on the anterior hemibranch are present.
In addition to the filaments of the anterior hemibranch a few filaments are found on the posterior hemibranch in the ceratobranchial region.
Both sets of filaments present on all parts of the gill arch except the epibranch where only filaments of the anterior hemibranch are present.
Similar to above.
Page 206
Appendix IV Method of qualitative and quantitative
determination of peroxidase.
(a) The haemoglobin was identified histochemically
using the benzidine method of Slonimski & Lapinski (1932)
as adopted by Radzinskaya (1960). The reagent was
prepared as reported by Radzinskaya (1960).
0.1 - 0.2 g of
96% alchohol, after
hydrogen peroxide &
benzidine were dissolved in 2-3 ml of 96%
which 10 ml of alchohol, 2 ml of 4% A
1 ml of a freshly prepared saturated
solution of benzine in glacial acetic acid. Since
benzidine was only slightly soluble in cold alchohol,
after its addition it was heated gently on a hot-plate
for 5-8 mins.
The eggs and larvae were gently rinsed in distilled
water (after being anaesthetised in M.S.222 in the case
of the larvae) and transferred to a petri dish using a
glass capillary pipette. A few drops of the reagent were
added the specimens being observed under the microscope.
The site of appearance of the blue stain was observed and
the time noted. In the later stages of development the
egg membranes were teased out using glass needles prior
to the addition of reagents. Drawings were made of the
stained larvae using a camera lucida attachment.
Page 207
(b) Standards.
Initially the preparation of standard solution was
performed using human haemoglobin in the form of a powder
(William Hopkins Ltd). Matsaura & Hashimoto (l958) quoted
by Blaxhall, 1972} found that fish blood haemoglobin
resembled that of horse haemoglobin producing identical
results with the same method of spectrophotometric
analysis, confirming earlier findings that the haemoglobin
spectrum appears uniform in all vertebrates. (Blaxhall,
1972) .
A known weight of this haemoglobin was dissolved in
the equivalent amount of diluent and read against standard
cyanmethemoglobin (B.D.H. Ltd.). A similar sample was read
against standard haemin solution using the alkaline haematin
method (Hawk, ::Oser & Summerson, 1954; Wintrobe, 1967). It
was found that about 75% of the haemoglobin was converted
to the corresponding derivative in the first method while
in the second method only about 53% was converted. Snieszko
(1960) found that the cyanmethaemoglobin method was the
most satisfactory one for haemoglobin estimation in trout
blood the acid haematin method giving more inaccurate
readings. Hence the cyanmethaemoglobin method was used
as the standard, especially as it gave a higher conversion
to the derivative.
Page 208
One of the problems encountered with the powdered
haemoglobin was that it tended to produce a foam,
therefore after a preliminary shaking in distilled
water the solution was allowed to stand until the
foam had partially subsided. Then the excess foam
was removed with a pipette and the solution made up
to the mark with distilled water. A solution made
up in this manner was then treated with the reagents
as given by Korzhuev & Radzinskaya (1957). The reagents
are as follows;
Reagent I - Pyridine 9ml, Rescorcin 1 g, pyrarnidon 5 g,
96% ethanol 91rol.
Reagent II - Glacial acetic acid Bml,
96% ethanol 92ml.
Reagent III - 0.6% hydrogen peroxide from a 3% solution
(freshly prepared) .
The sensitivity of the method according to these authors
was 5 ug peroxidase in 0.5 cc i.e. 1 mg/10Oml of blood
using a visual matching of colours. Calibration curves
were made at two dilutions, the blank being distilled
water and the colours obtained were read in a Unicam
S.P. 500 spectrophotometer. The strength of the original
solution was obtained by reading it against standard
cyanmethaemoglobin. A great deal of variation was observed
in the pyridine method, a fact which has been commented on
Page 209
by the authors. Using the spectrophotometric method
of analysis a sensitivity of I pg in lml of solution
could be detected. The time interval between the
addition of reagents and the time of reading the
sample was also found to be critical. A decrease
was observed with time. The authors recommended
reading of the samples after 40-45 mins. Light
was believed to have no effect. Therefore a set
of samples was run to test the effect of 4 parameters,
viz. darkness, light, time; and the effect of an
acetate buffer in an attempt to stabilize the reaction.
only one concentration of haemoglobin was used. The
experiment was conducted in quadruplicate. Results
showed that samples could be read within 25-45 mins,
and more stability in the readings obtained in samples
kept under dark conditions. The blank too gave a
higher reading after being exposed to light, this
mayor may not be significant as replicates were not
made. Nevertheless all samples were kept in the dark
prior to centrifugation in the later analyses.
In later determinations the haemoglobin solution
was filtered under pressure using a Millipore filtration
apparatus with a cooked filter to remove particles which
remained in solution. lml of this solution was diluted
Page 210
to lOrnl with diluent and read against standard
cyanmethaemoglobin (International Standard) at 540 mp.
Another lOrnl of the solution was diluted to lOOOrnl
(solution A) with distilled water and calibration
curves prepared. From this second solution lOml was
pipetted out and diluted to 500rnl (solution B).
lml samples of these solutions were treated with the
reagents and used as the standards.
The calculations were made as follows.
Reading of the standard cyanmethaemoglobin (Rs) is
equivalent to 57.2 mg of haemoglobin/lOOml of blood.
Therefore the reading of the unknown solution (Rx)
is equivalent to 57.2 x Rx mg = X mg of haemoglobin. Rs
Therefo~e lOml of haemoglobin diluted to 1 litre also
contains X mg of haemoglobin i.e. solution A. i.e. Iml
of solution A contains X pg of haemoglobin. Solution B
is lOml of solution A diluted to lOOml. i.e. Iml of
solution B contains 0.1 x X pg of haemoglobin. Solution
A was used as the standard for metamorphosed and
premetamorphic larvae with 1 cm cells, corrections
being made for the reagent blank. Solution B was
used as the standard for the younger larval stages,
and read in 2 cm cells with a narrower slit.
Page 211
In 1971 the strength of the unknown solution was
read off the calibration curves prepared, as preparation
of calibration curves with each run was too time
consuming. In 1972 a solution of haemoglobin made
up from sheep haemoglobin crystals (B.D.H. Ltd.) was
standardised against standard cyanmethaemoglobin as
before and lml of the appropriately diluted solution
used as a standard with each run. One problem that
arose with the sheep haemoglobin was that cloudiness
was observed after addition of diluent, and therefore
a correction for turbidity was made.
The method used by Radzinskaya for the larvae is as follows:
A homogenate of one larvae was made in lml of water.
O.Sml of the' homogenate was transferred to a centrifuge
tube and the following reagents added.
a) lml of amidopyrine pyridine solution - Reagent I.
b) 0.8ml of 8% acetic acid. - Reagent II.
c) 0.2ml of 3% hydrogen peroxide freshly diluted -
Reagent III.
In the present determinations the eggs or larvae were
homogenized in 3ml of water and the reagents added to Iml
samples in duplicate. Samples of about 30 eggs were used
in both species and after hatching groups of about 20
larvae. At the premetamorphic stage in herring individuals
were used while in plaice about 3-4 larvae were used per
sample.
Page 212
Appendix V. Decrease in the optical density of the
haemoglobin solution with time.
Page 213
o
• •
• •
00
a
••
• • •
- I ill
a
AIISN30 lV'JIldO
o lJ}
C) U'
u , (\
u - (Y)
----+-0
...--... Z -2 ----w ~ -r