Page 1
THE OPTIMAL LOAD PROFILE
FOR THE NIEUW STATENDAM A thesis concerning the most effective way of
Sailing
Authors: Michael Spaan
Study year /semester: 2020 semester 8
HZ University of Applied Sciences
Coach: B. Ooms
Place: Vlissingen
Date: 26-05-2020
Version number: 1
Page 2
The optimal load profile for the
nieuw statendam
A thesis concerning the most effective way of
Sailing
Thesis
Place: Vlissingen
Date: 26th of May, 2020
Studentnumber: 71090
Study year: 4th
Semester: 8th
Hz University of Applied Sciences
Coach: B. Ooms
Version number: 1.1
Page 3
Preface In order to graduate from the University of Applied Sciences and obtain my
bachelors degree, I had to conduct research into a subject of my choosing. This
research would be conducted on board of the Nieuw Statendam, the newest fleet
member of the Holland America Line. The results of this research would have to be
displayed in a report, a Thesis.
Finding a subject was difficult at first. There are many different ways of conducting
research on board and I wanted to do something original, not something that was
done before. I reached out to the Chief Engineer of the Nieuw Statendam, at the
time being Peter Massolt, who supplied me with a subject that peaked my interest. I
discussed the subject with my coach B. Ooms who thought it was a great idea. After
writing my research proposal and getting it approved I was off to the Nieuw
Statendam to execute my very own research project.
Most of my previous projects were done in a group, so having to do this alone was
both exciting and challenging. It was a lot more difficult to find every thing I needed
and to put all of that found data on paper, but after many hours, my Thesis was
done.
I would like to thank Peter Massolt for supplying me with this subject. I would also like
to thank Chief Engineer Bonni Galema, Staff Chief Engineer Wim Akkerman and the
entire engine room crew of the Nieuw Statendam for helping and guiding me with
this project. I have enjoyed sailing with these crewmembers and this ship immensely.
Thank you to my coach B. Ooms, who always helped me as soon as possible and
helped guide me in the introduction phases of this research.
Page 4
Abstract The Nieuw Statendam is equipped with a program called ENIRAM. This program
calculates the optimal engine configuration and load expressed in revolutions per
minute of the propellers. The issue with this program is that it only looks at he main
power plants and does not take the waste heat recovery system into consideration.
This can lead to a drop in waste heat recovery, which can lead to a loss of overall
efficiency.
When the engine loads drops below a certain point, the heat extracted from the HT
system and the exhaust gasses becomes so little that certain systems, such as the
evaporators, need to be shut off. The auxiliary oil fired boiler would also need to start
burning fuel in order to produce more steam.
The purpose of this research was to calculate the minimal operational loads for
optimal waste heat recovery. This was done by calculating the amount of heat
stored in the HT system and in the exhaust gasses flowing through the exhaust gas
boiler. By calculating the amount of heat in these systems under different engine
loads, a graph was created using Microsoft Excel, clearly showing a drop in waste
heat recovery beneath a certain load.
Measurements were taken under eight different loads and compared between one
another. Results were both taken in a two engine configuration and a three engine
configuration. All results were obtained in summer conditions, as the vessel was
sailing in the Caribbean at the time of data collection.
All results were placed in a graph. The results showed a significant drop in waste heat
recovery below 70%. Both engine configurations showed the same results. It could
therefore be concluded that the minimal operational load for optimum waste heat
recovery lies at 70%.
It is recommended to continue this research on other vessels working with the
ENIRAM program.
Page 5
Table of contents 1.0 Introduction ................................................................................................................... 1
2.0 Theoretical Framework ................................................................................................. 2
2.1 ENIRAM ....................................................................................................................... 2
2.2 Waste heat recovery ................................................................................................. 2
2.3 Exhaust gas boilers ..................................................................................................... 3
2.4 Optimal loads ............................................................................................................ 4
2.5 Minimal loads ............................................................................................................. 4
2.6 Optimal engine parameters ..................................................................................... 5
2.7 Conceptual framework ............................................................................................ 6
2.8 Abbreviations ............................................................................................................. 6
3.0 Research Method ......................................................................................................... 7
4.0 Results ............................................................................................................................. 8
4.1 HT system heat calculations ..................................................................................... 8
4.2 Exhaust gas energy calculations .............................................................................. 9
4.3 Waste heat recovery baseline ................................................................................11
4.4 Two engines configuration.......................................................................................12
4.5 Three engines configuration ....................................................................................15
5.0 Discussion ......................................................................................................................17
6.0 Conclusion ....................................................................................................................19
6.1 Waste heat recovery conclusions ...........................................................................19
6.2 recommendation .....................................................................................................19
Reference list ......................................................................................................................20
Appendix 1: Fresh Water Generator Technical Data .....................................................21
Appendix 2: Diesel Engine Acceptance Test Records ...................................................22
Appendix 3: Exhaust Gas Data Diesel generator ............................................................23
Appendix 4: Steam Flow and Thermal Balance sheet ....................................................24
Appendix 5: Two engine configurations Two engine configuration at 80% load .........25
Two engine configuration at 75% load .........................................................................26
Two engine configuration at 73% load .........................................................................27
Two engine configuration at 70% load .........................................................................28
Two engine configuration at 69% load .........................................................................29
Two engine configuration at 60% load .........................................................................30
Two engine configuration at 55% load .........................................................................31
Two engine configuration at 52% load .........................................................................32
Appendix 6: Three engine configuration .........................................................................33
Page 6
Three engine configuration at 80% load ......................................................................33
Three engine configuration at 75% load ......................................................................34
Three engine configuration at 73% load ......................................................................35
Three engine configuration at 70% load ......................................................................36
Three engine configuration at 69% load ......................................................................37
Three engine configuration at 60% load ......................................................................38
Three engine configuration at 55% load ......................................................................39
Three engine configuration at 52% load ......................................................................40
Page 7
1
1.0 Introduction The Holland America Line fleet is equipped with a management tool for vessel and
fleet efficiency. This tool, called Eniram, is a software platform which calculates the
most efficient configuration for a certain passage expressed in the revolutions per
minute (RPM) of the propeller. In order to calculate this configuration, many different
parameters such as the weather and current information are gathered. A display on
the bridge shows a certain “bandwidth” indicated in a green colour with a red
border on either side. The objective is to sail the ship “in the green”, for optimum fuel
efficiency. The software is developed by Eniram, which has recently been acquired
by Wartsila. (Wartsila, 2020)
The problem however, arises when the Eniram system has calculated a passage to
be sailed with an RPM not completely compatible with the overall optimal efficiency
of the power plant. For example, if the suggested RPM for fuel savings is 90, the
electrical load of the diesel generators (DG’s), may be around 65% while running
three DG’s. The power plant, its cooling and waste heat recovery system has been
designed for an 85% load for the optimum amount of heat available for use. When
the electrical load drops below a certain level, the steam production of the exhaust
gas boilers (EGB’s) drops significantly, as well as the amount of available waste heat
in the cooling system. This may lead to a shutdown of the evaporators and the heat
being used for air conditioning (AC) reheating and potable water heating. When this
happens the auxiliary boiler will need to start running, which results in higher fuel
costs. (Line, 2018)
The goal of this research is to establish a matrix in which a maximum allowable
minimum load can be selected, at the edge of where waste heat recovery
becomes unmanageable without the boiler starting up. When this research is
concluded, the optimal way of sailing, in terms of the overall efficiency of the power
plant will be calculated.
The main question of this research is; “Which engine load profile, considering the
operation of the entire plant, is the most fuel and cost effective?”. To answer this
question, the following sub questions have been answered;
- What is the minimum operational load for optimal effective waste heat
recovery concerning the HT cooling circuit?
- What is the minimum operational load for the most effective steam
production of the exhaust gas boilers?
This thesis will consist of a theoretical framework, which includes a conceptual
framework. The followed by the explained methods for gathering information for the
answers to the sub and main questions. After which the results will be displayed, the
results will be discussed and finally, concluded.
Page 8
2
2.0 Theoretical Framework
2.1 ENIRAM
Eniram was founded in 2005 by a Finnish software engineering company specializing
in marine energy management products. The company provides these products for
operators of different commercial vessels, such as cruise ships, bulk carriers, container
ships and tankers. The energy management systems provide operators with some
insight into reducing emissions, increasing fuel efficiency and optimizing the overall
ship and fleet performance. It is currently owned by Wärtsilä. Wärtsilä explains the
program increases efficiency by collecting data from different areas, such as the
weather, hull and propeller performance, the optimum trim model and the
parameters of the running power plant. (Eniram, 2020) (Wartsila, 2020)
Figure 1: The different data collected by the Eniram software (Wartsila, 2020)
2.2 Waste heat recovery
Despite the high brake efficiency of diesel engines, the engines waste large amounts
of heat to the environment, especially in exhaust gasses (Francesco Baldi, 2014). By
implementing waste heat recovery (WHR) system, this wasted energy can be used to
increase the overall efficiency of the power plant and therefore reduce the costs
and the environmental impact of the entire power plant. It is also stated that the
employment of a WHR system results in reducing the fuel consumption. As an effect
of an WHR system, there is a lowered cost of purchased fuel, a lower amount of
emitted exhaust gas components and an extended operational period of machines
and devices on a ship (Behrendt, 2019). (Min-Hsiung Yang, 2014) Also states; “To
increase energy efficiency and to reduce fuel consumption, WHR is a significant
method for energy saving.”
(Ouyang, 2019) Also states that WHR technology is widely used in large ships usually
applying waste heat boilers (WHB), also known as economisers. Utilizing the steam
produced in the WHB’s, heat for sustaining daily life can be provided, as well as
Heavy Fuel Oil (HFO) tank heating, purifier heating, fresh water evaporator
Page 9
3
preheating, laundry and galley heating and even swimming pool heating. (Line,
2018)
2.3 Exhaust gas boilers
Exhaust gas boilers, known as economisers (ECO), are used to extract heat from the
exhaust gasses emitted by the main diesel engines and utilize that heat to produce
energy. This energy is usually stored in superheated water, steam, which can then be
used for multiple applications in the overall power plant. (Laval, 2020)
The ECO can be optimized by
ensuring the maximum amount of
energy is transferred from the
exhaust gasses to the medium, in
this case water, which needs to
be superheated. By pre-heating
the feeding water supplied to the
ECO more steam can be
generated. (Behrendt, 2019)
found that each temperature
increment of 10 Kelvin of the
feeding water increases the
amount of steam generated by
3%, regardless of the steam
pressure. This can be seen in
figure 2.
A significant factor limiting the use of waste heat contained in exhaust gasses is low
temperature corrosion (LTC). LTC is the result of the oxidation process of sulphur,
which is found in the exhaust gasses (Behrendt, 2019). Condensation of the acids
created during the oxidation process results in metal wastage, boiler tube failure and
air preheater corrosion (Sathyanathan, 2012).
Figure 2: The relation between the temperature of the feeding water and the generated steam (Behrendt, 2019)
Page 10
4
2.4 Optimal loads
All ECO’s and other waste heat recovery systems are designed to run at an optimal
load. Usually for a marine diesel engine system operating with a WHR system, this is a
85% load (Line, 2018). The load of the system can drastically change the output of
the WHR system. Two main factors contributing to a lower WHR energy output are a
decrease in the mass flow of the
exhaust gasses from the diesel
engines and a decrease in the
temperature of the exhaust gasses
(Ouyang, 2019).
Figure 3, gathered from the
research of (Ouyang, 2019), clearly
shows the decreased thermal
efficiency of an engine operating
at lower loads. It can therefore be
concluded that the thermal
efficiency is at its best around a
85% load.
2.5 Minimal loads
When the engine load drops below a certain level, the WHR systems will see a drop
in efficiency (Line, 2018). It can therefore be said that the minimal effective load of
the WHR system is found just before the steep decrease in efficiency.
When the waste heat supplied by the engines is not sufficient enough to supply the
auxiliary systems with the required amount of heat, the auxiliary boiler will need to be
started (Line, 2018). Starting the auxiliary boiler will require more fuel to be burned,
resulting in higher total fuel costs.
Figure 3: Engine load percentage compared to the
thermal efficiency percentage of an Economiser
Page 11
5
2.6 Optimal engine parameters
Engines are designed to run at a high load to run at the highest possible efficiency
(Ouyang, 2019). When an engine is running at low loads for an extended period of
time, severe fouling may occur on the turbocharger and ECO. When the engine is
running at low loads, the turbocharger runs on a lower RPM. This causes less air to be
supplied to the engine, thereby causing inefficient combustion (Frozee, 2014).
Inefficient of incomplete combustion will occur when there is not sufficient oxygen
during the combustion process to allow for all the fuel to be burned. This causes
carbon and carbon monoxide to be formed instead of carbon dioxide. The carbon
produced during an incomplete combustion may stick to the inside of a
turbocharger or ECO, causing loss of efficiency (BBC, 2020).
(Koster, 2015) Claims that harmful emissions such as carbon based particles, are
produced when incomplete combustion occurs. These carbon based particles get
expelled into the turbocharger and ECO, causing fouling. A number of faults
occurring due to fouling are reluctant starting, constant surging of the turbocharger
and the charge air pressure being too high (Quruvignesh, 2020).
(Woodyard, 2004) Also claims that particle matter (PM) consisting of inorganic and
organic compound is produced by incomplete combustion, partly unburned lube
oil, ash in the fuel and lube oil, sulphates and water. More than half of the total
particle mass is soot, whose visible evidence is smoke. PM can cause a build-up of
soot which can have negative effects on the efficiency of the turbocharger and the
EGB.
Imperfect combustion due to an engine running at low loads may lead to an
increase in carbon monoxide and hydrocarbons. The hydrocarbons can be
damaging for your engine and reduce the efficiency of the turbocharger due to
fouling. When the turbocharger is running at a lower efficiency, less air is getting
supplied to the engine and the combustion process effectiveness declines. This
causes even more hydrocarbons and harmful gasses to be expelled from the
engine. (Kuiken, 2008)
Page 12
6
2.7 Conceptual framework
The main question; “Which engine load profile, considering the operation of the
entire plant, is the most fuel and cost effective?”, is shown at the top of figure four.
From the main question the following sub questions are formulated;
- What is the minimum operational load for optimal effective waste heat
recovery concerning the HT cooling circuit?
- What is the minimum operational load for the most effective steam
production of the exhaust gas boilers?
2.8 Abbreviations
The following is a list of abbreviations used in the thesis.
RPM Revolutions per minute
DG Diesel generator
EGB Exhaust gas boiler
AC Air conditioning
WHR Waste heat recovery
WHB Waste heat boiler
HFO Heavy fuel oil
ECO Economiser
LTC Low temperature corrosion
PM Particle matter
Figure 4: The conceptual framework
Page 13
7
3.0 Research Method
In order to gather all the information required to answer the main and sub questions,
a quantitative research method was used. The reason being, all questions relate to
data which can be gathered at different operational loads. All sub questions need
different data sets to be answered and will therefore all be researched quantitively.
The data was collected on board the MS Nieuw Statendam. The research method
can be applied to all ships running the Eniram program although the found results
only apply to the Nieuw Statendam. The required data was obtained by taking
measurements of the in and outlet temperature of the HT water and the exhaust
gasses. These measurements were taken at different engine loads and then
compared to each other. Different engine configurations were also considered. The
following loads were used as measurements;
- 80%
- 75%
- 73%
- 70%
- 69%
- 60%
- 55%
- 52%
The data collected at these loads was then used in multiple calculations, which are
explained in more detail in chapter 4.1 and chapter 4.2. Microsoft Excel was used as
a platform to visualize all calculations made. All these excel sheets can be found in
appendix five and appendix six. Due to complications arising from the COVID-19
outbreak, not all data gathered was so called “Live data”. Older data sheets
containing all necessary information were used. More information about this issue
can be found in chapter 5.0
Any sensitive and confidential information gathered during this research is not and
will not be published or shared with any third party.
Page 14
8
4.0 Results
4.1 HT system heat calculations The results were acquired by different calculations. In order to determine the amount
of heat stored in the HT cooling system, the following calculations were made.
𝑄 = 𝑐 ∗ �̇� ∗ ∆𝑇
Q = The amount of energy in KW
c = the specific heat of water in kJ/KgK
m = The mass of water flowing through the engine in Kg/s
ΔT = The difference in temperature of the HT water flowing through the engine in °C
The Temperatures were taken from the DG’s mimics. The DG’s have temperature
sensors located at the entrance and exit of the HT water system, showing the exact
temperature difference at any given time. As the load of the DG’s increased, so did
the temperatures of the HT water, therefore containing more energy, which could
then be used by consumers.
The amount of water flowing through the engine was kept at a constant flow. The
engine has an engine powered centrifugal HT pump, meaning the pump is powered
by gears connected to the crankshaft of the engine. The engine is always running at
the designed RPM, in this instance being 514 RPM. Therefore, the pump will also
always be running at a constant speed, therefore producing a constant flow. The
flow was found to be approximately 442 m3 per hour, as seen in appendix 1. The flow
used in the calculations was formulated in Kg’s per second. Therefore, the following
calculation was made.
𝑀 = (𝑚
3600) ∗ 1000 ∗ 𝜌
M = The flow of water in Kg/s
m = The flow of water in m3/h
ρ = The specific mass of the HT water
In order to get from hours to seconds, the flow is divided by 3600. In order to get from
m3’s to Kg’s, the mass is multiplied by 1000 (because there are 1000 liters of water in
one cubic meter of water) and then by the specific mass of the water. This gives us a
constant flow of around 125,85 Kg/s.
Now that the mass has been calculated, the formula can be used for different
engine loads, as the specific heat consumption of water does not change and had
been set for 4,19 KJ/KgK. The different temperatures indicate the amount of waste
heat available in the HT water system.
Page 15
9
4.2 Exhaust gas energy calculations In order to calculate the amount of heat used in the EGB’s, a couple variables have
to be found. These variables include the exhaust gas flow and the in – and outlet
temperatures of the exhaust gasses flowing through the EGB. The calculation is as
follows.
𝑄 = �̇� ∗ 𝑐 ∗ ∆𝑇
Q = The amount of energy stored in the exhaust gasses in KW
�̇� = The mass of the exhaust gas flow in Kg/s
c = The specific heat in KJ/KgK
ΔT = The difference in temperature of the exhaust gasses at the in - and outlet of the
EGB
The different temperatures were taken from the mimics of the EGB’s. These
accurately display the change in temperatures under different engine loads. The
specific heat for the exhaust gasses was chosen as 1,006 KJ/KgK.
To calculate the mass of air flow through the EGB, the engine fuel consumption and
air flow had to be determined. The amount of fuel burned was found using the Diesel
Engine Acceptance Test Records, found in appendix 2.
Unfortunately, the turbocharger attached to the DG is from a different manufacturer
than the DG itself. Therefore, no curves or graphs displaying the amount of air flowing
through the engines was found. So it had to be calculated. In order to do this, the
amount of air flowing through the engine at 21900 Turbo RPM’s was found in the
Diesel Engine Technical Data, found in appendix 3. Then, the amount of air was
divided by the amount of RPM’s, which showed the approximate amount of air per
turbocharger RPM. Although this is not completely accurate, as the charge air
pressure varies under different loads, this was the only available option. This issue is
explained further in chapter six. The calculation used is as follows.
�̇� = (�̇�
21900) ∗ 𝑛
�̇� = The flow of air in Kg/h
�̇� = The flow of air at 21900 RPM’s
𝑛 = The RPM’s of the turbocharger at a certain load
Page 16
10
By multiplying the amount of air per RPM times the RPM’s of the turbocharger under
different loads, the amount of air flowing through the DG was found. The results of
these calculations can be found below, in table 1 and in figure 5.
(Table 1: Amount of air flowing through DG at different loads)
Engine Load RPM Amount of air (kg/s) Amount of air (kg/h)
80% 21900 22,51944444 81070
75% 20936,66667 21,5288631 77503,90715
73% 20406,66667 20,98387198 75541,93912
70% 20340 20,91531963 75295,15068
69% 20210 20,78164257 74813,91324
60% 19140 19,68137747 70852,9589
55% 18350 18,86903222 67928,51598
52% 17780 18,28290969 65818,47489
Figure 5: The amount of air flow under different engine loads
14
15
16
17
18
19
20
21
22
23
50% 55% 60% 65% 70% 75% 80%
Am
ou
nt
of
air (
kg
/s)
Engine load (%)
Amount of air per engine load (Kg/s)
Page 17
11
4.3 Waste heat recovery baseline In order for the optimal engine configuration to be calculated, a baseline had to be
established. This baseline was found in the Steam Flow and Thermal Balance
diagram, found in appendix 4. This baseline serves as a guideline as to how much
recovered waste heat energy is used in full operation. It can therefore be used as a
reference when calculating the amount of heat recovered by the HT cooling water
and the EGB’s, compared to the amount of heat required to run at full operation.
The baseline shows the minimal required heat for certain heat recovery systems such
as Potable water HT heat recovery, A.C. HT heat recovery, Laundry service HT heat
recovery and HT heat evaporator recovery. The potable water, A.C., and laundry
service always requires a certain amount of heat when running a full operation. The
amount of heat left in the HT heat recovery is used to heat up the feedwater of the
evaporator. When the HT heat used for the evaporator is not enough, steam will be
used for the leftover required heat. This steam can be produced using the EGB’s or
using the auxiliary boiler.
The baseline also shows the steam consumption when running at full operation. The
amount of steam needed for the evaporator, the hotel users and the engine room
users is displayed. The engine room users consist mostly of tank, purifier and fuel
module heaters, whereas the hotel users consist mostly of galley, accommodation,
laundry and swimming pool heating.
For the purpose of this research, the amount of heat required was set for full
operation, with the average users requiring as follows;
- The fresh water production → 5146 kW per evaporator
- The potable HT heat recovery → 801 kW
- The A.C. HT heat recovery → 1530 kW
- The laundry HT heat recovery → 219 kW
- The heat consumption of the engine room and hotel users → 7000 kW
These numbers can be found in the Steam Flow and Thermal Balance sheet, found in
appendix 4, and the evaporator technical data sheet found in appendix 1.
Page 18
12
4.4 Two engines configuration In order to find the optimal engine configuration, the amount of running engines had
to be considered. When sailing at cruising speed, the Nieuw Statendam sails on
either two, or three engines. The amount of waste heat recovered varies greatly
when sailing on two or three engines. So multiple configurations had to be
calculated. Firstly, a two engine configuration. The Nieuw Statendam always sails on
a shared load mode, meaning both engines are running with the same load.
When calculating the WHR of two engines, only one of the evaporators is running at
any given time. This is due to the fact that the evaporators were designed to run
using the waste heat of two engines, in order to meet the heat requirements of
running at full operation.
The data was gathered from two engines running at the following loads;
- 80% load
- 75% load
- 73% load
- 70% load
- 69% load
- 60% load
- 55% load
- 52% load
The data was put into Microsoft Excel, and by using the calculations found in chapter
4.1 and 4.2, the results displayed in Table 2 and Figure 6 were found.
(Table 2; Waste heat recovery per engine load)
Engine Load (%)
Heat in HT system (kW)
Heat in EGB's (kW)
Total WHR (kW)
80 6116,68 4191,09 10307,77
75 6011,22 3898,45 9909,66
73 5958,49 3419,78 9378,27
70 5483,92 3492,77 8976,69
69 4956,62 3261,39 8218,01
60 4429,32 2969,92 7399,24
55 2900,15 2961,23 5861,38
52 1845,55 2538,18 4383,73
Page 19
13
Figure 6: Waste heat recovery of a two engine configuration
As seen in figure six, the amount of waste heat available drops significantly around
70%. This would indicate the most effective way of sailing on two engines would be
at 70% engine load or higher.
The results were compiled into the following tables.
(Table 3: Amount of HT heat used for services)
Potable recovery (kW) A.C. recovery (kW) Laundy recovery (kW) Evaporator recovery (kW)
801 1503 219 3593,68
801 1503 219 3488,22
801 1503 219 3435,49
801 1503 219 2960,92
801 1503 219 2433,62
801 1503 219 1906,32
801 1503 219 377,15
801 1503 219 0,00
(Table 4: Steam required for evaporator and engine room/hotel users)
As seen in table 4 and table 5, the amount of heat required for the evaporator to run
at full capacity cannot be supplied by the two engines running at low loads.
Therefore the evaporator will be shut off when the engines are running at low loads.
This has to be done in order to provide the laundry, potable water and A.C. recovery
system with the required amount of energy to run at full capacity.
1500,00
2500,00
3500,00
4500,00
5500,00
6500,00
7500,00
8500,00
9500,00
10500,00
0,52 0,57 0,62 0,67 0,72 0,77 0,82
WH
R e
ne
rgy (
kW
)
Engine Load %
Waste Heat Recovery
Heat in HT system Heat in EGB's Total WHR
Page 20
14
The lower the engine loads, the more steam has to be produced by the oil fired
boiler. This is seen in table 5. With the evaporator shut off, a lot less energy will have to
be provided, but for the sake of this research, the evaporator is seen as always
running at full capacity.
The exact calculations for the two engine configuration can be found in appendix 5.
Page 21
15
4.5 Three engines configuration When running on a three engine configuration, there are two important things to
consider. First, the amount of running evaporators. The evaporators of the Nieuw
Statendam require the heat of two engines running at high loads in order to run at
full capacity. Therefore, trying to run two evaporators on a three engine
configuration would mean either a high amount of heat supplied from the steam
system would be necessary, or the evaporators would not be producing their optimal
amount of distilled water. For the purpose of this research, only one evaporator will
be running at full capacity while the vessel is powered by three engines.
Secondly, the Nieuw Statendam is equipped with two Exhaust Gas Cleaning Systems,
or EGCS’s for short. This means that two out of three engines will be running on Heavy
Fuel Oil (HFO), and one engine will be running on Marine Gas Oil (MGO). The
different average caloric values of the fuels were set at 43140 KJ/Kg for HFO and
43700 KJ/Kg for MGO. These values were taken into consideration when calculating
the amount of waste heat recovered from the running engines.
The data of the three engine configuration was used in Microsoft Excel in the same
way as the two engine configuration data, whilst also running at the same loads. The
results of these calculations can be found in Table 6 and figure 3. All three engine
configuration calculations can be found in appendix 6.
(Table 5: Waste heat recovered with a three engine configuration)
Engine Load (%)
Heat in HT system (kW)
Heat in EGB's (kW)
Total WHR (kW)
80 9122,287597 6275,313428 15397,60103
75 8964,097639 5847,669795 14811,76743
73 8542,25775 5108,565601 13650,82335
70 8014,957889 5239,162077 13254,11997
69 7382,198056 5122,051444 12504,2495
60 6802,168208 4435,080325 11237,24853
55 4271,128875 4441,84566 8712,974535
52 2636,499306 3807,26968 6443,768985
Page 22
16
Figure 7: Waste heat recovery of a three engine configuration
The results seen in figure seven are similar to those seen in figure six. The amount of
waste heat recovered sees a significant drop around 70%. This would mean the most
optimal way of sailing, considering the WHR system, is at 70% load or higher.
The results were compiled into the following tables.
(Table 6: Amount of HT heat used for services )
Potable recovery (kW) A.C. recovery (kW) Laundy recovery (kW) Evaporator recovery (kW)
801 1503 219 6599,29
801 1503 219 6441,10
801 1503 219 6019,26
801 1503 219 5491,96
801 1503 219 4859,20
801 1503 219 4279,17
801 1503 219 1748,13
801 1503 219 113,50
(Table 7: Steam needed for evaporator and engine room/hotel users)
As seen in table six, the amount of HT heat supplied by three running engines is more
than enough to supply heat to the potable water, A.C. and laundry recovery. At
higher loads, the three running engines also supply enough heat to run the
evaporator at full capacity. Below 70% load the engines stop supplying enough HT
heat for the evaporator and steam has to be used. The amount of steam produced
by the EGB’s drops significantly between 69% and 60%, suggesting the optimal load
for steam recovery lies at or above 69%.
2500
4500
6500
8500
10500
12500
14500
16500
52 57 62 67 72 77 82
Wa
ste
he
at
rec
ove
ry e
ne
rgy (
kW
)
Engine load (%)
Waste Heat Recovery
HT heat Heat EGB Total heat
Page 23
17
5.0 Discussion
Evaporators
The Nieuw Statendam is equipped with two Wärtsilä type MSF 650/6 evaporators.
These evaporators were designed to run at full capacity requiring 5146 kW to
operate. This amount of energy could only be supplied by two engines running at
high loads, with extra steam being supplied by the EGB’s or auxiliary boilers. During
normal operations, the evaporator does not run at full capacity, supplying between
20 to 22 tons per hour. The Nieuw Statendam is also equipped with two reverse
osmosis plants, which are also able to produce potable water. Therefore, the
evaporators don’t need to run at full capacity. The evaporators are used to produce
distilled water and provide cooling for the DG’s, although this cooling can also be
provided by seawater heat exchangers. The results are based on the evaporator
needing 5146 kW of energy, although the amount of energy provided to the
evaporator is always less. For the sake of this research the maximum amount of
energy was used to provide clear results, but the amount of steam required to run
the evaporator will be less during actual normal operations.
Data collected using older data sheets
Unfortunately due to events relating to the COVID-19 outbreak, the Nieuw
Statendam did not sail according to schedule. Therefore, the data needed for this
research was acquired by looking at older data sheets. The older data sheets
contained most of the information necessary for this research, but was not actual
and therefore might not be as reliable as data gathered during normal operations.
The hotel and engine room users vary greatly during trips, as the vessel is not always
fully booked. The data collected from the older data sheets does not show the
amount of energy used by the engine room and hotel users. Assumptions needed to
be made concerning the hotel and engine room users which may cause some
unreliability.
Engines running at same loads
The engine configurations of the Nieuw Statendam are setup in such a way, that all
running engines share the same amount of load. If this was not the case, WHR might
be able to able to be regulated more carefully. Calculations for this research were
made under the impression of all engines running under the same load, the results of
this research would have been different if the different loads were applied to
different engines.
The flow of HT water
The amount of waste heat recovered for the HT system was based upon information
gather from appendix one. The HT pump connected to the engine, was supplied by
a different company that the engine manufacturer. Unfortunately, no pump
characteristics were found relating to the exact flow of the HT pump. Therefore the
results based on the flow found in appendix one, may differ from the actual results.
The difference is not very significant, when the results found in table two and table
five are compared to the results found in the baseline, found in appendix four.
Page 24
18
The flow of the exhaust gasses
As previously discussed in chapter 4.2, the flow of the exhaust gasses was calculated
using the known flow at 21900 RPM’s and the actual RPM’s of the turbocharger.
However, the flow of air entering the engine is also affected by the ambient air
temperature, which varies from day to day, and by the charge air pressure. Because
the turbocharger was supplied by a company called ABB, and not the engine
manufacturer itself, no flow characteristics relating to charge air pressure were
found. This lead to the air flow being calculated by a self-constructed calculation,
which is not as accurate as an actual flow diagram. When compared to the
baseline found in appendix four, the difference in results are not large enough to be
unusable. The results would have been more reliable and accurate if the air flow
diagram was found.
Page 25
19
6.0 Conclusion
6.1 Waste heat recovery conclusions In order to determine the optimal way of sailing with the main concern being the
amount of waste heat recovered, both in the form of heat found in the HT water,
and heat recovered from the exhaust gasses by the EGB’s, a look at the results found
in chapter 4.4 and 4.5 gives a clear answer. Below approximately 69 to 70% engine
load, the WHR system sees a significant drop. This means more energy can be
extracted from the WHR system when running at higher loads.
To answer the main question; Which engine load profile, considering the operation of
the entire plant, is the most fuel and cost effective? Both a two engine configuration
and a three engine configuration were calculated. The results were the same. Below
70% load, the drop in WHR is significant enough to conclude that the optimal load
profile would be at an engine load of 70% or higher.
6.2 recommendation It is recommended to sail at higher loads to gain the greatest benefits from the WHR
system. However, if sailing with multiple engines running at different loads would be
possible, this may need to be considered. Further investigation concerning the
optimal engine configurations and loads will have to be done in order to gain a
larger understanding of the subject. Some information, such as the exact amount of
HT water flowing through the system and the exact amount of exhaust gas flow
through the EGB was missing. Therefore, it is recommended to repeat this research
with the correct data, in order to validate the found results.
The calculations in this research are subjective to change, as the amount of heat
required to run the vessel at full capacity changes when sailing and when in port.
The amount of hotel and engine room users also varies from day to day. In order to
get the most reliable results, all engine room and hotel consumers would need to be
monitored separately and continuously.
Page 26
20
Reference list BBC. (2020). Combustion of hydrocarbon fuels. Opgehaald van bbc.co.uk:
https://www.bbc.co.uk/bitesize/guides/zwdsjty/revision/3
Behrendt, C. (2019). CONDITIONS OF WASTE HEAT RECOVERY IN MARINE WASTE HEAT.
Szczecin: Maritime University of Szczecin.
Eniram. (2020, Januari). Eniram. Opgehaald van Wartsila.com:
https://www.wartsila.com/eniram
Francesco Baldi, C. G. (2014). A feasibility analysis of waste heat recovery systems for
marine. Gothenburg, Sweden: Chalmers University of Technology.
Frozee. (2014, May 8). Fouling of Turbochargers. Opgehaald van
marineengineeringonline.com: https://marineengineeringonline.com/fouling-
turbochargers/
Koster, A. (2015). Dieselmotoren. Hoofdplaat: Adviesbureau de Koster.
Kuiken, K. (2008). Diesel Engines II. Onnen: Target Global Energy Training.
Laval, A. (2020, Januari). Exhaust gas economizer. Opgehaald van Alfalaval.com:
https://www.alfalaval.com/products/heat-transfer/boilers/Exhaust-gas-
economizer/
Line, H. A. (2018). Technical Operating Manual Nieuw Statendam. Worldwide Marine
Technology Limited.
Min-Hsiung Yang, R.-H. Y. (2014). Thermodynamic and economic performances
optimization of an organic Rankine cycle system utilizing exhaust gas of a
large marine diesel engine. Taiwan: Department of Naval Architecture and
Ocean Engineering, National Kaohsiung Marine University, .
Ouyang, T. (2019). Design and modeling of marine diesel engine multistage waste
heat recovery. Elsevier.
Quruvignesh. (2020, Januari). Operating faults in turbochargers. Opgehaald van
www.brighthubengineering.com:
https://www.brighthubengineering.com/marine-engines-machinery/72117-
operating-faults-in-turbochargers/
Sathyanathan, V. (2012). Low temperature corrosion in Boiler and its prevention.
Opgehaald van Brighthubengineering.com:
https://www.brighthubengineering.com/power-plants/46351-cold-end-
corrosion-in-a-boiler-and-its-prevention/
Wartsila. (2020, Januari). Voyage and vessel efficiency. Opgehaald van Wartsila:
https://www.wartsila.com/marine/optimise/voyage-and-vessel-efficiency
Woodyard, D. (2004). Pounder’s Marine diesel engines and gas turbines. Amsterdam:
Elsevier.
Page 27
21
Appendix 1: Fresh Water Generator Technical Data
Page 28
22
Appendix 2: Diesel Engine Acceptance Test Records
Page 29
23
Appendix 3: Exhaust Gas Data Diesel generator
Page 30
24
Appendix 4: Steam Flow and Thermal Balance sheet
Page 31
25
Appendix 5: Two engine configurations
Two engine configuration at 80% load
Page 32
26
Two engine configuration at 75% load
Page 33
27
Two engine configuration at 73% load
Page 34
28
Two engine configuration at 70% load
Page 35
29
Two engine configuration at 69% load
Page 36
30
Two engine configuration at 60% load
Page 37
31
Two engine configuration at 55% load
Page 38
32
Two engine configuration at 52% load
Page 39
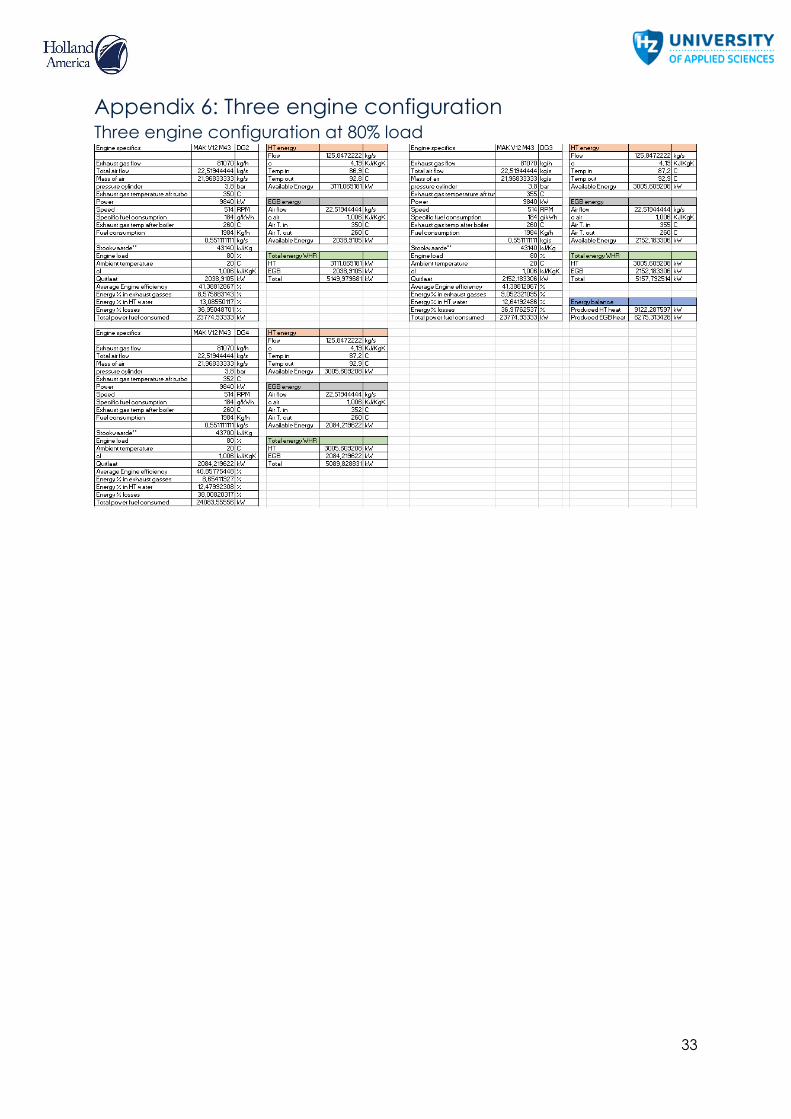
33
Appendix 6: Three engine configuration Three engine configuration at 80% load
Page 40
34
Three engine configuration at 75% load
Page 41
35
Three engine configuration at 73% load
Page 42
36
Three engine configuration at 70% load
Page 43
37
Three engine configuration at 69% load
Page 44
38
Three engine configuration at 60% load
Page 45
39
Three engine configuration at 55% load
Page 46
40
Three engine configuration at 52% load