1 The optimization, evaluation, and design of a side-feed wood-burning cookstove with fan-driven secondary air injection. Devin John Udesen A thesis submitted in partial fulfillment of the requirements for the degree Master of Science in Mechanical Engineering University of Washington 2019 Committee: Jonathan Posner, Co-Chair John Kramlich, Co-Chair Paul Means Program Authorized to Offer Degree: Department of Mechanical Engineering
Transcript
1
The optimization, evaluation, and design of a side-feed wood-burning cookstove with fan-driven secondary air
injection.
Devin John Udesen
A thesis submitted in partial fulfillment of the requirements for the degree
heart disease, stroke, pregnancy complications, and even cataracts .6 These health risks
disproportionately impact women and children with 59% of indoor air pollution caused deaths
being women and 56% being children under 5 years of age .6 The widespread exposure to PM2.5
in a household setting greater than what is recommended by the WHO causes 50% of all deaths
from pneumonia in children under 5 years of age; pneumonia being the leading cause of child
mortality worldwide .7
In addition, PM2.5 emissions have a strong impact on global climate change. Black carbon (BC),
a primary constituent of PM2.5 emitted from the burning of solid biomass, accounts for 25% of all
anthropogenic BC released into the atmosphere .8 The release of BC into the atmosphere greatly
influences the radiative-forcing of the earth’s atmosphere; one of the main components of the
greenhouse-effect. On a per-mass basis, BC contributes 2,200 times more to climate change than
CO2, due to the increased absorption of solar radiation of BC particles compared to CO2 .9 BC
may contribute more to climate change than CO2 by mass, but compared to CO2, BC has a
relatively short atmospheric lifespan, only remaining in the atmosphere for one to four weeks. This
15
means BC climate effects are strongly regional and would dissipate quickly if BC emissions were
reduced, thus benefiting most directly the countries or communities that invest in policies and/or
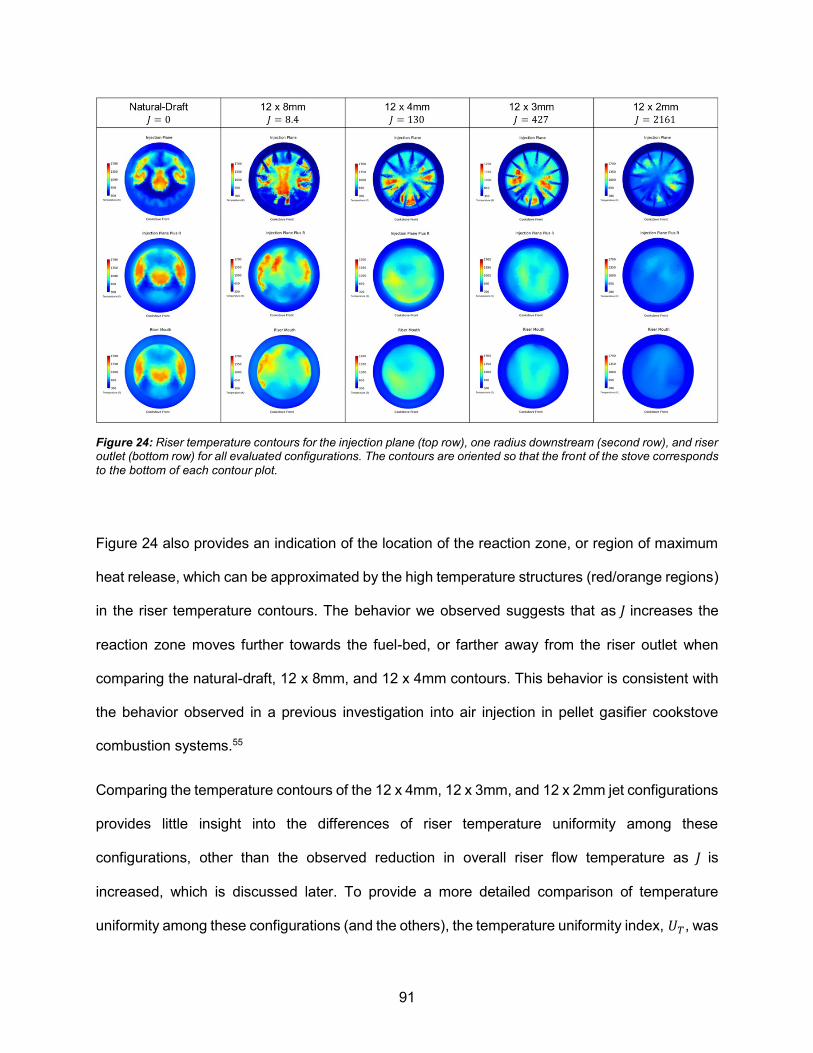
technologies to reduce BC emissions .10
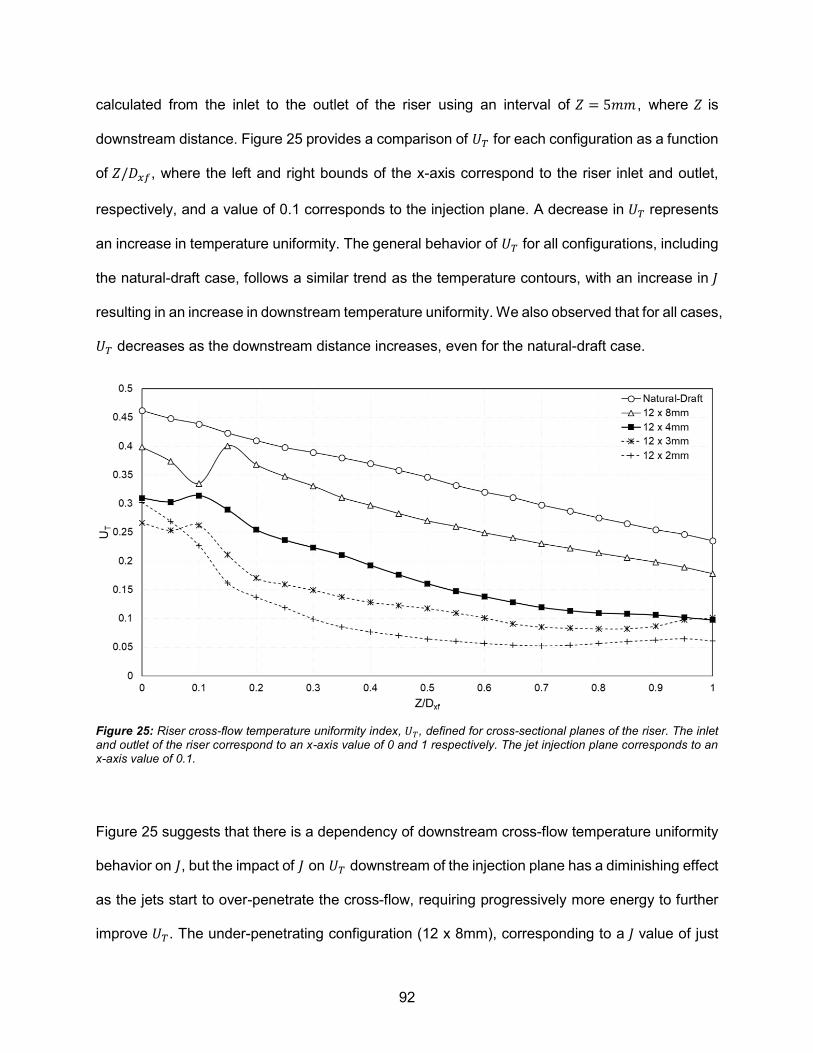
Emissions are not the only distinguishing characteristic associated with the local and global
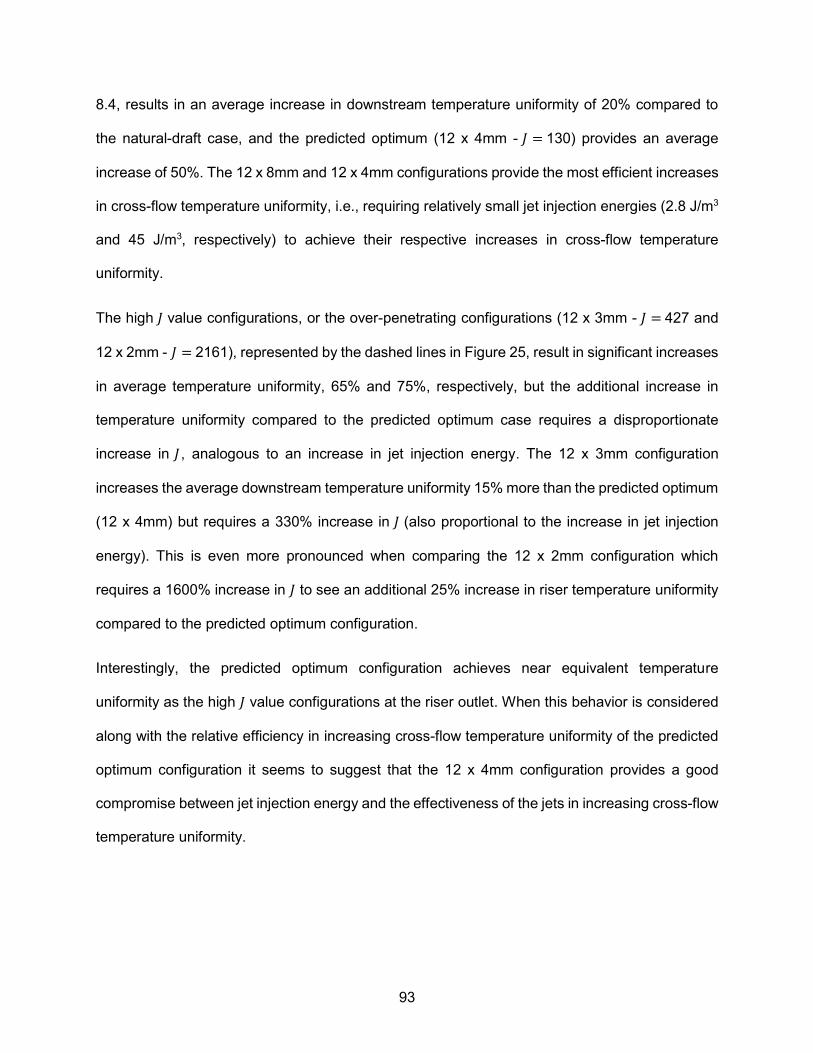
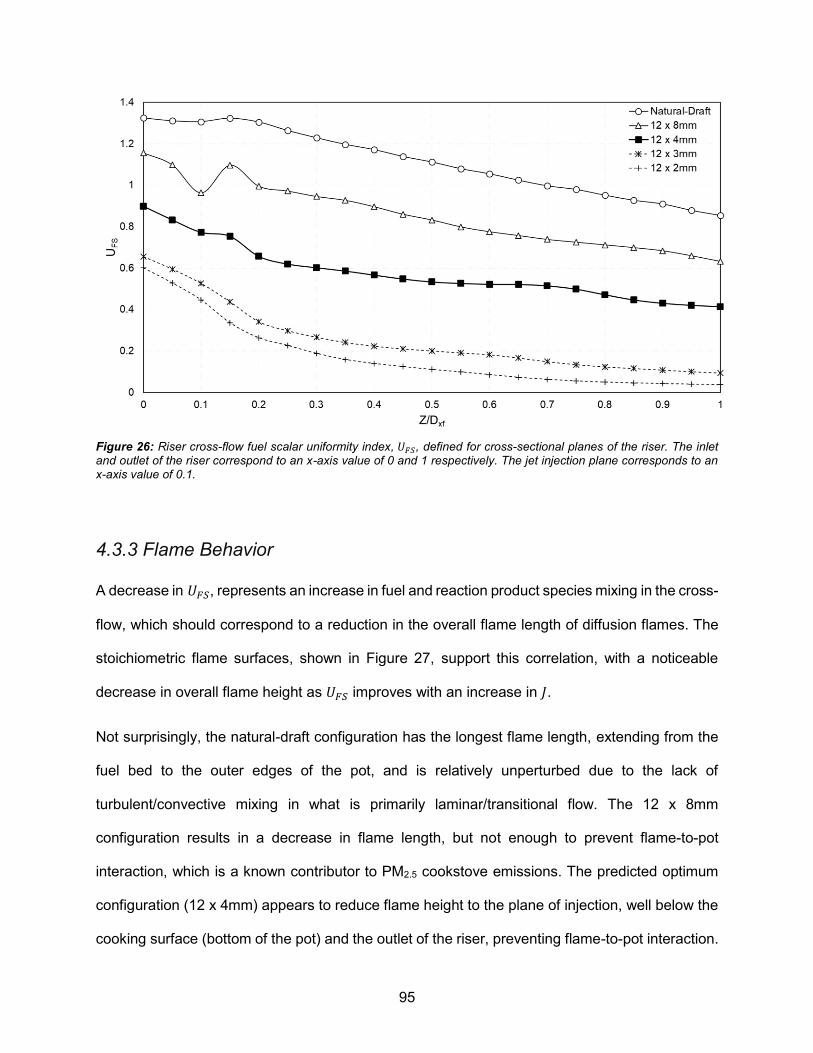
impacts of traditional solid biomass fuel use. The fuel-consumption rate of traditional cooking
technologies has associated environmental, health, and economic implications as well.
Traditional open-fires, commonly referred to as three-stone-fires (TSF), named due to the practice
of using three large stones to balance a cooking implement over an open-fire, typically have
thermal-efficiencies of 14-15% and most traditional cookstoves struggle to operate at thermal-
efficiencies greater than 25% .11 Due to this low thermal-efficiency, 75% or more of the fuel-energy
is not actively used for cooking and/or heating (i.e., wasted) meaning the amount of fuel needed
to complete basic daily cooking and/or heating tasks is much greater than what is required. This
poses a significant challenge for households relying on solid biomass fuels because this increases
the amount of fuel that must be procured.
For households in rural areas solid biomass fuels are predominantly gathered. The time required
to collect enough fuel to meet their cooking and heating needs demands hours each week,
depending on the scarcity of locally available fuel. The time-intensive task of gathering fuel falls
on the shoulders of women and children, which has been found to increase their risk of sexual
violence, increase their risk of physical injuries from carrying heavy loads of fuel, and decrease
time available to spend focused on education, employment opportunities, and/or leisure
activities .12 Further, the act of fuel collection is not a regulated activity, so the impact of household
fuel-collection on the surrounding ecosystem is often left unchecked, contributing to 5% of global
deforestation .24
Households in urban regions must purchase solid biomass fuels, which are often the only
household energy sources with a reliable distribution network and affordable cost. Households
16
purchasing solid biomass fuels spend, on average, less than 10% of their monthly income on fuel,
highlighting the affordability of traditional fuels, even when burned inefficiently, providing key
insight into why so many people still rely on and use them .23 These fuels could become even
more affordable than they already are if the fuel-consumption of traditional cooking practices was
reduced, with the potential to significantly reduce household fuel demand and reduce the
environmental and social impacts of solid biomass fuel use.
In general, the share of traditional solid biomass fuels in household energy demand varies widely
across countries and regions, primarily reflecting their resource endowments, but also their levels
of economic development and urbanization .13 As households become poorer and/or more rural
their household energy options become more limited, with traditional biomass fuels often being
the only energy source that remains accessible to households regardless of their economic
standing or geographical location. Unfortunately, the traditional practices that are used to burn
solid biomass fuels pose great risk to an individual’s health, financial-stability, and their
surrounding environment, due to the inefficiency and high-level of harmful emissions associated
with these traditional practices. This highlights the inequity associated with household energy
access. As household, or per capita income, decreases, so does the availability of affordable
household energy solutions 25, meaning households become more reliant on solid biomass fuels
and traditional cooking practices; increasing the rate of illness, disease, and death in low-income
households compared to households in higher income brackets.
Millions of households around the globe are faced with this inequity every day and remain solely
reliant on traditional solid biomass fuel sources to feed their families and provide heat for their
homes, adding to the many barriers that they already struggle to overcome on a daily basis to
maintain their health, financial-stability, and quality of life. Without increased investment into
providing these households with clean-burning, fuel-efficient, and affordable household energy
solutions, this inequity will remain an ongoing and growing problem.
17
In 2010, the UN Foundation formed the Global Alliance for Clean Cookstoves (a.k.a Clean
Cooking Alliance or Alliance) kickstarting a global initiative to provide clean-burning, efficient, and
affordable cooking technology and fuels for the 3 billion people reliant on the burning of biomass
in open-fires and/or traditional cookstoves. The Alliance supports a multi-disciplinary coalition of
private and public entities that are focused on the development, sale, distribution, and consistent
use of improved cooking solutions that transform lives by improving health, protecting the
environment, creating jobs and income opportunities, and helping consumers save time and
money .14 The Alliance defines improved-cookstoves and/or fuels as technology that provides a
70% reduction in fuel-consumption and an 80% reduction in PM2.5 and CO emissions when
compared to traditional cooking practices and fuels .21 The original target was to convert 100
million households to solutions that meet these targets by the year 2020 .14
Much of this work is focused in Sub-Saharan Africa, the region of the world with the highest
density of countries that have populations that are more than 95% reliant on solid biomass fuels.3
The vast majority (81%) of all African households rely on wood-based biomass as a household
energy source; this will be an estimated 1 billion people by the year 2030 .15 This high demand
means that 89% of all wood harvested in Africa ends up being burned as household fuel .15 The
emissions from the use of solid biomass fuels in open-fires and traditional cookstoves in Africa
leads to 680,000 premature deaths per year and the total impact of these deaths on Africa’s
economy is greater than $232 billion USD annually .16 Africa has a lot to gain from investment in
clean and efficient cooking technologies, especially considering Sub-Saharan Africa is the only
region in the world where the use of solid biomass fuels is expected to grow in coming decades.15
So far, much of the current work in Sub-Saharan Africa has focused on the development and
implementation of improved cookstoves that burn traditional unprocessed solid biomass fuel
supplies (e.g., wood, charcoal, dung, agricultural waste, etc.), but burn these fuels in a clean and
efficient manner. From herein after these types of technologies will be referred to as intermediate
18
cookstoves or technologies. Intermediate cookstoves are notoriously difficult to design so that
they burn clean, are fuel-efficient, meet a households daily cooking needs, and that are affordable
to either distribute or sell to local cooks, who are among populations that are some of the poorest
in the world. Most intermediate solutions sacrifice one or more of these design traits, which has
led to poor adoption rates, negligible reductions in household air pollution, and limited reductions
in household fuel-demand .17 Additional investment into projects focused on developing advanced
biomass cookstoves that burn or use non-traditional processed fuels or energy sources, like
wood-pellets, biogas, solar, and liquid petroleum gas (LPG), have been plagued with similar
issues to intermediate solutions, but with the added difficulty of having to create the markets and
build the infrastructure necessary to make these new fuel sources and cooking technologies
available and affordable to their respective target populations.
Despite the difficulties in developing improved cooking technology there are currently 40 industrial
and semi-industrial improved cookstove enterprises doing business in Sub-Saharan Africa who
have distributed an estimated 8 million intermediate improved cookstove solutions and 100,000
advanced biomass cookstoves as of 2014 .18 There are a lot more households in Sub-Saharan
Africa that have access to clean cooking technology than in the past, but the current progress has
only led to one out of every six households in the region transitioning to the use of improved
cooking technology for most cooking tasks .18 Even for the households who have made the
transition to improved cooking technology and fuels, the impact that these technologies have on
their day-to-day lives is difficult to quantify and is generally unknown. Health impact studies of
clean cooking technology have found mixed results and the meaning of these results to the
viability of clean cooking solutions in reducing the risks of illness, disease, or death, and in
alleviating household fuel-demand is often debated among the improved cooking technology
community. Currently, there is no clear-cut conclusion on if the implementation of improved
household cooking technologies that meet the current performance targets defined by the Alliance
19
result in significant reductions/improvements in health risks, household fuel-demand, social
inequities, and/or environmental damage.
A study completed in 2016 assessed the daily use of a mixture of six different intermediate and
advanced biomass cookstove products currently on the market in Sub-Sharan Africa in 45
households in Kenya. The study found that the median reduction in PM2.5 household-kitchen
concentrations was 38.8%, with a median concentration of 409 µg/m3. While this reduction is
significant, the post implementation median household-kitchen concentration is still almost 12
times the WHO air-quality guideline of 35 µg/m3 and it is far from the 80% reduction that the
Alliance uses to define a clean-burning solution .19 The same study did find personal exposure
levels of CO to be consistently lower than the WHO guideline and that average fuel-consumption
was reduced by 30%, so there does seem to be some confirmation of the potential benefits of the
use of improved cookstoves for households that adopt clean cooking technology .19 But the reality
is that these products still fall short of the minimum performance targets set forth by the Alliance
used to define efficient and clean cooking solutions.
One of the main lessons learned from this study -- and what is becoming more apparent with each
additional health study conducted -- is that stove-stacking, defined to be the use of improved
cookstoves in addition to traditional cookstoves and open-fires, is usually responsible for the
limited impact of improved-cookstove implementations .19 Another study completed in 2012 found
that households only exclusively used an improved cookstove 25% of the days the study was
performed, and stove-stacking visibly occurred over 40% of the time .20 The high-emissions and
relatively high fuel-demand of traditional cooking practices can minimize the benefits of improved
cooking solutions if traditional practices are not eliminated from use.
When asked why people tended to continue using traditional cooking practices, most cooks said
that factors such as ease of use, cooking speed, the inability to cook for large groups, the inability
to cook some local dishes, and unfamiliarity with the improved cookstove meant that cooks
20
gravitated toward using their traditional techniques over the improved cooking solutions .19 Put
simply, these households were provided cooking technology that they did not fully understand
how to use, did not meet their needs, and that, in general, lacked the incentives needed to
encourage the complete transition to the new technology. There should be some expected level
of stove-stacking during a transition period while households adjust to new cooking technology or
fuels, but the widespread stove-stacking found in these studies suggests that the success of clean
and efficient cooking technology is heavily dependent on developing solutions that are well suited
to local cooking culture and cuisine.
One possible outcome is that the majority of clean-burning and/or fuel-efficient solutions used in
these studies are not well suited for their target communities. Specifically, this includes meeting
the expectations of local cooks, their cooking needs, and providing enough incentive to transition
away from traditional cooking practices. This emphasizes the importance of taking into
consideration local cultures, cuisines, consumer preferences, and consumer education when
developing and implementing improved biomass cooking technologies and fuels. Without
consideration of these factors even the most clean-burning, fuel-efficient, and affordable improved
cookstoves can result in low-impact if households do not use them exclusively.
Currently, there are nearly 500 improved cookstove designs listed on the Clean Cooking
Alliance’s website as of 2018 and an estimated 116 million individual improved cookstoves and/or
fuels deployed in households worldwide as of 2016, with 200 million predicted to be distributed
by 2020.21 Millions of households are becoming more aware of the clean cooking initiative and of
the dangers associated with their traditional cooking techniques. Developing clean and efficient
products that also have high adoption rates have, however, remained a challenge. Of the 116
million improved cookstoves and/or fuels being used by households around the globe, only 70
million meet the Clean Cooking Alliance’s definition of efficient and only 44 million meet the
definition of clean-burning, with adoption rates often remaining unknown.21
21
Currently, very few solutions are clean-burning and fuel-efficient, with LPG being one of the only
technologies satisfying the Alliance’s performance targets as well as resulting in high-adoption
rates. This fact drives investment towards LPG technologies, which is apparent in the distribution
of improved cooking technology with LPG technology accounting for 68% of all in-home
deployments worldwide.21 The successful distribution of LPG technologies has primarily been
driven by government funded programs that give LPG the benefit of economies of scale. India is
one such country with government-backed clean cooking initiatives; here, the success of these
LPG focused programs accounts for approximately 50% of all in-home clean cooking products.21
But this is only one region of the world that has made significant progress in transitioning
households in their region to improved cooking technology.
In many regions around the world, such as in Sub-Saharan Africa, government-backed LPG
initiatives like that are found in India are still developing or non-existent. Without government or
consortia led initiatives, most markets suffer from price fluctuations and supply issues that are all-
to-common in the petroleum industry in developing countries. In addition, LPG stove technology
and fuel canisters are relatively expensive for many households. All these contributing factors
reduce the likelihood of complete transition to LPG without significant investment from
government or private organizations, meaning households still must rely on solid biomass fuels
and stove-stacking to meet their household energy needs if their region lacks investment into LPG
access and technology. This is where clean-burning, fuel-efficient, and affordable intermediate
technologies that burn existing low-cost and reliably available unprocessed solid biomass fuels
could act, at the very least, as an interim solution until household electricity access and/or access
to LPG technology and fuel is improved to a point that they become a viable household energy
option and competitor of traditional solid biomass fuels.
Unfortunately, the current state of intermediate improved cooking technologies does not compete
with the performance and utility of electricity or LPG technology. Intermediate cooking
22
technologies are competitive in cost, fuel affordability/availability, and in their similarity to
traditional cooking practices, but the marginal reduction in HAP and poor thermal-efficiency of
current intermediate technologies proves to be a persistent barrier to the successful deployment
of low-cost, clean-burning, and fuel-efficient stoves and/or fuels. Globally, only 25% of all in-home
technologies burn traditional solid biomass fuel supplies and very few of these products meet the
Alliance’s clean-burning and fuel-efficiency targets, with even less achieving high adoption rates
.21 Designing improved cooking technology has proven to be a seemingly insurmountable task.
Challenges include (1) burning locally available traditional biomass fuel supplies, (2) reducing
household emissions, (3) increasing fuel-efficiency to meet the performance targets set by the
Alliance, (4) reducing manufacturing cost to a sustainable level, and (5) meeting the needs of
local cooks. Meeting these challenges are necessary to achieve high adoption rates and complete
transition to the new technology.
Innovative intermediate cookstove design tools and strategies are needed to help define,
understand, and overcome the technical issues preventing the successful development and
implementation of clean-burning and fuel-efficient intermediate improved cookstoves that bridge
the gap between products that meet the performance targets set by the Alliance and products
that meet the needs of local cooks. Bridging this gap would increase the incentives for households
to transition to improved cooking technologies that burn locally available fuels, that are clean-
burning and fuel-efficient, that result in meaningful improvements in personal health, quality of
life, and financial-stability, and that result in meaningful reductions in environmental damage. The
risk of not developing such design tools and design strategies would result in the continuation of
the greatest environmental health risk to the human population, leaving billions of people
worldwide without a suitable clean-burning and fuel-efficient household energy option until major
investment has been made in increasing access to sustainable household electricity and/or LPG
household energy solutions.
23
1.2 ISO/IWA Cookstove Performance Metrics
In pursuit of facilitating the development of cookstove design tools/strategies and the sharing of
knowledge of improved cooking technology the Alliance, in partnership with the International
Organization for Standardization (ISO) and the US Environmental Protection Agency (EPA),
developed a set of performance metrics for quantitative cookstove evaluation. These are detailed
in ISO/IWA 11:2012 “Guidelines for evaluating cookstove performance” .26 The metrics are
separated into three groupings: cookstove emissions, thermal-efficiency, fuel-consumption, and
indoor emissions. While the cookstove emissions and indoor emissions categories are very
similar, the two groupings use different units to describe emissions rates, providing unique
information about stove performance. Each metric has five tiers (0-4, with Tier 4 being the most
stringent). Stoves and/or fuels that meet Tier 4 satisfy all WHO HAP guidelines. The Alliance’s
definition of clean and efficient cooking technologies correspond to a 70% reduction in fuel-
consumption and an 80% reduction in PM2.5 and CO emissions, equating to Tier 2 and Tier 3
performance levels, respectively. The full classification of the metrics and tiers are listed in Table
1 and Table 2.
Table 1: ISO/IWA Tiers for emissions
High Power CO
(g/MJd) Low Power CO
(g/min/L)
High Power PM2.5
(mg/(MJd)
Low Power PM2.5
(mg/min/L)
Tier 0 > 16 > 0.2 > 979 > 8
Tier 1 ≤ 16 ≤ 0.2 ≤ 979 ≤ 8
Tier 2 ≤ 11 ≤ 0.13 ≤ 386 ≤ 4
Tier 3 ≤ 9 ≤ 0.10 ≤ 168 ≤ 2
Tier 4 ≤ 8 ≤ 0.09 ≤ 41 ≤ 1
Note: MJd denotes the energy delivered to the water in the pot.
24
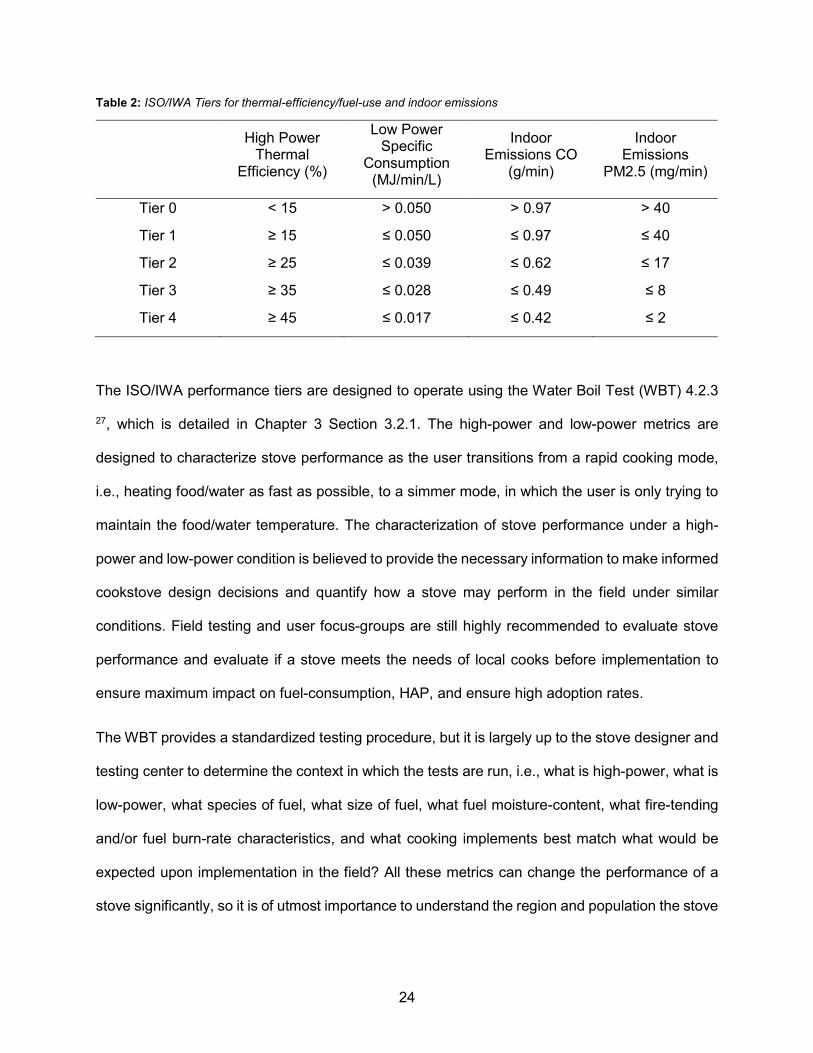
Table 2: ISO/IWA Tiers for thermal-efficiency/fuel-use and indoor emissions
High Power
Thermal Efficiency (%)
Low Power Specific
Consumption (MJ/min/L)
Indoor Emissions CO
(g/min)
Indoor Emissions
PM2.5 (mg/min)
Tier 0 < 15 > 0.050 > 0.97 > 40
Tier 1 ≥ 15 ≤ 0.050 ≤ 0.97 ≤ 40
Tier 2 ≥ 25 ≤ 0.039 ≤ 0.62 ≤ 17
Tier 3 ≥ 35 ≤ 0.028 ≤ 0.49 ≤ 8
Tier 4 ≥ 45 ≤ 0.017 ≤ 0.42 ≤ 2
The ISO/IWA performance tiers are designed to operate using the Water Boil Test (WBT) 4.2.3
27, which is detailed in Chapter 3 Section 3.2.1. The high-power and low-power metrics are
designed to characterize stove performance as the user transitions from a rapid cooking mode,
i.e., heating food/water as fast as possible, to a simmer mode, in which the user is only trying to
maintain the food/water temperature. The characterization of stove performance under a high-
power and low-power condition is believed to provide the necessary information to make informed
cookstove design decisions and quantify how a stove may perform in the field under similar
conditions. Field testing and user focus-groups are still highly recommended to evaluate stove
performance and evaluate if a stove meets the needs of local cooks before implementation to
ensure maximum impact on fuel-consumption, HAP, and ensure high adoption rates.
The WBT provides a standardized testing procedure, but it is largely up to the stove designer and
testing center to determine the context in which the tests are run, i.e., what is high-power, what is
low-power, what species of fuel, what size of fuel, what fuel moisture-content, what fire-tending
and/or fuel burn-rate characteristics, and what cooking implements best match what would be
expected upon implementation in the field? All these metrics can change the performance of a
stove significantly, so it is of utmost importance to understand the region and population the stove
25
is intended for and how the stove will be used in the field in order to most accurately predict the
performance of the stove upon implementation among households in this region.
The cookstove community has found that the carbon monoxide metrics are relatively easy to meet
for most wood-burning stoves, while the thermal-efficiency/fuel-consumption and PM2.5 emissions
metrics present the biggest challenge, especially at the high-power operating condition. Most
cookstove development projects focus on the high-power performance metrics. In general, the
cookstove community has been found that if a stove meets the intended performance targets at
high-power, or under a more “stressed” fueling condition, it will also meet these targets at the low-
power operating condition. Cookstove performance results that are reported only for the high-
power operating condition, or boil phase of the WBT, are often referred to as rapid-WBT, or high-
power-WBT results.
The PM2.5 and CO indoor emissions metrics are included for straightforward comparison against
the World Health Organization’s (WHO) intermediate household combustion emissions rate
targets of 1.75 mg/min and 0.35 g/min for PM and CO, respectively .3 The WHO encourages the
use of their most stringent emissions rate targets of 0.23 mg/min (PM) and 0.16 g/min (CO) to
encourage the use of healthier technology and ensure the repair or replacement of non-compliant
devices .3
Note: The ISO has recently released new cookstove testing standards and performance targets
with ISO/TR 19867-1:2018 and ISO/TR 19867-3:2018 .28,29 Future investigations should adhere
to the protocols and performance metrics outlined in these current standards documents, or any
subsequent updates to the standards. The work presented in this paper was completed prior to
the release of the new standards, the ISO/IWA 11:2012 standards were followed and used for
reporting herein.
26
1.3 University of Washington Clean Cookstoves Laboratory (UWCCL)
In 2012, the US Department of Energy (DOE), one of the founding partners of the Alliance,
announced a funding opportunity made available for applied research and development to
advance clean and efficient biomass cookstove technologies .30 The goal of the DOE was to
facilitate an initiative powered by the combined expertise of private and public entities, within the
US, with the necessary technical expertise needed to define, understand, and overcome the
leading technical and performance issues preventing the successful development, widespread
implementation, and adoption of clean and efficient cooking technologies that burn locally
available unprocessed solid biomass fuels (i.e., intermediate solutions). This DOE backed
initiative primarily focused on remedying the lack of in-depth knowledge of how solid-fuel
combustion, cookstove thermodynamics, and cookstove mechanical design characteristics
interact and contribute to cookstove performance.
In early 2013, the University of Washington received a grant from the DOE as part of this initiative,
which established the University of Washington Clean Cookstoves Laboratory (UWCCL); a
research laboratory focused specifically on understanding all aspects of cookstove design and
performance. The mission of the UWCCL is to help bring viable intermediate cookstove products
to market, via providing the knowledge, tools, and design innovations needed to produce
intermediate cookstove products that eliminate harmful cookstove emissions, optimize thermal-
performance, and that meet the needs of local-cooks. The UWCCL develops cookstove design
tools/strategies and testing protocols in partnership with cookstove designers and manufacturers
which are then made available to the entire cookstove development community. The goal of the
design tools/strategies and testing protocols that the UWCCL develops is to make it easier for
stove designers and manufacturers to assess the performance of their designs, understand how
to interpret performance results, and make strategic and informed improvements to their products,
27
increasing their effectiveness of making a positive impact upon implementation in their target
communities.
1.4 A Natural-Draft Side-Feed Wood-Burning Cookstove for East-Africa
The DOE grant the UWCCL received in 2013 (grant number DE - EE0006284.0000), in
partnership with BURN Manufacturing (BURN) and BURN Design Laboratory (BDL), funded a
three-year project focused on assisting BURN and BDL in the development and design of an
unvented, natural-draft, side-feed, wood-burning cookstove for rural regions of East-Africa, with
an initial target market in rural-Kenya. An unvented, natural-draft, side-feed, wood-burning
cookstove was selected for this region because of the fuel-flexibility, ease of use, and relative
simplicity of stoves in this design category (i.e., inexpensive). An unvented design requires no
modification to a household to install a chimney, saves on cost, and keeps the stove mobile.
Natural-draft stoves, or in other words, stoves that do not use electric fans or components to
augment the cookstoves flow-characteristics or to control fuel input, provide significant cost
savings over designs that incorporate electronic components. Side-feed, wood-burning stoves
allow for the flexibility required to burn the highly-variable unprocessed wood fuels that are found
and used in rural-Kenya and are relatively easy to operate and control while cooking, with the
process being very similar to the open-fires and traditional cookstoves that households in rural-
Kenya are already accustomed to using. The final stove design needed to culminate in a product
that was capable of being locally manufactured in Kenya, sold at a retail cost <$40 USD, meet a
target product lifespan of +2.5 years, meet the needs and design requirements of local cooks,
and meet all ISO/IWA Tier 4 performance standards during in-home use.
28
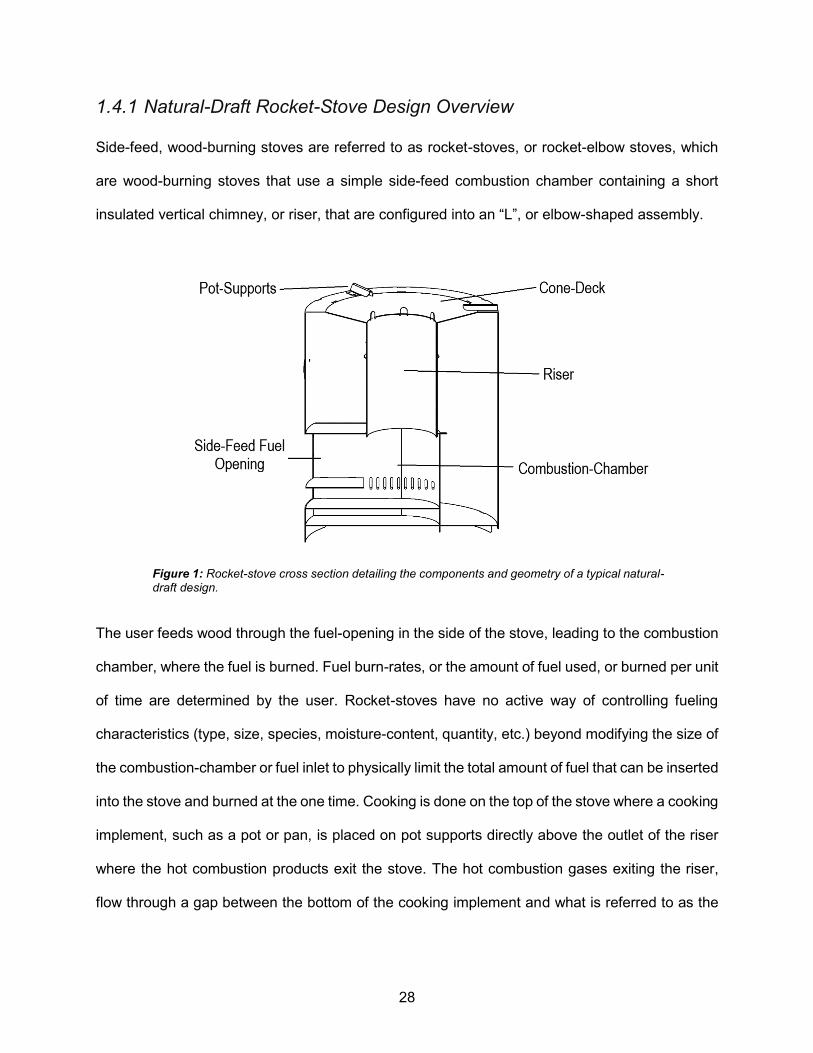
1.4.1 Natural-Draft Rocket-Stove Design Overview
Side-feed, wood-burning stoves are referred to as rocket-stoves, or rocket-elbow stoves, which
are wood-burning stoves that use a simple side-feed combustion chamber containing a short
insulated vertical chimney, or riser, that are configured into an “L”, or elbow-shaped assembly.
The user feeds wood through the fuel-opening in the side of the stove, leading to the combustion
chamber, where the fuel is burned. Fuel burn-rates, or the amount of fuel used, or burned per unit
of time are determined by the user. Rocket-stoves have no active way of controlling fueling
characteristics (type, size, species, moisture-content, quantity, etc.) beyond modifying the size of
the combustion-chamber or fuel inlet to physically limit the total amount of fuel that can be inserted
into the stove and burned at the one time. Cooking is done on the top of the stove where a cooking
implement, such as a pot or pan, is placed on pot supports directly above the outlet of the riser
where the hot combustion products exit the stove. The hot combustion gases exiting the riser,
flow through a gap between the bottom of the cooking implement and what is referred to as the
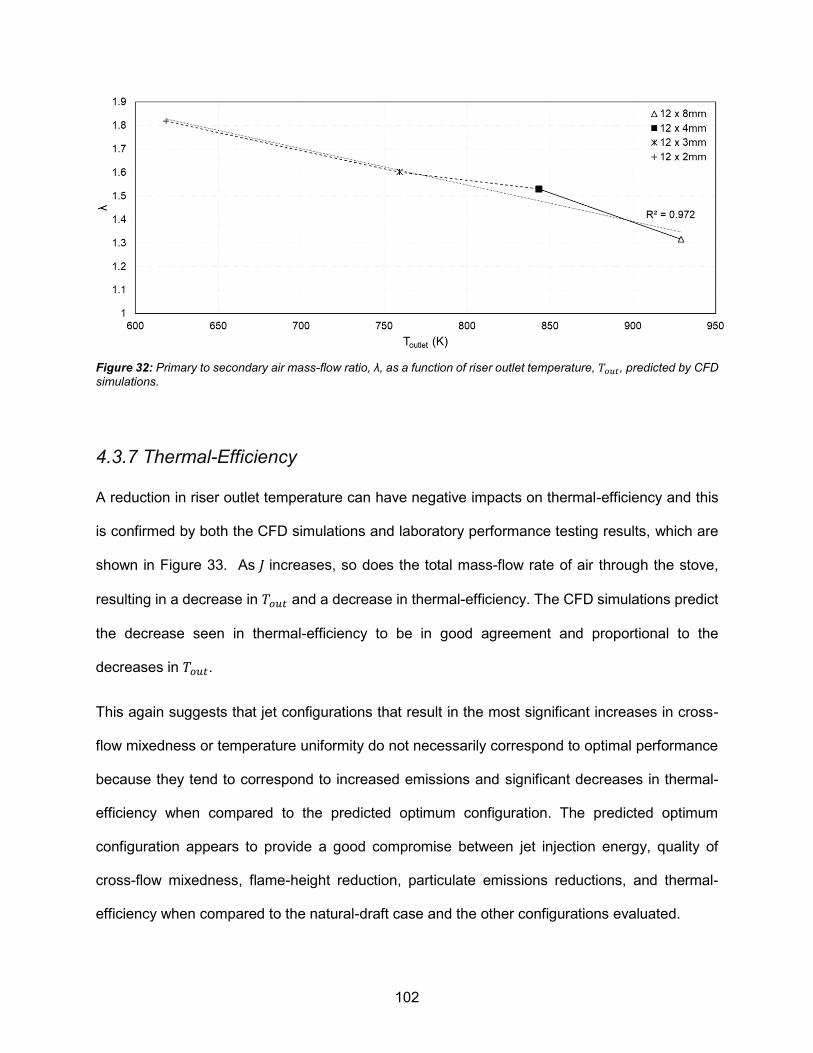
Figure 1: Rocket-stove cross section detailing the components and geometry of a typical natural-draft design.
29
cone deck, which is essentially the top of the stove. Cooking temperature and speed is controlled
by how aggressively fuel is fed into the combustion chamber by the user.
1.4.2 The KuniokoaTM
The DOE funded project, a partnership between the UWCCL, BURN, and BDL, resulted in the
launch of the KuniokoaTM, an unvented, natural-draft, side-feed, wood-burning cookstove
manufactured and sold by BURN in Kenya. The KuniokoaTM was developed using a three-pronged
approach consisting of computational and analytical modeling, experimental testing of conceptual
prototypes, and extensive field and user research.
At the beginning of the project, BURN had an existing unvented natural-draft rocket-stove
prototype, referred to as the Stick-Fed-Rocket, or SFR (Figure 2) that they had developed for
initial design and performance optimization investigations, but had limited success in improving
performance. The SFR, in its original form, was a sub-Tier 3 performing stove when tested under
laboratory conditions (Figure 3). In the early stages of the DOE project, the UWCCL used the
SFR as a test-bed for initial investigations into the thermodynamics and combustion behavior that
dictates natural-draft rocket-stove performance. The UWCCL used a combination of
computational-fluid-dynamic modeling (CFD), analytical models, laboratory experiments, and
practical prototype development to build off the baseline SFR design, eventually designing a stove
prototype that met the Tier 4 performance targets under laboratory testing conditions; this
prototype was referred to as the Tall-Boy (Figure 2).
30
Figure 2: Illustration of the SFR, Tall-Boy, and SFR 35B natural-draft rocket stove prototypes that lead to the development of the KuniokoaTM.
The Tall-Boy incorporated many novel innovations in natural-draft rocket stove design that were
developed in pursuit of Tier 4 performance. The strategy used in developing the Tall-Boy revolved
around performing a thermodynamic energy availability analysis of the SFR. By first
understanding where the energy produced by combustion was distributed throughout the baseline
cookstove assembly, design strategies could be developed to eliminate energy pathways that
were not contributing to cooking, in effect, maximizing the energy available (i.e., availability) to be
used for cooking, resulting in Tier 4 thermal-efficiency. The primary energy pathways of concern
were convective, conductive, and radiative heat-transfer mechanisms that were responsible for
heat-loss from the cookstove assembly to the surrounding environment. Two specific strategies
led to the largest impact. The first was the elimination of conduction pathways connecting the
combustion chamber to the cone deck and the exterior. This was achieved by using low
conductivity connections. Second, the use of low thermal inertia insulation (e.g., radiation shields
as opposed to heaver refractory insulation) reduced the amount of heat absorbed by the stove
31
during a cold start. In addition, by understanding where and why PM2.5 emissions are produced in
a wood-burning cookstove we were able to strategically modify the Tall-Boy design to reduce
PM2.5 emissions to within the Tier 4 performance targets (Tier 4 CO emissions were easily
achieved even in the original SFR). The design strategies used in the Tall-Boy that were
necessary to reach this level of performance in an unvented, natural-draft, side-feed, wood-
burning cookstove are summarized below and the corresponding high-power WBT performance
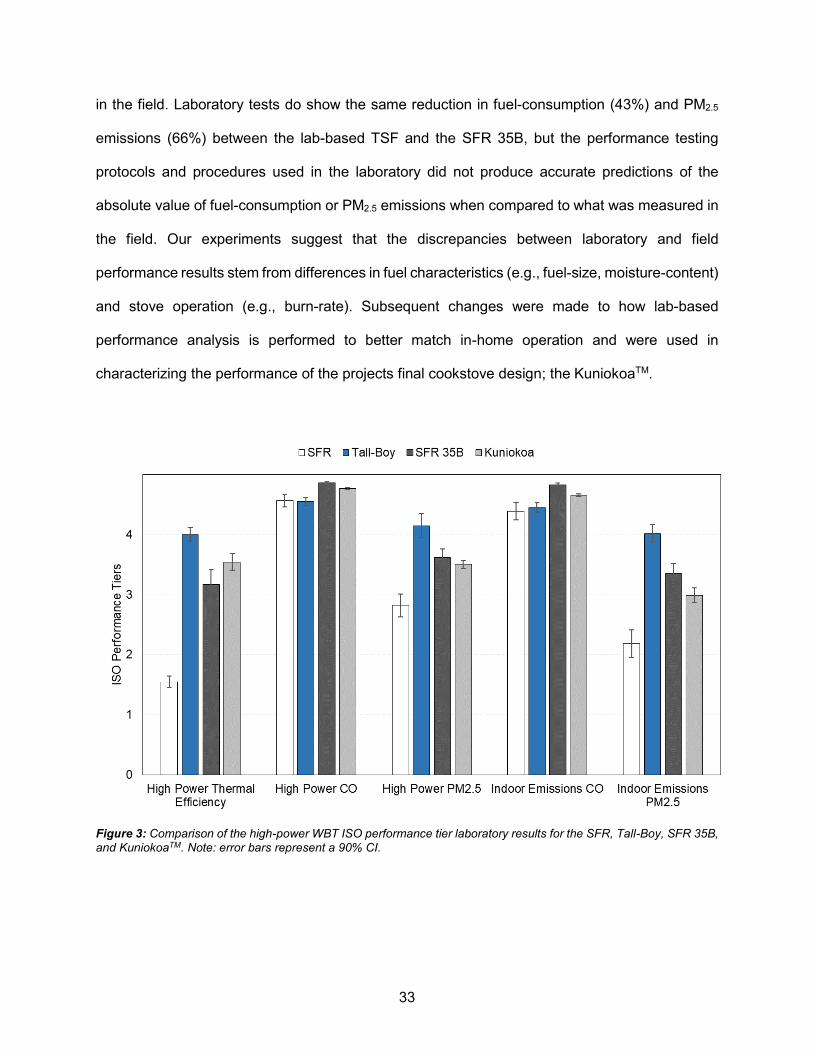
tiers for the Tall-Boy are shown in Figure 3:
• Minimize thermal-mass, or heat capacitance, of the stove assembly.
• Use of low-thermal mass insulation and heat-shield material.
• Use of a multi-layered insulation technique using an air-gap between internal stove
components (combustion chamber, riser, etc.) and glass-fiber insulation and/or heat-
shield assemblies.
• Thermal-isolation, with respect to convection, conduction, and radiation, of stove
components that are directly exposed to the fuel-bed and/or combustion gases.
• Precise control of primary, over-fire, and under-fire air injection location, flow-rates, and
velocities.
• Precise control of fuel-size, moisture-content, species, feed-rate, and fuel-position in the
combustion-chamber.
• Use of specialized stove lighting techniques optimized to produce minimal start-up
emissions.
• Multi-stage combustion chamber, providing separate regions for primary combustion,
secondary charcoal combustion, a low-oxygen region for wood-gasification, and a
secondary combustion zone for over-fire wood-gas re-burn.
• Use of static-mixers to increase mixing between unburnt fuel and air, also used to increase
the effectiveness of various natural-draft air injection techniques.
32
• Increased stove height to increase draft, or flow-potential, through the stove and to reduce
flame-impingement on the bottom surface of the cooking surface (pot).
• Use of an insulated pot-skirt and finned-bottom pot to increase the surface area and time
available for heat-transfer between combustion products exiting the top of the stove and
the cooking surface (pot).
• Optimization of the internal flow pathway geometry to maximize heat-transfer to the
cooking surface (pot).
Note: These design strategies are detailed in the following conference proceedings31, 32, 33, 34, 35, 53.
When limited to natural-draft, all the strategies outlined above were required to meet the Tier 4
performance targets under laboratory testing conditions. Unfortunately, some of these strategies
are not compatible with producing a product that was inexpensive, manufacturable, durable, easy-
to-use, and that met the needs of local cooks. To mitigate these issues many of the novel
cookstove design strategies and characteristics that were developed through the process of
designing the Tall-Boy were incorporated into a more cost-effective and manufacturable design,
in the form of the SFR 35B; a Tier 3 performing stove under laboratory testing conditions (Figure
3). In 2016, ten of the SFR 35B prototypes were built in Kenya and underwent home-placement
in various rural-regions of Kenya to assess the design’s impact on household fuel-consumption
and HAP. While placed with these household’s, Berkeley Air Monitoring Group (BAMG) observed
the in-home use of the SFR 35B and collected data on fuel-consumption and HAP for both the
SFR 35B and the traditional TSF that the households were currently using for cooking.
BAMG found that the SFR 35B reduced fuel-consumption by 43% and PM2.5 emissions by 66%
when compared to the traditional TSF used by the households in the study, corresponding to Tier
2 and Tier 0 performance respectively. Unsurprisingly, the field data collected by BAMG suggests
that the stove performance predicted under laboratory testing conditions and by laboratory testing
protocols did not correspond to equivalent performance when the stove was used by local cooks
33
in the field. Laboratory tests do show the same reduction in fuel-consumption (43%) and PM2.5
emissions (66%) between the lab-based TSF and the SFR 35B, but the performance testing
protocols and procedures used in the laboratory did not produce accurate predictions of the
absolute value of fuel-consumption or PM2.5 emissions when compared to what was measured in
the field. Our experiments suggest that the discrepancies between laboratory and field
performance results stem from differences in fuel characteristics (e.g., fuel-size, moisture-content)
and stove operation (e.g., burn-rate). Subsequent changes were made to how lab-based
performance analysis is performed to better match in-home operation and were used in
characterizing the performance of the projects final cookstove design; the KuniokoaTM.
Figure 3: Comparison of the high-power WBT ISO performance tier laboratory results for the SFR, Tall-Boy, SFR 35B,
and KuniokoaTM. Note: error bars represent a 90% CI.
34
The SFR 35B may not have met the Tier 4 performance goals of the project, in the laboratory or
in the field, but the performance of the SFR 35B was a significant improvement over BURN’s
existing SFR design and the traditional TSF. BURN decided these performance increases would
still provide an immediate and significant benefit to households. At the time of the SFR 35B field-
study there was not an unvented, natural-draft, side-feed, wood-burning cooking product available
in Kenya that matched the thermal-efficiency and emissions performance of the SFR 35B,
suggesting that significant progress had been made in advancing the performance of wood-
burning stove technology among what was currently available in East-Africa, even if the
performance was short of the original Tier 4 target.
In the final stages of the project, BURN and BDL used the SFR 35B design, the design strategies
the UWCCL developed as part of the Tall-Boy and SFR 35B design process, and user feedback
data from an extensive series of product focus-groups conducted in Kenya, to create a
manufacturable product that BURN could produce in their cookstove factory outside of Nairobi,
Kenya. BURN’s natural-draft, side-feed, wood-burning rocket-stove, marketed under the product
name KuniokoaTM, is the culmination of the work completed by the UWCCL, BURN, and BDL,
made possible by the US DOE. The KuniokoaTM meets nearly all the original project goals, it is
locally manufactured in Kenya, sold at a retail cost <$40 USD, has a proven lifespan of +4 years
when subjected to daily in-home use, and meets the needs and design requirements of local
cooks. The KuniokoaTM did not satisfy the original Tier 4 performance targets set at the onset of
the project, but at the time of launch the KuniokoaTM was the most fuel-efficient and clean-burning
natural-draft cookstove available in Sub-Saharan Africa that burns locally available unprocessed
wood-fuel.
35
1.4.3 KuniokoaTM Laboratory Performance
The UWCCL subjected the KuniokoaTM to a series of laboratory performance tests including
WBT’s and Firepower-Sweep-Test’s (FPS, detailed in Chapter 3 Section 3.2.2) as part of the final
design analysis for the DOE project and to provide BURN and BDL with a comprehensive
laboratory performance analysis of the KuniokoaTM when subject to field typical use. The purpose
of this testing was to characterize the fuel-consumption and emissions behavior of the KuniokoaTM
over a wide-range of operating conditions (e.g., fuel-sizes, moisture-content, and burn-rates)
typical of in-home use in rural-Kenya and to also define the optimum operating condition(s) and
corresponding performance. The datum were then provided to BURN as an official performance
analysis of the KuniokoaTM and for comparison for future design development.
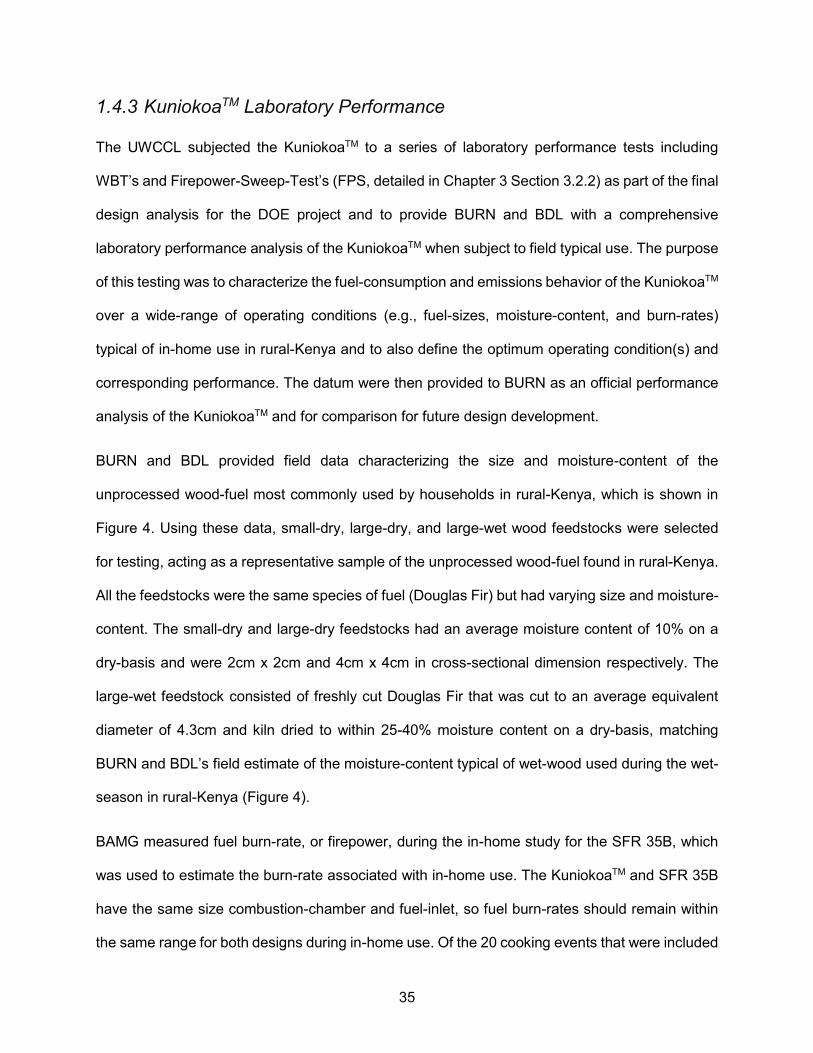
BURN and BDL provided field data characterizing the size and moisture-content of the
unprocessed wood-fuel most commonly used by households in rural-Kenya, which is shown in
Figure 4. Using these data, small-dry, large-dry, and large-wet wood feedstocks were selected
for testing, acting as a representative sample of the unprocessed wood-fuel found in rural-Kenya.
All the feedstocks were the same species of fuel (Douglas Fir) but had varying size and moisture-
content. The small-dry and large-dry feedstocks had an average moisture content of 10% on a
dry-basis and were 2cm x 2cm and 4cm x 4cm in cross-sectional dimension respectively. The
large-wet feedstock consisted of freshly cut Douglas Fir that was cut to an average equivalent
diameter of 4.3cm and kiln dried to within 25-40% moisture content on a dry-basis, matching
BURN and BDL’s field estimate of the moisture-content typical of wet-wood used during the wet-
season in rural-Kenya (Figure 4).
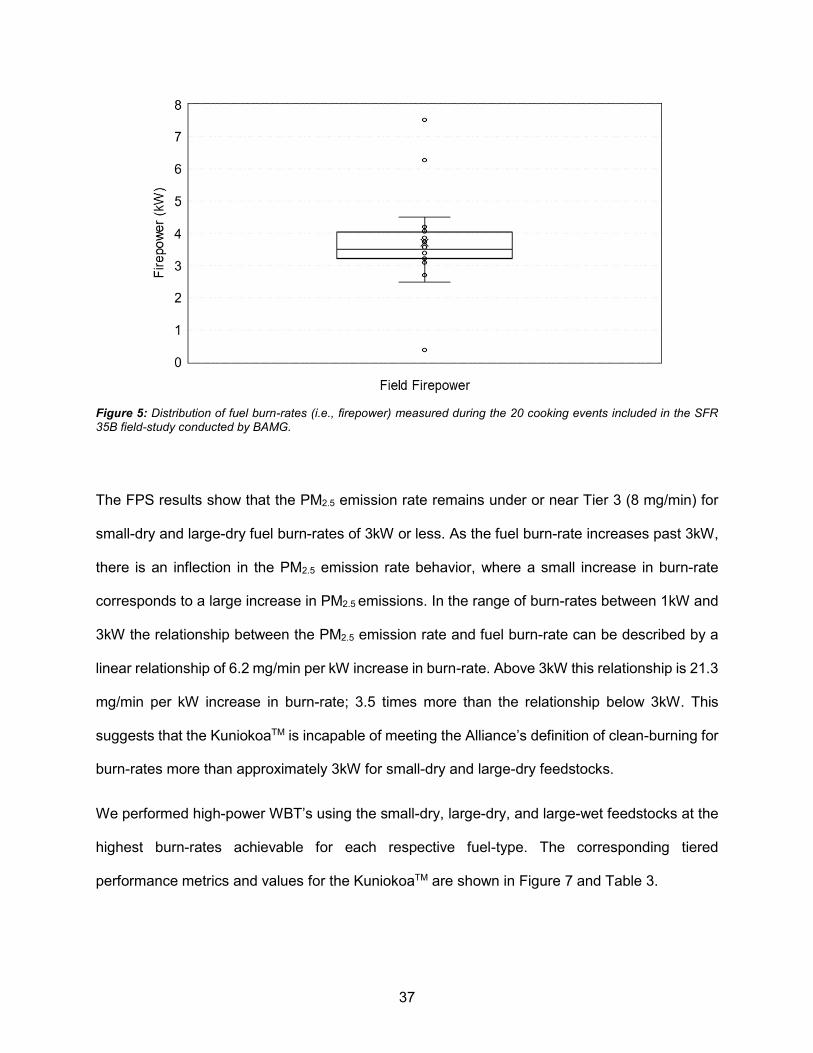
BAMG measured fuel burn-rate, or firepower, during the in-home study for the SFR 35B, which
was used to estimate the burn-rate associated with in-home use. The KuniokoaTM and SFR 35B
have the same size combustion-chamber and fuel-inlet, so fuel burn-rates should remain within
the same range for both designs during in-home use. Of the 20 cooking events that were included
36
in the SFR 35B field study, the median firepower was 3.5kW and most cooking events resulted in
fuel burn-rates between 2.5kW to 4.5kW, shown in Figure 5. Based upon the fuel and burn-rate
characteristics measured by BURN, BDL, and BAMG, we configured and performed an FPS to
characterize the PM2.5 performance of the KuniokoaTM for small-dry and large-dry feedstocks
covering a range of fuel burn-rates similar to what was measured in the field. The results from the
FPS are shown in Figure 6.
Figure 4: Comparison of the moisture-content (MC) of fuel-feedstocks found in rural-Kenya, based from data and estimates collected by BURN and BDL, to the fuel-feedstocks used by UWCCL for performance testing of the KuniokoaTM.
37
Figure 5: Distribution of fuel burn-rates (i.e., firepower) measured during the 20 cooking events included in the SFR 35B field-study conducted by BAMG.
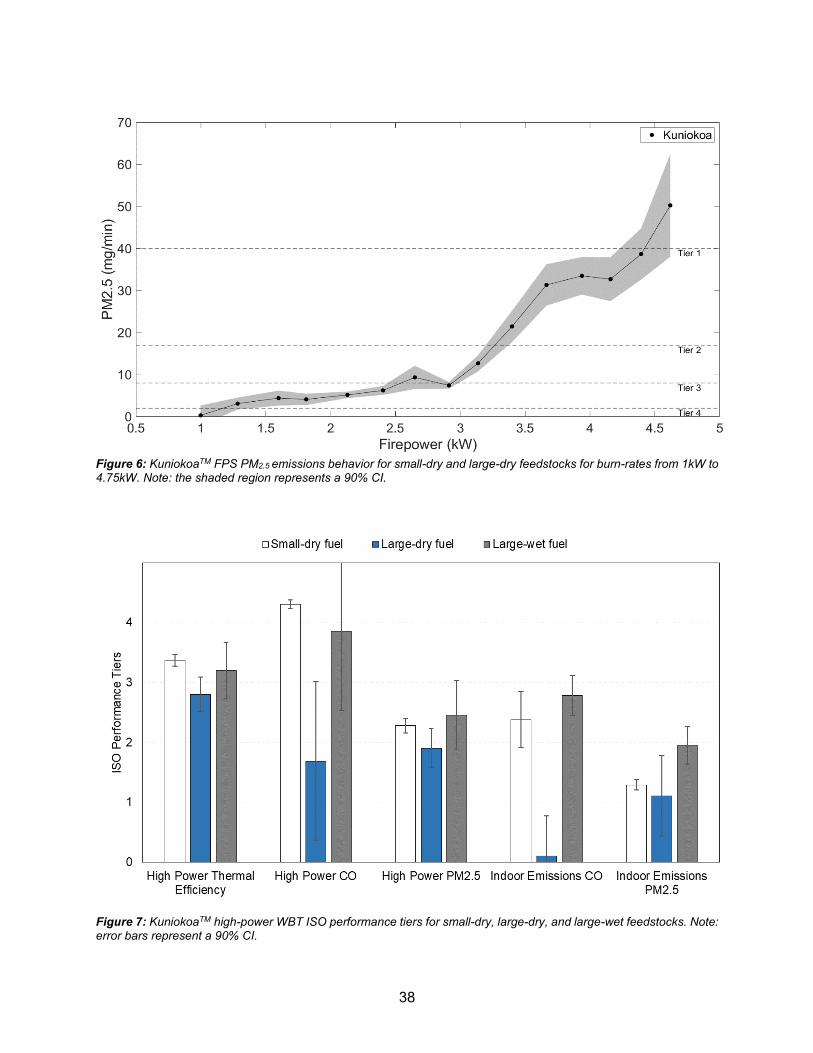
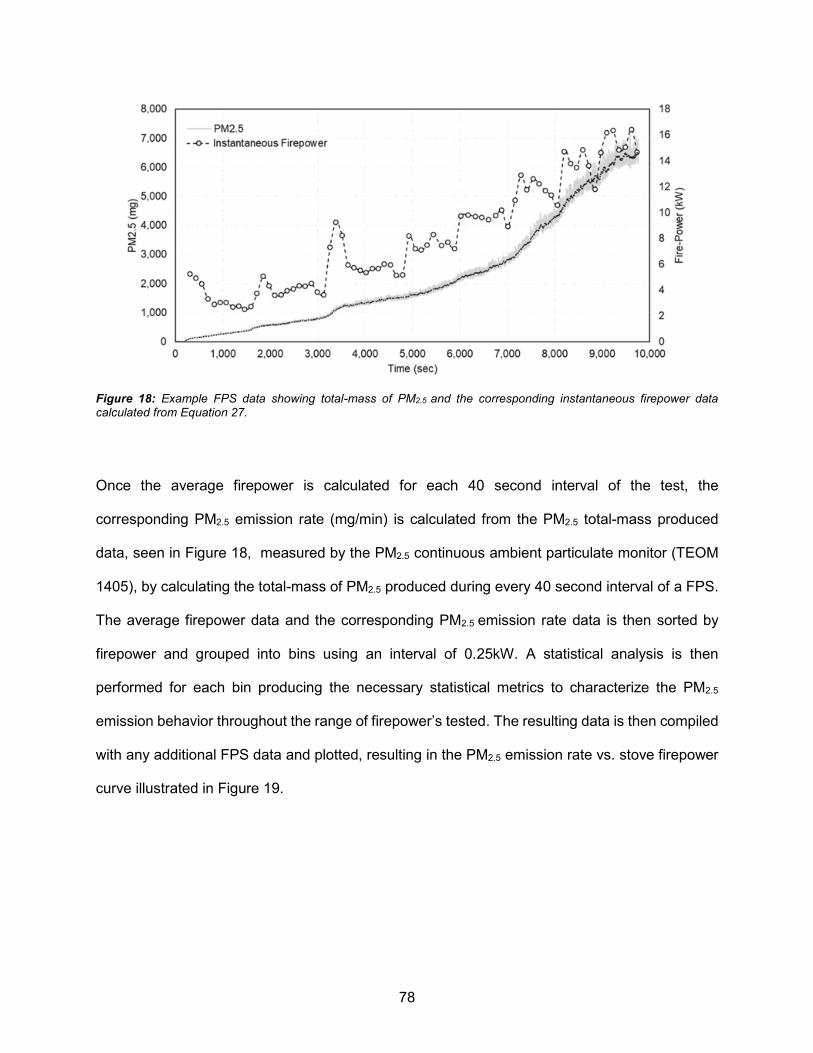
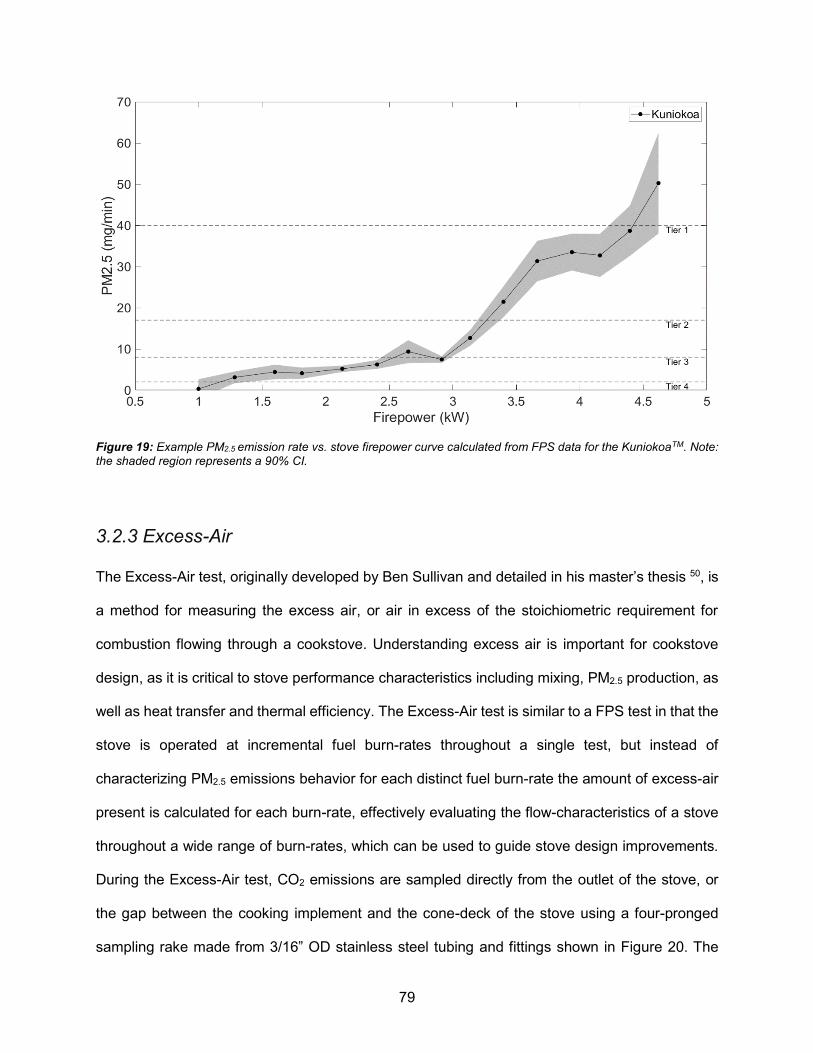
The FPS results show that the PM2.5 emission rate remains under or near Tier 3 (8 mg/min) for
small-dry and large-dry fuel burn-rates of 3kW or less. As the fuel burn-rate increases past 3kW,
there is an inflection in the PM2.5 emission rate behavior, where a small increase in burn-rate
corresponds to a large increase in PM2.5 emissions. In the range of burn-rates between 1kW and
3kW the relationship between the PM2.5 emission rate and fuel burn-rate can be described by a
linear relationship of 6.2 mg/min per kW increase in burn-rate. Above 3kW this relationship is 21.3
mg/min per kW increase in burn-rate; 3.5 times more than the relationship below 3kW. This
suggests that the KuniokoaTM is incapable of meeting the Alliance’s definition of clean-burning for
burn-rates more than approximately 3kW for small-dry and large-dry feedstocks.
We performed high-power WBT’s using the small-dry, large-dry, and large-wet feedstocks at the
highest burn-rates achievable for each respective fuel-type. The corresponding tiered
performance metrics and values for the KuniokoaTM are shown in Figure 7 and Table 3.
38
Figure 6: KuniokoaTM FPS PM2.5 emissions behavior for small-dry and large-dry feedstocks for burn-rates from 1kW to 4.75kW. Note: the shaded region represents a 90% CI.
Figure 7: KuniokoaTM high-power WBT ISO performance tiers for small-dry, large-dry, and large-wet feedstocks. Note: error bars represent a 90% CI.
39
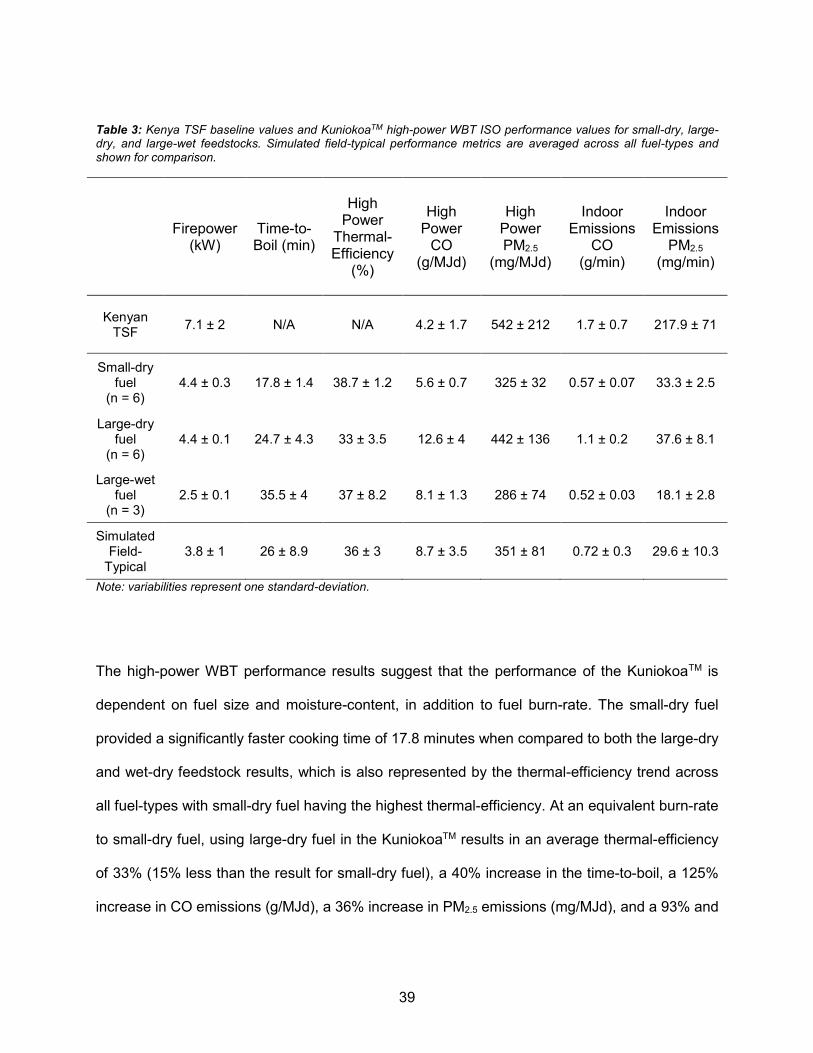
Table 3: Kenya TSF baseline values and KuniokoaTM high-power WBT ISO performance values for small-dry, large-dry, and large-wet feedstocks. Simulated field-typical performance metrics are averaged across all fuel-types and shown for comparison.
Note: variabilities represent one standard-deviation.
The high-power WBT performance results suggest that the performance of the KuniokoaTM is
dependent on fuel size and moisture-content, in addition to fuel burn-rate. The small-dry fuel
provided a significantly faster cooking time of 17.8 minutes when compared to both the large-dry
and wet-dry feedstock results, which is also represented by the thermal-efficiency trend across
all fuel-types with small-dry fuel having the highest thermal-efficiency. At an equivalent burn-rate
to small-dry fuel, using large-dry fuel in the KuniokoaTM results in an average thermal-efficiency
of 33% (15% less than the result for small-dry fuel), a 40% increase in the time-to-boil, a 125%
increase in CO emissions (g/MJd), a 36% increase in PM2.5 emissions (mg/MJd), and a 93% and
40
13% increase in CO and PM2.5 indoor emission rates, respectively, when compared to the small-
dry feedstock performance results.
Both the large-dry and large-wet fuel performance results had higher variability in performance
compared to the small-dry fuel even though the variability in fuel burn-rate across all tests was
not significantly different than the small-dry fuel. This suggests variability in burn-rate is not the
only factor responsible for the higher performance variabilities when using large-dry and large-
wet feedstocks.
The large-wet feedstock performance results suggest that the KuniokoaTM is limited in its ability
to burn large-wet wood with the highest fuel burn-rate achievable being 43% less than the small-
dry and large-dry feedstocks. The ability of the stove to burn high moisture content wood is vital
for local cooks during the wet-season when dry wood can be hard to procure. In addition, the
PM2.5 emission rate of the large-wet wood results suggest that the PM2.5 emission rate increases
for higher moisture-content fuel when compared to the results at an equivalent fuel burn-rate for
the small-dry and large-dry feedstocks.
Averaging the tiered performance results across all the fuel-types is used as a simulated
representation of field-typical performance. The simulated field-typical performance across all
fuel-types is on average Tier 3 for high-power thermal-efficiency, Tier 3 for high-power CO, Tier
2 for high-power PM2.5, Tier 1 for indoor emissions CO, and Tier 1 for indoor emissions PM2.5. If
this performance is compared to the Kenyan TSF emissions data measured by BAMG during the
SFR 35B field-study (Table 3), the KuniokoaTM corresponds to a 66% increase in high-power CO
emissions, a 47% decrease in high-power PM2.5 emissions, a 67% decrease in the indoor CO
emission rate, and an 89% decrease in the indoor PM2.5 emission rate.
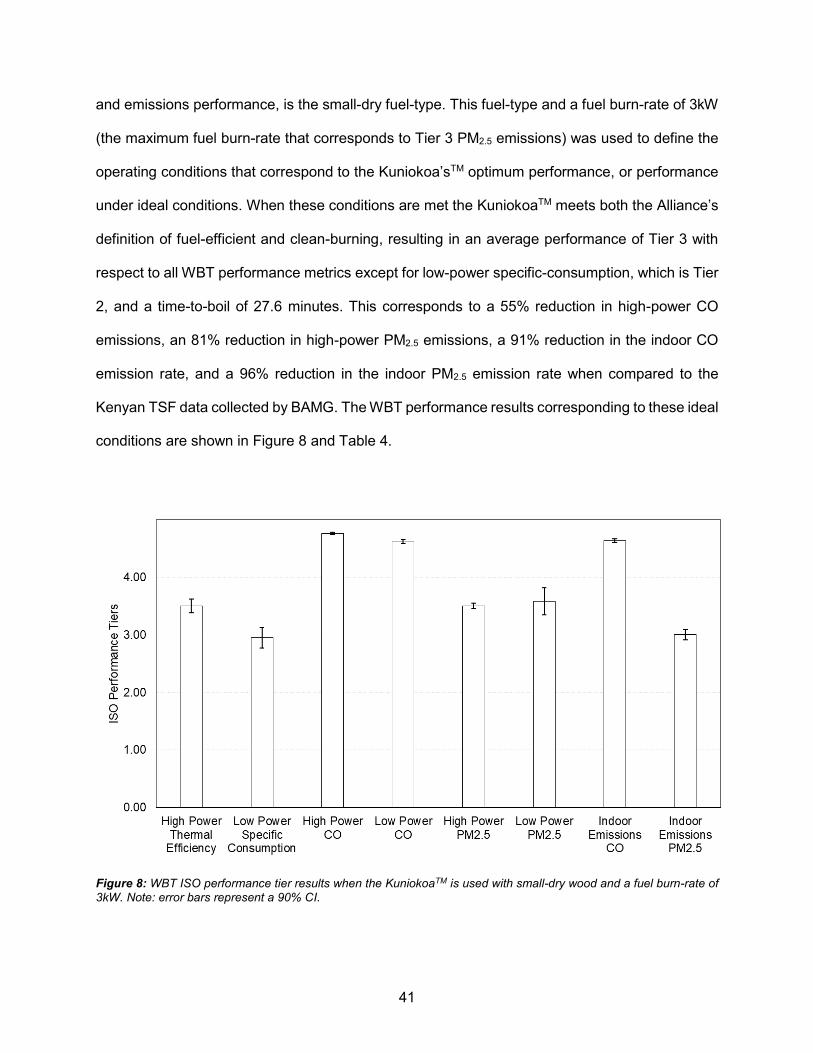
Reviewing the high-power WBT results suggests that the wood feedstock that the KuniokoaTM is
best suited to burn, resulting in the best compromise between cooking-time, thermal-efficiency,
41
and emissions performance, is the small-dry fuel-type. This fuel-type and a fuel burn-rate of 3kW
(the maximum fuel burn-rate that corresponds to Tier 3 PM2.5 emissions) was used to define the
operating conditions that correspond to the Kuniokoa’sTM optimum performance, or performance
under ideal conditions. When these conditions are met the KuniokoaTM meets both the Alliance’s
definition of fuel-efficient and clean-burning, resulting in an average performance of Tier 3 with
respect to all WBT performance metrics except for low-power specific-consumption, which is Tier
2, and a time-to-boil of 27.6 minutes. This corresponds to a 55% reduction in high-power CO
emissions, an 81% reduction in high-power PM2.5 emissions, a 91% reduction in the indoor CO
emission rate, and a 96% reduction in the indoor PM2.5 emission rate when compared to the
Kenyan TSF data collected by BAMG. The WBT performance results corresponding to these ideal
conditions are shown in Figure 8 and Table 4.
Figure 8: WBT ISO performance tier results when the KuniokoaTM is used with small-dry wood and a fuel burn-rate of
3kW. Note: error bars represent a 90% CI.
42
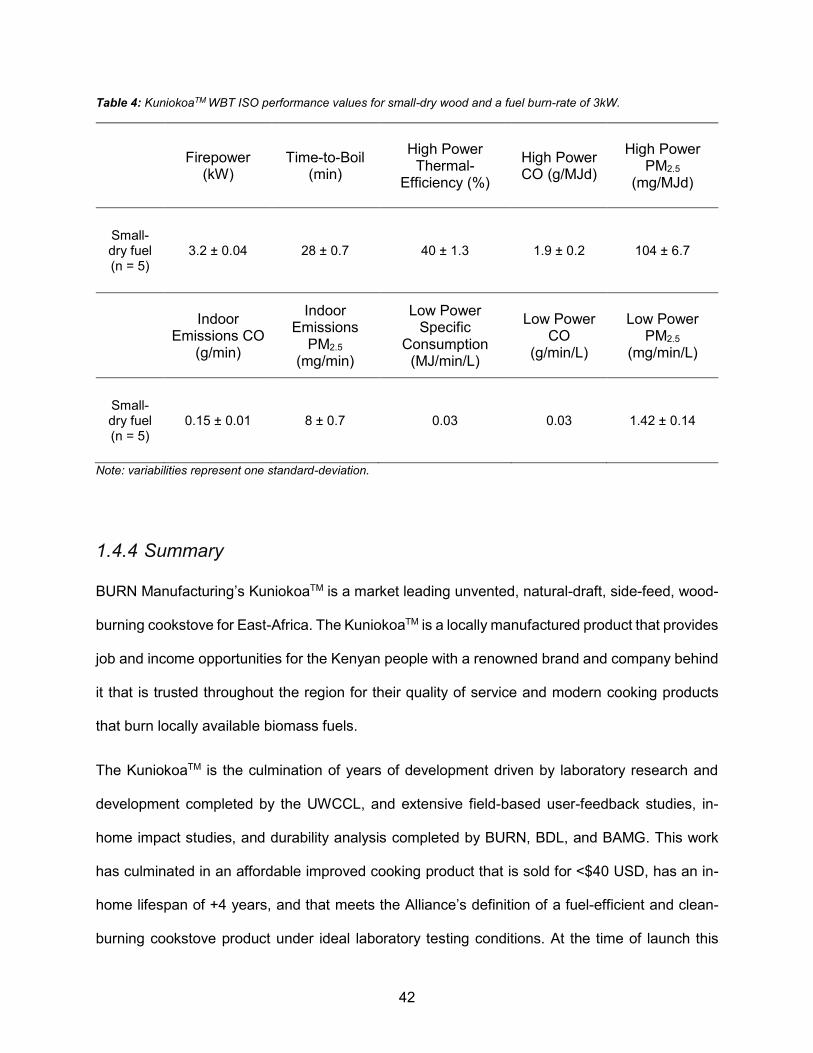
Table 4: KuniokoaTM WBT ISO performance values for small-dry wood and a fuel burn-rate of 3kW.
Firepower
(kW) Time-to-Boil
(min)
High Power Thermal-
Efficiency (%)
High Power CO (g/MJd)
High Power PM2.5
(mg/MJd)
Small-dry fuel (n = 5)
3.2 ± 0.04 28 ± 0.7 40 ± 1.3 1.9 ± 0.2 104 ± 6.7
Indoor Emissions CO
(g/min)
Indoor Emissions
PM2.5 (mg/min)
Low Power Specific
Consumption (MJ/min/L)
Low Power CO
(g/min/L)
Low Power PM2.5
(mg/min/L)
Small-dry fuel (n = 5)
0.15 ± 0.01 8 ± 0.7 0.03 0.03 1.42 ± 0.14
Note: variabilities represent one standard-deviation.
1.4.4 Summary
BURN Manufacturing’s KuniokoaTM is a market leading unvented, natural-draft, side-feed, wood-
burning cookstove for East-Africa. The KuniokoaTM is a locally manufactured product that provides
job and income opportunities for the Kenyan people with a renowned brand and company behind
it that is trusted throughout the region for their quality of service and modern cooking products
that burn locally available biomass fuels.
The KuniokoaTM is the culmination of years of development driven by laboratory research and
development completed by the UWCCL, and extensive field-based user-feedback studies, in-
home impact studies, and durability analysis completed by BURN, BDL, and BAMG. This work
has culminated in an affordable improved cooking product that is sold for <$40 USD, has an in-
home lifespan of +4 years, and that meets the Alliance’s definition of a fuel-efficient and clean-
burning cookstove product under ideal laboratory testing conditions. At the time of launch this
43
performance placed the KuniokoaTM as the most fuel-efficient, natural-draft, wood-burning
cookstove product on the market and one of the leading natural-draft stoves in terms of emissions
reductions.
The KuniokoaTM does have its limitations, with thermal-efficiency and emissions performance
remaining highly-sensitive to operating conditions such as fuel-size, fuel moisture-content, and
fuel burn-rates typical of in-home use. The performance sensitivity of the KuniokoaTM to these
factors suggests that the optimum or ideal performance of the KuniokoaTM is unlikely to be
experienced during in-home use unless the user strictly limits burn-rates to below 3kW and uses
only small-dry wood. Both operating conditions need to be met to see the reductions in fuel-
consumption and emissions during in-home use consistent with the Kuniokoa’sTM optimum
performance. For field-typical operating conditions the average performance of the KuniokoaTM is
Tier 3 for thermal-efficiency and high-power CO emissions, but Tier 2 or less for all other high-
power WBT performance metrics. A summary of the optimum and simulated field-typical high-
power WBT performance tiers for the KuniokoaTM are shown in Table 5.
The KuniokoaTM remains a market leading clean-burning, fuel-efficient, user-friendly, and
affordable wood-burning household cooking product in East-Africa, but there still exists room for
improvement. The field-typical performance of the KuniokoaTM is unlikely to provide a significant
decrease in HAP and the limited usability of the stove outside a narrow range of fuel and operating
characteristics is likely to contribute to poor adoption rates and/or stove-stacking. Further
investigation is needed to understand the cause of these design and performance limitations to
develop superior designs that eliminate these issues ensuring the best performance and user-
experience during in-home use. Overcoming the Kuniokoa’sTM current limitations will encourage
increased adoption resulting in the largest impact on HAP and household fuel consumption.
44
Table 5: High-power WBT tiered performance summary for the KuniokoaTM comparing optimum performance to simulated field-typical performance.
Firepower
(kW) Time-to-Boil (min)
High Power
Thermal-Efficiency
High Power
CO
High Power PM2.5
Indoor Emissions
CO
Indoor Emissions
PM2.5
Optimum 3.2 ± 0.04 28 ± 0.7 3 4 3 4 3
Simulated Field-
Typical 3.8 ± 1 26 ± 8.9 3 3 2 1 1
Note: variabilities represent one standard-deviation.
1.5 PM2.5 Emissions
Reducing the PM2.5 emissions of natural-draft cookstoves that burn solid biomass fuel is one of
the most challenging problems in developing natural-draft cooking technology. One of the
principal performance issues of the KuniokoaTM is the high-variability in PM2.5 emissions when
subjected to field-typical operating conditions. Without understanding the mechanisms and
causes behind the formation of PM2.5, or other incomplete combustion products in stoves like the
KuniokoaTM, it is difficult to design a stove that minimizes emissions. The success of any improved
cooking technology will largely be judged by its ability to reduce PM2.5.
1.5.1 Design Challenges and Performance Limitations in Reducing PM2.5
Emissions of Natural-Draft Rocket-Stoves
Natural-draft solid-fuel combustion systems require special design considerations to burn solid
fuels while producing minimal PM2.5 emissions, or soot. Solid-fuel combustion relies on thermal-
decomposition, or pyrolysis to process raw-fuel into volatile-gases (i.e., pyrolysis products) and
char. These pyrolysis products then mix with air and burn, releasing heat. A portion of this heat
feeds the endothermic wood pyrolysis reaction. Soot is generated by the pyrolysis of fuel gas
under oxygen-deficient conditions. Normally, soot is oxidized when mixed with O2 under high-
temperature conditions. Soot emissions normally result when either (1) the soot-containing gases
45
are thermally quenched before soot oxidation is complete (e.g., impingement of the flame on the
relatively cool cooking pot), or (2) poor mixing prevents the soot from contacting O2 needed for
oxidation. In both cases, achieving adequate mixing within the space provided by the cookstove
is critical. The difficulty in designing a natural-draft wood-burning rocket-stove is satisfying the
conditions required for complete combustion of PM2.5 when limited to natural-draft and when
balancing cost, user, and fuel-efficiency requirements.
One of the primary reasons providing a combustion environment that results in minimal PM2.5
emissions is difficult is because of the type of flame and flow-characteristics of a natural-draft
wood-burning cookstove. Wood-flames are non-premixed diffusion-flames, meaning that the fuel
and oxidizer are not mixed prior to reaction relying on molecular-diffusion and mixing due to
natural-convection that are typically disturbed laminar flows. The Reynolds-number of the flow
through the combustion-chamber and riser of most unvented, natural-draft, rocket-stoves falls
within the laminar-to-transitional region (Re < 2900), which results in minimal flow-turbulence
and/or turbulent kinetic-energy that can be used to aide in mixing fuel and air and reduce the
length scales of molecular-diffusion. Therefore, unvented natural-draft rocket-stoves must rely
only on the relatively slow mixing mechanisms of molecular-diffusion and natural-convection,
which severely limits the ability of oxygen to mix and react with fuel. This results in insufficient
residence time in a high-temperature and oxidizer-rich region necessary to completely burn-off
soot particles and other products of incomplete combustion.
A direct consequence of the relatively slow characteristics of molecular-diffusion and natural-
convective mixing is that, in non-premixed flames, flame-height is strongly dependent on the
volumetric flow-rate of fuel and the diffusivity of fuel into air. The ratio of the volumetric flow-rate
of fuel and the diffusivity of fuel into air is proportional to flame-height for laminar/transitional non-
premixed diffusion-flames, like that are found in natural-draft rocket-stoves. For a constant
diameter non-premixed fuel-jet, if diffusivity remains the same and the volumetric flow-rate of fuel
46
increases, so will flame-height. The inverse is also true, if diffusivity increases, flame-height will
decrease, if the volumetric flow-rate of fuel remains constant. This proportionality is described
using Roper’s definition for laminar/transitional diffusion-flames 36, where 𝑦𝑓 is flame-height, 𝑄 is
the volumetric flow-rate of fuel, and 𝐷 is the diffusivity of fuel into air, given as,
𝑦𝑓~𝑄
𝜋𝐷 Eq. 1
This behavior is observed in the operation of natural-draft rocket-stoves, as can be seen in the
flame-height images observed during an FPS performed on the KuniokoaTM overlaid on the PM2.5
emissions behavior, shown in Figure 9. As fuel burn-rate (i.e., firepower) increases, so does
flame-height, apparent from the degree of impingement of the flame on the bottom surface of the
pot being used on top of the stove. The impingement of the flame on the bottom surface of the
pot, which is a relatively cold surface, acts as a combustion quenching mechanism, dropping the
temperature necessary for combustion reactions to proceed through completion, producing
incomplete combustion products like PM2.5 .35 Looking at the trends of flame-height and PM2.5
emissions for the KuniokoaTM in Figure 9 suggests that flame-height, or fuel burn-rate, and the
degree to which the flame impinges on the bottom surface of the pot, or the degree of quenching,
is strongly correlated to the PM2.5 emission rate of the stove, aligned with the results of a previous
study into the impact and relation of flame-height, stove-height, and PM2.5 emissions .35
47
Figure 9: PM2.5 emissions and flame-height behavior of the KuniokoaTM, illustrating the correlation between flame-height, or degree of impingement of the flame on the bottom of the pot, and PM2.5 emission rate.
When designing a natural-draft, wood-burning cookstove it is important to limit the interaction of
the flame with quenching surfaces, like the bottom of a pot, and increase fuel-to-air mixing, to
control flame-height, if PM2.5 emissions are to remain low. Careful consideration should be made
to understand the relationship between fuel burn-rate, diffusivity, flame-height, and PM2.5
emissions during the stove development process so that appropriate design strategies can be
developed and implemented to provide the necessary conditions for complete combustion,
avoiding the emission of harmful incomplete combustion products, like PM2.5.
In the KuniokoaTM it is likely that the relatively short height of the stove, combined with the wide
range of fuel burn-rates the stove is capable of, results in flame-to-pot interaction that significantly
increases PM2.5 emissions at burn rates higher than 3kW. To solve this issue, design strategies
need to be studied, developed, and implemented that effectively control the mechanisms
48
responsible for non-premixed diffusion flame behavior in laminar/transitional flow and that can be
packaged into a product that still meets all other product requirements.
1.5.2 Design Strategies to Reduce PM2.5 Emissions
The main design strategies that can and have been used to control PM2.5 emissions in natural-
draft, wood-burning cookstoves are increasing stove-height to limit flame-to-pot interaction,
limiting the volumetric flow-rate of fuel by reducing combustion-chamber size and/or fuel-inlet size,
and increasing the flow mixing in the combustion chamber and riser by using static-mixers,
natural-draft air injection, and/or chimneys.
Unfortunately, many of these design strategies have trade-offs and any potential reduction in
PM2.5 emissions seen from the implementation of such strategies can be outweighed by the
unintended impacts of these strategies on other aspects of the stoves design and its performance.
Increasing stove-height increases material cost and has the potential to reduce thermal-efficiency,
making the stove more expensive and reducing fuel-consumption benefits. Reducing combustion-
chamber size and/or the fuel-inlet size can severely limit the type or amount of fuel that can be
used with the stove, decrease heat-output, increase cooking time, and make the stove more
difficult to operate due to the increased sensitivity of sustaining a smaller fire. Static-mixers and
natural-draft air injection are limited in their effectiveness due to the relatively high-pressure drops
needed to make these types of strategies effective in increasing turbulence and diffusivity when
compared to what typical rocket-stove natural-draft flow can provide. Chimneys can help
overcome this issue by increasing the pressure-drop through a stove, increasing natural-draft and
the effectiveness of static-mixers and natural-draft air injection, but add cost and can limit the
utility of a stove.
In many applications of solid-fuel combustion, such as boilers, heaters, and cookstoves, an
effective method of increasing turbulent-mixing resulting in a reduction in flame-height and PM2.5
49
emissions is forced secondary (i.e., overfire) air injection, or air injection in the combustion-
chamber (or riser) above the fuel-bed that is driven by a fan, blower, or compressed-air source .37-
41 By using a flow-source independent of natural-draft, air injection is no longer limited to the
characteristics and limited capabilities inherent of natural-draft air injection techniques. Forced air
injection expands the range of jet configurations, air injection locations, air flow-rates, and jet
velocities that can be used to optimize the mixing traits within the combustion zone (i.e.
combustion-chamber and riser) to reduce unwanted emissions and control flame-height for all
fuel-characteristics and/or burn-rates expected during in-home use.
Achieving comprehensive reductions of harmful emissions using secondary air injection requires
many design parameters to be optimized. A careful balance needs to be found between the
promotion of sufficient turbulent-mixing to reduce harmful emissions, secondary air-flow rates that
do not lower combustion zone temperatures excessively (reducing thermal-efficiency and
increasing quenching), air injection systems that can be driven by inexpensive fans, and air
injection systems that can be manufactured at low cost. Past studies have investigated the
optimization of some air injection traits and evaluated their impact on stove performance, but most
of these investigations only demonstrate the importance of secondary air injection optimization
for advanced biomass cookstoves that utilize processed fuels, with the most popular application
being wood-pellet gasifier cookstoves .37,38,43,44,47 Only one published study, conducted by a
research group at the University of California, Berkeley and Lawrence Berkeley National
Laboratory, investigated the optimization of secondary air injection in a side-feed wood-burning
rocket-stove 48, acting as the sole source of guidance for air injection design optimization for
cookstoves that burn unprocessed fuel (i.e., intermediate solutions). The study found that
cookstove PM2.5 emissions are highly sensitive to secondary air injection flow-rate and velocity
with the most significant reductions in PM2.5 emissions seen for low flow-rate and high velocity jet
configurations. 48
50
Despite the findings demonstrated in previous studies, secondary air injection optimization
remains dependent on optimizing numerous variables that can require complex and time intensive
experimental investigation to determine optimum design characteristics. These studies also do
not provide guidance on how to optimize air injection within the context of cookstove design
parameters like fan-performance, power-consumption, and total system cost requirements. A
comprehensive air injection optimization design tool that defines the relationship between
effective turbulent-mixing, stove performance (thermal-efficiency and emissions behavior), jet-
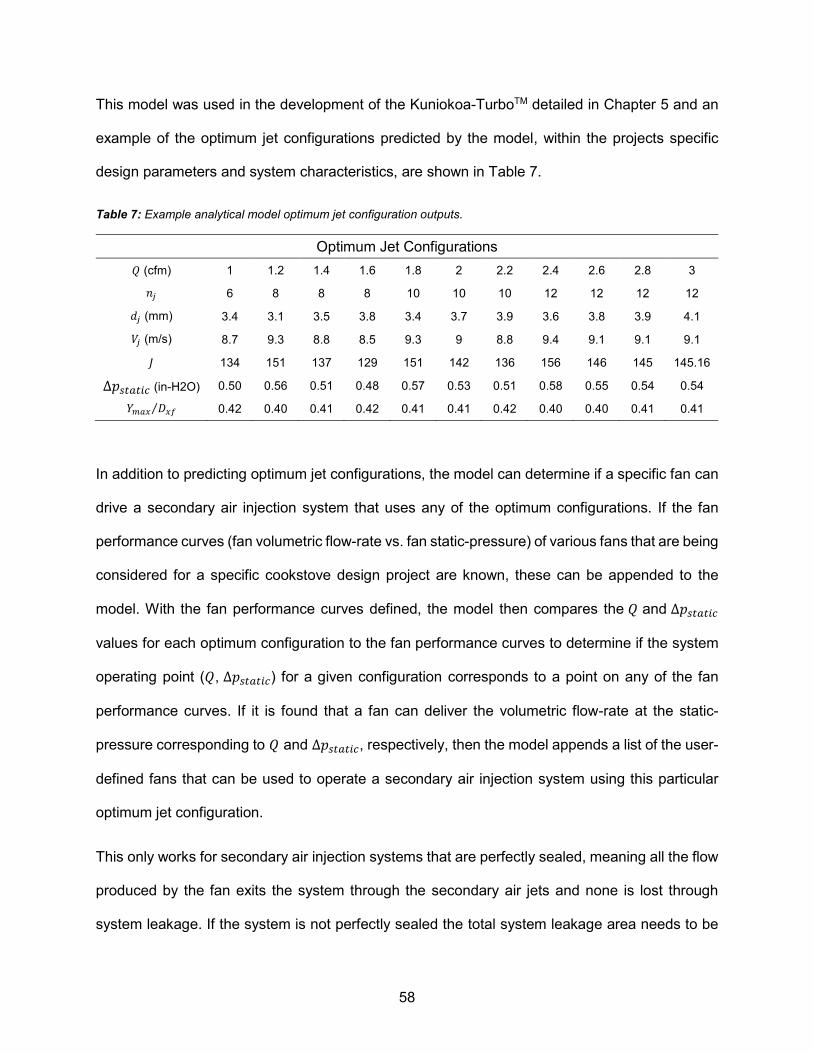
In addition to predicting optimum jet configurations, the model can determine if a specific fan can
drive a secondary air injection system that uses any of the optimum configurations. If the fan
performance curves (fan volumetric flow-rate vs. fan static-pressure) of various fans that are being
considered for a specific cookstove design project are known, these can be appended to the
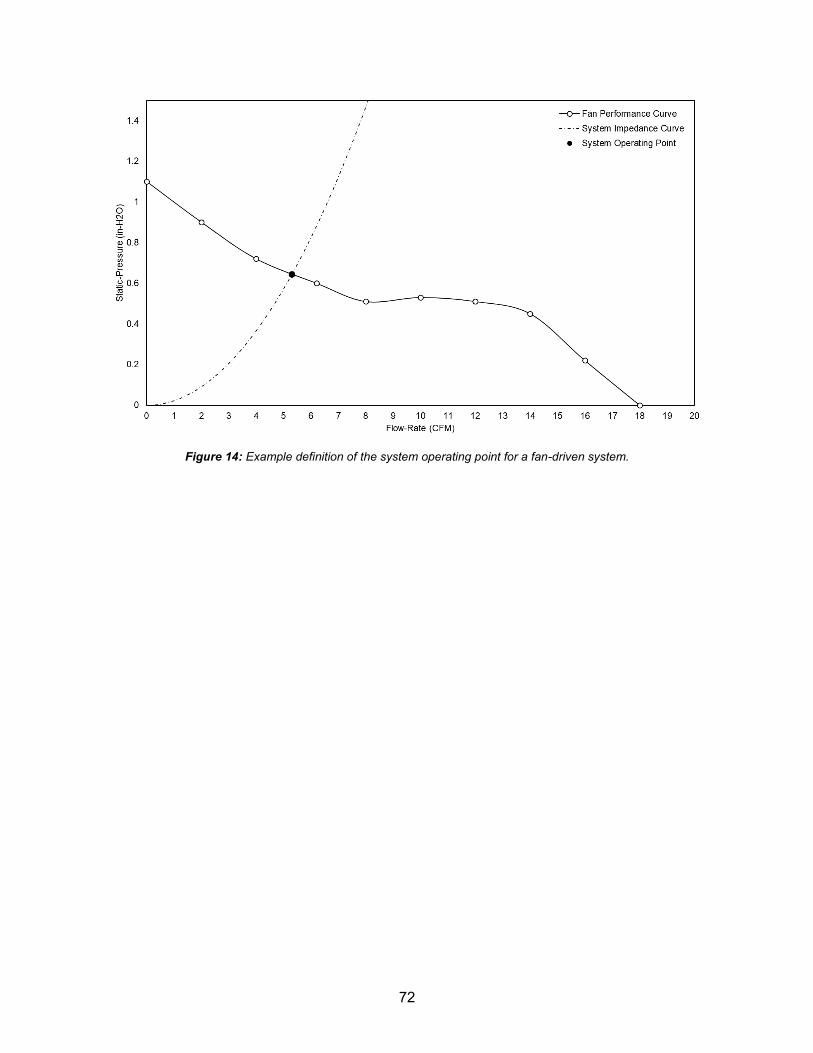
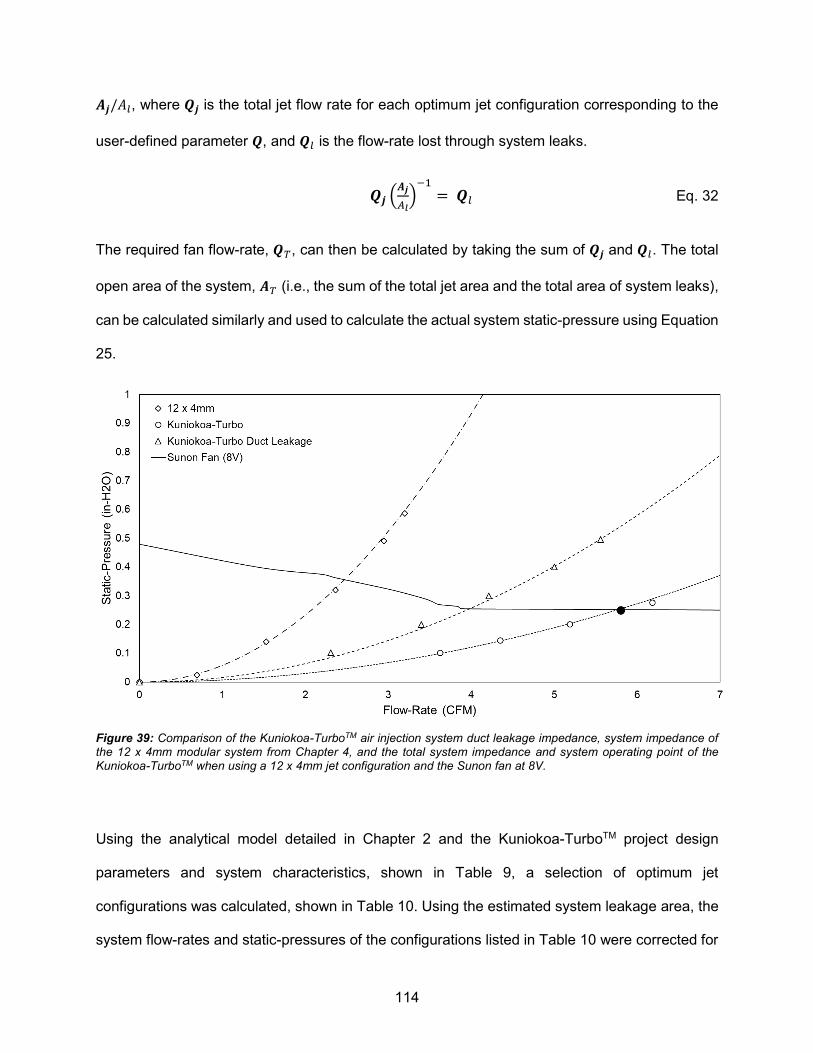
model. With the fan performance curves defined, the model then compares the 𝑄 and ∆𝑝𝑠𝑡𝑎𝑡𝑖𝑐
values for each optimum configuration to the fan performance curves to determine if the system
operating point (𝑄, ∆𝑝𝑠𝑡𝑎𝑡𝑖𝑐) for a given configuration corresponds to a point on any of the fan
performance curves. If it is found that a fan can deliver the volumetric flow-rate at the static-
pressure corresponding to 𝑄 and ∆𝑝𝑠𝑡𝑎𝑡𝑖𝑐, respectively, then the model appends a list of the user-
defined fans that can be used to operate a secondary air injection system using this particular
optimum jet configuration.
This only works for secondary air injection systems that are perfectly sealed, meaning all the flow
produced by the fan exits the system through the secondary air jets and none is lost through
system leakage. If the system is not perfectly sealed the total system leakage area needs to be
59
known in order to approximate how much of the fans flow is lost through system leakage and the
impact this leakage has on the system static-pressure, or system impedance. A change in system
impedance will impact the system operating point necessary to provide the appropriate flow
through the secondary air jets to achieve the optimum jet mixing characteristics calculated by the
model. If performance information on specific fan models that are within a projects size, power,
and cost requirements are unknown the 𝑄 and ∆𝑝𝑠𝑡𝑎𝑡𝑖𝑐 values of the optimum jet configurations
can be provided to fan manufacturers to help guide fan selection.
It should be emphasized that the model does not provide guidance in determining the optimum
location of secondary air injection within the riser of the cookstove or in determining the jet flow-
rate that best works with a stove design. The model only predicts the optimum number and
diameter of jets for the user-defined flow-rates, 𝑸, that will result in optimum cross-flow mixing
and accomplish this with the least amount of operational energy. Cookstove designers still must
rely on experimental data to determine what secondary air injection flow-rates will result in minimal
impacts on thermal-efficiency and other important cookstove performance metrics. In addition,
the cross-flow mixedness optimization parameters are only intended for application to the
optimization of a single-row of equal-diameter circular air jets located symmetrically around the
perimeter of a cylindrical cross-flow. Furthermore, the model only applies to jets that are
perpendicular to the cross-flow, or in other words not angled upstream, downstream, or in a swirl
pattern. Previous studies have investigated the impact of these additional jet design parameters
and more information about the impact of these parameters on cross-flow mixedness can be
found here 49,52.
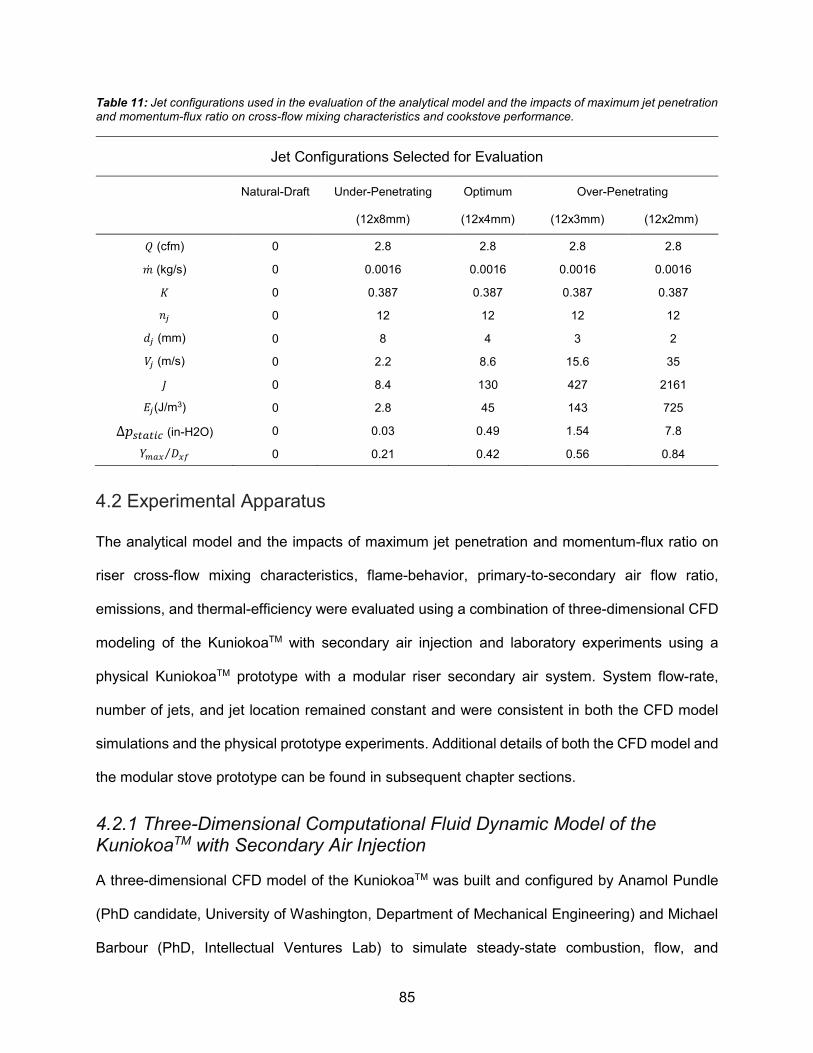
2.2 Cross-Flow Parameters
The optimization parameters used in the analytical model require the geometry, mass-flow, and
density of the cross-flow, or flow through the riser of the stove to be known to a good
approximation in order to calculate optimum jet configurations. This section details the requried
60
user-defined cross-flow parameters and method for approximating the flow through the riser of
the cookstove for secondary air jet optimization purposes.
The analytical model approximates the cross-flow, or the reacting flow of combustion gases
through the riser of the cookstove, as a non-reacting flow of air. The cross-flow cross-sectional
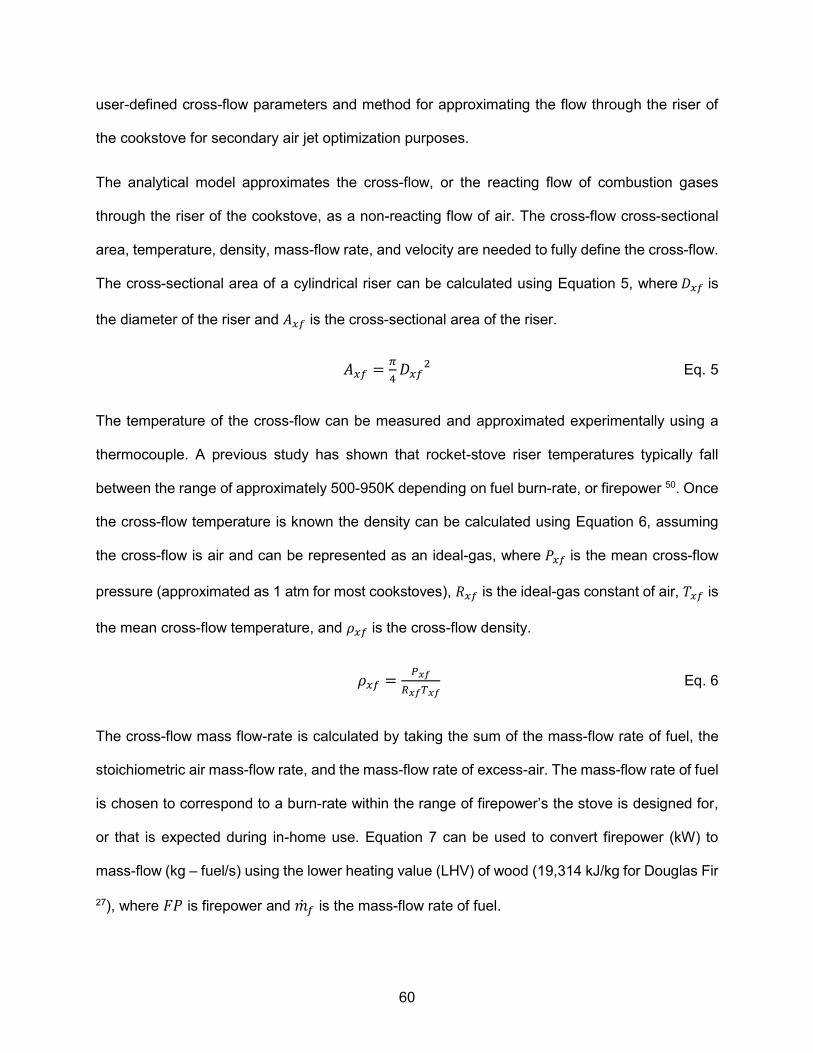
area, temperature, density, mass-flow rate, and velocity are needed to fully define the cross-flow.
The cross-sectional area of a cylindrical riser can be calculated using Equation 5, where 𝐷𝑥𝑓 is
the diameter of the riser and 𝐴𝑥𝑓 is the cross-sectional area of the riser.
𝐴𝑥𝑓 =𝜋
4𝐷𝑥𝑓
2 Eq. 5
The temperature of the cross-flow can be measured and approximated experimentally using a
thermocouple. A previous study has shown that rocket-stove riser temperatures typically fall
between the range of approximately 500-950K depending on fuel burn-rate, or firepower 50. Once
the cross-flow temperature is known the density can be calculated using Equation 6, assuming
the cross-flow is air and can be represented as an ideal-gas, where 𝑃𝑥𝑓 is the mean cross-flow
pressure (approximated as 1 atm for most cookstoves), 𝑅𝑥𝑓 is the ideal-gas constant of air, 𝑇𝑥𝑓 is
the mean cross-flow temperature, and 𝜌𝑥𝑓 is the cross-flow density.
𝜌𝑥𝑓 =𝑃𝑥𝑓
𝑅𝑥𝑓𝑇𝑥𝑓 Eq. 6
The cross-flow mass flow-rate is calculated by taking the sum of the mass-flow rate of fuel, the
stoichiometric air mass-flow rate, and the mass-flow rate of excess-air. The mass-flow rate of fuel
is chosen to correspond to a burn-rate within the range of firepower’s the stove is designed for,
or that is expected during in-home use. Equation 7 can be used to convert firepower (kW) to
mass-flow (kg – fuel/s) using the lower heating value (LHV) of wood (19,314 kJ/kg for Douglas Fir
27), where 𝐹𝑃 is firepower and �̇�𝑓 is the mass-flow rate of fuel.
61
�̇�𝑓 =𝐹𝑃
𝐿𝐻𝑉 Eq. 7
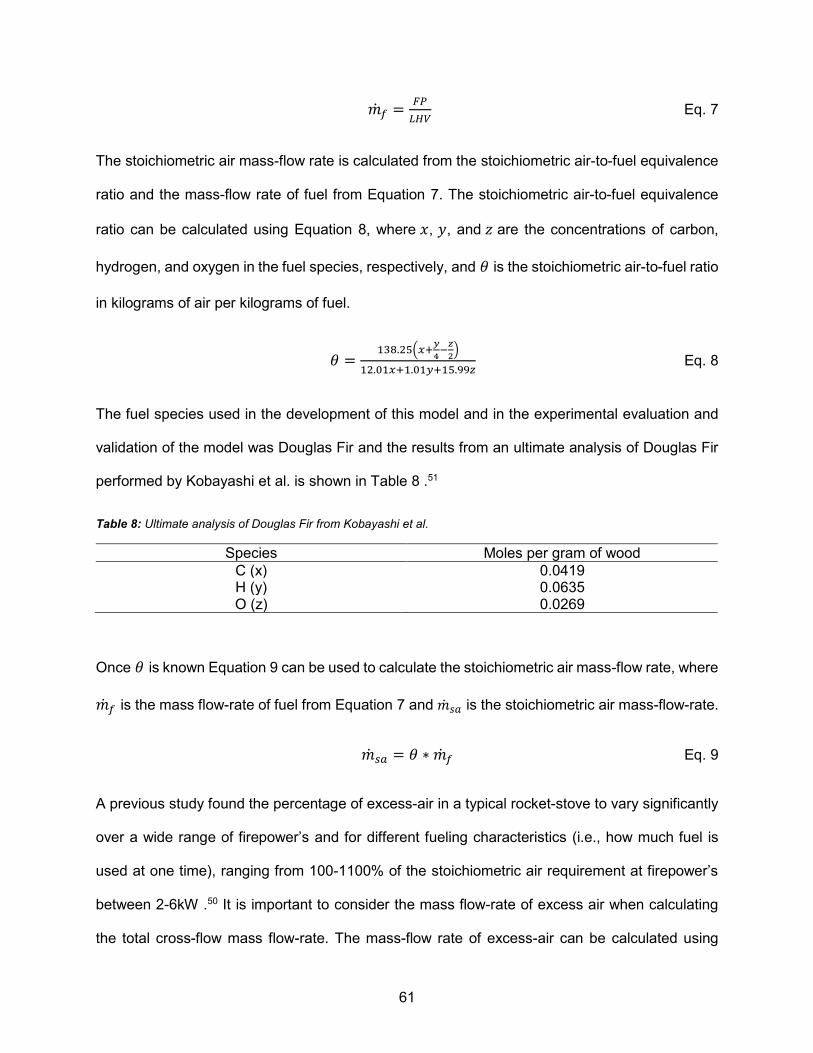
The stoichiometric air mass-flow rate is calculated from the stoichiometric air-to-fuel equivalence
ratio and the mass-flow rate of fuel from Equation 7. The stoichiometric air-to-fuel equivalence
ratio can be calculated using Equation 8, where 𝑥, 𝑦, and 𝑧 are the concentrations of carbon,
hydrogen, and oxygen in the fuel species, respectively, and 𝜃 is the stoichiometric air-to-fuel ratio
in kilograms of air per kilograms of fuel.
𝜃 =138.25(𝑥+
𝑦
4−
𝑧
2)
12.01𝑥+1.01𝑦+15.99𝑧 Eq. 8
The fuel species used in the development of this model and in the experimental evaluation and
validation of the model was Douglas Fir and the results from an ultimate analysis of Douglas Fir
performed by Kobayashi et al. is shown in Table 8 .51
Table 8: Ultimate analysis of Douglas Fir from Kobayashi et al.
Species Moles per gram of wood
C (x) 0.0419 H (y) 0.0635 O (z) 0.0269
Once 𝜃 is known Equation 9 can be used to calculate the stoichiometric air mass-flow rate, where
�̇�𝑓 is the mass flow-rate of fuel from Equation 7 and �̇�𝑠𝑎 is the stoichiometric air mass-flow-rate.
�̇�𝑠𝑎 = 𝜃 ∗ �̇�𝑓 Eq. 9
A previous study found the percentage of excess-air in a typical rocket-stove to vary significantly
over a wide range of firepower’s and for different fueling characteristics (i.e., how much fuel is
used at one time), ranging from 100-1100% of the stoichiometric air requirement at firepower’s
between 2-6kW .50 It is important to consider the mass flow-rate of excess air when calculating
the total cross-flow mass flow-rate. The mass-flow rate of excess-air can be calculated using
62
Equation 10, where (𝜑 − 1) is excess-air, �̇�𝑠𝑎 is the stochiometric air mass-flow rate from
Equation 9, and �̇�𝑒𝑎 is the mass flow-rate of excess-air.
�̇�𝑒𝑎 = (𝜑 − 1) �̇�𝑠𝑎 Eq. 10
Finally, the total cross-flow mass-flow rate can be calculated by summing the mass flow-rate of
fuel, stoichiometric air mass flow-rate, and the mass flow-rate of excess-air, shown in Equation
11, where �̇�𝑥𝑓 is the cross-flow mass flow-rate.
�̇�𝑥𝑓 = �̇�𝑓 + �̇�𝑠𝑎 + �̇�𝑒𝑎 Eq. 11
Using the cross-flow cross-sectional area calculated in Equation 5, the density calculated in
Equation 6, and the total mass flow-rate calculated in Equation 11 the cross-flow velocity can be
calculated using Equation 12, where 𝑉𝑥𝑓 is the cross-flow velocity.
𝑉𝑥𝑓 =�̇�𝑥𝑓
𝜌𝑥𝑓𝐴𝑥𝑓 Eq. 12
With the calculation of cross-flow velocity the cross-flow characterization parameters required by
the model are fully defined. It should be emphasized that any change in firepower, 𝐹𝑃, and fueling
characteristics will likely change the amount of excess-air present, (𝜑 − 1), and the cross-flow
temperature, 𝑇𝑥𝑓, which will impact the cross-flow characteristics changing the models optimum
jet configurations predictions, so care should be taken in determining appropriate values of
excess-air and cross-flow temperature if using the model to calculate optimum jet configurations
at different firepower’s and/or for different fueling characteristics.
2.3 Jet Parameters
The analytical model requires the calculation of a few key jet parameters involved in the
optimization of cross-flow mixedness using jet penetration length and jet-to-cross flow
momentum-flux ratio as optimization parameters. These parameters are also required in
63
calculating the characteristic system impedance needed to evaluate if jet configurations satisfy
the general fan design parameters (𝑸, ∆𝑃𝑚𝑎𝑥) and/or if user-defined fans can be used to drive
secondary air injection systems that use the optimum jet configurations the model predicts.
The number of jets, 𝒏𝑗, is an independent variable defined by the user and is a vector spanning
the range between the user-defined design parameters 𝑛𝑚𝑖𝑛 and 𝑛𝑚𝑎𝑥. The total jet flow-rate, or
total system volumetric flow-rate, 𝑸, is also a user-defined parameter representing a vector of
values spanning the range between the user-defined design parameters 𝑄𝑚𝑖𝑛 and 𝑄𝑚𝑎𝑥.
The jet injection preheat temperature, 𝑇𝑗, and initial pressure, or plenum (i.e., duct) pressure, 𝑃𝑗,
are needed to calculate the initial jet density, 𝜌𝑗, and can either be measured experimentally or
estimated, but in most cases setting 𝑇𝑗 = 300𝐾 and 𝑃𝑗 = 1 𝑎𝑡𝑚 is sufficient. With 𝑇𝑗 and 𝑃𝑗
defined the initial jet density can be calculated using Equation 13, where 𝑅𝑗 is the ideal-gas
constant of air.
𝜌𝑗 =𝑃𝑗
𝑅𝑗𝑇𝑗 Eq. 13
Using the initial jet density, the total jet mass flow-rate, �̇�𝑗, can be calculated for all values of 𝑸
using Equation 14.
�̇�𝑗 = 𝜌𝑗 ∗ 𝑸 Eq. 14
Since only circular air jets are considered in the model, the area of a single jet, 𝑎𝑗 , can be
calculated using Equation 15, where 𝑑𝑗 is jet diameter.
𝑎𝑗 =𝜋
4𝑑𝑗
2 Eq. 15
64
The total jet area, 𝐴𝑗 , or the sum of the area of all jets for all values of 𝒏𝑗, can be calculated using
Equation 16.
𝑨𝑗 = 𝒏𝑗 ∗ 𝑎𝑗 Eq. 16
Finally, jet velocity, 𝑉𝑗, can be calculated using Equation 17, assuming 𝑸 is split evenly between
all jets.
𝑽𝑗 =𝑸
𝑨𝑗=
�̇�𝑗
𝜌𝑗𝑨𝑗 Eq. 17
Jet diameter, 𝑑𝑗 , is dependent on the cross-flow mixedness optimization parameters, so the
calculation of this remaining jet parameter is discussed in the next section.
2.4 Cross-Flow Mixedness Optimization Parameters
A previous study showed that maximum radial jet penetration length, 𝑌𝑚𝑎𝑥, or the maximum radial
distance a jet penetrates into the cross-flow, and the dimensionless parameter of jet-to-cross flow
momentum flux ratio, 𝐽, were the dominant jet characteristics influencing cross-flow mixedness in
fully-developed turbulent flow through cylindrical combustion chambers with radial overfire air
injection .52 This study and other previous studies of jet in cross-flow mixing characteristics have
suggested that jets that have trajectories that approach the center-line of the cross-flow,
corresponding to a maximum jet penetration length within the range of 𝒀𝑚𝑎𝑥 =
[0.4𝐷𝑥𝑓 … 0.5𝐷𝑥𝑓], require a minimum amount of jet injection energy to achieve optimum cross-
flow mixedness, or temperature uniformity, at a minimum downstream distance .49,52 A previous
study has also shown that, in general, as you increase the number of jets, mixing characteristics
tend to be more uniform due to an increase in localized mixing regions, which can provide
additional advantages in increasing the quality of cross-flow mixedness .52
65
These cross-flow mixedness design parameters are applied to the optimization of the mixedness
of reacting laminar/transitional flow through the riser of a side-feed wood-burning cookstove for
the purposes of reducing flame-height and PM2.5 emissions. Since the cross-flow mixedness
design parameters were originally developed and validated only for fully-developed turbulent
cross-flows, the validity of the cross-flow mixedness design parameters (𝑌𝑚𝑎𝑥 , 𝐽), applied to
optimizing secondary air injection for laminar/transitional flow in the riser of wood-burning
cookstoves to reduce flame-height and PM2.5 emissions were investigated; the results to this
investigation are detailed in Chapter 4.
J. Vanormelingen and E. Van Den Bulck found that jet configurations that require the least amount
of jet injection energy, 𝐸𝑗 (representative of the operational cost of a jet configuration, defined by
Equation 18), to provide an optimum increase in cross-flow mixedness correspond to jet
configurations with a predicted maximum jet penetration length of 𝒀𝑚𝑎𝑥 = [0.4𝐷𝑥𝑓 … 0.5𝐷𝑥𝑓],
where 𝑌𝑚𝑎𝑥 is calculated using Sridhara’s equation for calculating the maximum penetration
length of multiple circular jets in a cylindrical cross-flow, shown in Equation 19 .52
𝐸𝑗 =𝜌𝑗𝑉𝑗
2
2 Eq. 18
𝑌𝑚𝑎𝑥
𝐷𝑥𝑓= 1.25√𝐽
�̇�𝑥𝑓
�̇�𝑥𝑓+�̇�𝑗 Eq. 19
They discovered this optimization parameter by comparing cross-flow mixedness, which they
defined as the mixedness variable 𝑈𝑠, for a constant total jet mass flow-rate, but different values
of the momentum flux-ratio (defined by Equation 20), at a cross-section of the cross-flow one
radius downstream of the plane where the jets are initially injected into the cross-flow. What they
found is that cross-flow mixedness increases to an optimum point that corresponds to 𝒀𝑚𝑎𝑥 =
[0.4𝐷𝑥𝑓 … 0.5𝐷𝑥𝑓], once 𝑌𝑚𝑎𝑥 > 0.5𝐷𝑥𝑓, or when the jets penetrate past the mid-line of the
cross-flow (i.e., over penetrate), cross-flow mixedness becomes worse, with mixedness only
66
increasing once again if the momentum-flux ratio is increased by a large amount, resulting in
higher jet injection energies, corresponding to a much higher operational cost than the original
optimum cross-flow mixedness point defined by jets that satisfy 𝒀𝑚𝑎𝑥 = [0.4𝐷𝑥𝑓 … 0.5𝐷𝑥𝑓].
This behavior is demonstrated in J. Vanormelingen and E. Van Den Bulck’s plot of the results
from this investigation shown in Figure 11.
𝐽 =𝜌𝑗𝑉𝑗
2
𝜌𝑥𝑓𝑉𝑥𝑓2 Eq. 20
Figure 11: Momentum flux ratio vs. cross-flow mixedness, Us, at a plane one radius downstream from the jet injection plane, taken from “Optimization of Overfire Air Systems of Cylindrical Combustion Chambers”. 52 As Us decreases cross-flow mixedness increases. The triangular data point represents the optimum point.
Using Equation 19, Equation 21 defining jet diameter, 𝑑𝑗, and 𝒀𝑚𝑎𝑥 = [0.4𝐷𝑥𝑓 … 0.5𝐷𝑥𝑓] the
momentum flux ratio corresponding to the optimum cross-flow mixedness point, found by
Vanormelingen and E. Van Den Bulck, can be predicted for any value of 𝒏𝑗 and �̇�𝑗~𝑸 using
Equation 22, where 𝐾 is the ratio of total jet mass flow-rate and total cross-flow mass flow-rate.
67
𝒅𝑗 = [𝑲𝐷𝑥𝑓
2
𝒏𝑗√
𝜌𝑥𝑓
𝑱𝜌𝑗]
1 2⁄
, 𝑲 =�̇�𝑗
�̇�𝑥𝑓 Eq. 21
𝑱 = [0.8𝒀𝑚𝑎𝑥
𝐷𝑥𝑓√𝒏𝑗 (
𝜌𝑗
𝜌𝑥𝑓)
14⁄
1+𝑲
√𝑲]
4
Eq. 22
This provides the basis for the jet optimization calculations used by the model. Once the optimum
𝐽 is known for all 𝒏𝑗 and 𝑸 values specified by the user, the corresponding jet velocities, 𝑽𝑗, and
jet diameters, 𝒅𝑗 , can be calculated using Equation 23 and Equation 24, respectively.
𝑽𝑗 = √𝜌𝑥𝑓𝑱𝑉𝑥𝑓
2
𝜌𝑗 Eq. 23
𝒅𝑗 = √4𝑸
𝜋𝒏𝑗𝑽𝑗 Eq. 24
With jet velocity and jet diameter defined for the corresponding optimum momentum flux values
for all 𝒏𝑗 and 𝑸 values specified by the user, all the necessary optimum jet configuration
parameters are defined, and the model can proceed to determine the jet configurations that satisfy
the remaining user-defined design parameters and system characteristics.
2.5 System Impedance
System impedance, or resistance, when applied to air injection systems is the characteristic
relationship between the volumetric flow through a system and the pressure response, or total
pressure-drop between a systems inlet and outlet. In general, as system flow-rate increases so
Figure 12: Air-injection system diagram.
68
does the pressure-drop between the system inlet and outlet, but the degree to which the pressure-
drop increases for a given increase in flow-rate depends on the number and size of air jets used
in an air injection system. For the purposes of secondary air injection optimization in an unvented
side-feed wood-burning cookstove, the system can be described as a constant area duct, with
the inlet being a flow-source (i.e., fan/blower/compressed-air source), and the outlet being an
orifice plate, i.e., a plate with a matrix of equally-spaced and equal-sized holes/jets, illustrated in
Figure 12.
If the flow through this system is assumed to be steady-flow, laminar, and incompressible, and if
it is assumed that the orifice plate is the only component in the system restricting the system
cross-sectional area of the flow path and all the flow produced by the flow-source passes through
the holes in the orifice plate, the Bernoulli equation (Equation 25) can be used to estimate the
total pressure-drop through the system, or across the orifice-plate, for a given flow-rate. The
system pressure-drop, ∆𝑝𝑠𝑡𝑎𝑡𝑖𝑐 , represented by the difference in static-pressure between the
flow-source outlet and duct inlet interface (point 1 in Figure 12) and the outlet side of the orifice
plate (point 2 in Figure 12) is mainly dependent on the system volumetric flow-rate, 𝑄, fluid-density,
𝜌𝑗, the inlet area (total area of orifice plate), 𝐴1, the outlet area (total area of all jets), 𝐴𝑗 or 𝐴2,
the outlet-to-inlet area ratio, 𝛽 =𝐴2
𝐴1, an orifice discharge-coefficient, 𝐶𝑑, and a head-loss term,
∆𝐻𝐿.
∆𝑝𝑠𝑡𝑎𝑡𝑖𝑐 =1
2𝑄2𝜌𝑗(1 − 𝛽4) (
1
𝐶𝑑𝐴2)
2
+ ∆𝐻𝐿 Eq. 25
For jet systems that use cylindrical risers and circular jets, Equation 25 can be rewritten as
Equation 26, where 𝐷𝑥𝑓 is the diameter of the duct, 𝑑𝑗 is the jet diameter, and 𝑛𝑗 is the number of
jets.
69
∆𝑝𝑠𝑡𝑎𝑡𝑖𝑐 =1
2𝑄2𝜌𝑗 (1 − (
√𝑛𝑗𝑑𝑗
𝐷𝑥𝑓)
8
) (4
𝑛𝜋𝐶𝑑𝑑𝑗2)
2
+ ∆𝐻𝐿 Eq. 26
Using Equation 26 the system impedance curve, or the relationship between system flow-rate
and static-pressure for circular duct and jet systems can be estimated for any jet configuration if
an appropriate discharge-coefficient and head-loss term is used and if the system flow is to a
good approximation steady, laminar, and incompressible. The analytical model uses Equation 26
to calculate the system static-pressure, or pressure drop across an orifice plate having jet
configurations equal to the jet configurations calculated by the model.
If the design of the air injection system is expected to have significant head-loss and/or has other
major flow restrictions other than the orifice plate, the cumulative effects of these factors should
be well understood and compensated for appropriately when using Equation 26 to calculate the
system pressure-drop in order to obtain the most accurate prediction of system impedance for jet
optimization purposes.
System impedance can also be measured experimentally using a static-pressure tap placed near
the inlet of a system (point 1 in Figure 12) and differential pressure gauge. The system flow-rate
is then varied and the corresponding static-pressure measurement is recorded to produce a
system impedance curve. This method was used during the jet momentum-flux ratio investigation
detailed in Chapter 4 to experimentally validate Equation 26 and its application to secondary air
injection system design.
2.6 Fan Performance Curve and System Operating Point
In order to get the most functionality out of the analytical model, it is important to understand the
performance characteristics of the fans being considered to deliver flow, or that fall within a
projects fan size, power, and cost requirements. The model uses user-defined fan performance
curves to determine what optimum jet configurations can be driven by certain fans being
70
considered. Without the input of user-defined fan performance curves the model outputs all
optimum jet configurations that fall within the general fan design parameters defined by the user;
𝑸, ∆𝑃𝑚𝑎𝑥. In either case, it is important to understand what a fan performance curve is because
it is one of the most commonly used metrics to report and compare fan/blower performance.
A fan performance curve is the characteristic relationship between fan static, dynamic, and/or
total pressure and volumetric flow-rate for a set fan input voltage (if the fan is driven by an electric
motor) or a set RPM. For electric motor driven fans, performance curves corresponding to either
the maximum rated input-voltage or nominal input-voltage are usually provided by the fan
manufacturer to help guide buyers in determining if a fan will work for their specific application,
meeting their pressure and flow requirements. These performance curves are determined using
a fan testing apparatus, built in accordance to ANSI/AMCA Standard 210-99, that measures fan
pressure and volumetric flow-rate for different system pressures, or impedances, varied by an
adjustable damper or venturi of known characteristics. A fan performance curve, typical of a small
electronic computer fan, is shown in Figure 13 illustrating the relationship between fan static-
pressure and volumetric flow-rate.
In general, as system pressure increases the volumetric flow-rate that the fan can deliver
decreases until the system pressure reaches the fans characteristic stall-pressure, or the
pressure where the fan is no longer able to deliver flow. The maximum flow-rate of a fan, often
listed as the rated flow-rate, corresponds to the open-flow, or zero-pressure condition. The fan
performance curve changes if the fan input-voltage is changed. As fan voltage, or RPM decreases
the fan performance curve generally shifts downwards and becomes flatter, with a decreased stall
pressure and maximum flow-rate.
71
Figure 13: Fan performance curve for a typical 12V computer fan.
The intersection of the system impedance curve and the fan performance curve determines the
system operating point, or the maximum volumetric flow-rate the fan can deliver given a systems
characteristic impedance behavior. The model does not calculate full system impedance curves
because the operating points (𝑄, ∆𝑝𝑠𝑡𝑎𝑡𝑖𝑐), corresponding to the optimum jet configurations within
the user-defined design parameters and system characteristics, are already defined. With the
operating points defined, the model determines if these points correspond to a point on any of the
user-defined fan performance curves by calculating if these points satisfy the equations of the
polynomial approximations of the fan performance curves. If this condition is satisfied for a
particular fan design, then the fan is theoretically capable of delivering the correct volumetric flow-
rate corresponding to the operating point (𝑄, ∆𝑝𝑠𝑡𝑎𝑡𝑖𝑐) of the optimum jet configuration, meaning it
can be used to drive the system. An example of how the operating point for a given fan-system is
defined is shown in Figure 14.
72
Figure 14: Example definition of the system operating point for a fan-driven system.
73
CHAPTER 3: COOKSTOVE PERFORMANCE TESTING SYSTEM AND TESTING METHODOLOGIES
This chapter presents the cookstove performance testing system and testing methodologies used
in determining the cookstove performance metrics and behaviors presented as part of the
investigations of this thesis. A general overview of the UWCCL’s cookstove performance testing
system is presented and the testing methodologies used in determining ISO/IWA performance
metrics, PM2.5 emissions behavior, and cookstove excess-air behavior is detailed.
3.1 Cookstove Performance Testing System
The UWCCL’s cookstove performance testing system allows for quantitative performance and
emissions testing of biomass cookstoves to calculate the ISO/IWA cookstove performance
comparison metrics (detailed in Chapter 1 Section 1.2), real-time cookstove PM2.5 emissions, and
excess-air behavior. The performance testing system uses a fume-hood, digital scale (ABK 70a,
Adam Equipment, Danbury, CT), NDIR CO analyzer (VIA-510, Horiba, Kyoto, Japan), NDIR CO2
monitor (TEOM 1405, Thermo Fisher Scientific, MA, USA), and an array of thermocouples, digital
differential pressure gauges, flow-meters, and vacuum pumps to provide real-time measurement
of cookstove emissions and thermal characteristics necessary for cookstove performance
analysis. A schematic of the cookstove emissions and performance testing system is shown in
Figure 15. The UWCCL’s cookstove performance testing system was originally developed by Ben
Sullivan, UW MSME 2016, and the reader is directed to Sullivan’s master’s thesis, Development
of Cookstove Emissions and Performance Testing Suite with Time-resolved Particulate Matter
Analysis and Excess Air Estimation 50, for detailed information about the performance testing
system. The UWCCL’s performance testing system meets the latest cookstove performance
testing standards detailed in ISO 19867-1 (2018) .28,29
74
Figure 15: Cookstove emissions and performance testing system. Stove emissions are captured by the hood and drawn through the ducting. Two sampling lines are installed: one for gas (CO/CO2) analysis and one for particulate matter analysis. Diagram taken from “Development of Cookstove Emissions and Performance Testing Suite with Time-resolved Particulate Matter Analysis and Excess Air Estimation”. 50
3.2 Cookstove Performance Testing Methodologies
Three different cookstove performance testing methodologies were used to evaluate the
cookstove performance metrics and behaviors of the cookstove designs and secondary air
injection systems investigated and developed as part of this thesis. The Water-Boil-Test (WBT)
was used to evaluate thermal-efficiency and emissions performance in accordance with the
ISO/IWA cookstove performance testing standards and to determine all ISO/IWA cookstove
performance comparison metrics (detailed in Chapter 1 Section 1.2). The UWCCL’s Fire-Power-
Sweep-Test (FPS) was used to characterize and compare the PM2.5 emissions behavior of the
cookstove designs presented in previous and subsequent chapters. In addition, the UWCCL’s
Excess-Air testing methodology was used to analyze cookstove total-flow characteristics. These
testing methodologies were also used to experimentally evaluate and validate the analytical
model presented in Chapter 2 and investigate the impacts on cookstove performance of
75
secondary air injection systems with different jet-to-cross flow momentum flux ratio’s, presented
in Chapter 4.
3.2.1 Water-Boil-Test (WBT)
The Water-Boil-Test (WBT) is the most commonly used cookstove comparison test, developed
by Engineers in Technical and Humanitarian Opportunities of Service (ETHOS), the Partnership
for Clean Indoor Air (PCIA), and The Global Alliance for Clean Cookstoves. It is a laboratory
testing procedure, meant to produce controlled and repeatable results for cookstove evaluation.
The test is split into three distinct sections: cold-start, hot-start, and simmer. Hot-start is
considered optional. In cold-start, the cookstove starts at room temperature, and 5 liters of water
in a typical pot (defined as typical for the region of interest) is heated to the boiling temperature.
All stove emissions are captured by an emissions hood, from which CO, CO2, and PM2.5 are
extracted for analysis. The mass of the wood required to bring the water to a boil is also recorded.
The cold-start section ends once the water reaches the local boiling temperature. The boiling
water is then poured out and a fresh 5 liters of water is added to the pot for the hot-start (if hot-
start is desired). The process is repeated with all the same metrics recorded. Once the water
reaches the boiling temperature after the hot/cold start, the water is kept near the boiling
temperature (± 5°C) for 45 minutes during the simmer phase. Again, the emissions are
characterized, and the mass of wood required is recorded. The ISO/IWA tiers detailed in Chapter
1 Section 1.2 are then calculated for universal comparison. The UWCCL calculates ISO/IWA
performance tiers by linear interpolating between each interval bounded by adjacent tiers. This
provides the overall tier ranking for each performance metric and allows for a more detailed
comparison of the performance of different designs or operating conditions within the
corresponding tier. For additional details the reader is directed to The Water Boiling Test (Version
4.2.3): Cookstove Emissions and Efficiency in a Controlled Laboratory Setting .27
76
Most of the experimental investigations and cookstove performance evaluations presented in this
thesis use a modified WBT, where only the cold-start section of the WBT is performed, and the
simmer section is eliminated. This test is referred to as a rapid-WBT or high-power WBT and only
evaluates cookstove performance during the high-power, or boil phase of the WBT. All the WBT
test’s performed as part of the work presented here were performed using an aluminum 5L flat-
bottomed pot typical of what is used in rural-regions of Kenya, detailed in Figure 16.
Figure 16: Aluminum 5L flat-bottomed pot used for WBT performance testing.
3.2.2 Firepower-Sweep-Test (FPS)
The Firepower-Sweep-Test (FPS) was originally developed by the UWCCL to rapidly evaluate
cookstove PM2.5 emissions behavior, or the characteristic relationship between cookstove PM2.5
emission rate and fuel burn-rate (i.e., firepower), by operating the stove at incremental fuel burn-
rates throughout a single test. The cookstove is operated at each distinct fuel burn-rate for
approximately 15-30 min while CO2 and PM2.5 emissions are measured and logged in real-time.
Assuming the combustion efficiency of the cookstove is greater than 90% (most wood-burning
cookstoves have combustion efficiencies 95% or greater) the CO2 emissions data can be used to
calculate instantaneous firepower using Equation 27, where 𝑌𝐶𝑂2 is the normalized concentration
77
of CO2 (minus ambient) in ppm, 𝑄𝐷 is the sample duct flow rate in moles per second, 𝑀𝐶 is the
molar mass of carbon in grams per mole, 𝑋𝐶 is the carbon ratio of the wood species on a wet
basis, 𝐿𝐻𝑉 is the lower heating value of the wood species in kilojoules per gram, and 𝐹𝑃 is
firepower in kilowatts.
𝐹𝑃 =𝑌𝐶𝑂2∗𝑄𝐷∗𝑀𝐶∗𝐿𝐻𝑉
106𝑋𝐶 Eq. 27
In practice Equation 27 is used to calculate the average firepower for each interval of 20 data
points collected. The UWCCL’s testing system has a sampling rate of 0.5Hz, so this corresponds
to an average firepower data point for every 40 seconds of run time. An example of the CO2 data
and corresponding instantaneous firepower data, calculated from Equation 27, from a typical FPS
test is shown in Figure 17.
Figure 17: Example FPS data showing normalized CO2 concentration and the corresponding instantaneous firepower
data calculated from Equation 27.
78
Figure 18: Example FPS data showing total-mass of PM2.5 and the corresponding instantaneous firepower data calculated from Equation 27.
Once the average firepower is calculated for each 40 second interval of the test, the
corresponding PM2.5 emission rate (mg/min) is calculated from the PM2.5 total-mass produced
data, seen in Figure 18, measured by the PM2.5 continuous ambient particulate monitor (TEOM
1405), by calculating the total-mass of PM2.5 produced during every 40 second interval of a FPS.
The average firepower data and the corresponding PM2.5 emission rate data is then sorted by
firepower and grouped into bins using an interval of 0.25kW. A statistical analysis is then
performed for each bin producing the necessary statistical metrics to characterize the PM2.5
emission behavior throughout the range of firepower’s tested. The resulting data is then compiled
with any additional FPS data and plotted, resulting in the PM2.5 emission rate vs. stove firepower
curve illustrated in Figure 19.
79
Figure 19: Example PM2.5 emission rate vs. stove firepower curve calculated from FPS data for the KuniokoaTM. Note:
the shaded region represents a 90% CI.
3.2.3 Excess-Air
The Excess-Air test, originally developed by Ben Sullivan and detailed in his master’s thesis 50, is
a method for measuring the excess air, or air in excess of the stoichiometric requirement for
combustion flowing through a cookstove. Understanding excess air is important for cookstove
design, as it is critical to stove performance characteristics including mixing, PM2.5 production, as
well as heat transfer and thermal efficiency. The Excess-Air test is similar to a FPS test in that the
stove is operated at incremental fuel burn-rates throughout a single test, but instead of
characterizing PM2.5 emissions behavior for each distinct fuel burn-rate the amount of excess-air
present is calculated for each burn-rate, effectively evaluating the flow-characteristics of a stove
throughout a wide range of burn-rates, which can be used to guide stove design improvements.
During the Excess-Air test, CO2 emissions are sampled directly from the outlet of the stove, or
the gap between the cooking implement and the cone-deck of the stove using a four-pronged
sampling rake made from 3/16” OD stainless steel tubing and fittings shown in Figure 20. The
80
sampling rake is connected to ¼” OD PVC tubing and converges into a single sample line.
Sampling from this location ensures that only combustion gases, or gases flowing through the
combustion-chamber and riser of the stove are measured. Assuming a combustion efficiency
greater than 90% and that the sample inlets draw equal flow the amount of excess-air (𝜑 − 1)
can be calculated using Equation 28 where 𝑦𝑐𝑜2 is the concentration of CO2 in the sample gas in
ppm and 𝑥, 𝑦, 𝑧 are the moles of carbon, hydrogen, and oxygen respectively per gram of wood
determined from an ultimate analysis of the wood fuel species.
(𝜑 − 1) =(
𝑥∗106
𝑦𝑐𝑜2)−𝑥+
𝑦
2
4.76(𝑥+𝑦
4−
𝑧
2) Eq. 28
Using Equation 28, excess-air is calculated for timespan intervals of relatively constant CO2 output
and then compared to corresponding fuel burn-rate data for the same timespan calculated using
real-time stove mass measurements and/or pre-weighed fuel batch data. The excess-air data
presented as a part of the investigations detailed in Chapter 4 calculated excess-air by pre-
weighing three incrementally larger batches of wood that were burned at constant, but
incrementally higher burn-rates. The average excess-air was calculated for each batch of wood
and the corresponding burn-rate was calculated by dividing the total weight of the batch of wood
by the total time it took to burn, an example of the data from these tests in shown in Figure 21.
Using Equation 29, excess-air can be converted into the molar flow-rate of air, �̇�𝑎𝑖𝑟, through the
stove where �̇�𝑤𝑜𝑜𝑑 is fuel burn-rate, or mass-flow rate, and 𝜑 is the air-to-fuel equivalence ratio.
�̇�𝑎𝑖𝑟 = 4.76 ∗ �̇�𝑤𝑜𝑜𝑑 ∗ 𝜑 (𝑥 +𝑦
4−
𝑧
2) Eq. 29
81
Figure 20: Illustration of the excess-air sampling rake and sample location.
Figure 21: Example excess-air CO2 concentration data for a test using three incrementally larger fuel batches burned at a constant burn-rate.
82
CHAPTER 4: ANALYTICAL MODEL EXPERIMENTAL EVALUATION AND VALIDATION
This chapter discusses the experimental evaluation of the analytical model/design tool presented
in Chapter 2. A three-dimensional computational fluid dynamic (CFD) model of the KuniokoaTM
with riser secondary air injection and a physical KuniokoaTM prototype with modular riser
secondary air injection were built and configured to investigate the application of maximum jet
penetration length and jet-to-cross flow momentum-flux ratio to the optimization and design of
secondary air injection systems for side-feed wood-burning cookstoves.
The analytical model was used to predict an optimum secondary air jet configuration using the
design parameters and system characteristics that guided the development of the Kuniokoa-
TurboTM, detailed in Chapter 5. Three additional non-optimum jet configurations were selected to
evaluate the impact of maximum jet penetration and jet-to-cross flow momentum-flux ratio on
cookstove riser cross-flow mixing characteristics, flame-height, primary-to-secondary air flow ratio,
cookstove emissions, and thermal-efficiency. In addition, the physical air injection systems built
for the modular KuniokoaTM prototype were used to evaluate the analytical model’s method of
estimating system impedance.
The main objective of this investigation was to develop a comprehensive understanding of how
maximum jet penetration and jet-to-cross flow momentum-flux ratio impact cookstove
performance, not just cross-flow mixedness, providing a more complete picture of how these jet
optimizations parameters influence cookstove combustion, flow, and thermodynamics.
83
4.1 Jet Configurations
Using the analytical model and the design parameters and system characteristics corresponding
to the Kuniokoa-TurboTM project, listed in Table 9 and detailed in Chapter 5, a list of optimum jet
configurations (i.e., configurations satisfying 𝒀𝑚𝑎𝑥 = [0.4𝐷𝑥𝑓 … 0.5𝐷𝑥𝑓]) is predicted for the
KuniokoaTM, shown in Table 10. The optimum configuration corresponding to a system flow-rate
of 2.8cfm was selected for evaluation, shown in bold in Table 10. This system flow-rate was
selected due to its compatibility with the fan and air injection system used in the Kuniokoa-TurboTM
and so to provide a convenient comparison of the results presented in this chapter to the
performance of the Kuniokoa-TurboTM, detailed in Chapter 5. The model was then used to select
three non-optimum jet configurations, one configuration having what the model predicted as
under-penetrating jets (𝑌𝑚𝑎𝑥 < 0.4𝐷𝑥𝑓) and two configurations with over-penetrating jets (𝑌𝑚𝑎𝑥 >
0.5𝐷𝑥𝑓). These non-optimum configurations were used to evaluate the impact of jet penetration
and jet-to-cross flow momentum-flux ratio on cookstove performance compared to the baseline
natural-draft, or no secondary air injection case, and if the model predicted optimum configuration
is in fact the optimal case when considering all aspects of cookstove performance.
System flow-rate (i.e., mass-flow rate), the number of jets, and jet location remained constant for
all the selected configurations so to isolate the impacts of jet penetration and jet-to-cross flow
momentum-flux ratio on cross-flow mixedness and cookstove performance. The system
volumetric flow-rate was 2.8cfm, corresponding to a mass-flow rate of 0.0016 kg/s of air
(assuming the secondary air preheat temperature remains constant). A single plane of 12 radially
spaced circular air-jets was used, positioned approximately 90mm below the outlet, or top of the
riser. The riser measured 100mm in total length (top of the combustion-chamber to riser outlet)
and 100mm in diameter, the jet injection plane was positioned 10mm downstream of the riser
inlet. All the selected jet configurations are detailed in Table 11.
84
Table 9: Secondary air jet optimization analytical model user-defined design parameters and system characteristics for the Kuniokoa-TurboTM project, detailed in Chapter 5.
Kuniokoa-TurboTM design parameters and system characteristics
Number of jets 𝒏𝑗 = [6 … 12]
Jet diameter (mm) 𝑫𝑗 = [2 … 10]
System volumetric flow-rate (i.e., fan flow-rate) (cfm)
𝑸 = [1 … 3]
System pressure-drop (i.e., maximum fan static-pressure) (in-H2O)
∆𝑃𝑚𝑎𝑥 = 0.6
System head-loss ∆𝐻𝐿 = 0
Jet Discharge Coefficient 𝐶𝑑 = 0.6
Cross-flow diameter (mm) 𝐷𝑥𝑓 = 100
Cross-flow temperature (K) 𝑇𝑥𝑓 = 900
Cross-flow pressure (atm) 𝑃𝑥𝑓 = 1
Secondary air pre-heat temperature (K) 𝑇𝑗 = 300
Secondary air plenum (i.e., duct) pressure (atm)
𝑃𝑗 = 1
Stove firepower (kW) 𝐹𝑃 = 4
Fuel species concentrations (i.e., ultimate analysis) (mol/g)
𝑆𝑒𝑒 𝑇𝑎𝑏𝑙𝑒 8
Fuel lower heating value (kJ/g) 𝐿𝐻𝑉 = 19.314
Excess-air (𝜑 − 1) = 3
Table 10: Kuniokoa-TurboTM optimum jet configurations and corresponding jet characteristics calculated by the analytical model.
Kuniokoa-TurboTM Optimum Jet Configuration and Jet Characteristics
Table 11: Jet configurations used in the evaluation of the analytical model and the impacts of maximum jet penetration and momentum-flux ratio on cross-flow mixing characteristics and cookstove performance.
Jet Configurations Selected for Evaluation
Natural-Draft
Under-Penetrating
(12x8mm)
Optimum
(12x4mm)
Over-Penetrating
(12x3mm) (12x2mm)
𝑄 (cfm) 0 2.8 2.8 2.8 2.8
�̇� (kg/s) 0 0.0016 0.0016 0.0016 0.0016
𝐾 0 0.387 0.387 0.387 0.387
𝑛𝑗 0 12 12 12 12
𝑑𝑗 (mm) 0 8 4 3 2
𝑉𝑗 (m/s) 0 2.2 8.6 15.6 35
𝐽 0 8.4 130 427 2161
𝐸𝑗(J/m3) 0 2.8 45 143 725
∆𝑝𝑠𝑡𝑎𝑡𝑖𝑐 (in-H2O) 0 0.03 0.49 1.54 7.8
𝑌𝑚𝑎𝑥 𝐷𝑥𝑓⁄ 0 0.21 0.42 0.56 0.84
4.2 Experimental Apparatus
The analytical model and the impacts of maximum jet penetration and momentum-flux ratio on
riser cross-flow mixing characteristics, flame-behavior, primary-to-secondary air flow ratio,
emissions, and thermal-efficiency were evaluated using a combination of three-dimensional CFD
modeling of the KuniokoaTM with secondary air injection and laboratory experiments using a
physical KuniokoaTM prototype with a modular riser secondary air system. System flow-rate,
number of jets, and jet location remained constant and were consistent in both the CFD model
simulations and the physical prototype experiments. Additional details of both the CFD model and
the modular stove prototype can be found in subsequent chapter sections.
4.2.1 Three-Dimensional Computational Fluid Dynamic Model of the KuniokoaTM with Secondary Air Injection
A three-dimensional CFD model of the KuniokoaTM was built and configured by Anamol Pundle
(PhD candidate, University of Washington, Department of Mechanical Engineering) and Michael
Barbour (PhD, Intellectual Ventures Lab) to simulate steady-state combustion, flow, and
86
thermodynamics of the KuniokoaTM for each secondary air jet configuration selected for evaluation
and to compare to corresponding laboratory experimental results. The model was used to quantify
riser cross-flow mixedness through calculation of the fuel scalar uniformity index (Equation 30),
temperature uniformity index (Equation 31), average in-plane temperatures, and temperature and
velocity contours at various cross-sectional and vertical planes in the riser of the cookstove
domain. The model was also used to characterize flame-height behavior through the calculation
and visualization of the stoichiometric flame surface, air flow ratio of the primary and secondary
air inlets in the model domain, and the thermal-efficiency of the simulated system for each jet
configuration evaluated.
Figure 22: CFD model cookstove domain (geometry/flow-path).
The model domain includes the same geometry of the internal assembly of the KuniokoaTM
(combustion-chamber, riser, cone-deck, heat-shield assembly, etc.), the modular secondary air
system used in the experimental prototype, and a pot consistent with what was used in the
laboratory experiments. The domain consists of a combined fluid domain and wall, or sheet metal
87
domain, shown in Figure 22. The fuel, or wood is modeled as 2 – 2cm x 2cm cross-section sticks,
which act as the surface from which a wood volatile mixture is released into the system at a
specified burn-rate. A boundary condition is defined for the secondary air system inlet that allows
for the system flow-rate and/or pressure to be set accordingly.
The model includes turbulent-combustion interaction modeled by the standard Eddy Breakup
Model, which assumes that the reaction rate is controlled by turbulent mixing and not chemical
kinetics. A simple four-step global reaction mechanism is chosen, which is used to describe all
reactions through the combustion and post-combustion zone. The corresponding reaction
mechanism is shown in Table 12.
Table 12: Four step global mechanism taken from Glanville, P. “Reducing Particulate Emissions from a Wood-Fired
Hydronic Furnace”
Reaction Mechanism
𝐶𝑂 + 1
2𝑂2 → 𝐶𝑂2
𝐻2 + 1
2𝑂2 → 𝐻2𝑂
𝐶𝐻4 + 2𝑂2 → 𝐶𝑂2 + 2𝐻2𝑂
𝐶𝑂 + 𝐻2𝑂 ↔ 𝐶𝑂2 + 𝐻2
The wood volatiles are approximated as a mixture of CO, CO2, H2, H2O and CH4. This allows the
use of simplified global reaction mechanisms. The mass fractions of each species in the wood
volatile mixture are given in Table 13.
Table 13: Mass fractions of species in wood volatile mix, taken from Glanville, P. “Reducing Particulate Emissions from a Wood-Fired Hydronic Furnace”
CO CO2 H2 H2O CH4
0.383 0.237 0.006 0.312 0.062
The Reynolds-averaged conservation equations of mass, momentum, energy, and species
transport are solved. The model also includes turbulence modeled by the Realizable 𝑘 − 𝜀 model,
88
and realistic boundary conditions, including radiation from the gas and the walls (i.e., sheet metal
assembly components), as well as heat loss from the sides of the cookstove and heat delivered
to the pot. To simulate the presence of soot, the absorption coefficient of the gas is adjusted,
which is assumed to be constant throughout the domain. The walls of the domain are treated as
made of metal sheet made of stainless steel of constant density. Heat transfer between the fluid
domain and domain walls/boundaries is also modeled.
The fuel scalar uniformity index, 𝑈𝐹𝑆, is calculated from Equation 30, which is used to represent
the mixedness of fuel/combustion-products and air within a specific cross-sectional plane in the
riser. Equation 30 calculates 𝑈𝐹𝑆 by dividing the root-mean-square of the difference between the
concentration of all wood volatile and combustion product species, 𝐹𝑆, in each cell in a plane and
the total planar average of 𝐹𝑆 by the total planar average of 𝐹𝑆. A decrease in 𝑈𝐹𝑆 represents an
increase in fuel/combustion-products and air mixedness, with perfectly mixed flow corresponding
to a 𝑈𝐹𝑆 of zero.
𝑈𝐹𝑆 =𝑅𝑀𝑆(𝐹𝑆−𝑎𝑣𝑔(𝐹𝑆))
𝑎𝑣𝑔(𝐹𝑆) Eq. 30
The temperature uniformity index, 𝑈𝑇, was calculated in the same fashion as 𝑈𝐹𝑆, but used the
average cell temperature in each plane and the total planar temperature average to calculate 𝑈𝑇.
𝑈𝑇 =𝑅𝑀𝑆(𝑇−𝑎𝑣𝑔(𝑇))
𝑎𝑣𝑔(𝑇) Eq. 31
All CFD simulations and data post-processing were performed by A. Pundle and M. Barbour.
4.2.2 KuniokoaTM with Modular Secondary Air Injection
A stock natural-draft KuniokoaTM was modified to accept a modular secondary air jet system that
allowed for the evaluation of different jet configurations and jet characteristics but kept jet location
and position within the cookstove assembly constant and consistent with what was modeled in
89
the CFD simulations. Three of the modular jet systems were built corresponding to the 12 x 8mm,
12 x 4mm, and 12 x 2mm jet configurations selected for analysis (the 12 x 3mm configuration was
not evaluated experimentally). The modular systems were made from 22 gauge 304 stainless-
steel and all seems were fully welded, so to provide a completely sealed-system, leaving only the
jets and system inlet as flow pathways. A pressure tap was installed near the inlet of each system
to measure system static pressure and to measure the system impedance of each system to
compare to the model’s predictions. Pressure was measured using a Setra 264 Digital Low
Differential Pressure Transducer (Setra Systems Inc., Boxborough, MA). Each system was
connected to a 100psi compressed air source and system flow-rate was metered using a
calibrated Dwyer RMC-104 Flowmeter (Dwyer Instruments Inc., Michigan City, IN). For the
baseline natural-draft experiments the 12x8mm modular system was installed and the system
inlet was sealed shut to prevent any flow from passing through the system during the test. Figure
23 provides further illustration and details of the modular secondary air system and the complete
experimental stove assembly.
Figure 23: Modular KuniokoaTM secondary air injection experimental apparatus. Additional dimensions are provided in Appendix A2.
90
4.3 Experimental Results
The following is a summary of the results from the evaluation of the effects of the cross-flow
mixedness optimization parameters used in the analytical model (maximum jet penetration length,
𝑌𝑚𝑎𝑥 , and momentum-flux ratio, 𝐽 ) on cookstove performance and mixing characteristics. A
combination of CFD simulation and laboratory experimental results are presented to characterize
the impact of varying degrees of 𝐽 , which is a function of 𝑌𝑚𝑎𝑥 , on riser cross-flow mixing
characteristics, system flow behavior, thermal-efficiency, and emissions. The results of this
investigation were used to evaluate the validity of the analytical model’s predicted optimum jet
configuration and define additional design criteria necessary to develop optimized secondary air
injection systems for side-feed wood-burning cookstoves.
4.3.1 Cross-Flow Temperature Contours and Uniformity
Contour plots of the riser temperature from the simulation are shown in Figure 24. These plots
show the temperature contours at three planes: the injection plane, a plane one radius
downstream, and a plane corresponding to the outlet of the riser. These plots, generated for a
stove firepower of 4kW, were used to provide an initial assessment and comparison of the system
behavior of the natural-draft and secondary air jet configurations. The general behavior observed
in Figure 24 suggests that as 𝐽 increases so does the uniformity of the temperature contours when
comparing the natural-draft, 12 x 8mm, and 12 x 4mm contours. This behavior is most prominently
seen one radius downstream and at the outlet of the riser, corresponding to the second and third
row of Figure 24, respectively, where there appears to be less planar temperature gradients as 𝐽
increases.
91
Figure 24: Riser temperature contours for the injection plane (top row), one radius downstream (second row), and riser outlet (bottom row) for all evaluated configurations. The contours are oriented so that the front of the stove corresponds
to the bottom of each contour plot.
Figure 24 also provides an indication of the location of the reaction zone, or region of maximum
heat release, which can be approximated by the high temperature structures (red/orange regions)
in the riser temperature contours. The behavior we observed suggests that as 𝐽 increases the
reaction zone moves further towards the fuel-bed, or farther away from the riser outlet when
comparing the natural-draft, 12 x 8mm, and 12 x 4mm contours. This behavior is consistent with
the behavior observed in a previous investigation into air injection in pellet gasifier cookstove
combustion systems.55
Comparing the temperature contours of the 12 x 4mm, 12 x 3mm, and 12 x 2mm jet configurations
provides little insight into the differences of riser temperature uniformity among these
configurations, other than the observed reduction in overall riser flow temperature as 𝐽 is
increased, which is discussed later. To provide a more detailed comparison of temperature
uniformity among these configurations (and the others), the temperature uniformity index, 𝑈𝑇, was
92
calculated from the inlet to the outlet of the riser using an interval of 𝑍 = 5𝑚𝑚 , where 𝑍 is
downstream distance. Figure 25 provides a comparison of 𝑈𝑇 for each configuration as a function
of 𝑍/𝐷𝑥𝑓, where the left and right bounds of the x-axis correspond to the riser inlet and outlet,
respectively, and a value of 0.1 corresponds to the injection plane. A decrease in 𝑈𝑇 represents
an increase in temperature uniformity. The general behavior of 𝑈𝑇 for all configurations, including
the natural-draft case, follows a similar trend as the temperature contours, with an increase in 𝐽
resulting in an increase in downstream temperature uniformity. We also observed that for all cases,
𝑈𝑇 decreases as the downstream distance increases, even for the natural-draft case.
Figure 25: Riser cross-flow temperature uniformity index, 𝑈𝑇, defined for cross-sectional planes of the riser. The inlet and outlet of the riser correspond to an x-axis value of 0 and 1 respectively. The jet injection plane corresponds to an x-axis value of 0.1.
Figure 25 suggests that there is a dependency of downstream cross-flow temperature uniformity
behavior on 𝐽, but the impact of 𝐽 on 𝑈𝑇 downstream of the injection plane has a diminishing effect
as the jets start to over-penetrate the cross-flow, requiring progressively more energy to further
improve 𝑈𝑇. The under-penetrating configuration (12 x 8mm), corresponding to a 𝐽 value of just
93
8.4, results in an average increase in downstream temperature uniformity of 20% compared to
the natural-draft case, and the predicted optimum (12 x 4mm - 𝐽 = 130) provides an average
increase of 50%. The 12 x 8mm and 12 x 4mm configurations provide the most efficient increases
in cross-flow temperature uniformity, i.e., requiring relatively small jet injection energies (2.8 J/m3
and 45 J/m3, respectively) to achieve their respective increases in cross-flow temperature
uniformity.
The high 𝐽 value configurations, or the over-penetrating configurations (12 x 3mm - 𝐽 = 427 and
12 x 2mm - 𝐽 = 2161), represented by the dashed lines in Figure 25, result in significant increases
in average temperature uniformity, 65% and 75%, respectively, but the additional increase in
temperature uniformity compared to the predicted optimum case requires a disproportionate
increase in 𝐽, analogous to an increase in jet injection energy. The 12 x 3mm configuration
increases the average downstream temperature uniformity 15% more than the predicted optimum
(12 x 4mm) but requires a 330% increase in 𝐽 (also proportional to the increase in jet injection
energy). This is even more pronounced when comparing the 12 x 2mm configuration which
requires a 1600% increase in 𝐽 to see an additional 25% increase in riser temperature uniformity
compared to the predicted optimum configuration.
Interestingly, the predicted optimum configuration achieves near equivalent temperature
uniformity as the high 𝐽 value configurations at the riser outlet. When this behavior is considered
along with the relative efficiency in increasing cross-flow temperature uniformity of the predicted
optimum configuration it seems to suggest that the 12 x 4mm configuration provides a good
compromise between jet injection energy and the effectiveness of the jets in increasing cross-flow
temperature uniformity.
94
4.3.2 Cross-Flow Fuel Scalar Uniformity
The fuel scalar uniformity index, 𝑈𝐹𝑆, was also calculated along the full length of the riser to
attempt to quantify and compare the mixedness of the riser cross-flow, or more specifically the
mixedness of wood volatile and reaction product species in the riser. 𝑈𝐹𝑆 is shown for each
configuration evaluated as a function of downstream distance in Figure 26. The general behavior
of 𝑈𝐹𝑆, as 𝐽 is increased, follows that of 𝑈𝑇, with an increase in 𝑈𝐹𝑆 corresponding to an increase
in 𝐽, but again 𝐽 having a diminishing impact on 𝑈𝐹𝑆 as 𝐽 becomes larger.
This behavior follows what J. Vanormelingen and E. Van Den Bulck found in their investigation 52,
that is as jet penetration, 𝑌𝑚𝑎𝑥, and therefore 𝐽 increase, so does the effectiveness of the jet
configurations in increasing cross-flow mixedness compared to the natural-draft behavior, or no
air injection case. They also showed a diminishing effect as 𝐽 is increased past a critical value,
similar to the trend we observed. The 𝑈𝐹𝑆 results do not verify the behavior found by J.
Vanormelingen and E. Van Den Bulck where a momentary decrease in mixedness is seen as 𝐽 is
increased past the predicted optimum point. Additional simulations with 𝐽 values nearer to the
predicted optimum (𝐽 = 130) would need to be performed to evaluate if this behavior is seen in
cookstove riser cross-flow mixedness.
Contrary to the 𝑈𝑇 results the predicted optimum configuration does not achieve the same 𝑈𝐹𝑆 as
the over-penetrating configurations at the riser outlet, but still appears to provide the best
compromise between jet injection energy and the effectiveness of the jets in increasing cross-flow
mixedness.
95
Figure 26: Riser cross-flow fuel scalar uniformity index, 𝑈𝐹𝑆, defined for cross-sectional planes of the riser. The inlet and outlet of the riser correspond to an x-axis value of 0 and 1 respectively. The jet injection plane corresponds to an x-axis value of 0.1.
4.3.3 Flame Behavior
A decrease in 𝑈𝐹𝑆, represents an increase in fuel and reaction product species mixing in the cross-
flow, which should correspond to a reduction in the overall flame length of diffusion flames. The
stoichiometric flame surfaces, shown in Figure 27, support this correlation, with a noticeable
decrease in overall flame height as 𝑈𝐹𝑆 improves with an increase in 𝐽.
Not surprisingly, the natural-draft configuration has the longest flame length, extending from the
fuel bed to the outer edges of the pot, and is relatively unperturbed due to the lack of
turbulent/convective mixing in what is primarily laminar/transitional flow. The 12 x 8mm
configuration results in a decrease in flame length, but not enough to prevent flame-to-pot
interaction, which is a known contributor to PM2.5 cookstove emissions. The predicted optimum
configuration (12 x 4mm) appears to reduce flame height to the plane of injection, well below the
cooking surface (bottom of the pot) and the outlet of the riser, preventing flame-to-pot interaction.
96
As 𝐽 increases past the predicted optimum value into the over-penetration region the flame
surface does not extend beyond the height of the combustion-chamber, which is unlikely to
provide an additional benefit in emissions reductions compared to the optimum configuration, but
suggests that there are jet mixing patterns inherent to over-penetrating jet configurations that
extend upstream, into the combustion-chamber, and to the fuel-bed.
Figure 27: Stoichiometric flame surfaces for the natural-draft and jet configurations evaluated for a system firepower
of 4kW.
97
4.3.4 Cross-Flow Velocity Contours
While all of the jet configurations improve upstream mixedness and temperature uniformity,
apparent in Figure 25 and Figure 26, the increases seen in the over-penetrating configurations is
attributed to the tendency of over-penetrating jets to create upstream recirculation zones near the
walls of the cross-flow, which can provide very thorough upstream mixing patterns, but that are
not always beneficial.52 The recirculation zones have a blockage effect on the flow near the walls
of the cross-flow, which effectively reduces the cross-sectional area of the cross-flow, increasing
the mainstream center-flow velocity (i.e., increasing the pressure-drop across the jet injection
plane). The thorough upstream mixing patterns and localized increase of flow velocity where the
jets converge in the center of the flow results in a reduction in mean gas residence time through
the system, which has been found to negatively impact the ability for complete oxidation of fuel
species, resulting in higher emissions and lower combustion efficiencies.52
The velocity contours of a plane bisecting the riser and two opposing jets, shown in Figure 28,
illustrates the increase in the center-flow velocity and upstream mixing patterns as 𝐽 increases.
We found that the 12 x 8mm configuration produces minimal increases in cross-flow velocity and
no obvious upstream recirculation zones, but as 𝐽 is increased, the center-flow velocity, the
degree of jet impingement, and upstream recirculation patterns increase in magnitude and
become more prominent. Even the predicted optimum configuration, which the model predicts to
have a maximum jet penetration of 42% of the cross-flow diameter, shows signs of upstream
mixing patterns, suggesting the analytical model’s prediction of jet penetration is underestimated.
98
Figure 28: Riser velocity contours of a vertical plane bisecting the riser and two opposing jets. The bottom of the contour images correspond to the inlet of the riser and the top corresponds to the outlet.
4.3.5 PM2.5 Emissions
The presence and magnitude of upstream recirculation zones and mixing patterns follows the
flame height trend, but this continued reduction in flame height does not always correspond to a
decrease in emissions. Figure 29 compares the experimentally measured PM2.5 emission rate of
the natural-draft case and three of the jet configurations determined from a modified FPS where
the stove was operated at 4kW for an extended period of time using small-dry wood (2cm x 2cm
99
Douglas Fir sticks). Similar to the 𝑈𝑇 and 𝑈𝐹𝑆 results we found that improvement in PM2.5
emissions is much more sensitive to 𝐽 leading up to the predicted optimum value. In natural-draft
the stove was found to have a PM2.5 emission rate of 20.3 mg/min (Tier 1), the 12 x 8mm
configuration resulted in a PM2.5 emission rate of 12.1 mg/min (Tier 2), and the optimum
configuration (12 x 4mm) resulted in a PM2.5 emission rate of 3.6 mg/min (Tier 3), an 82%
reduction compared to the natural-draft case. As 𝐽 is increased further, past the predicted
optimum point, the PM2.5 emission rate (8.4 mg/min, Tier 2) is improved when compared to the
natural-draft and 12 x 8mm configuration, but is increased when compared to the predicted
optimum case. This appears to confirm previous findings suggesting an increase in emissions at
high 𝐽 values due to the thorough upstream mixing patterns and reduction in gas residence time
associated with over-penetrating jet configurations. This suggests that jet configurations that
result in the most significant increases in cross-flow mixedness or temperature uniformity do not
necessarily correspond to optimal performance.
Figure 29: PM2.5 emission rate (mg/min) as a function of momentum-flux ratio, 𝐽, at a firepower of 4kW. Note: Error
bars represent a 90% CI.
100
4.3.6 Inlet Air Flow Ratio
Additionally, the increase in center-flow velocity as 𝐽 increases was found to influence the total
mass-flow of air through the cookstove. Figure 30 compares the primary-to-secondary air mass-
flow ratio, λ, predicted by the CFD simulations for all the jet configurations. As 𝐽 increases so does
λ, suggesting an increase in primary air mass-flow as the center-flow velocity in the riser increases.
The baseline natural-draft case operates using only primary air and the corresponding total air
mass-flow rate is 2.9 g/s for a stove firepower of 4kW. The jet flow, which is constant for all the
jet configurations, introduces 1.6 g/s of air into the system, but we see a varying amount of primary
air for each jet configuration (2.1 g/s for 12 x 8mm, 2.4 g/s for 12 x 4mm, 2.6 g/s for the 12 x 3mm,
and 2.9 g/s for the 12 x 2mm configurations) following the center-flow velocity trend in the velocity
contours.
A drop in primary air mass-flow is seen for the 12 x 8mm configuration, compared to the natural-
draft case, but this still corresponds to an overall increase in total mass-flow of air through the
stove. The 12 x 2mm configuration is found to operate at the same primary air mass-flow rate as
the natural-draft case, resulting in a 150% increase in total system air mass-flow.
Figure 30: Primary to secondary air mass-flow ratio, λ, as a function of momentum-flux ratio, 𝐽, predicted by the CFD
simulations.
101
Similar behavior is found in the experimental results from excess-air tests of the physical modular
system, shown in Figure 31, throughout a wide-range of stove firepower’s. The experimental
results suggest an even more significant increase in primary air than the CFD simulations. For
example, the CFD simulations predict λ = 1.82 at 4kW for the 12 x 2mm configuration, but the
experimental results predict λ = 4.3 at an equivalent firepower. This is attributed to the different
fuel size used in the laboratory experiments, which resulted in less of the fuel feed inlet (i.e., the
main primary air inlet) being blocked with fuel than in the CFD simulations. The area of the primary
air inlet(s) has been found to strongly impact total flow rate of air through a cookstove system in
a previous investigation.50
Figure 31: Primary to secondary air mass-flow ratio, λ, as a function of momentum-flux ratio, 𝐽 , predicted by
experimental excess-air tests.
An increase in total mass-flow of air results in a decrease in average flow temperature, if firepower,
or total heat release remains constant, which was the case for the CFD simulations. This decrease
in average flow temperature can be seen in the temperature contours shown in Figure 24. If the
outlet temperature of the riser, 𝑇𝑜𝑢𝑡, is compared between all the jet configurations it is found that
there is a near linear relationship between λ and 𝑇𝑜𝑢𝑡, shown in Figure 32.
102
Figure 32: Primary to secondary air mass-flow ratio, λ, as a function of riser outlet temperature, 𝑇𝑜𝑢𝑡, predicted by CFD
simulations.
4.3.7 Thermal-Efficiency
A reduction in riser outlet temperature can have negative impacts on thermal-efficiency and this
is confirmed by both the CFD simulations and laboratory performance testing results, which are
shown in Figure 33. As 𝐽 increases, so does the total mass-flow rate of air through the stove,
resulting in a decrease in 𝑇𝑜𝑢𝑡 and a decrease in thermal-efficiency. The CFD simulations predict
the decrease seen in thermal-efficiency to be in good agreement and proportional to the
decreases in 𝑇𝑜𝑢𝑡.
This again suggests that jet configurations that result in the most significant increases in cross-
flow mixedness or temperature uniformity do not necessarily correspond to optimal performance
because they tend to correspond to increased emissions and significant decreases in thermal-
efficiency when compared to the predicted optimum configuration. The predicted optimum
configuration appears to provide a good compromise between jet injection energy, quality of
cross-flow mixedness, flame-height reduction, particulate emissions reductions, and thermal-
efficiency when compared to the natural-draft case and the other configurations evaluated.
103
Figure 33: Thermal-efficiency (%) as a function of momentum-flux ratio, 𝐽 , for both the CFD simulations and
experimental results. Note: Error bars represent a 90% CI.
4.3.8 System Impedance
The modular secondary air systems were used to evaluate the accuracy of the analytical model’s
method of estimating system impedance. Figure 34 shows the comparison of the model predicted
system impedance (solid lines) and the measured system impedance (data points) for the 12 x
2mm, 12 x 4mm, and 12 x 8mm configurations.
In general, Figure 34 suggests the model tends to overestimate system static-pressure when
compared to the measured values. As the jet diameter decreases the agreement of the model
with the measured values becomes worse with the model significantly overestimating the static
pressure of the 12 x 2mm system as flow-rate is increased. The model uses a standard orifice
discharge coefficient, Cd, of 0.6 which leads to a good approximation of system impedance for
configurations with jet diameters less than 4mm, but significant overestimation for smaller jets.
The estimation can be improved within the range of static-pressures capable by most small fans
likely to be used in air injection systems (<1in-H2O) by changing Cd to 0.78, 0.63, and 0.67 for the
12 x 2mm, 12 x 4mm, and 12 x 8mm configurations, respectively. The improved or corrected
104
predicted system impedances are shown in more detailed for static-pressure less than 1in-H2O
in Figure 35 represented by the dashed lines.
Figure 34: Jet system impedance comparison between the analytical model predictions (solid lines), measured values (points), and corrected model predictions (dashed lines).
Figure 35: Model corrected jet system impedance (dashed lines) compared to the previous model predictions (solid
lines) and measured values (points).
105
When using the model and a standard discharge coefficient (Cd = 0.6) the user should keep in
mind that the predicted system static-pressures of jets less than 4mm is likely to be overestimated.
A modified discharge coefficient and/or head-loss value or function should be used if the model
is to provide the most accurate predictions of system impedance guiding the selection of optimum
jet configurations within a projects fan design parameters and system characteristics.
4.4 Summary
Taking into account the CFD simulations and laboratory experimental evaluation of the natural-
draft case and selected jet configurations, the results support the literatures suggested values of
𝒀𝑚𝑎𝑥 = [0.4𝐷𝑥𝑓 … 0.5𝐷𝑥𝑓] for calculating jet configurations with good cross-flow mixing
characteristics and that require minimum jet injection energies. The analytical model’s use of
𝒀𝑚𝑎𝑥 in calculating optimum jet configurations was found to provide a good estimation of
secondary air jet configurations that successfully increase cross-flow mixedness and uniformity,
reducing flame height, resulting in a maximum reduction in PM2.5 emissions, and that provide a
good compromise between jet injection energy, quality of cross-flow mixing, and thermal-
efficiency.
The model tended to overestimate system impedance, especially for jet systems with jet
diameters less than 4mm, so care should be taken in using the model for fan selection or when
using the model to estimate optimum jet configurations within the fan design parameters of a
specific stove project.
The model assumes the cross-flow variables remain constant regardless of jet configuration,
contrary to what was observed in the CFD simulations and laboratory experiments. Table 14
displays the model’s original jet characteristic predictions for the evaluated configurations and
corrected values (shown in bold) calculated using the cross-flow average temperature and mass-
flow predicted by the CFD simulations and the corrected estimations of system impedance.
106
Although the corrected values are in some instances significantly different than the original
predictions, the overall trends remain the same.
Table 14: Corrected jet characteristics for the jet configurations evaluated. Corrected values are shown in bold.
Jet Configurations Selected for Evaluation (Corrected)
Under-Penetrating Optimum Over-Penetrating
(12 x 8mm) (12 x 4mm) (12 x 3mm) (12 x 2mm)
𝑄 (cfm) 2.8 2.8 2.8 2.8
�̇� (kg/s) 0.0016 0.0016 0.0016 0.0016
𝐾 0.387 0.632
0.387 0.555
0.387 0.533
0.387 0.477
𝑛𝑗 12 12 12 12
𝑑𝑗 (mm) 8 4 3 2
𝑉𝑗 (m/s) 2.2 8.6 15.6 35
𝐽 8.4
22.2 130 281
427 873
2161 4536
∆𝑝𝑠𝑡𝑎𝑡𝑖𝑐 (in-H2O) 0.03
0.027 0.49 0.50
1.54 n/a
7.8 4.75
𝑌𝑚𝑎𝑥 𝐷𝑥𝑓⁄ 0.21 0.29
0.42 0.54
0.56 0.72
0.84 1.1
107
CHAPTER 5: A SOLAR-POWERED FAN-DRIVEN SECONDARY AIR INJECTION SOLUTION FOR THE KUNIOKOATM
This chapter details the development of a solar-powered fan-driven secondary air injection system
for the KuniokoaTM, a natural-draft, side-feed, wood-burning cookstove. The project’s motivation
is described in the context of current household electrification efforts and technologies in Sub-
Saharan Africa, the performance deficiencies of the current natural-draft KuniokoaTM, and how
the former can be used in combination with the cookstove air injection optimization design tool
(detailed in Chapter 2) to overcome the latter. The project goals and design parameters are
defined, and the final design prototype is detailed, known as the Kuniokoa-TurboTM. Finally, the
laboratory performance of the Kuniokoa-TurboTM is presented and compared to the performance
of the baseline, or natural-draft KuniokoaTM, providing an example of how optimized air injection
in the riser of a cookstove can be used to effectively improve the performance of intermediate
cookstove designs.
5.1 Kuniokoa-TurboTM
In 2018 Intellectual Ventures (IV), through their Global Good Fund, partnered with the UWCCL,
Aprovecho Research Center (ARC), and BURN with the goal of developing a next generation
wood-burning cookstove product for Sub-Saharan Africa. The goal was to develop a low-
emissions and fuel-efficient wood-burning cookstove that leveraged the growing pay-as-you-go
(PAYG) off-grid solar electrification efforts and household solar technologies market in rural Sub-
Saharan Africa to power an innovative wood-burning cookstove design that improved upon the
performance of the KuniokoaTM by using air injection as a means to overcome existing
performance limitations. The desired performance improvements included (1) reducing the
performance variabilities of the KuniokoaTM when subjected to in-home use, (2) effectively
reducing HAP (specifically PM2.5 emissions), and (3) increasing the utility of the stove by widening
the range of fuel characteristics that could be used with the design. The final product was to be
108
included as part of a complete household sustainable energy solution, along with solar powered
lights and other appliances, which could be made affordable to some of the most rural and
disadvantaged populations in the region through a PAYG financing structure.
The idea for the Kuniokoa-TurboTM was conceived from the need to improve upon the in-home
performance of the KuniokoaTM and the increased accessibility to household electricity due to the
growing off-grid solar system and device market in Sub-Saharan Africa. In Kenya and Tanzania
approximately 50% of all off-grid and/or households with unreliable-grid access use a household
solar system and/or device as of 2017, with over 6 million products distributed .53 The global
market for off-grid household solar solutions is experiencing immense growth and sales are
expected to increase in regions like Sub-Saharan Africa by 30% annually, leading to an estimated
434 million sales worldwide by the year 2022 .53 Many of these off-grid solar systems and devices
operate using a PAYG business model that allows users to pay for a product via embedded
consumer financing that provides the financial flexibility needed for poorer households, often in
regions with limited grid access, to afford sustainable household energy solutions.
The presence of PAYG off-grid solar system and device companies in Sub-Saharan Africa is the
highest in the world, with 98% of all PAYG business model companies operating in the region .53
M-Kopa, Orb, Mobisol, and Greenlight Planet offer a diverse product line of PAYG solar systems
and devices to households in Sub-Saharan Africa, with much of their focus in East-Africa in
countries like Kenya and Tanzania. We are partnering with them with the goal of adding a clean-
burning and fuel-efficient biomass household cooking solution to the PAYG household energy
packages that they already offer. Packaging an improved cooking solution with PAYG off-grid
solar systems and devices has two main advantages: (1) increased affordability and financial
flexibility due to the PAYG financing structure and (2) the availability of a solar energy source that
can be used to power a fan-driven air injection system to improve stove performance.
109
5.1.1 Project Goals and Design Parameters
Through previous work the UWCCL did in developing the KuniokoaTM and characterizing its
performance (detailed in Chapter 1), combined with feedback BURN had received from
consumers about the KuniokoaTM since its launch, and current market data from PAYG off-grid
solar companies in Sub-Saharan Africa, the design parameters and performance targets guiding
the development of the Kuniokoa-TurboTM were defined. We determined that the Kuniokoa-
TurboTM needs to be capable of firepower’s upwards of 6kW, reduce the time-to-boil to less than
25 minutes, improve the stoves ability to burn large and/or high moisture content fuel, reduce in-
home emissions throughout the stoves expected operating range to Tier 3 or better, and maintain
the thermal-efficiency and durability performance of the KuniokoaTM.
The strategy to achieve these performance targets focused on the development of a fan-driven
air injection system powered by the energy from the accompanying off-grid solar system. The
solar companies we partnered with provided data showing that 98% of household off-grid solar
systems have approximately 10 watt-hours of surplus energy per day after all other energy
requirements have been met. This daily surplus energy represented the energy available to power
an air injection system for the Kuniokoa-TurboTM, suggesting that any potential air injection system
needed to operate on less than 2 watts of average peak power to provide a minimum of 5 hours
of cooking per day if needed.
The air injection system and any additional changes to the KuniokoaTM necessary to incorporate
a system into the existing design needed to limit material and component cost (BOM) to less than
$5 USD to ensure that the Kuniokoa-TurboTM could meet our retail cost targets. The BOM target
suggests that the budget for the fan is approximately $2 USD. Through contact with multiple fan
manufacturers it was determined that the system needed to operate at a static-pressure under
0.6 in-H2O to be capable of being driven by fans under $2 USD. In addition, preliminary
investigations into air injection in the riser of the KuniokoaTM showed that the stove experienced
110
flame blowout at low-firepower’s and backdraft at high-firepower (causing flames to exit out the
fuel feed door of the stove) at system flow-rates greater than 3 CFM, so the flow-rate passing
through the jets needed to be limited to below this value. BURN advised that their manufacturing
techniques and the BOM would limit possible air jet configurations to jet diameters no smaller
than 2mm diameter jets and no more than 12 jets. Finally, in the event an energy source is
temporarily unavailable to power the air injection system the stove needed to allow for natural-
draft operation without risking damage to the fan and/or associated electronic components after
prolonged use.
5.1.2 Fan-Driven Secondary Air Injection System Design
Having already shown the performance benefits of optimized secondary air injection in the riser
of the KuniokoaTM during the evaluation of the analytical model in Chapter 4, we began by
designing a manufacturable fan-driven riser air injection system for the KuniokoaTM. Unlike the
fully-welded and compressed air powered modular secondary air systems built for the
investigation detailed in Chapter 4, the system for the Kuniokoa-TurboTM could not be welded due
to manufacturing cost concerns and had to be driven by a fan. The strategy used to design the
air injection system focused on developing a low-cost and easy to assemble ducting system that
directed flow from an externally mounted fan to the air jets located in the riser.
The ducting assembly was built from 22-gauge 304 stainless-steel sheet and used a twist tab
assembly technique to assemble and seal the ducting flow-path, which minimized manufacturing
cost. The fan and associated control-board/electronics were mounted external to the stove body
to thermally-isolate these relatively heat-sensitive components preventing damage while the
stove is in operation in both fan-on (i.e., forced-draft) or fan-off (i.e., natural-draft) conditions. The
fan was attached to the sheet-metal ducting assembly via a nozzle made from Nylon 12, which
provided additional thermal-isolation from conductive heat-transfer from the stove-assembly. We
found that the outer surface of the stove body and the portion of the ducting assembly external to
111
the stove body could reach temperatures upwards of 140°C during high-power natural-draft
operation, well above the maximum operating temperature of fans. The fan control-board was
contained in a plastic shroud, also made from Nylon 12, that wrapped around the fan, fan-nozzle,
and ducting external to the stove body.
The fan used in the initial Kuniokoa-TurboTM prototype was a Sunon PF40281B2-000U-A99 axial
fan (Sunon Inc., Kaohsiung, Taiwan). The cost of this fan exceeded the $2 USD allowed, but was
readily available and provided performance flexibility if needed for initial design and testing
purposes. Power was delivered to the fan via a custom control board that incorporated a
potentiometer with variable set points to control fan voltage, power, and flow if needed. The air
injection system and the Kuniokoa-TurboTM are illustrated in Figures 36-38.
Figure 36: Kuniokoa-TurboTM isometric and top view.
112
Figure 37: External duct, fan, fan nozzle, and control board assembly.
Figure 38: Kuniokoa-TurboTM assembly cross-section and air injection system.
113
The twist-tab assembly technique of the secondary air injection ducting did not completely seal
the assembly. We needed to account for system leakage when using the analytical model to
calculate optimum jet configurations that our selected fan was capable of driving. System leakage
will increase the fan flow-rate necessary to achieve the flow-rate corresponding to each optimum
jet configuration predicted by the model and will generally lower the total system static-pressure,
since a percentage of the flow will be lost through system leaks and the total equivalent jet area
is increased due to leaks. We estimated the total system leakage area by inserting a riser with no
secondary air jets into a fully assembled Kuniokoa-TurboTM prototype. We then measured the
static-pressure of the air injection system at a location 20mm downstream of the fan-to-fan-nozzle
interface (i.e., the system inlet) as we passed known flow-rates of air through the system using
the compressed air source and flow-meter used with the modular system detailed in Chapter 4.
By using a riser with no secondary air jets, the only pathways for air to leave the system is through
system leaks, so the resulting system impedance curve represented only the system leaks, or
duct leakage. The resulting curve is shown in Figure 39.
With the system impedance of the duct leakage known, we were able to estimate the total area
of the system leaks by matching the predicted system impedance of the model to the measured
impedance of the leaks. We did this by assuming a negligible head-loss and a discharge
coefficient of 0.63, and then manually iterated the total jet area variable, 𝐴𝑗, in the model until the
model’s predicted impedance aligned with the measured impedance (dashed line in Figure 39).
Once this was accomplished the corresponding total jet area was taken as a representation of
the cumulative area of all the system leaks, 𝐴𝑙, which was calculated to be 160mm2.
The ratio of total jet area and total area of system leaks, 𝐴𝑗/𝐴𝑙, is proportional to the ratio of total
jet flow-rate and total flow-rate lost through system leaks, 𝑄𝑗/𝑄𝑙, so by defining the total area of
the system leaks we can then calculate the amount flow that will be lost through system leakage
from Equation 32 by simply dividing the flow-rates of all the predicted optimum configurations by
114
𝑨𝒋/𝐴𝑙, where 𝑸𝒋 is the total jet flow rate for each optimum jet configuration corresponding to the
user-defined parameter 𝑸, and 𝑸𝑙 is the flow-rate lost through system leaks.
𝑸𝒋 (𝑨𝒋
𝐴𝑙)
−1
= 𝑸𝑙 Eq. 32
The required fan flow-rate, 𝑸𝑇, can then be calculated by taking the sum of 𝑸𝒋 and 𝑸𝑙. The total
open area of the system, 𝑨𝑇 (i.e., the sum of the total jet area and the total area of system leaks),
can be calculated similarly and used to calculate the actual system static-pressure using Equation
25.
Figure 39: Comparison of the Kuniokoa-TurboTM air injection system duct leakage impedance, system impedance of the 12 x 4mm modular system from Chapter 4, and the total system impedance and system operating point of the Kuniokoa-TurboTM when using a 12 x 4mm jet configuration and the Sunon fan at 8V.
Using the analytical model detailed in Chapter 2 and the Kuniokoa-TurboTM project design
parameters and system characteristics, shown in Table 9, a selection of optimum jet
configurations was calculated, shown in Table 10. Using the estimated system leakage area, the
system flow-rates and static-pressures of the configurations listed in Table 10 were corrected for
115
system leakage. We selected the 12 x 4mm jet configuration, corresponding to a jet flow-rate of
2.8CFM, a total fan flow-rate of 5.8CFM (3CFM of system leakage), and a total system static-
pressure of 0.25 in-H2O, the corresponding system impedance and operating point are shown in
Figure 39. The 12 x 4mm configuration was, in general, selected arbitrarily, any of the
configurations listed in Table 10 would have been good choices. Although, the 12 x 4mm
configuration did have the maximum number of jets (correlating to a higher quality of cross-flow
mixing than the configurations with less jets), kept jet flow below 3CFM, and the leak corrected
operating point aligned with the Sunon fan performance curve for a fan voltage of 8V, shown in
Figure 39. The fan performance curve was determined using a fan testing apparatus built in
accordance with Figure 12 in ANSI/AMCA 210-99. All other configurations required fan voltage to
be reduced below 8V to achieve the proper system flow-rates, which limited the ability to test
variable fan flow-rates during a subsequent field-study because the required fan voltage was too
near the cut-off voltage of the fan.
When using the 12 x 4mm jet configuration and a fan voltage of 8V the Sunon fan consumed
1.1W of power, well below the 2W maximum peak power goal of the project, easily providing +9
hours of fan-on cooking per day based on the estimates of daily surplus energy. The jets were
positioned in the same location in the riser (approximately 90mm below the riser outlet, or 10mm
above the inlet of the riser) as in the modular system used in the evaluation of the analytical model
detailed in Chapter 4, illustrated in Figure 38.
5.2 Kuniokoa-TurboTM Laboratory Performance
The Kuniokoa-TurboTM was subjected to the same performance tests as the KuniokoaTM, detailed
in Chapter 1, to determine the impact the optimized secondary air injection system had on all
aspects of cookstove performance throughout a wide range of operating conditions compared to
the natural-draft stove. These tests were also used to evaluate if the Kuniokoa-TurboTM met the
performance requirements of the project.
116
An FPS was performed on the Kuniokoa-TurboTM using small-dry and large-dry feedstocks
covering firepower’s ranging from 0.75 – 5.6kW and compared to the results for the natural-draft
KuniokoaTM, shown in Figure 40. We observed that Kuniokoa-TurboTM results in significant
reductions in PM2.5 emissions at burn-rates above 2.8kW, with PM2.5 performance generally
remaining Tier 3 throughout the entire range of firepower tested. When compared to the PM2.5
emissions of the KuniokoaTM at a firepower of 4.5kW, corresponding to the upper-limit of the
typical range of firepower’s observed by BAMG in the field during the SFR 35B field study, we
find that the Kuniokoa-TurboTM reduces PM2.5 emissions by 91% compared to the KuniokoaTM. In
general, the FPS results for the Kuniokoa-TurboTM suggest that the 12 x 4mm jet configuration
successfully reduces PM2.5 emissions to within the Tier 3 PM2.5 emissions performance target of
the project for the complete range of firepower’s expected to be seen in the field. The FPS results
also suggest that the Kuniokoa-TurboTM is capable of burn rates in excess of 5.5kW, nearly 1kW
more than the KuniokoaTM is capable of under similar conditions. This is attributed to the
decreased char production in the Kunikoa-TurboTM due to the downstream mixing effects of the
secondary air jets extending into the combustion-chamber of the stove that improve char
combustion preventing a build-up of char that prevents high burn rates.
117
Figure 40: Kuniokoa-TurboTM FPS results for small-dry and large-dry feedstocks compared to the results for the natural-draft KuniokoaTM. Note: Shaded region represents a 90% CI.
High-power WBT’s were performed using small-dry, large-dry, and large-wet feedstocks. The
corresponding WBT performance metrics and tiers are reported in Table 15 and Figure 41. The
results for the Kuniokoa-TurboTM suggest an improvement in all emissions metrics for all fuel
feedstocks when compared to the corresponding results for the KuniokoaTM. The Kuniokoa-
TurboTM maintains Tier 3, or near Tier 3 performance regardless of fuel type. The wet-wood WBT
results suggest that the Kuniokoa-TurboTM has an improved ability in burning wet-wood,
increasing wet-wood heat output by 36% compared to the KuniokoaTM. We also find that the
thermal-efficiency of the Kuniokoa-TurboTM is not significantly different than the natural-draft stove
with the simulated field-typical performance average efficiency matching the efficiency of the
KuniokoaTM (36%). This suggests that duct flow leakage does not significantly impact thermal-
efficiency, a concern we had with the use of an imperfectly sealed assembly.
118
Figure 41: Kuniokoa-TurboTM high-power WBT ISO performance tiers for small-dry, large-dry, and large-wet feedstocks. Note: error bars represent a 90% CI.
Table 15: Kenya TSF baseline values and Kuniokoa-TurboTM high-power WBT ISO performance values for small-dry, large-dry, and large-wet feedstocks. Simulated field-typical performance metrics are averaged across all fuel-types and shown for comparison.
Note: variabilities represent one standard-deviation.
The simulated field-typical performance of the Kuniokoa-TurboTM results in a 65% reduction in
high-power CO emissions, a 76% reduction in high-power PM2.5 emissions, and a 66% and 77%
reduction in CO and PM2.5 indoor emissions, respectively, when compared to the simulated field-
typical performance of the KuniokoaTM. When compared to the TSF data collected by BAMG
during the SFR 35B field-study, the Kuniokoa-TurboTM results in a 27% reduction in high-power
CO emissions, an 85% reduction in high-power PM2.5 emissions, and an 86% and 97% reduction
in CO and PM2.5 indoor emissions, respectively. A summary of the tiered performance metrics
comparing the simulated field-typical performance of the KuniokoaTM and Kuniokoa-TurboTM is
shown in Table 16. On average the Kuniokoa-TurboTM improves the simulated field-typical
performance to Tier 3 or above for all high-power performance metrics at an equivalent firepower
to the KuniokoaTM but does not appear to provide significant reductions in cooking time.
Table 16: High-power WBT tiered performance summary for the Kuniokoa-TurboTM comparing the simulated field-typical performance to the corresponding results for the KunikoaTM.
Firepower
(kW) Time-to-Boil (min)
High Power
Thermal-Efficiency
High Power
CO
High Power PM2.5
Indoor Emissions
CO
Indoor Emissions
PM2.5
KunikoaTM
Simulated Field-Typical
3.8 ± 1 26 ± 8.9 3 3 2 1 1
Kuniokoa-TurboTM Simulated
Field-Typical
4 ± 0.7 24.4 ± 7 3 4 3 4 3
Note: variabilities represent one standard-deviation.
5.3 Summary
The Kuniokoa-TurboTM is still in the early stages of development as of writing, with many questions
about the viability of the design and product left unanswered, but the initial prototype our team
120
developed does support the benefits of using the secondary air injection optimization design tool
in designing secondary air injection systems to reduce emissions and improve stove performance
throughout a wide range of operating characteristics. Using the design tool, we were able to
design a secondary air injection system that met the jet design parameters defined by the
manufacturer and the fan design parameters defined by the fan budget. We found that the
Kuniokoa-TurboTM is capable of firepower’s upwards of 5.5kW when using small-dry wood
(determined from FPS results), has an improved ability to burn high moisture content fuel, reduces
in-home emissions throughout the stoves expected operating range to Tier 3 or better for all fuel-
types, and maintains thermal-efficiency performance. The laboratory performance tests do fail to
provide evidence that the Kuniokoa-TurboTM results in a significant reduction in time-to-boil and
the impact of air injection on stove durability is still an unanswered question.
In early 2019, eight Kuniokoa-TurboTM prototypes were sent to Kenya for field-evaluation, which
included user focus-groups, controlled cooking tests, in-home placements, and extended
durability testing to gain a better understanding of the perception of local cooks to a fan-powered
rocket-stove and to answer some of the performance questions that were left unanswered by the
laboratory performance testing. As of writing the field-evaluation is on-going, but preliminary
feedback has indicated that local cooks prefer the Kuniokoa-TurboTM over the natural-draft stove,
due to a perceived reduction in emissions, higher heat output resulting in faster time-to-cook, and
an increased ability to burn a wide range of moisture content and size wood. Figures 42-44 are
images from some of the Kuniokoa-TurboTM focus-groups.
121
Figure 42: Kuniokoa-TurboTM user focus-group.
Figure 43: Kuniokoa-TurboTM user focus-group.
122
Figure 44: Kuniokoa-TurboTM user focus-group.
123
CHAPTER 6: CONCLUSIONS AND FUTURE WORK
Innovative cookstove design tools and strategies are needed to help define, understand, and
overcome the technical issues preventing the successful development and implementation of
improved cookstoves that: (1) burn locally available biomass fuels, (2) are clean-burning and fuel-
efficient, (3) result in meaningful improvements in personal health, quality of life, and financial-
stability, and (4) result in meaningful reductions in environmental damage.
In this thesis, an innovative secondary air injection system design tool for fan-driven systems in
side-feed wood-burning cookstoves (i.e., rocket-stoves) is developed, evaluated, and discussed.
The design tool presented optimizes the mixing characteristics of a single-row of equal-diameter
circular air jets located symmetrically around the perimeter of a cylindrical cross-flow (i.e., the
cylindrical riser of a cookstove). Using optimum values of maximum jet radial penetration length
suggested in literature for furnace and gas turbine combustion-chamber applications, and user-
defined design parameters and system characteristics, optimum jet configurations are predicted
that result in: (1) good cross-flow mixing characteristics, (2) minimum jet injection energies, (3)
reduced flame-height, (4) maximum reductions in PM2.5 emissions , and (5) minimum impact on
thermal-efficiency. The cookstove performance trade-offs of different secondary air jet
characteristics are discussed, and the method used to predict optimum jet configurations is
validated by evaluating a range of jet penetrations and jet-to-cross flow momentum-flux ratio’s
using a 3-dimensional CFD model and a stove prototype with a modular secondary air injection
system. We find that the jet mixing optimization parameter and values suggested in literature (i.e.,
maximum jet radial penetration lengths that approach the mid-line of the cross-flow) can be used
to approximate secondary air jet configurations in the riser of wood-burning cookstoves that
provide optimum cross-flow mixing characteristics.
The design tool is applied to the development of the Kuniokoa-TurboTM, a side-feed, wood-burning
cookstove with a solar-powered secondary air injection system used to reduce emissions and
124
improve stove utility. We determine that the design tool can be successfully used to design a fan-
driven secondary air injection system for a wood-burning cookstove that results in comprehensive
reductions in emissions throughout a wide-range of stove operating conditions typical of in-home
use.
As the design tool does not optimize secondary air injection location, further investigation is
needed to determine the optimum location of the injection plane within a cookstove design. In
addition, previous investigations have shown a dependence of PM size distribution on secondary
air jet characteristics.48 Investigating the size distribution of the PM produced by stoves using the
optimum jet configurations predicted by the design tool will ensure that air injection systems
reduce PM emissions throughout the entire particle size range.
With the development of innovative cookstove design tools, like the one presented in this thesis,
we can help improve current improved cooking technologies and guide the development of future
technologies that are more effective in reducing HAP, reducing household fuel-consumption, and
meeting household cooking and/or heating needs; all contributing to the successful adoption of
clean-burning and fuel-efficient cooking products that have the potential to save lives, save the
environment, and improve the livelihoods of billions of people around the globe.
125
References
1. Landrigan PJ, Fuller R, Acosta NJR et al. The Lancet Commission on pollution and
health. Lancet. 2017; (published online Oct 19.)
2. World Health Organization. (2018, May 2). 9 out of 10 people worldwide breathe
polluted air, but more countries are taking action [Press release]. Retrieved from
%Radial Air Injection zeta_max = 0.4:0.01:0.5; %Optimum jet max penetration factor (fraction of duct diameter) Q = Q_min:0.2:Q_max; %CFM total jet volumetric flow-rate m_j = 0.0004719474*rho.*Q; %kg/s total jet mass flow-rate Kj = m_j./m_xf; %mass flow-rate ratio (jets/cross-flow) nj = nj_min:2:nj_max; %# of jets vector for i = 1:length(Kj) for k = 1:length(nj) for h = 1:length(zeta_max) Jj = (0.8*zeta_max(h)*sqrt(nj(k))*((rho/rho_xf)^0.25)*(1+Kj(i))/sqrt(Kj(i)))^4; %Momentum flux ratio (single-jet/cross-flow) Vj = sqrt(Jj*rho_xf*(V_xf^2)/rho); %m/s Jet velocity dj = sqrt(4*m_j(i)/(nj(k)*Vj*pi()*rho)); %m Jet diameter dPj = 0.00401865*((Vj*pi()*(dj^2)/4)^2)*0.5*rho*(1-((pi()*(dj^2)/4)/A1)^4)*((1/(Cd*pi()*(dj^2)/4))^2); %in-H2O System static-pressure Config_data{i,k,h} = [Q(i) ; nj(k) ; dj ; Vj ; Jj ; dPj ; zeta_max(h)]; %All configurations that satisfy zeta_max for nj and Q end end Config_data_comp{i} = [Config_data{i,:,:}]; end for i = 1:length(Kj) Opt_data_mat = Config_data_comp{i}; indices_dj = find(Opt_data_mat(3,:)<dj_min | Opt_data_mat(3,:)>dj_max)'; %eliminate configurations that are not within djmin and djmax Opt_data_mat(:,indices_dj) = []; indices_dPj = find(Opt_data_mat(6,:)>dPj_max); %eliminate configurations >dPjmax Opt_data_mat(:,indices_dPj) = []; indices_nj = find(Opt_data_mat(2,:)<max(Opt_data_mat(2,:))); %eliminate all configurations but those with maximum number of jets Opt_data_mat(:,indices_nj) = []; Opt_data_mat = mean(Opt_data_mat,2); %if more than one configuration with maximum number of jets, take average of all to define optimum Opt_data{i} = Opt_data_mat; end Opt_data = cell2mat(Opt_data); %Optimum configurations that satisfy all user-defined design parameters (Qmin,Qmax,njmin,njmax,djmin,djmax,dPjmax) % Single-Sided Air Injection S = Dh_xf./(nj+1); %Jet Spacing Jjss = ((2.5*Dh_xf)^2)./(S.^2); for i = 1:length(Q) for k = 1:length(nj) djss = sqrt((0.0004719474*Q(i))/(nj(k)*(pi()/4)*sqrt(rho_xf/rho)*sqrt(Jjss(k))*V_xf)); Vjss = sqrt(Jjss(k)*rho_xf*(V_xf^2)/rho); dPjss = 0.00401865*((Vjss*pi()*(djss^2)/4)^2)*0.5*rho*(1-((pi()*(djss^2)/4)/A1)^4)*((1/(Cd*pi()*(djss^2)/4))^2); Config_datass{i,k} = [Q(i) ; nj(k) ; djss ; Vjss ; Jjss(k) ; dPjss]; end Config_data_comp_ss{i} = [Config_datass{i,:}];
135
end for i = 1:length(Q) Opt_data_mat_ss = Config_data_comp_ss{i}; indices_dj = find(Opt_data_mat_ss(3,:)<dj_min | Opt_data_mat_ss(3,:)>dj_max)'; %eliminate configurations that are not within djmin and djmax Opt_data_mat_ss(:,indices_dj) = []; indices_dPj = find(Opt_data_mat_ss(6,:)>dPj_max); %eliminate configurations >dPjmax Opt_data_mat_ss(:,indices_dPj) = []; indices_nj = find(Opt_data_mat_ss(2,:)<max(Opt_data_mat_ss(2,:))); %eliminate all configurations but those with maximum number of jets Opt_data_mat_ss(:,indices_nj) = []; Opt_data_mat_ss = mean(Opt_data_mat_ss,2); %if more than one configuration with maximum number of jets, take average of all to define optimum Opt_data_ss{i} = Opt_data_mat_ss; end Opt_data_ss = cell2mat(Opt_data_ss); %Optimum configurations that satisfy all user-defined design parameters (Qmin,Qmax,njmin,njmax,djmin,djmax,dPjmax)
136
A2: KuniokoaTM Modular Air Injection Prototype Diagram