The Organization of Innovation Across Countries and Industries Sharon Belenzon y Patrick Bolton z Ulya Tsolmon x January 11, 2013 Abstract This paper examines the relationship between ownership, corporate form, and innovation for a cross-section of private and publicly traded innovating rms in the US and 15 European countries. A novel observation emerges from our analysis: while most innovating rms in the US are publicly traded conglomerates, a substantial fraction of innovation is concentrated in private rms and in corporate group a¢ liates in conti- nental European countries. We nd virtually no variation across US industries in the organizational form of innovating rms, but substantial variation across industries in continental European countries, where corporate groups tend to be concentrated in industries with a slower and more fundamental innovation cycle. Our ndings are consistent with the Coasian view of rm organization where rms choose the corpo- rate form most conducive to innovation. This is especially true in Europe, where there are fewer regulatory hurdles to the formation of hybrid organizational forms. Keywords: innovation, patents, conglomerates, corporate groups JEL Classication: O31, O32, O16 1. Introduction While large conglomerates, such as GE, IBM, and DuPont, are often viewed as the leaders among innovative rms, venture capitalbacked startups such as Facebook and Google are also strong models of cohesive and focused structures of entrepreneurial standalones. Venture capital plays a less prominent role in Europe than in the United States; however, innovative activity in diversied corporate groups such as Ericsson, Zeiss, Alstom and Novartis is still highly notable. While there are many extremely innovative, diversely organized rms, and various organizational theories highlight di/erent structural factors critical to innovation, there is no systematic study of how the structure of innovating rms varies across industries and countries. This paper argues that the organization structure most conducive to innovation varies with the characteristics of technology, which dictates the relative advantages and costs of di/erent corporate forms. We present new Acknowledgement: We thank Ashish Arora, Tomer Berkovitz, Luca Enriques, Daniel Ferreira, Ronald Gilson, Hideshi Itoh, Joshua Lerner, Marvin Lieberman, Randall Morck, Joanne Oxley, Daniel Paravisini, Katharina Pistor, Luis Rios, and Daniel Wolfenzon for helpful comments. All remaining errors are our own. y Fuqua School of Business, Duke University. z Graduate School of Business, Columbia University. x Fuqua School of Business, Duke University.
Transcript
The Organization of Innovation Across Countries and Industries∗
Sharon Belenzon† Patrick Bolton‡ Ulya Tsolmon§
January 11, 2013
Abstract
This paper examines the relationship between ownership, corporate form, and innovation for a cross-sectionof private and publicly traded innovating firms in the US and 15 European countries. A novel observationemerges from our analysis: while most innovating firms in the US are publicly traded conglomerates, asubstantial fraction of innovation is concentrated in private firms and in corporate group affi liates in conti-nental European countries. We find virtually no variation across US industries in the organizational formof innovating firms, but substantial variation across industries in continental European countries, wherecorporate groups tend to be concentrated in industries with a slower and more fundamental innovationcycle. Our findings are consistent with the Coasian view of firm organization where firms choose the corpo-rate form most conducive to innovation. This is especially true in Europe, where there are fewer regulatoryhurdles to the formation of hybrid organizational forms.
Keywords: innovation, patents, conglomerates, corporate groups
JEL Classification: O31, O32, O16
1. Introduction
While large conglomerates, such as GE, IBM, and DuPont, are often viewed as the leaders among innovative
firms, venture capital—backed startups such as Facebook and Google are also strong models of cohesive and
focused structures of entrepreneurial standalones. Venture capital plays a less prominent role in Europe than
in the United States; however, innovative activity in diversified corporate groups such as Ericsson, Zeiss,
Alstom and Novartis is still highly notable. While there are many extremely innovative, diversely organized
firms, and various organizational theories highlight different structural factors critical to innovation, there
is no systematic study of how the structure of innovating firms varies across industries and countries. This
paper argues that the organization structure most conducive to innovation varies with the characteristics of
technology, which dictates the relative advantages and costs of different corporate forms. We present new
∗Acknowledgement: We thank Ashish Arora, Tomer Berkovitz, Luca Enriques, Daniel Ferreira, Ronald Gilson, HideshiItoh, Joshua Lerner, Marvin Lieberman, Randall Morck, Joanne Oxley, Daniel Paravisini, Katharina Pistor, Luis Rios, andDaniel Wolfenzon for helpful comments. All remaining errors are our own.†Fuqua School of Business, Duke University.‡Graduate School of Business, Columbia University.§Fuqua School of Business, Duke University.
empirical patterns of innovation and organizational structure across countries and industries using compre-
hensive firm-level data on firms in 15 European countries and the United States. By drawing upon existing
theories on innovation and organization, we show that the patterns are largely consistent with a Coasian
perspective of firm organization. We find that the organization of inventive activity in Europe systematically
varies with underlying technological features of the industry, but not in the United States or Great Britain.
Differences in the pursuit of innovation almost surely underlie the huge variations in productivity across
establishments, firms, and countries. In the US, with the same input, manufacturing plants at the 90th
percentile of the productivity distribution produce on average almost twice as much output as plants at the
10th percentile (Syverson, 2004). Only recently have scholars been able to rely on high-quality, firm-level data
to systematically analyze the factors behind these differences in productivity. These data-rich studies point
to several general factors, such as capital and labor unobserved heterogeneity, trade openness, and managerial
practices (see Syverson, 2010, for an excellent survey). Large and persistent disparities in productivity across
countries have also been attributed to differences in corporate governance and corporate law (Jones and
Romer, 2009). However, these studies have not been linked directly to differences in innovation. The goal of
this paper is to take one further step toward understanding the relationship between institutional differences,
organizational forms, and corporate performance across countries by exploring a comprehensive cross-country,
firm-level data set linking innovation and corporate structure.
Following Williamson (1975) and Chandler (1962, 1977, 1990), economists and business scholars have
pointed to the advantages of centrally managed organizations in managing and funding R&D and in marketing
and distributing new products, while corporate finance scholars have pointed to the benefits of internal
capital markets in lowering the cost of capital for R&D (Gertner, Scharfstein and Stein, 1994; Stein, 1997;
Belenzon and Berkovitz, 2010). These studies suggest that integrated and coordinated internal markets can
be superior for innovation. Research on emerging markets adds to the "bright-side" of internal markets by
emphasizing institutional benefits for firm performance in general (Khanna and Palepu, 1997; Khanna and
Rivkin, 2001) and for innovation in particular (Mahmood and Mitchell, 2004; Chang, Chung and Mahmood,
2006). Conversely, other studies emphasize the "dark side" of internal markets and suggesting the importance
of control and incentives in effective allocation of resources and employee motivation. Explanations for internal
market liabilities include reduced financial discipline for mediocre investments (Scharfstein and Stein, 2000;
Meyer, Milgrom, and Roberts, 1992; Rajan, Servaes, and Zingales, 2000) and less promising R&D projects
(Guedj and Scharfstein, 2004; Seru, 2012), organizational limitations including the reluctance to cannibalize
existing competencies in periods of disruptive innovations (Tushman and Anderson, 1986; Tripsas, 1997),
the over-reliance on existing knowledge (Rosenkopf and Almeida, 2003; Song, Almeida and Wu, 2003) that
results in an unwillingness to integrate new knowledge ("not-invented-here" syndrome), and an inability to
recognize and exploit external knowledge due to a lack of absorptive capacity (Cohen and Levinthal, 1990).
Such mixed evidence on which organizational form is optimal for the effi cient functioning of internal markets
calls for a closer examination of patterns of organizational structure. In this paper, we show that the nature
of technology, as well as the country institutional context, largely dictate the balance of trade-offs between
centrally managed coordination and distributed control.
2
We use a descriptive "just-the-facts" approach motivated by theory. We examine three distinctive organi-
zational forms– standalone firms, conglomerates, and corporate groups– each exhibiting specific governance
characteristics, and focus on the degree of centralization within each structure. The autonomy of standalone
firms offers the highest level of intellectual property rights protection– the ability of inventors to control and
appropriate the returns to their innovations (Teece, 1986; Cohen et al., 2000), resulting in robust incentives–
but standalone firms suffer the most from external financing constraints. Conglomerate divisions have access
to the conglomerate’s resources through internal markets, but intellectual property created by divisions is con-
trolled by headquarters and can be mobilized at the headquarters’discretion. Thus, centralized control and
the resulting weak property-rights regime create a relatively low-incentive environment in conglomerates. In
contrast, sharper boundaries between affi liates of corporate groups allow individual affi liates to retain greater
control of their resources, especially when external parties own equity in the affi liate (a common practice in
continental Europe). This results in both stronger incentives in affi liates through better intellectual property
rights protections, and access to the group’s resources. However, the greater decentralization of corporate
groups comes at the cost of more rigid internal markets because involvement of external parties in affi liates
(through equity, debt, or other contractual relations) imposes constraints and costs on resource mobilization.
Our basic argument therefore is that corporate groups should have a more decentralized structure than
conglomerates, because corporate group affi liates are incorporated as separate legal entities and often have
outside owners. These outside owners impose substantial constraints on headquarters’resource-mobilization
discretion, as well as guarantee credible measures of performance at the affi liate level on the basis of which
high-powered incentives can be established. Using variation across technologies, we aim to tease out benefits
and costs associated with decentralization. Consistent with Coasian logic, we expect a greater share of
innovation in decentralized structures, such as partly owned affi liates of corporate groups, in industries where
the benefits from decentralization are more significant. This should be especially true in countries where
barriers to forming corporate groups are low.
We base our analysis on a comprehensive data set of both private and publicly traded American and
European firms and match all corporate patents granted by the United States Patent and Trademark Offi ce
(USPTO) and the European Patent Offi ce (EPO) to these firms. We have identified about 64,000 firms (legal
entities) that hold at least one patent from the EPO or USPTO. Of these firms, about 60% are American,
11% German, 8% British, 4% French, and 5% Italian. We matched 776,030 USPTO and 532,894 EPO
patents. 73% of USPTO patents and 33% of EPO patents are held by American corporations. Germany
appears to be the most innovative European country, holding 12% and 28% of USPTO and EPO patents,
respectively. We sort the firms in our sample into four organizational categories using detailed ownership-
structure data: standalones, headquarters, and wholly owned and partly owned affi liates, listed by degree
of decentralization. Our empirical operationalization of organizational forms is more continuous along the
decentralization dimension: standalones directly correspond to the conceptual category of most centralized
standalone firm structure, headquarters and wholly owned affi liates capture the diverse semi-autonomy of
conglomerates, and partly owned affi liates represent the most decentralized structure of corporate groups.
Several novel findings emerge from our analysis. First, while the overall distribution of citations-weighted
3
USPTO patents by ownership structure in the whole sample is 18% standalones, 61% headquarters, and 21%
affi liates, in the United States this distribution is skewed toward standalones and headquarters, with 20%
and 66% respectively of patents falling in these categories, and only 14% of patents being held by affi liates.
In Europe, meanwhile, 50% of the patents are held by affi liates, and 10% and 40% respectively are held by
standalones and headquarters. There is also wide variation in organizational form across European countries.
While Germany resembles the United States in terms of concentration of innovation in headquarters (58%),
French and Italian firms are clearly skewed toward affi liates, with only 13% and 8% of their respective patents
being held by headquarters.
Second, we distinguish between affi liates that are wholly owned by their parent company and those with
minority shareholders. The presence of minority shareholders in an affi liate company establishes a separation
between the affi liate and its parent company in terms of retained profits, patent holdings, and resource
reallocation. In the United States less than one percent of patents are held by partly owned affi liates, while
in France and Italy about 20% of innovation takes place in affi liates with minority shareholders. Great Britain
has a unique structure, with 55% of British patents held by affi liates (as compared to only 14% of American
patents), but effectively all of these affi liates are wholly owned subsidiaries.
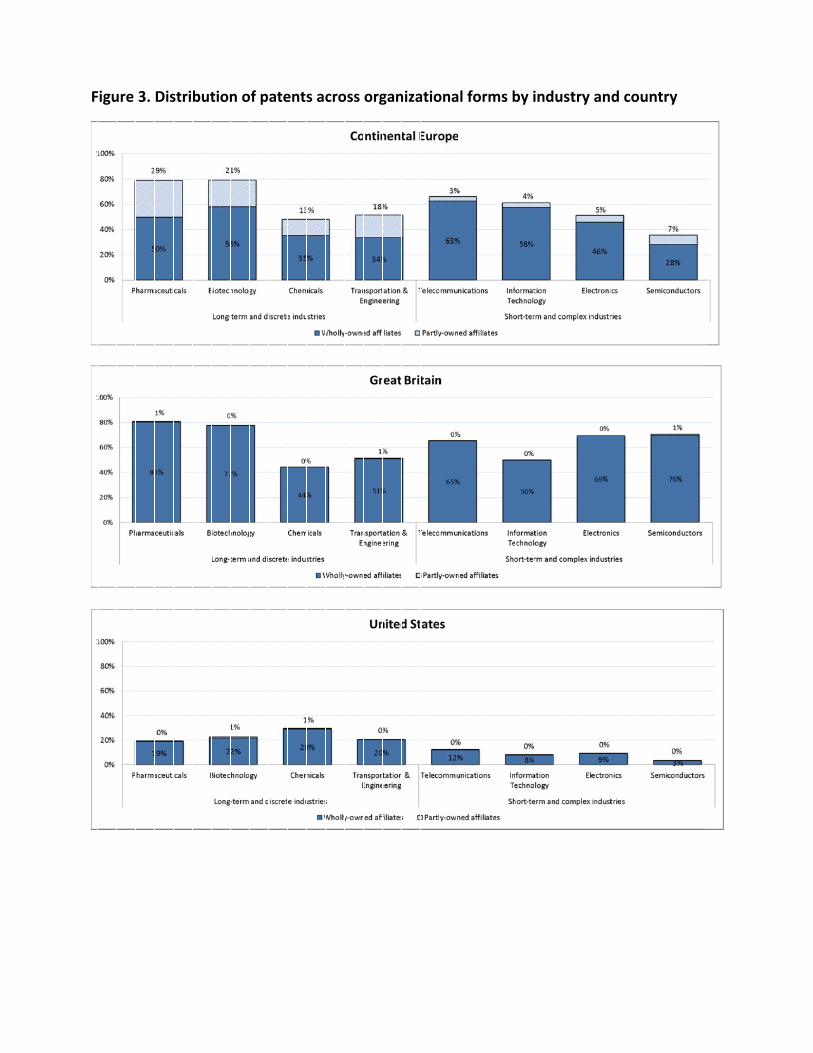
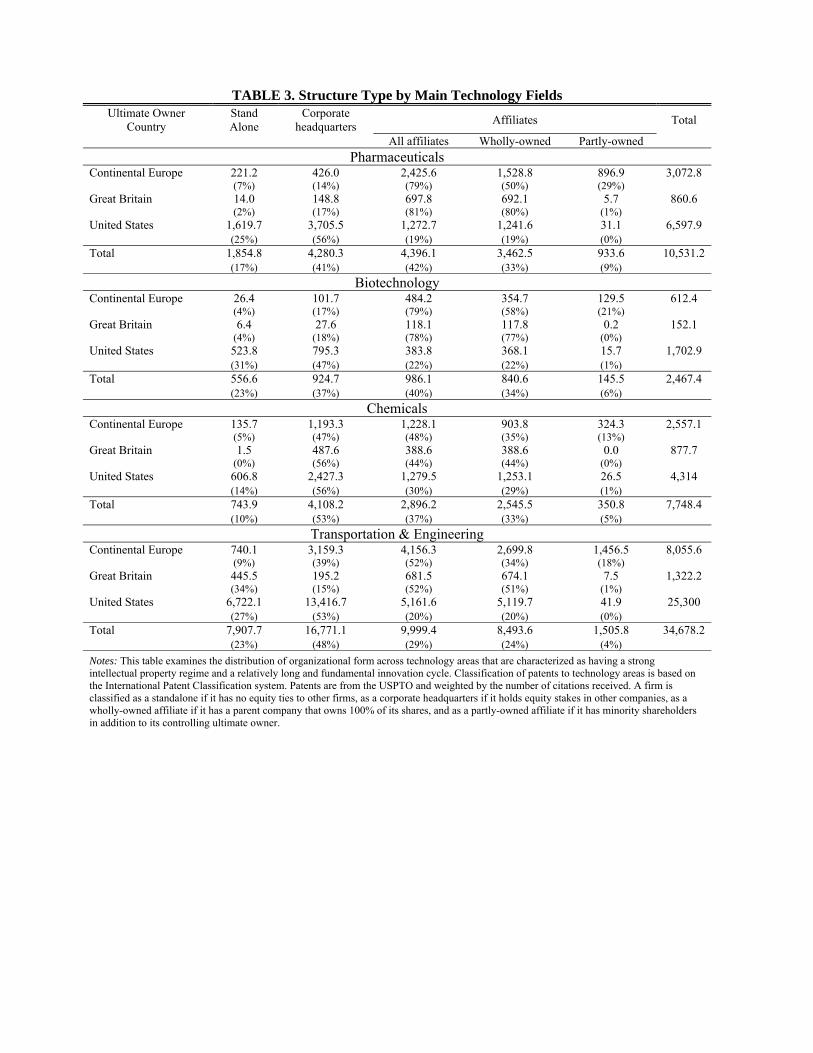
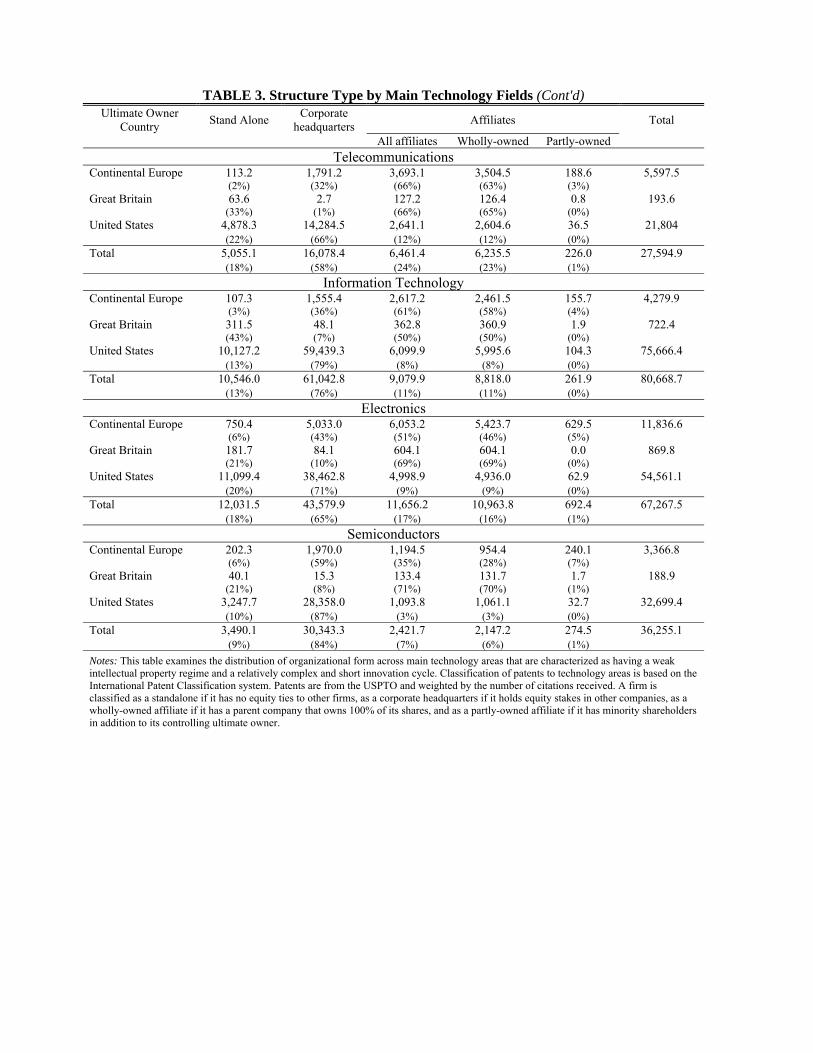
Third, we find substantial variation in organization structure across industries in continental Europe, but
not in the United States and Great Britain. In continental Europe, affi liates, especially partly owned, tend to
be concentrated in industries where innovation takes longer to complete and is less certain but has a higher
potential payoff. These innovative activities may be more vulnerable to hold-up problems and require greater
intellectual property rights protection for the innovator. In contrast, conglomerates are more prevalent
in industries with rapid, complex innovations, where the ability of conglomerates to identify the relevant
innovation and quickly redeploy assets may give this organizational form an edge over corporate groups.
For example, in Pharmaceuticals, partly owned affi liates hold close to 30% of the patents in continental
Europe but only 1% of patents in the United States and Great Britain. In the Telecommunications sector,
however, partly owned affi liates are rare, holding only 3% of continental European patents and less than 1%
of American and British patents. Thus, in more dynamic industries we do not observe substantial differences
in the way innovation is organized between continental Europe and the United States and Great Britain.
There may, of course, be reasons besides governance why we see this cross-industry pattern in organi-
zational form. For example, organizational capabilities in marketing new products and adapting quickly to
new economic conditions may also explain this cross-industry variation. Thus, our findings of high central-
ization of inventive activity in industries with a rapidly changing economic environments are consistent with
and reinforce organization flexibility theories (Daft, 1998). Governance and flexibility are inherently related,
as stronger governance builds upon decentralized decision-making and greater autonomy of corporate unit
managers (Aghion and Tirole, 1997). Similarly, flexibility in terms of frequent resource reallocation may
affect ex-ante incentives by inducing divisional managers to invest in more short-term projects (Seru, 2012;
Lerner and Wulf, 2007). Intellectual property rights and organizational form are also complements with
respect to the commercialization of inventions. In industries where commercialization is achieved at a more
aggregate level, by combining several interrelated inventions, the owner of a patent to a single invention may
4
be more vulnerable to hold-up problems by the organization. Put differently, high-powered incentives in the
form of equity stakes in a partly owned subsidiary is likely to be less effective in such industries. We would
then expect the centralized conglomerate organizational form to emerge in these industries and to see other
incentive mechanisms to induce R&D than intellectual property rights.
It is important to emphasize the limitations of our empirical approach. While theory clearly distinguishes
between discrete organizational forms, empirically, such sharp distinctions are diffi cult to make in a systematic
manner. We measure innovation using patents and then track how these are assigned to firms. We infer
organizational structure using inter-firm ownership ties, although we acknowledge that other dimensions,
such as social ties, are also likely to characterize links between firms. Developing more fine-grained measures
of internal structures of large organizations by harnessing new comprehensive data on ownership structures
and innovation indicators (which are becoming more rapidly available) is clearly a challenge for future work.
We note finally that our findings are broadly consistent with a Coasian view of firm organization– firms
choose the organizational form best suited to fostering innovative activities. The alternative, dominant view
in the literature on groups, especially when discussing complex partly owned structures with significant
separation between ownership and control, is that organizational form is chosen by entrenched managers or
controlling shareholders to suit their best interests at the expense of minority shareholders and overall firm
effi ciency (Bertrand et al., 2002; Morck et al., 2005). By this latter view it is not obvious that one should see
any systematic difference in organization form in a given country across industries.
2. Governance and Innovation
Organizational structure "involves how a firm is organized and governed, and how decisions actually are
made and carried out" (Nelson, 1991). The organizational form could be effi ciency-based, which means a
firm chooses the organizational form best suited to its goals and strategy (Coase, 1937; Williamson, 1975;
Chandler, 1962), or institutionally-driven, a view that holds external influences, such as legal, resource, and
social factors, shape firm structure (DiMaggio and Powell, 1983; Haunschild and Miner, 1997). We integrate
these two broad views and show that the interaction of the institutional environment and firm strategy
explains the patterns of innovation across industries and countries.
We distinguish between standalone firms, conglomerates, and corporate groups, and discuss unique fea-
tures and relative advantages and disadvantages of each form for innovative processes. While previous studies
on centralized and decentralized organizational forms typically contrast unified functional structures with mul-
tidivisional forms (e.g., Williamson, 1975; Nickerson and Zenger, 2002; Siggelkow and Levinthal, 2003), we
primarily compare the degree of centralization of conglomerates and corporate groups, focusing on relative
levels of flexibility and incentives for innovation in each form of governance. Due to the voluminous nature
of research in the separate fields of organization and innovation, we do not intend to provide a complete
review of the literature, and thus we purposefully keep our discussion concise and focus only on the most
important points specific to the context of this paper. Importantly, while we recognize the empirical diversity
of organizational structures, our theoretical framework distinguishing organizational forms into three distinct
5
categories deliberately keeps these distinctions sharp and parsimonious in order to highlight the effects of
key dimensions associated with different forms of innovative activities. In our empirical analysis, however,
we utilize more continuous measures of centralization.
2.1. Conglomerates
Perhaps the most studied organizational form is the American conglomerate, which consists of large multi-
unit firms operating in several industries (Amihud and Lev, 1981; Porter, 1987; Teece, 1982; Peteraf, 1993;
Chatterjee and Wernerfelt, 1991; Robins and Wiersema, 1995). A classic model of a conglomerate is an
"M-form" organization, where headquarters formulates and coordinates strategic direction for specialized
divisions (Chandler, 1962; Berle and Means, 1932). The larger size of conglomerates offers greater and more
diverse resources than otherwise would be available within a single division. These resources are redistributed
through conglomerate’s internal markets, guided by company headquarters, which ensure timely deployment
of critical resources to any part of the organization. An internal market allows organizations to mobilize
internal resources from one unit to another. Internal markets can operate similarly to external markets, where
prices regulate transactions, or they can be coordinated without prices by authority within the hierarchy. In
the following theoretical discussion we single out two main features of divisions that should strongly affect
the way in which internal markets operate: legal independence and the measurement of performance. We
also emphasize two characteristics that distinguish conglomerates from corporate groups.
The first distinguishing feature of conglomerates is the legal integration of their divisions. Unlike stand-
alone firms or business units of a corporate group, divisions of a conglomerate are not registered as legal
entities apart from their parent company. Legal independence may have important implications for decen-
tralization of control and overall resource mobilization, especially if that independence is associated with
greater direct interaction between divisions and external parties. Legally incorporated divisions can form
direct contracts with other firms, independently issue debt, and even sell equity. For non-incorporated divi-
sions, these activities are performed centrally by headquarters. To the extent that forming direct contractual
or ownership relations with external parties introduces friction to the process of resource mobilization, legal
status should have important implications for how internal markets operate. For instance, the presence of
minority owners in a legally independent unit should strongly affect the ability of headquarters to mobilize
resources to and from this affi liate. Because the rights of minority owners are protected, especially in the
developed countries we focus on in this paper, any internal transaction involving a partly owned unit has to be
contractual. Contractibility adds direct costs of negotiation and drafting contracts, but it can also decrease
incentives by headquarters to mobilize resources to and from partly owned units (Grossman and Hart, 1986;
Aghion and Tirole, 1994; Belenzon et al., 2012). Conversely, tight legal integration which eliminates potential
frictions to resource mobilization caused by outside stockholders allows for the quick and timely distribution
of resources to any part of the organization.
The second distinguishing feature of conglomerates is the measurement of division performance. Accurate
measurement of output in team production is critical to avoiding free-rider problems, and according to trans-
action cost economics logic it is a central mechanism driving firm boundaries (Alchian and Demsetz, 1972;
6
Jensen and Meckling, 1976; Jensen, 1986). Although divisional structure allows top management to reward
managers based on business unit performance relative to functional units in standalone firms (Williamson,
1991), individual divisions do not disclose independent financial reports, especially when they are not incor-
porated. Even for conglomerates that utilize internal accounting systems aimed at disaggregating earnings to
the level of each profit center, such systems are likely to be vulnerable to opportunism and not be externally
enforceable (Williamson, 1991; Rajan, Servaes, and Zingales, 2000; Galunic and Eisenhardt, 2001). Thus, a
lack of disaggregated performance measures (combined with costly monitoring) results in a weakened link be-
tween performance and rewards and reduction in incentive intensity facing divisional managers (Williamson,
1975; Holmstrom, 1999). Additionally, greater intervention by headquarters in resource mobilization can
further distort incentives for individual divisions to innovate, as in the absence of a reliable accounting sys-
tem, profits generated by own innovations may be reallocated elsewhere, and other critical resources (such as
intellectual property and human capital) could be redeployed (Seru, 2012).
Incentives are especially important for innovation in the context of long-term investments with highly
uncertain payoffs. Several studies emphasize how low-powered incentives in conglomerates may affect inno-
vation. The evidence is mixed. The general conclusion coming from the strategy field is that centralization
is associated with stronger incentives for long-term risky innovation, and decentralization is better suited
for more applied research. For example, Cockburn et al. (1999) find that intensity of incentives for applied
research is lower in organizations where decision-making authority is centralized, due to differing monitoring
systems in centralized and decentralized structures. Lerner and Wulf (2007) find similar evidence emphasizing
the superiority of centralized structures for setting up incentives for longer-term risky projects. While not
addressing incentives directly, Arora et al. (2012) use data on patent assignment to systematically infer the
internal structure of R&D for large American corporations and present strong evidence of a negative rela-
tionship between basic research and decentralization. Using survey data, Argyres and Silverman (2004) find
a similar relationship– centralized R&D is less applied and generates innovations that build on a wider range
of technologies and are of higher impact. On the other hand, finance scholarship emphasizes the "dark side"
of centralization, where agency problems and "corporate socialism" are seen as major sources of ineffi ciency.
For example, Seru (2012) finds that publicly traded American conglomerates with above-average realloca-
tion of funds across divisions are less productive innovators than comparable standalone firms. Guedj and
Scharfstein (2004) compare clinical trials in the biopharmaceutical industry and find that big pharmaceutical
firms engaged in cancer research tend to initiate too many studies but are quicker to terminate unpromising
research than smaller (standalone) biotech firms.
To summarize, conglomerates have two distinct features, which are central to our analysis: lack of legal
status for divisions and profit consolidation, both of which allow conglomerates to develop and utilize internal
markets. These internal markets play a central role in shaping incentives for innovative activities and the
degree of coordination among units. Centralized structures with low-powered incentives can contribute to
effective interdivisional coordination but can be costly in terms of controls on division-level decision-making
and performance. Legal integration and the diffi culty in measuring division-level performance may make
hierarchy-based internal markets more effi cient than price-based internal markets, especially in industries
7
where fast mobilization of resources is necessary. Since establishing performance evaluation metrics for
each price-based exchange requires significant time and effort on the part of headquarters compared to
discretionary allocations, lack of prices can contribute to more flexible and responsive internal markets in
centralized structures. Thus, they can prove to be advantageous for firms where fast reallocation of resources
is important.
2.2. Corporate Groups
Accounts of business groups in emerging markets (Caves and Uesaka, 1976; Strachan, 1976; Leff, 1978;
Ghemawat and Khanna, 1998) and corporate groups in developed markets (Faccio and Lang, 2002; Faccio, et
al., 2010; Belenzon and Berkovitz, 2010; Belenzon et al., 2012) have highlighted the prevalence and economic
significance of collections of legally independent firms linked by social and ownership ties and controlled by an
ultimate owner. Corporate groups feature firm-like centralized coordinated control by the ultimate owner and
varying degrees of market-like transactions between the affi liates (Khanna and Palepu, 1997; Granovetter,
2005; Khanna and Yafeh, 2007), and thus have blurred the traditionally sharp boundaries between markets
and hierarchies described by transaction cost economics (Coase, 1937; Williamson, 1975).
The study of corporate groups highlights the firm-like feature of mutual ties, which facilitate effi cient
reallocation of resources within the group (Guillén, 2000; Khanna and Palepu, 1999; Belenzon and Berkovitz,
2010), provide cross-subsidies to distressed affi liates, and utilize internal markets to substitute missing or
dysfunctional external institutions (Leff, 1978; Khanna and Palepu, 1997; Khanna and Rivkin, 2001), with
positive effects on innovation in particular (Mahmood and Mitchell, 2004; Chang, Chung and Mahmood,
2006). Another stream of research, primarily in the context of developing economies and family-controlled
groups, highlights the negative features of corporate groups, such as utilization of group structure for diverting
cash flows from affi liates with minority owners– "tunneling" (La Porta et al., 1997, 1999; Johnson et al., 2000;
Bertrand et al., 2002; Bae et al., 2002; Morck et al., 2005), and building indirect ownership arrangements
to control more affi liates– "pyramiding" (Almeida and Wolfenzon, 2006; Barca and Becht, 2001; Claessens
et al., 2000, 2002; Chang, 2003). Recent debates suggest that the findings of these studies highlighting
the "negative" side of corporate groups may be subject to reinterpretation, and remain largely inconclusive
(Bebchuk et al., 2000; Khanna and Yafeh, 2007).
In this paper we single out unique features of corporate groups that make them more decentralized than
conglomerates. We focus on the relative independence of group affi liates and explain how it may be related
to the organization of inventive activity. Following the preceding discussion on conglomerates, we emphasize
legal independence and credible division performance as the main distinguishing features of decentralization
of corporate groups relative to conglomerates.
Perhaps the most important difference between a group affi liate and a division of a conglomerate is the
legal status of affi liates. As discussed above, while divisions of conglomerates do not usually have a separate
legal identity, corporate group affi liates are incorporated as distinct legal entities. This allows an affi liate to
behave much like a standalone firm: it can sell equity to outside investors (as well as issue debt and form
independent contracts), form its own board of directors, and file separate unconsolidated financial reports–
8
actions that are not available to conglomerate units. The legal independence of affi liates generates a functional
and organizational separation between affi liates and the rest of the group. Of course, this separation is not
discrete and is likely to vary substantially along many dimensions (Belenzon et al., 2012, present a detailed
analysis of this issue). However, compared to conglomerates, corporate groups should be more decentralized
as indicated by the degree of functional separation and relative autonomy of decision-making.
This decentralization within corporate groups results in their internal markets functioning more like
external markets, which are primarily coordinated by prices rather than hierarchy. The separation between
ownership and control is especially pronounced in groups that have affi liates with outside stockholders.
Unlike division managers of conglomerates, minority owners are highly protected by country legal institutions.
Thus, disputes involving group affi liates can be taken to courts, unlike internal disputes of a conglomerate
(Williamson, 1991). As a result, shared ownership reduces the flexibility of internal markets in groups, so
moving resources between affi liates is typically associated with more friction than moving resources between
conglomerate divisions.
On the other hand, unconsolidated financial reports and the presence of minority owners ensure that
resources and profits generated by the affi liate would not be shifted to another unit without proper com-
pensation. Measurement of performance at the affi liate level is therefore separable and credible, particularly
where misrepresentation of actual performance in a partly owned affi liate is a violation of minority shareholder
rights. This allows affi liate managers to be compensated directly on the basis of unit-level performance– very
similar to the high-powered incentives managers in venture capitalist—backed standalone firms face. More-
over, as an independent legal entity, an affi liate can assign the patents it generates to itself, and the presence
of minority owners ensures that intellectual property rights are assigned to the inventing unit. Thus, control
over own resources and greater transparency of measured outcomes in affi liates contribute to high-powered
incentives for innovation and lower free-riding tendencies in corporate groups.
The corporate group structure, especially in partly owned affi liates, introduces an interesting trade-off
that to the best of our knowledge has not been systematically addressed in previous research. On one hand,
prices can drive imperfect coordination and exchange in the internal markets of corporate groups– especially
when partly owned affi liates are involved. On the other hand, these rigidities in the internal markets provide
stronger incentives for innovation. In the next section we argue that this trade-off relies on the nature of
innovation: faster-paced, more complex innovation would benefit more from the flexibility and coordination
inherent in conglomerate internal markets, and slower, more discrete innovation would benefit more from the
constrained but incentive-intensive internal markets of corporate groups.
It is important to emphasize that in our empirical analysis, partial ownership represents one of the highest
forms of decentralization, where external regulations protecting minority owners necessitate price-mediated
transactions closely resembling the exchanges in external markets. While we focus the theoretical discussion
and empirical analysis on partly owned affi liates to illuminate the decentralized organizational form, we also
recognize that wholly owned affi liates display a wide variation in the degree of their independence, and that
other factors can contribute to organizational cohesion and centralization. However, data constraints do not
allow us to systematically observe and measure such independence in wholly owned affi liates. Thus, our
9
analysis is limited to variations in ownership structure. Alternative and more subtle ways to discriminate the
degree of organizational decentralization are left for future research.
2.3. Standalone Firms
Standalone firms are independent entities with no controlling equity ties to other firms. They are the most
autonomous form of organization in terms of both legal status and performance measurement, as their
interaction with other firms is entirely market-based rather than mediated through centralized coordination.
This ownership structure provides the strongest incentives to innovate, as the owners have direct and large
stakes in the future profits the firm generates. This is especially true when managers hold equity stakes in
their firms. As such, the incentives among different owners are largely aligned, and agency problems are
likely to be mitigated due to strong governance in the form of tight monitoring and high-powered incentives
(Holmstrom, 1989).
On the other hand, standalone firms do not have access to extensive internal markets. They rely primarily
on external markets for resources, and therefore are more vulnerable to fluctuations and frictions in their
environments compared to conglomerates and corporate group affi liates (Himmelberg and Peterson, 1994;
Stein, 1997). Standalone firms may have diffi culty raising capital for risky and uncertain R&D, sourcing
human capital and technologies for innovative activities, and developing timely commercialization of innova-
tions. These constraints would be magnified if external capital and labor markets are ineffi cient and the legal
environment provides weak enforcement of intellectual property protection.
In the proceeding analysis, a standalone structure is contrasted with the more complex structures of
conglomerates and corporate groups mainly on its relative prevalence across countries and industries. Due
to the lack of extensive internal markets in standalones, the primary structural trade-offs we are interested
in are between conglomerate and corporate group forms, which is the focus of the next section.
3. The Nature of Innovation
We consider two industry dimensions which we identify as key drivers of the trade-offs discussed in the
previous section. These dimensions are how discrete or complex innovations are in the industry, and how
fast or slow the innovation cycle is in the industry. We consider how these characteristics affect the relative
advantage of each organizational form.
3.1. Complex vs. Discrete
We classify industries as complex or discrete from a commercialization standpoint and determine how internal
markets interact with the nature of technology. Products in industries with complex innovations comprise a
set of multiple components integrated into a coherent whole, while products in discrete industries require fewer
elements. Product complexity in this categorization is a matter of degree, and closely aligns with the concept
of architectural innovation, which distinguishes between core technological knowledge within each component
and architectural knowledge about the relationship between the individual components (Henderson and Clark,
10
1990). Complex products require both core knowledge within each technology and integrative knowledge of
how technologies fit together, but discrete products rely less on integrative knowledge due to fewer components
that make up the final product.
Each type of innovation introduces tradeoffs in organizational form along two main dimensions: cost of
coordination and incentives. We contend that firms producing complex products are likely to benefit from
centralized structures, because they can economize on coordination costs through centralized management
and design alternative incentive structures to mitigate weakened unit-level incentives. On the other hand, co-
ordination between units is less critical for discrete products, and linking effort directly to unit-level outcomes
is more feasible, thus decentralized structures are better suited for commercializing discrete products.
Costs of coordination can increase with product complexity. Commercializing complex innovations en-
tails a larger degree of integrative knowledge and greater communication and coordination between various
organizational units. Since firms can economize on information processing by specializing in particular types
of information within each internal unit, it becomes more costly for firms producing complex products to
delegate both component-specific and integrative functions to individual units (Arrow, 1974; Bolton and
Dewatripont, 1994). In order to allow individual units to focus on their own knowledge domains, centralized
governance can take on the coordination role and utilize internal markets to facilitate effi cient transfer and
combination of knowledge and resources (Amit and Schoemaker, 1993; Dierickx and Cool, 1989; Mahoney
and Pandian, 1992; Peteraf, 1993; Teece, Pisano, and Shuen, 1997). Thus, centralized coordination can better
foster knowledge spillovers across divisional boundaries (Teece, 1982). Consistent with these notions, Argyres
and Silverman (2004) confirm that firms with centralized coordination of innovative activities typically pursue
research encompassing a broader range of technological areas than firms with more decentralized structures.
Since complex product innovation combines inputs from several distinct technological and functional areas,
the process can blur the link between effort and performance, and therefore result in weaker incentives, reduced
individual effort, and increased free-riding (Williamson, 1975; Holmstrom and Milgrom, 1994). Thus, typical
unit-level incentive structures are not as effective in commercializing complex products. Instead, centrally
coordinated research efforts can mitigate measurement problems by taking on the responsibility for initiatives
and outcomes and using promotion-based incentives to encourage collaboration (Cockburn, Henderson and
Stern, 1999). Consistent with this notion, from a licensing standpoint, Arora et al. (2012) show that
for narrower and focused technologies, licensing decisions will be decentralized and delegated to business
units, while licensing authority of more general-purpose technologies will be centralized at headquarters
level, because business unit-level incentives are insuffi cient for licensing such technologies. Therefore, a high
degree of legal integration combined with centralized decision-making and resource allocation processes make
conglomerate structures more advantageous than other organizational forms in industries where significant
internal recombination and coordination are important to commercialize a product.
On the other hand, when innovation is discrete, there are fewer distinct components to combine for a
final product, thus internal coordination across units is not as critical. Firms can economize on information
processing by delegating product-specific knowledge management to individual units. At the same time,
low interdependency of inputs across units creates a tighter link between inputs and outcomes within units,
11
making stronger incentive regimes more valuable for discrete products than integrated internal markets.
Thus, decentralized structure of corporate groups is more conducive to development of discrete innovations,
because it allows unit-level specialization without high degree of integration across units and offers an overall
stronger unit-based incentives environment than conglomerates, especially where minority owners are present.
Stronger incentives within group affi liates stem from two main factors. First, the greater independence of
affi liates offers a stronger link between effort and outcomes, resulting in an incentive regime appropriate for
discrete technology. Second, affi liates are further incentivized to exert effort because relative immobility of
their resources, such as intellectual property assigned to the inventing affi liate, allows them to appropriate
the returns from their own innovations.
Overall, our discussion points to a clear advantage of integration and aggregation when innovation is
complex, and strong advantages to decentralization and disaggregation when innovation is more discrete.
3.2. Long vs. Short Innovation Cycles
The length of an innovation cycle can have important consequences for the types of innovations pursued by
different organizational forms. Some technologies take much longer to develop than others, requiring greater
and prolonged commitment of resources. Products with lengthy development phases do not generate imme-
diate cash flows, and the outcomes of long-term projects are typically highly uncertain, making investments
into these types of innovations highly risky. Standalone firms that depend primarily on external markets
for resources would face greater diffi culties obtaining commitment of external funding for long-term risky
projects. In contrast, organizational forms with active internal markets have an advantage in industries
with longer innovation cycles, as they can invest internal funds in these types of projects and commit their
resources for an extended period of time.
We argue that corporate groups should be better positioned to support innovations with longer develop-
ment cycles than conglomerates. This is for two reasons. First, better measurability of affi liate performance
in corporate groups allows for the effective evaluation of the long-term performance of a unit, because transi-
tory shocks are less confounding over extended milestones of a project than for innovations that are assessed
more frequently and therefore can be subject to random shocks in demand and technology. Second, legal
independence of affi liates results in more rigid internal markets in corporate groups than in conglomerates,
which can be advantageous when the need to redeploy resources is infrequent but greater control and stability
of resources is critical, as when the innovation cycle is long.
When the innovation cycle is short, the need for readjustment of resources is likely to be more frequent,
in which case having a frictionless internal market would be more valuable (Teece and Pisano, 1994; Teece
et al., 1997). Highly integrated and flexible internal markets of conglomerates allow fast recombination and
transfer of resources in response to investment opportunities (Aghion and Tirole, 1997). When uncertainty
arises from frequent disturbances, gains from effective internal market coordination can offset incentive losses
associated with highly integrated and consolidated internal markets (Williamson, 1991; 1995). The winner-
picking advantage of conglomerates would be especially strong in industries with a faster pace of technology
change (Stein, 1997). Thus, the centralized conglomerate form may provide an advantage in industries with
12
short innovation cycles.
In sum, it is clear that different organizational forms present complex trade-offs regarding innovative
activities. The Coasian perspective of firm organization predicts clear advantages of decentralized organi-
zational forms, such as corporate groups, in industries where technologies are more discrete and that have
longer development cycles. On the other hand, more centralized organizational forms, such as conglomerates,
should have an advantage in industries where technologies are more complex and innovation has shorter
development cycles– making resource recombination more frequent.
3.3. Country Institutions
While we argue that the choice of organizing innovative activity depends largely on industry characteristics,
such as the degree of product complexity and pace of technology development, institutional context can
shape and limit the flexibility of firms’choice (Milgrom and Roberts, 1992; Hall and Soskice, 2001). In some
cases, strong traditions of industrial and university research determine national or regional technological
specialization, which can influence the types of innovation firms engage in and consequently dictate the
predominance of certain organizational forms (Freeman, 1995). In other cases, the legal environment can
provide a safe haven for or severely limit some governance structures (La Porta et al., 1999). In this section
we briefly discuss how variations in institutional contexts across our sample countries are likely to mediate
or obscure industry effects on organizational form, despite similarities including the countries’ degrees of
economic and regulatory development.
Three institutional factors are particularly relevant: development of external factor markets, the degree
of legal protection of minority owners, and tax regulations favoring or discriminating against certain organi-
zational forms. First, where factor markets are lacking, internal markets become more important (Gertner,
Scharfstein and Stein, 1994; Himmelberg and Peterson, 1994; Stein, 1997). Thus, conglomerates and affi liates
of corporate groups gain advantage over standalone firms where access to external capital and specialized
labor, for example, is more challenging. Second, legal protection of minority owners against expropriation
strengthens the autonomy of partly owned affi liates of corporate groups and thereby contributes to greater
decentralization within groups (La Porta et al., 1999). Greater independence of affi liates in corporate groups
becomes an advantage in industries where decentralization and the resulting stronger incentives at the unit
level are more important for innovation. However, the independence and unit-based incentives can become a
liability in industries where flexibility and greater coordination among units are necessary. Third, in countries
with additional taxes on intercompany dividends– income transfers among group affi liates– organizing as a
corporate group becomes more costly. For example, in the United States, dividend income transferred from
a subsidiary to the parent company is subject to an additional 7.5 percent tax (Morck, 2005). A similar tax
does not apply to conglomerates who are allowed to consolidate their earnings, and these taxes on intra-group
transactions do not exist in Europe. As illustrated, variations in institutional factors can significantly affect
organizational choices, distorting the effects of the nature of technology on organizational form.
13
4. Data
Our paper combines data from several sources: (1) firm and ownership data from Amadeus for European
firms and from Icarus for American firms (both are provided by Bureau van Dijk), (2) information on patents
from the United States Patent and Trademark Offi ce (USPTO), and (3) the European Patent Offi ce (EPO).
The Bureau van Dijk data, which has comprehensive cross-sectional coverage, is collected from various
government sources in Europe. We have name and address information for practically all firms in Europe
and the United States, which we use in matching patents. However, these data have several limitations.
First, in some European countries, reporting of financial information is not mandatory for very small firms.
For example, in Great Britain, companies with fewer than 10 employees do not have to report financial
information, such as sales and number of employees, in their annual reports. In France, on the other hand, all
firms are obligated to report financial information. To mitigate this selection issue, we make no restrictions
on the availability of financial items when including firms in our sample. Moreover, as our goal is to map
inventive activity across organization forms, it is unlikely that the observed pattern would be driven by
very small firms, as the vast majority of patents are generated by large corporations. Second, ownership
information is central to our analysis. Should ownership coverage vary systematically across countries, then
our findings may be biased.
A priori there is no reason to suspect that the ownership data is systematically biased. The ownership
data is collected by a large international team of researchers and analysts that track company reports, news,
and other public sources that provide ownership information. There are about 4 million firms in our data
for which ownership information is available (these firms are included in the ownership algorithm described
below). However, there still may be some noise in our ownership data, especially for smaller firms, that
may potentially bias our findings. To mitigate the potential measurement bias, we hand-collect ownership
information on the top 20 companies for the major countries in our sample from financial reports and various
public sources. We confirm that the data for these firms as reported by Bureau van Dijk is accurate, and that
the same patterns we observe for the whole sample also holds for the restricted sample of large corporations.
We also randomly check the information provided by Bureau van Dijk for numerous firms by directly accessing
company houses in different countries as well as firm websites. Again, we find very few discrepancies between
the Bureau van Dijk data and the information from public sources.
4.1. Ownership
While our theoretical discussion clearly distinguishes between organizational forms, empirically, such sharp
distinctions are diffi cult to make in a systematic manner. Since we do not observe various types of innovations
and internal divisions, we measure innovation using patents and track how these patents are assigned to
firms. We infer organizational structure using inter-firm ownership ties. We utilize these ties to systematically
measure the degree of centralization in various organizational structures. Specifically, in the empirical analysis
we emphasize the continuum of centralization measured by ownership structure and examine the pattern of
independence and inventive activity across industries and countries.
14
The Amadeus and Icarus data sets contain detailed information on direct ownership links between firms.
We sort firms into four different categories based on their ownership structure: (i) standalones, (ii) headquar-
A firm is categorized as a standalone if it has no equity ties to any other firm, as a headquarters if it is at
the apex of a group of firms, as a wholly owned affi liate if a parent company owns 100% of its shares, and as
a partly owned affi liate if it has both a parent-company controlling-shareholder and minority shareholders.
The diversity of organizational forms complicates sorting of firms into conceptual categories. Conglom-
erates that operate solely internal, legally integrated divisions are empirically indistinguishable from unitary
functionally organized standalone firms, and conglomerates with external, legally independent divisions re-
semble corporate groups with wholly owned affi liates. Since making clear distinctions between standalone,
conglomerate, and corporate group structures is very diffi cult to do systematically in the data, we utilize
variation in ownership structure to create a more continuous measure of firm-level centralization that allows
us to examine patterns of innovative activity across industries and countries along this dimension.
The operationalization of standalone firms corresponds directly with the theory, but it is important
to reiterate that this empirical categorization does not distinguish between unitary functionally organized
standalone firms and multidivisional firms, in which all divisions are internal and are not separate legal entities.
Thus, the standalone category represents the most centralized structure. Headquarters represents the next
most centralized structure and is conceptually equivalent to conglomerates with legally independent divisions.
Wholly owned affi liates represent a form between centralized and decentralized structures, since they are
entirely owned and controlled by their ultimate owner, but they are more independent, as they are legally
separate from their ultimate owner. In the context of our analysis there is little difference between a division
of a conglomerate and a wholly owned subsidiary1,2, with each representing a semi-decentralized structure.
Partly owned affi liates are the most decentralized form in our analysis, as they are legally independent from
their ultimate owner and also have minority owners. The presence of minority shareholders in an affi liate
company establishes a sharper separation between the affi liate and its parent company in terms of retained
profits, patent holdings, and resource reallocation. Thus, partly owned affi liates are most representative of
the corporate group structure discussed in the theory section. Exploiting variation in the ownership structure
allows us to operationalize conceptually distinct yet empirically murky organizational forms in a much more
systematic and continuous manner than has otherwise been possible in the literature.
To fully characterize the ownership structure of firms in our sample, we use ownership link information
for private and public American and European firms from the ownership section of the 2008 version of Icarus
and Amadeus. To ensure that all ownership links represent control, we take the following steps: i) for private
1The case of wholly owned affi liates can be potentially studied in the context of delegated authority, lying somewhere betweenno control (the employee case) and full control (the owner case). Quoting Oliver Hart (1995): “If firm A buys firm B andconverts it into a wholly owned subsidiary, then it is often argued that the managers of firm B have more control and authority(‘independence’) than if firm A merges with firm B.”
2Future research should extend our model to allow for informal delegation. Examples include: (i) Centralized personnelmanagement and its career-oriented administration make it diffi cult for the HQs to differentiate and isolate internal divisionsin terms of pay, status, transfers, etc. (ii) Subsidiaries are apparently treated differently from internal divisions. There aredifferences in terms of pay, status, and future career prospects between internal divisions and subsidiaries. (iii) Both employeesand communities tend to accept differential treatments across legal boundaries.
15
subsidiaries, we keep only links where the shareholder has at least 50% of the voting rights, and ii) for public
firms we keep only links where the shareholder has at least 20% of the voting rights. This leaves us with close
to one million ownership links.3 To infer group structure from these links, we use the algorithm developed
and described in Belenzon and Berkovitz (2010). This algorithm constructs corporate ownership chains and
groups together firms controlled by the same ultimate owner.4
Some of the affi liated firms in our sample, especially those that are wholly owned, have no substantial
economic activity and exist only for tax or accounting reasons. To avoid including economically insignificant
firms that may influence the classification of firms as standalones and headquarters, we classify a firm as
headquarters only if it has affi liates with real economic activity (in determining whether a firm controls other
firms, we include both innovating and non-innovating firms); we do so by excluding affi liates that generate less
than $1 million in annual sales and employ fewer than 20 employees. Moreover, as the goal of this paper is to
explore stable organizational forms, we exclude groups that are held by private equity and other investment
institutions, as well as joint ventures. The sample we end up with has 63 percent standalones, 11 percent
To create a firm-level measure of innovation, we examine patent-based indicators of technological advances by
firms. We use patent data to measure innovative activity because we do not have direct information on R&D
expenditures for private firms. Our patent data builds upon Belenzon and Berkovitz (2010), who matched
EPO and USPTO patents to the complete set of Amadeus firms. We extend their data to include American
firms by matching patents to Icarus, and update the European matching to include patents granted up to
2007. For the USPTO, our source of information is an updated version of the NBER file which covers the
period 1975—2007.
For the EPO, our main information source is the 2007 publication of the PATSTAT database, which is
the standard source for European patent data and is published by the OECD. This database contains all
European patent applications and granted patents from the beginning of the EPO system in 1978 to 2007.
For each USPTO and EPO patent document we have information on the name of the firm to which the
patent is assigned as well as the firm’s address. We match the name and the address fields from the patent
3Erring on the side of caution, we define control of a private firm as ownership at least 50% of the firm’s voting rights (excludingnon-voting shares). Following previous literature on public firms (La Porta et al., 1999; Faccio and Lang, 2002; and others),which have a more dispersed ownership, we set the threshold for control of a public firm at 20%. All our results are robust todifferent numbers for these thresholds.
4We conduct several robustness tests to check the sensitivity of our findings to ownership assumptions. For control assumptions,the same pattern of results continues to hold for ownership thresholds of 40% and 25% for private firms, and 10% for public firms.Furthermore, we construct corporate group structures using the algorithm developed by Almeida, Yong Park, Subrahmanyam,and Wolfenzon (2007) (AYPSW). The advantage of AYPSW over our algorithm is that it better deals with cases of cross-holdings(e.g., firm A owns 50% of firm B, and firm B owns 50% of firm A); however, our algorithm better handles very large ownershipdata sets and is more robust to missing ownership links. For reasons of computational power we are not able to run the AYPSWalgorithm on our full set of firms. Although restricting the sample is problematic, the general pattern that emerges highlyresembles the one generated by our algorithm. While cross-holdings are prevalent in East Asian countries, where the AYPSWalgorithm was first implemented, we find that cross-holdings are very rare in Europe. Only 0.01% of the ownership chains ouralgorithm generates are associated with some form of cross-holdings. In the vast majority of cases with cross-holdings, they donot involve the ultimate owner; thus, the classification of firms to the different organizational form categories is not affected.
16
document to the name and address fields in Amadeus and Icarus. To control for patent quality, we weight
patents by the number of citations they receive, excluding self-citations (that is, a citation from one patent
to a predecessor patent that is held by the same citing firm), in a period of five years after they are granted.
Using a short citation lag allows us to avoid truncation problems that are associated with comparing patents
of different ages. However, we examine the sensitivity of our results to longer citation lags, and find practically
the same pattern of results when using citation lags of five, ten, and twenty years. We control for cohort
and technology area effects using the weighting scheme proposed by Trajtenberg (1990). For each patent, we
divide the number of citations it receives by the average number of citations received by all patents granted
at the same year and classified under the same three-digit technology class.
It is important to note that we make no restrictions on the availability of accounting information for our
sample firms. That is, every firm that was matched to the patent data sets is included in our analysis. While
the coverage of accounting information is likely to vary across countries, especially for very small firms, the
coverage of names and addresses is constant across countries regardless of firm size. The general pattern of
results continues to hold when we exclude firms for which we have no accounting information, or firms with
less than 20 employees (this threshold tends to reduce differences in coverage across countries).5,6
Figure 1 demonstrates the variation we aim to capture with our data. The top portion of Figure 1
illustrates the corporate structure and the assignment of patents for IBM. It is clear from this figure that
almost all patents that IBM generates are assigned to headquarters (the apex firm). IBM appears to be highly
integrated, with most of its units held internally, while the most economically significant of its 195 legally
independent subsidiaries are wholly owned by the headquarters. The wholly owned incorporated units are
assigned a negligible fraction of IBM’s patents. In contrast, the second figure illustrates the Nestle corporate
group, which exhibits a much more decentralized structure. The Nestle group includes 431 legally independent
units, many of which are partly owned and demonstrate significant economic activity, as indicated by sales
and patenting. Unlike IBM, the apex firm Nestle does not own many of the group patents, but instead the
partly owned affi liate L’Oreal holds the majority of patents in the group.
5Although we do not exclude firms from our sample if they do not report financial information, some interesting observationsemerge from examining only firms for which financial information is available. Standalone firms tend to be substantially smallerthan conglomerates and partly owned affi liates, which do not differ much in size. The average standalone firm has 177 employees(a median of 20), and about $100 million in annual sales (a median of $8.3 million). The average conglomerate has 3,650 employees(a median of 136), and $918 million in annual sales (a median of $14.3 million). The average partly owned affi liate has 2,400employees (a median of 214), and about $1 billion (a median of $65 million). Comparing conglomerates to partly owned affi liates,the different in mean size (annual sales) is not significant (a t-stat of -0.482).
6On average, firms in our sample hold 15 USPTO patents and 10 EPO patents. Groups also hold on average more USPTOpatents than EPO patents: 686 and 609, respectively. The US firms hold more than 3 times more USPTO patents than EPOpatents (20 versus 6), but the patents assigned to US groups are spread more evenly between USPTO (686 patents) and EPO(523 patents). While firms in Great Britain hold more EPO patents (7 versus 5), groups in Great Britain hold more USPTOpatents than EPO patents (741 and 730, respectively). Firms and groups in other European countries hold more EPO patentsthan from USPTO, as expected. German firms are most innovative and hold on average 15 USPTO and 26 EPO patents. Thenumber of USPTO patents among French firms is much lower at around 8 patents compared to average of 21 EPO patents. TheItalian firms hold about 2 patents from USPTO and 4 patents from EPO.
17
5. Findings
5.1. Comparison Across Countries
Our analysis shows that technology affects within-country variation of organizational forms in Europe, but
the effect is not evident in the United States or Great Britain. We show that the mediating role of technology
in driving the organizational form depends not only on the nature of technology itself, but also on the
institutional context the firms operate in. To accomplish this, we first explore cross-country variations
independent of technology and then examine how these cross-country differences vary by key technology
dimensions. The methodology is evocative of difference-in-difference approach, as we examine how differences
in organizational form between countries are driven by technology characteristics. We provide descriptive
statistics to outline the overall pattern and then use regression analysis to rule out effects of various covariates
and establish the significance of observed differences.
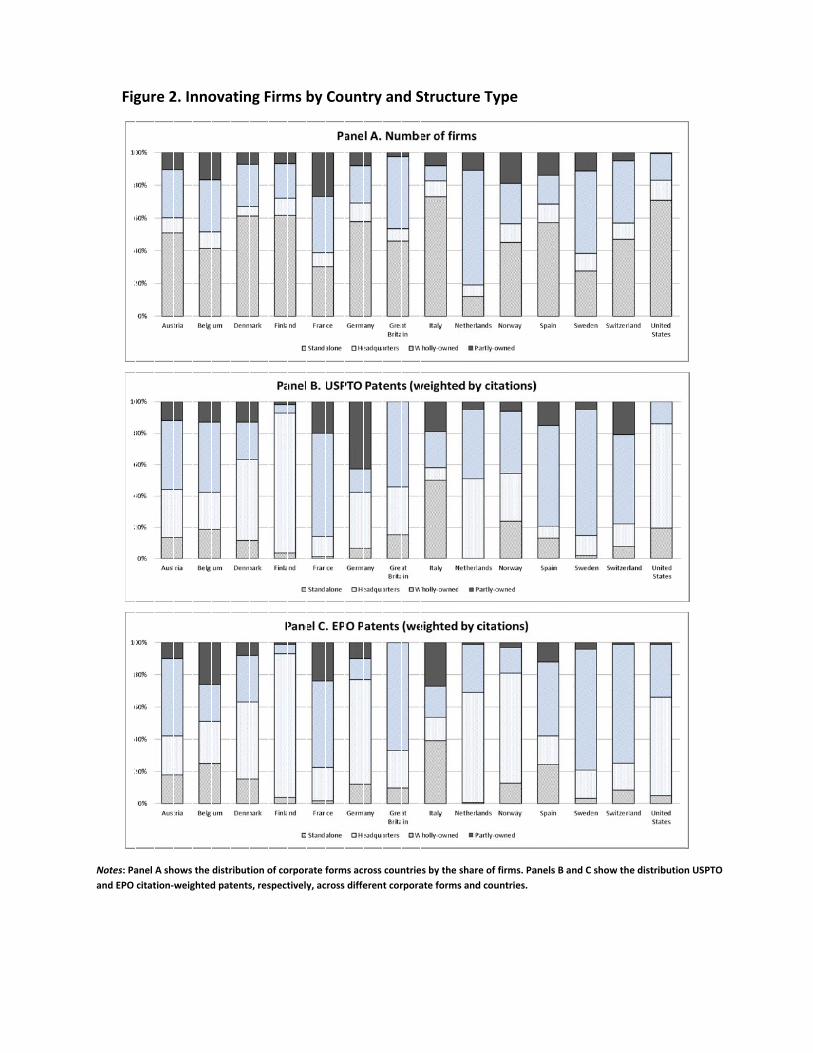
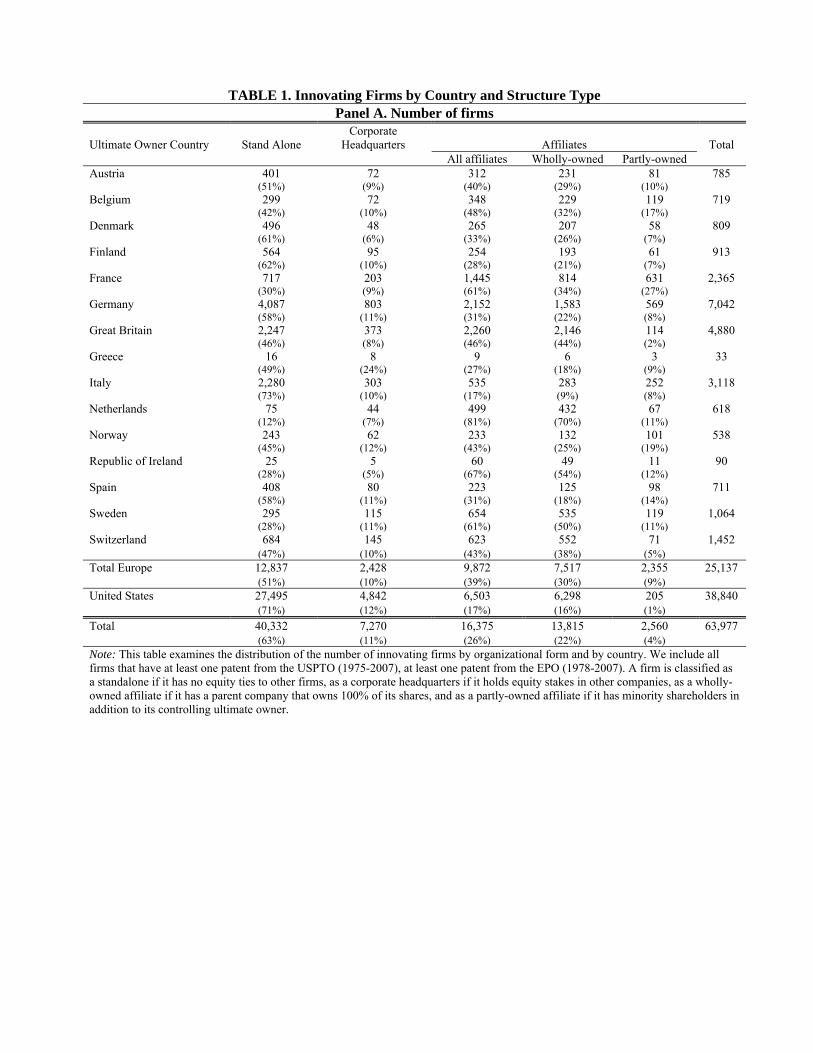
Several notable findings emerge from our cross-country analysis, as summarized in Figure 2 (detailed
distributions are reported in Table 1). First, the overall distribution of organizational form clearly varies by
country (Panel A). In the United States, 71% of all firms are organized in the highly centralized structure of
a standalone, with no equity ties to other firms, while standalones make up about half of all organizational
forms in Europe. Within Europe, the variation is also wide: the share of standalones ranges from 12% in
the Netherlands to 73% in Italy. Corporate headquarters make up about 10% of all organizational forms in
both the United States and Europe. Significant differences exist in the prevalence of both wholly owned and
partly owned affi liates. The affi liate form is not very common in the United States (17%), and almost all
are wholly owned affi liates: only 1% of all affi liates are partly owned, indicating that highly decentralized
structures are rare in the United States. In contrast, affi liates make up almost 40% of firms in Europe, and
decentralized structures with partial ownership are more common at 9% (ranging from 2% in Great Britain
to 27% in France). The overall pattern in the distribution of organizational form indicates greater propensity
toward centralized structures in the United States than in Europe.
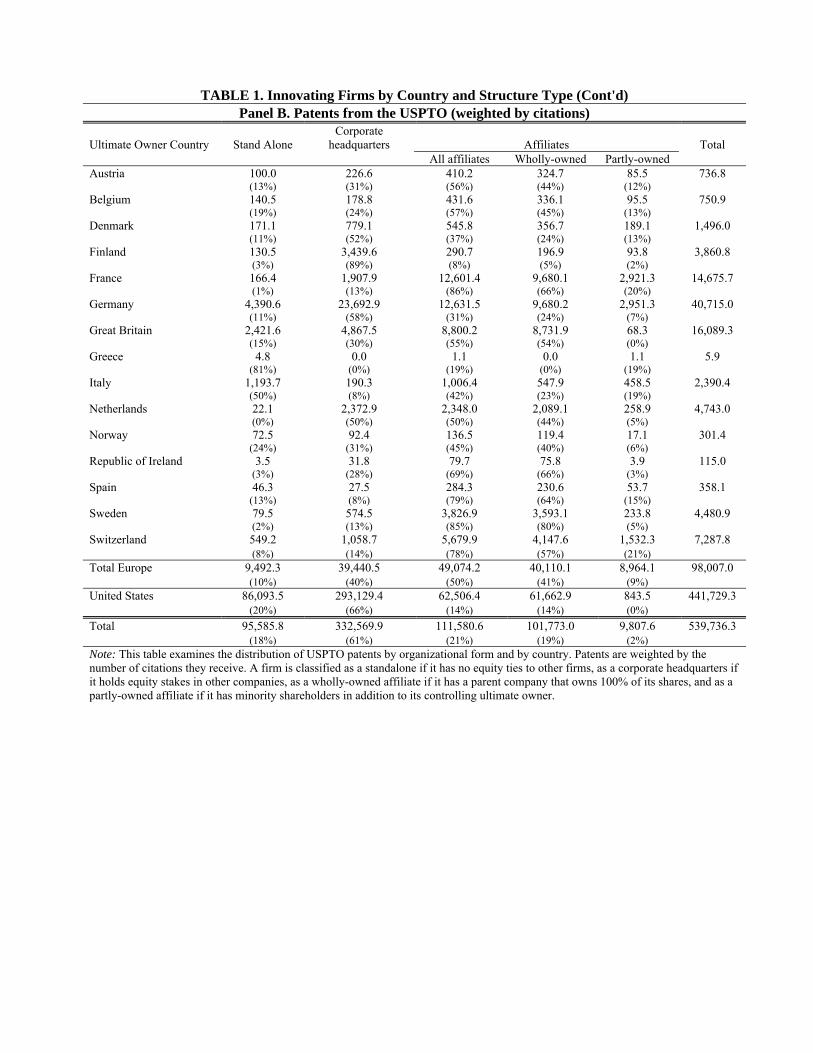
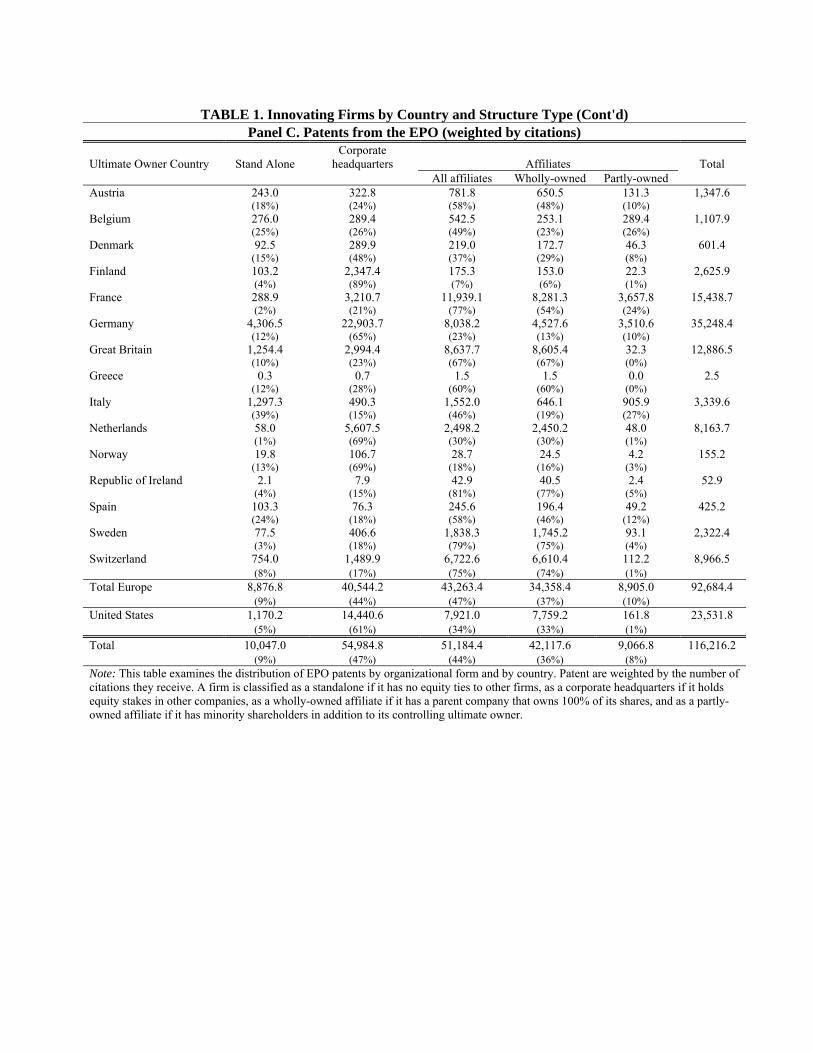
Panels B and C in Figure 2 summarize the distribution of citation-weighted USPTO and EPO patents,
respectively, across different organizational structures and countries. While the overall distribution of citation-
weighted USPTO patents by ownership structure in Europe is slanted toward more decentralized forms– 40%
for corporate headquarters and 50% for affi liates– in the United States this distribution is skewed toward
centralization: standalones and corporate headquarters, with 20% and 66% respectively of patents falling
in these categories, and only 14% of patents held by affi liates. Remarkably, in the United States less than
one percent of patents are held by partly owned affi liates, while in France and Italy about 20% of innovation
takes place in affi liates with minority shareholder ownership. There is also a wide variation in the distribution
of innovation and organizational form across European countries. While Germany appears to resemble the
United States in terms of concentration of innovation in corporate headquarters (58%), French and Italian
firms are clearly skewed toward decentralization, with only 13% and 8% of their respective patents held by
corporate headquarters. Great Britain has a somewhat unique structure, with 55% of British patents held
18
by affi liates, but with nearly all of these affi liates being wholly owned subsidiaries.7 A similar overall pattern
emerges for EPO patents: most patents in the United States belong to more centralized structures; in Europe,
more patents are assigned to decentralized forms, such as affi liates.
Patent assignment patterns in the largest innovating firms illustrate this trend. American conglomerates
usually assign patents to headquarters or to special central intellectual property management divisions, not
to the division where the patent was generated. For example, IBM assigns almost all patents its divisions
generate to its New York headquarters (as indicated by the assignee name on the patent records). Other
large conglomerates that adopt a central patent management structure include General Electric (21,830 out
of 22,348 of GE’s patents are assigned to its Global Research Center division in New York), and 3M (10,640
out of the 10,806 of 3M’s patents are assigned to its headquarters, and the remaining patents are assigned to
the wholly owned IP management subsidiary 3M Innovative Property).
In contrast, corporate groups have a decentralized patent assignment. We hypothesize that the presence
of minority shareholders makes it diffi cult to simply transfer IP assets from the inventing to the controlling
firm. In France, for example, L’Oreal holds 3,135 USPTO patents out of a total of 4,882 patents assigned
to the whole Nestle group. Assigning L’Oreal’s patents to Nestle would be considered an expropriation of
the rights of minority shareholders of L’Oreal. The transfer of patents to the controlling entity requires some
form of valuation and compensation of shareholders of the originating firm. This is likely to be a diffi cult
transaction, which is why patents mostly remain with the originating firm.
We supplement our cross-sectional analysis by examining ownership changes for a sample of innovating
firms that were acquired by an American or European corporation during the period 1997—2007.8 Consistent
with our previous control assumptions, we include deals where the acquired shares exceed 50% for private
firms and 20% for public firms. The M&A sample includes 2,478 firms (where 1,236 are American, 389 British,
199 French, and 293 German), which hold 25,068 USPTO and 28,399 EPO patents. We distinguish between
wholly owned and partly owned acquisitions. The pattern of results is consistent with the cross-sectional
observations of degree of centralization. While in the United States effectively all acquisitions are wholly
owned, in Europe, about half of the acquired (citation-weighted) patents are by partly owned acquisitions.
We also examine the distribution of organizational form of newly established firms. We observe a very similar
pattern of results for firms that were founded between 1997 and 2007. In the United States and Great Britain,
about 1% of these firms are founded as partly owned affi liates, compared to 11% in continental Europe (in
France, 27% of the firms are incorporated as partly owned affi liates). This additional evidence provides
support for the patterns observed for the centralized assignment of patents in the United States and more
decentralized assignment to affi liates in Europe.
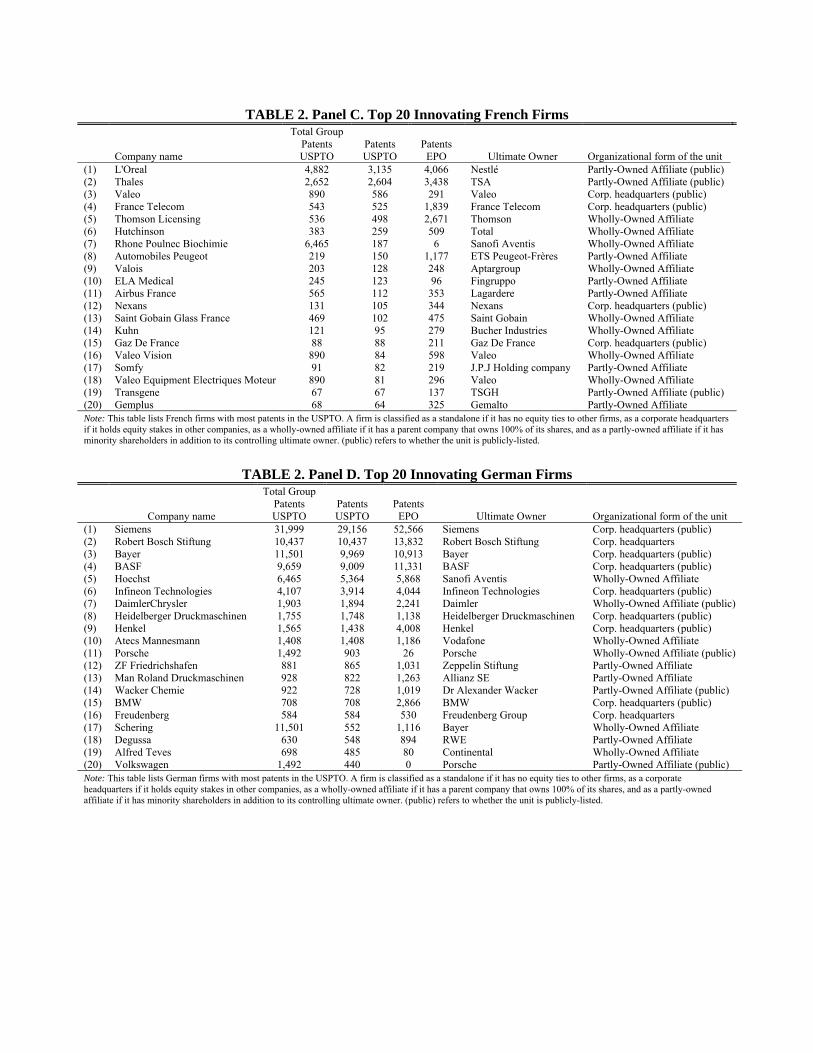
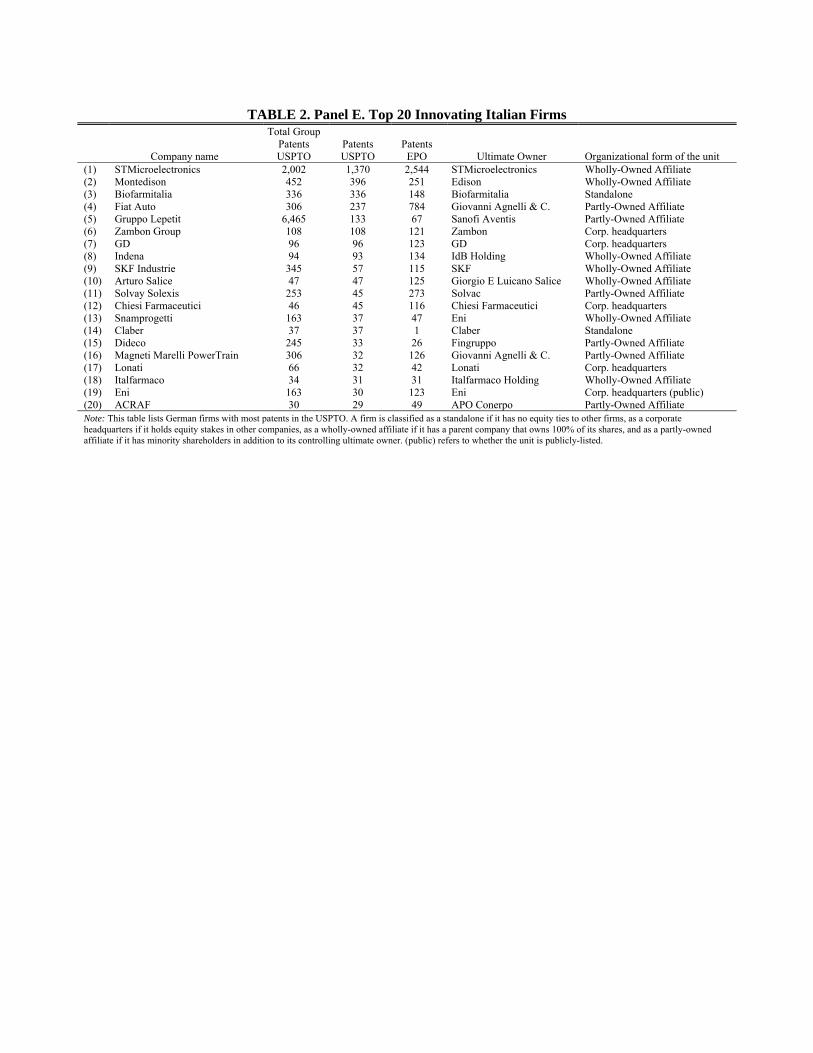
Table 2 further highlights the differences in the distribution of patents by ownership type across countries.
7As discussed in in the paper, data is limited to make a distinction between divisions of a conglomerate and wholly ownedsubsidiaries. A richer framework could make a meaningful distinction by introducing relational contracts (see, e.g., MacLeodand Malcomson, 1989; Levin, 2003; chapter 10 of Bolton and Dewatripont, 2005). By creating legally independent firms withina corporation, an organization may be able to gain flexibility by supporting separate relational contracts for different sets ofemployees. We leave the exploration of this idea to future research.
8Not reported in tables; available from authors upon request.
19
Panel A describes the top 20 American innovating firms. IBM leads the list with more than 43,000 USPTO
patents. All American firms in this table have the same ownership structure: they are all publicly traded
conglomerates. Panel B focuses on British firms, which resemble the American conglomerate structure.9
Panel C examines the leading innovating firms in France. More than half are corporate group affi liates,
and 40% with partial ownership. Only 35% of these firms are publicly traded. In Germany (panel D), 20%
of firms are partly owned corporate group affi liates. Lastly, 40% of Italian firms (panel E) are partly owned
corporate group affi liates, and only one Italian firm is publicly traded.10
Why do we observe a high concentration of more decentralized structures such as corporate groups in
Europe, but not in the United States? Based on the history of corporate groups in the United States, a
likely explanation is the tax treatment of intercompany dividends. Under the American tax system, dividend
income transferred from a subsidiary to the parent company is subject to a significant tax. A similar tax
does not exist in Europe. The American tax reform of the 1930s was a response to the corporate scandals of
the late 1920s and the Roosevelt administration’s belief that the proliferation of affi liate firms in corporate
groups had made these groups very opaque to outsiders, thus creating major governance, tax avoidance,
market power, and political influence problems.
In addition to introducing the inter-company dividend tax, the American Congress abolished consoli-
dated tax filings for corporate groups, eliminated capital gains taxes on liquidated controlled subsidiaries,
and banned large pyramidal groups from controlling public utility companies (the Public Utilites Holdings
Company Act or PUHCA of 1935). These policies impose a high penalty on organizing innovation in corpo-
rate groups in the United States. Thus, one would expect to observe more corporate groups, on average, in
Europe, especially in industries with substantial group governance benefits.11
5.2. Comparison Across Industries
A central theme of this paper is the relationship between organizational form, governance, and innovation,
and how different organizational forms are best suited to different forms of R&D activities across industries.
9Ownership structure in Great Britain differs somewhat from that in the US. While the parent company of a British organiza-tion is usually publicly traded, all innovative affi liates in our sample are private companies. A good example that illustrates thisrather unique structure is GlaxoSmithKline. Three of this pharmaceutical giant’s affi liates (Beecham, Glaxo Group, and SmithK-line Beecham) appear in the top 20 most innovative firms. Each firm is wholly owned by GlaxoSmithKline holding-company.While the holding company is publicly traded, none of the innovative affi liates are. Glaxo has two headquarters– GlaxoWellcomeand SmithKline Beecham– and a holding company that wholly owns the entire organization. We classify Glaxo as a conglomeratealthough it has two headquarters, and a holding company at the apex.10 In Table 2 we do not control for firm age, which means that older firms are more likely to appear on the list of innovative
firms than younger ones. We examine the robustness of our findings by looking only at recent patenting activity. Our list of mostinnovating firms does not appear to be very sensitive to firm age. For example, the largest patentees in the USPTO between2002 and 2006 are IBM (16.270 patents), Micron Technology (8.383), Intel (7.729), Siemens (7.023), and Robert Bosch (5.870).11Another interesting result– not directly related to the current paper yet worth emphasizing– is the distribution of patents
by private and public firms. The US distribution of innovating firms is also heavily skewed toward publicly traded firms (Table2). Indeed, the fraction of patents held by publicly traded American corporations is above 60%, while this fraction is only about30% in Europe. In some large European countries this picture is even more extreme: in France and Italy only 6% and 3% ofpatents, respectively, are held by publicly traded firms. Interestingly, however, relative to sales, innovation is disproportionatelyconcentrated in publicly traded firms both in Europe and the US (columns 7—9). In the US, 35% of sales of all firms (innovatingand non-innovating) are concentrated in publicly traded firms, compared to 60% of all US patents held in publicly traded firms.A similar pattern holds in Europe, where 20% of sales are concentrated in publicly listed firms and about 30% of Europeanpatents are held by these firms.
20
Our analysis predicts an above-average presence of partly owned affi liates in industries with a stronger need
for innovator intellectual property rights protection and more discrete innovations, and an above-average
presence of centralized structures in industries with a faster innovation cycle and more complex innovations.
For instance, in the pharmaceutical industry, long years of research and development combined with
highly uncertain research outcomes require greater commitment of resources and long-term performance—
based incentives to motivate the research team to follow through with projects. Further, molecules and
compounds developed in the industry can be classified as discrete innovations, as their development, while
building upon prior knowledge, does not require an extensive list of complementary patents. The value from
coordination and flexibility in sharing resources across the organization is minor relative to benefits from
high-powered incentives and stronger intellectual property protections. Therefore, decentralized structures
are more suited to provide these conditions, and we expect to see a greater presence of partly owned affi liates
in this industry.
In contrast, in industries such as telecommunications, where the technology cycle is much shorter and
greater flexibility is required for a timely response to market changes, centralized control and coordination
enable faster resource mobilization. Moreover, products in this industry are more complex and build on mul-
tiple complementary patented inventions. Any change requires coordination of complementary technologies
all of which are unlikely to be owned and controlled by the research team. This makes stronger intellectual
property rights protection less valuable if the holders of the patent may be held up by the owners of the essen-
tial complementary technology, and thus flexibility and coordination is more beneficial in this industry than
high-powered incentives achieved through distributed control. We therefore expect to see more integrated
conglomerate-like organizational forms in this industry.
We use the Carnegie Mellon survey (CMS) of R&D managers (Cohen et al., 2000) to provide further
support for our industry classifications. The CM survey sampled R&D labs in manufacturing industries in
the United States, and the responding firms represent both public and private firms. We aggregated the
response data to the focal industry level to compare average scores for the relative speed of the technology
cycle and product complexity in each industry. The survey asks R&Dmanagers to report the speed with which
new innovations are introduced in the focal industry. The lab-level categorical responses range from 1 ("Very
Slowly") to 5 ("Very Rapidly"). Consistent with our classification, the Pharmaceutical and Biotechnology
industries (SIC 283) received an average score of 3.16, Chemicals (SIC 281) received a score of 2.67, and
Transportation and Engineering (SIC 371) had a score of 2.86, all of which correspond to responses that
product innovations are introduced at the speed in the range of "Slowly" to "Moderately" in these industries.
In contrast, the Telecommunications industry (SIC 366) received a score of 3.85, Information Technology
(SIC 357) had a score of 4.25, and Electronics and Semiconductors (SIC 367) received a score of 3.93, all of
which correspond closely to responses that new innovations are introduced in the focal industry "Rapidly."
Similarly, to compare industries on product complexity, we asked respondents to report the effectiveness of
product complexity in protecting their product innovations from competition. The response categories ranged
from 0, indicating that product complexity was not at all effective, to 1, indicating product complexity as
being most effective in protecting their competitive advantage. Consistent with our classification of the
21
industries by their product complexity, the Pharmaceutical, Biotechnology, and Chemical industries received
an average score of 0.29, while Electronics and Semiconductors received a higher score of 0.45, Information
Technology received a score of 0.52, and the Telecommunications average score was 0.55, indicating higher
product complexity.
Figure 3 illustrates the distribution of patents across different organizational forms by industry and
country. The figures contrast the distribution of patents between industries with longer innovation cycles
and discrete innovations, and industries with shorter innovation cycles and more complex innovations. We
focus on the pharmaceutical, biotechnology, chemical, and transportation industries as examples of those with
longer technology cycles and discrete products. We examine the telecommunications, information technology,
electronics, and semiconductor industries as examples of those where innovations are closely interrelated and
the innovation cycle is fast. The general pattern of results is consistent with our analysis. Table 3 reports the
detailed distributions by organizational form across industries and countries. In continental Europe, about
30% of (citation-weighted) patents belong to partly owned affi liates in pharmaceuticals, 21% in biotechnology,
13% in chemicals (excluding BASF, this percentage rises to 22%), and 18% in transportation. For British
and American firms, less than 1% of patents in each of the four industries fall under partly owned affi liates.12
Nonetheless, the distribution of innovations in the United States and Great Britain in these industries is
consistently concentrated in wholly owned affi liates at around 30%.
This contrast is even more prominent for industries with faster innovation cycles and more complex
innovations. In particular, in these industries, partly owned affi liates are extremely rare for all firms: in
continental Europe, only 3% of patents belong to partly owned affi liates in telecommunications, 4% in infor-
mation technology, 5% in electronics, and 7% in semiconductors.13 For American and British firms, partly
owned affi liates continue to remain very rare, with less than 1% of patents falling in this category, and a
much smaller share of patents belonging to wholly owned affi liates compared to industries with long innova-
tion cycles. The notable difference is in the apparent skewness toward more decentralized forms in industries
with long-term and discrete innovations and a strong trend toward more centralized forms in industries with
faster technology cycles and more complex products.
These patterns are remarkable, as they indicate a substantial variation in the organizational form of
inventive activity across industries and countries consistent with institutional and technology factors. As
expected, industries with longer technology cycles and more discrete innovations experience a high concen-
tration of patents in more decentralized organizational forms. In contrast, industries with short innovation
cycles and where commercialization of inventions requires many highly complementary innovations seem to
strongly favor centralized organizations in the form of corporate headquarters and wholly owned affi liates.
12There is, however, a striking difference in the ownership structure of British and American firms. For example, in pharma-ceuticals, more than 50% of American patents are held by corporate headquarters, compared to less than 20% of British patents,where the majority of patents (80%) are held by wholly owned affi liates.13Excluding Thales Group, which is partly owned by the French state, the percentage of patents belonging to partly owned
affi liates in continental Europe drops from 7% to 1%.
22
5.3. Regression Analysis
In this section we test the robustness of our descriptive findings by utilizing a "difference-in-difference" ap-
proach to rule out the possibility of country and industry difference in firm-level and patent characteristics
driving the results, and to establish the statistical significance of the patterns observed in the data. We find
that technology explains much of the cross-country variations: for discrete technologies, there is significant
variation in organizational form across countries, but not for complex technologies. Notably, within-country
across-industry variation in organizational form is significant in Europe; but in the United States, organiza-
tional form of innovating firms seems to be more stable, arguably due to institutional constraints imposed on
alternative forms of organizing.
One concern with our descriptive analysis is that differences in firm size or age may drive the observed
distribution of patents across countries and industries. Such bias can occur, for example, if smaller firms
are more likely to be partly owned affi liates and if countries like France or Italy have a higher fraction of
small firms than the United States or Great Britain. Similar patterns would emerge if partly owned affi liates
tend to be younger than corporate headquarters, and if for some reason France and Italy have a higher
share of young firms than the United States and Great Britain. We test these hypotheses by estimating a
patent-level model of the probability that a patent belongs to a partly owned affi liate, as a function of patent
characteristics (such as quality as measured by citations received, and grant year), the firm that owns it,
technology area, and ultimate owner country. The dependent variable is a dummy that receives the value of
one if the patent belongs to a partly owned affi liated firm, and zero for firms of other organizational forms.
To mitigate concerns of uneven coverage across countries when controlling for firm characteristics, we exclude
firms that, on average, have fewer than 20 employees and generate less than $1 million in annual sales (we
also drop firms where employment and sales information is not available).
Table 4 summarizes the estimation results. Column 1 includes dummies for continental Europe and British
firms (the United States is the baseline category). Consistent with our previous findings, the coeffi cient on the
dummy for continental Europe is positive and is highly significant. On average, the probability that a firm in
continental Europe is a partly owned affi liate is higher by 13.2% than for an American firm. The coeffi cient
on the dummy for British firms is close to zero and not significant, indicating that American and British
firms have practically the same probability of being partly owned affi liates (the predicted probability of partly
owned affi liates in the whole sample, evaluated at the mean, is less than one percent). Column 2 controls for
firm sales, age, and a dummy for whether it is public, and breaks down the dummy for continental Europe
by including separate dummies for German, French, and Italian firms. We group the remaining European
countries under Other Europeans category. The same pattern of results continues to hold, where French and
Italian firms are most likely to be partly owned affi liates (coeffi cients of 0.240 and 0.350, with standard errors
of 0.097 and 0.104, respectively). Columns 3—6 examine the robustness of the results to patents quality, as
measured by the number of citations they receive, and firm age at the year the patent was granted. The
results continue to hold.
Columns 7—9 explore how the effect of the continental Europe dummy on the probability of partly owned
23
affi liation varies across technology areas. We interact the continental Europe dummy with technology area
dummies. Details on how we classify the main technology areas are available in the appendix. As expected,
the coeffi cients on the interactions with pharmaceuticals, biotechnology, and chemicals are large and positive,
and the coeffi cients are substantially lower for electronics, information technology, and telecommunications.
The results are aligned with our previous descriptive findings. The coeffi cient on the interaction between
continental Europe and pharmaceuticals dummies is 0.539 (a standard error of 0.212). This coeffi cient
indicates that for pharmaceuticals patents, the probability a patent belongs to a partly owned affi liate is
higher by 53.9% if the patent is owned by a European firm than if it is owned by an American firm. A
similar pattern (though with lower coeffi cients) is also evident for biotechnology and chemicals. However, for
patents in electronics, information technology, and telecommunications, the respective interaction coeffi cients
are effectively zero, indicating no substantial difference in the probability of partly owned affi liation between
the continental European and American and British firms. Columns 8—9 find the same pattern of results for
patents that receive either few or many citations.
These are perhaps the most significant findings of this study. They suggest that previous cross-country
studies may have put too much weight on differences in legal and corporate law protections to explain the
variation in the prevalence of corporate groups structures across Europe and the United States. Our results
suggest that the observed average cross-country differences in the prevalence of corporate groups may be
equally driven by cross-country differences in industry composition, at least for innovating firms. Importantly,
our finding that organizational form systematically varies with industry characteristics is also consistent with
a Coasian view of how firms organize: that R&D-intensive firms tend to choose the corporate form most
conducive to innovation. This is especially true in Europe, where there are fewer regulatory hurdles to the
formation of corporate groups and hybrid decentralized corporate forms. It is not the case in the United
States, where tax and regulatory hurdles essentially negate any gains from forming corporate groups.
6. Discussion and Conclusion
This paper describes systematic patterns of the relation between organization form and innovation for a
cross-section of private and publicly traded innovating firms in the United States and 15 European countries.
Several new patterns emerge from our analysis. There is a substantial variation in organization form across
industries and countries. Decentralized structures such as partly owned affi liates tend to be concentrated
in industries where innovation takes time and is more discrete, and where the intellectual protection of the
innovator may be paramount. On the other hand, centralization in the form of conglomerates is more prevalent
in industries with rapid and complex innovation, where the ability of centralized control to promptly respond
and quickly redeploy assets may give it an edge. These effects are especially strong in continental Europe,
where there are fewer regulatory restrictions on organizational forms. In the United States, regulations impose
high costs on the formation of decentralized partially owned structures, consistent with our observation that
most American innovation is concentrated in centralized structures such as conglomerates.
Our results are consistent with the Coasian view of firm organization in Europe, but not in the United
24
States. If restricting choices in firm organization decision is costly in terms of effi ciently organizing innovative
activity, then we would expect to find differences in relative innovation performance between Europe and the
United States, especially in industries where European firms organize differently from American firms. To
explore this issue, Figure 4 plots the share of innovation in Europe in partly owned affi liates (horizontal axis)
against the measure of innovation performance of European firms in this industry relative to American firms
in the same industry. This measure is simply the share of patents by European firms of the total number
of patents the industry produces (total number of patents held by both American and European firms). We
find a stark pattern of a positive relation between the share of patents that belong to partly owned affi liates
in an industry and relative innovation performance of European firms in this industry.
There are two main competing explanations for this pattern. The first is consistent with our primary
Coasian position that European companies organize in more decentralized structures, where benefits are
larger relative to more centralized forms. To the extent that institutional context dictates organizational
form, we would observe ineffi ciency of the predominant organizational form in industries where an alternative
form is more effi cient. Under this logic, American firms are disadvantaged by the regulatory hurdles that
prevent them from adopting a more effi cient way of organizing, which is evidenced by the relatively strong
innovative performance of partially owned affi liates in Europe. The alternative view explains the prevalence
of centralized structures in the United States consistently with Chandler’s (1962) argument for the universal
superiority of the multidivisional form. According to this explanation, group organization in Europe is more
an artifact of historical path dependency than effi ciency concerns. Considering the similarity in economic
development and interconnectedness of the countries in our sample, which should enable effective convergence
of organizational form within industries and across countries, the observed differences in the distribution of
organizational structure across industry and national boundaries can be attributed to path-dependency.
Thus, the observed pattern of decentralized structure of successful innovating firms in Europe is due to their
historically strong competitive position, which makes adoption of alternative forms for effi ciency purposes
unnecessary. These competing views present fascinating venues for further research.
References
[1] Aghion, P., J. Tirole. 1997. Formal and real authority in organizations. Journal of Political Economy,105(1): 1-29.
[2] Alchian, A. A., H. Demsetz. 1972. Production, information costs, and economic organization. AmericanEconomic Review, 62(5): 777-795.
[3] Almeida, H., D. Wolfenzon. 2006. A Theory of pyramidal ownership and family business groups. Journalof Finance, 61(6): 2637-2680.
[4] Almeida, H., S. Y. Park, M. Subrahmanyam, D. Wolfenzon. 2007. Valuation and performance of firmsin complex ownership structures: An application to Korean chaebols. Working paper.
[5] Amihud, Y., B. Lev. 1981. Risk reduction as a managerial motive for conglomerate mergers. The BellJournal of Economics, 12(2): 605-617.
25
[6] Amit, R., P. J. Schoemaker. 1993. Strategic assets and organizational rent. Strategic Management Jour-nal, 14(1): 33-46.
[7] Anderson, P., M. L. Tushman. 1990. Technological discontinuities and dominant designs: A cyclicalmodel of technological change. Administrative Science Quarterly, 35(4): 604-633.
[8] Argyres, N. S., B.S. Silverman. 2004. R&D, organization structure, and the development of corporatetechnological knowledge. Strategic Management Journal, 25(89): 929-958.
[9] Arora, A., S. Belenzon, L. Rios. 2012. Make, buy, organize: The interplay between R&D, externalknowledge, and firm structure. Forthcoming to Strategic Management Journal.
[10] Arrow, K. 1974. The limits of organization. New York: W. W. Norton & Company.
[11] Bae, K.H., J.K. Kang, J.M. Kim. 2002. Tunneling or value added? Evidence from mergers by Koreanbusiness groups. Journal of Finance, 57(6): 2695-2740.
[12] Barca, F., M. Becht. 2001. The control of corporate Europe. Oxford: Oxford University Press.
[13] Bebchuk, L.A., R. Kraakman, G. Triantis. 2000. Stock pyramids, cross-ownership and dual class equity:The mechanisms and agency costs of separating control from cash-flow rights. In Morck, R.K. (ed.)Concentrated corporate ownership, pp. 445-460. Chicago: University of Chicago Press.
[14] Belenzon, S., A. Patacconi, U. Tsolmon. 2012. Managerial redeployment, ownership structure, and familyties. Working paper.
[15] Belenzon, S., T. Berkovitz, L. Rios. 2012. Capital markets and firm organization: How financial devel-opment shapes European corporate groups. Forthcoming to Management Science.
[16] Belenzon, S., T. Berkovitz. 2010. Innovation in business groups. Management Science, 56(3): 519-535.
[17] Berle, A. A., G. C. Means. 1932. The modern corporation and private property. New York: Macmillan.
[18] Bertrand, M., P. Mehta, S. Mullainathan. 2002. Ferreting out tunneling: An application to Indianbusiness groups. Quarterly Journal of Economics, 117(1): 121-148.
[19] Bolton, P., M. Dewatripont. 1994. The firm as a communication network. Quarterly Journal of Eco-nomics, 109(4): 809-839.
[20] Bolton, P., M. Dewatripont. 2005. Contract theory. Cambridge, MA: MIT Press.
[21] Caves, R., M. Uesaka. 1976. Industrial organization in Japan. Washington D.C.: The Brookings Insti-tutions.
[22] Chandler, A. D., Jr. 1962. Strategy and structure: Chapters in the history of the American industrialenterprise. Cambridge, MA: MIT Press.
[23] Chandler, A. D., Jr. 1977. The visible hand. Cambridge, MA: Harvard University Press.
[24] Chandler, A. D., Jr. 1990. Scale and scope. Cambridge, MA: Harvard University Press.
[25] Chang, S.J. 2003. Financial crisis and transformation of Korean business groups: The rise and fall ofchaebols. New York and Melbourne: Cambridge University Press.
[26] Chang, S.-J., C.-N. Chung, I. P. Mahmood. 2006. When and how does business group affi liation promotefirm innovation? A tale of two emerging economies. Organization Science, 17(5): 637-656.
26
[27] Chatterjee, S., B. Wernerfelt. 1991. The link between resources and type of diversification: Theory andevidence. Strategic Management Journal, 12(1): 33-48.
[28] Claessens, S., S. Djankov, L.H.P. Lang. 2000. The separation of ownership and control in East Asiancorporations. Journal of Financial Economics, 58(1-2): 81-112.
[29] Claessens, S., S. Djankov, J.P.H. Fan, L.H.P. Lang. 2002. Disentangling the incentive and entrenchmenteffects of large shareholdings. Journal of Finance, 57(6): 2741-71.
[30] Coase, R. H. 1937. The nature of the firm. Economica, 4(16): 386-405.
[31] Cockburn, I., R. Henderson, S. Stern. 1999. The diffusion of science-driven drug discovery: Organizationalchange in pharmaceutical research. NBER Working Paper No. w7359.
[32] Cohen, W. M., D. A. Levinthal. 1990. Absorptive capacity: A new perspective on learning and innovation.Administrative Science Quarterly, 35(1): 128-152.
[33] Cohen, W. M., R. R. Nelson, J. P. Walsh. 2000. Protecting their intellectual assets: Appropriabilityconditions and why US manufacturing firms patent (or not). NBER Working Paper No. w7552.
[34] Daft, R. 1998. Essentials of organization theory and design. Cincinnati, OH: South-Western Publishing.
[35] Dierickx, I., K. Cool. 1989. Asset stock accumulation and sustainability of competitive advantage. Man-agement Science, 35(12): 1504-1511.
[36] DiMaggio, P. J., W. W. Powell. 1983. The iron cage revisited: Institutional isomorphism and collectiverationality in organizational fields. American Sociological Review, 48(2): 147-160.
[37] Faccio, M., L. HP Lang. 2002. The ultimate ownership of Western European corporations. Journal ofFinancial Economics, 65(3): 365-395.
[38] Faccio, M., L. Lang, L. Young. 2010. Pyramiding versus leverage in corporate groups: Internationalevidence. Journal of International Business Studies, 41(1): 88-104.
[39] Freeman, C. 1995. The ‘National System of Innovation’in historical perspective. Cambridge Journal ofEconomics, 19(1): 5-24.
[40] Galunic, D. C., K. M. Eisenhardt. 2001. Architectural innovation and modular corporate forms. Academyof Management Journal, 44(6): 1229-1249.
[41] Gertner, R.H., D.S. Scharfstein, J.C. Stein. 1994. Internal versus external capital markets. QuarterlyJournal of Economics, 109(4):1211-1230.
[42] Ghemawat, P., T. Khanna. 1998. The nature of diversified business groups: A research design and twocase studies. Journal of Industrial Economics, 46(1): 35-61.
[43] Granovetter, M. 2005. The impact of social structure on economic outcomes. Journal of EconomicPerspectives, 19(1): 33-50.
[44] Grossman, S. J., O. D. Hart. 1986. The costs and benefits of ownership: A theory of vertical and lateralintegration. Journal of Political Economy, 94(4): 691-719.
[45] Guedj, I., D. S. Scharfstein. 2004. Organizational scope and investment: Evidence from the drug devel-opment strategies and performance of biopharmaceutical firms. Working paper.
27
[46] Guillén, M.F. 2000. Business groups in emerging economies: A resource-based view. Academy of Man-agement Journal, 43(3): 362-380.
[47] Hall, P.A., D. Soskice. 2001. Varieties of capitalism: The institutional foundations of comparative ad-vantage. New York: Oxford University Press.
[48] Hart, Oliver. 1995. Firms, contracts, and financial structure. Oxford: Oxford University Press.
[49] Haunschild, P. R., A. S. Miner. 1997. Modes of interorganizational imitation: The effects of outcomesalience and uncertainty. Administrative Science Quarterly, 42(3): 472-500.
[50] Henderson, R. M., K. B. Clark. 1990. Architectural innovation: The reconfiguration of existing producttechnologies and the failure of established firms. Administrative Science Quarterly, 35(1): 9-30
[51] Himmelberg, C., B. Petersen. 1994. R&D and internal finance: A panel study of small firms in high-techindustries. Review of Economics and Statistics, 76(1): 38-51.
[52] Holmström, B. 1989. Agency costs and innovation. Journal of Economic Behavior and Organization, 12:305-327
[53] Holmström, B. 1999. Managerial incentive problems: A dynamic perspective. Review of Economic Stud-ies, 66(1): 169-182.
[54] Holmström, B., P. Milgrom. 1994. The firm as an incentive system. American Economic Review, 84(4):972-991.
[55] Jensen , M. C. 1986. Agency costs of free cash flow, corporate finance, and takeovers. American EconomicReview, 76(2): 323-329.
[56] Jensen, M. C., W. H. Meckling. 1976. Theory of the firm: Managerial behavior, agency costs andownership structure. Journal of Financial Economics, 3(4): 305-360.
[57] Johnson, S., R. La Porta, F. Lopez-de-Silanes, A. Shleifer. 2000. Tunneling. American Economic Review,90(2): 22-27.
[58] Jones, C. I., P. M. Romer. 2009. The new Kaldor facts: Ideas, institutions, population, and humancapital. NBER Working Paper No. w15094.
[59] Khanna, T., J.W. Rivkin. 2001. Estimating the performance effects of business groups in emergingmarkets. Strategic Management Journal, 22(1): 45-74.
[60] Khanna, T., K. Palepu. 1997. Why focused strategies may be wrong for emerging markets. HarvardBusiness Review, 75(4): 41-48.
[61] Khanna, T., K. Palepu. 1999. Policy shocks, market intermediaries, and corporate strategy: The evo-lution of business groups in Chile and India. Journal of Economics and Management Strategy, 8(2):271-310.
[62] Khanna, T., Y. Yafeh. 2007. Business groups in emerging markets: Paragons or parasites? Journal ofEconomic Literature, 45(2): 331-372.
[63] La Porta, R., F. Lopez-de-Silanes, A. Shleifer, R. W. Vishny. 1997. Legal determinants of externalfinance. Journal of Finance, 52(3): 1131-50.
[64] La Porta, R., A. Shleifer, F. Lopez-de-Silanes, R. W. Vishny. 1999. Law and finance. Journal of PoliticalEconomy, 106(6): 1113-1155.
28
[65] La Porta, R., F. Lopez-de-Silanes, A. Shleifer. 1999. Corporate ownership around the world. Journal ofFinance, 54(2): 471-517.
[66] Leff, N.H. 1978. Industrial organization and entrepreneurship in the developing countries: The economicgroups. Economic Development and Cultural Change, 26(4):661-675.
[67] Lerner, J., J. Wulf. 2007. Innovation and incentives: Evidence from corporate R&D. Review of Economicsand Statistics, 89(4): 634-644.
[68] Levin, J. 2003. Relational incentive contracts. American Economic Review, 93(3): 835-57.
[69] MacLeod, W. B., J. M. Malcomson. 1989. Implicit contracts, incentive compatibility, and involuntaryunemployment. Econometrica, 57(2): 447-80.
[70] Mahmood, I., W. Mitchell. 2004. Two faces: Effects of business-groups on innovation in emergingeconomies. Management Science, 50(4): 1348-1365.
[71] Mahoney, J.T., J.R. Pandian. 1992. The resource-based view within the conversation of strategic man-agement. Strategic Management Journal, 13(5): 363-380.
[72] Meyer, M., P. Milgrom, D. Roberts. 1992. Organizational prospects, influence costs, and ownershipchanges. Journal of Economics and Management Strategy, 1(1): 9-35.
[73] Morck, R. 2005. How to eliminate pyramidal business groups: The double taxation of inter-corporatedividends and other incisive uses of tax policy. Cambridge, MA: MIT Press.
[74] Nelson, R. R. 1991. Why do firms differ, and how does it matter? Strategic Management Journal, WinterSpecial Issue, 12: 61-74.
[75] Nickerson, J. A., T. R. Zenger. 2002. Being effi ciently fickle: A dynamic theory of organizational choice.Organization Science, 13(5): 547-566.
[76] Peteraf, M. 1993. The cornerstones of competitive advantage: A resource-based view. Strategic Manage-ment Journal, 14(3): 179-191.
[77] Porter, M.E. 1987. From competitive advantage to corporate strategy. Harvard Business Review, 65(3):43-59.
[78] Rajan, R., H. Servaes, L. Zingales. 2000. The cost of diversity: The diversification discount and ineffi cientinvestment. Journal of Finance, 55(1): 35-80.
[79] Robert, P., P. Milgrom, J. Roberts. 1992. Economics, organization and management. New York:Prentice-Hall International.
[80] Robins, J. A., M. F. Wiersema. 1995. A resource-based approach to the multibusiness firm: Empiri-cal analysis of portfolio interrelationships and corporate financial performance. Strategic ManagementJournal, 16(4): 277-299.
[81] Rosenkopf, L., P. Almeida. 2003. Overcoming local search through alliances and mobility. ManagementScience, 49(6): 751-766.
[82] Scharfstein, D., J. Stein. 2000. The dark side of internal capital markets: Divisional rent-seeking andineffi cient, investment. Journal of Finance, 55(6): 2537-2564.
[83] Seru, A. 2012. Firm boundaries matter: Evidence from conglomerates and R&D activity. Forthcomingto Journal of Financial Economics.
29
[84] Siggelkow, N., D. A. Levinthal. 2003. Temporarily divide to conquer: Centralized, decentralized, andreintegrated organizational approaches to exploration and adaptation. Organization Science, 14(6): 650-669.
[85] Song, J., P. Almeida, G. Wu. 2003. Learning—by—hiring: When is mobility more likely to facilitateinterfirm knowledge transfer? Management Science, 49(4): 351-365.
[86] Stein, J. 1997. Internal capital markets and the competition for corporate resources. Journal of Finance,52(1): 111-133.
[87] Strachan, H. W. 1976. Family and other business groups in economic development: The case of Nicaragua.New York: Praeger.
[88] Syverson, C. 2004. Market structure and productivity: A concrete example. NBER Working Paper No.w10501.
[89] Syverson, C. 2010. What determines productivity? NBER Working Paper No. w15712.
[90] Teece D. J., G. Pisano, A. Shuen. 1997. Dynamic capabilities and strategic management. StrategicManagement Journal, 18(7): 509—533.
[91] Teece, D. J. 1982. Towards an economic theory of the multiproduct firm. Journal of Economic Behaviorand Organization, 3(1): 39-63.
[92] Teece, D. J. 1986. Profiting from technological innovation: Implications for integration, collaboration,licensing and public policy. Research Policy, 15(6): 285-305.
[93] Teece, D., G. Pisano. The dynamic capabilities of firms: An introduction. Industrial and CorporateChange, 3(3): 537-556.
[94] Trajtenberg, M. 1990. A penny for your quotes: Patent citations and the value of innovations. RandJournal of Economics, 21(1): 172-187.
[95] Tripsas, M. 1997. Unraveling the process of creative destruction: Complementary assets and incumbentsurvival in the typesetter industry. Strategic Management Journal, 18(1): 119-142.
[96] Williamson, O. E. 1991. Comparative economic organization: The analysis of discrete structural alter-natives. Administrative Science Quarterly, 36(2): 269-296.
[97] Williamson, O. E. 1995. Hierarchies, markets, and power in the economy: An economic perspective.Industrial and Corporate Change, 4(1): 21-49.
[98] Williamson, O. E. 1975. Markets and hierarchies: Analysis and antitrust implications. New York: FreePress.
(28%) (11%) (61%) (50%) (11%) Switzerland 684 145 623 552 71 1,452 (47%) (10%) (43%) (38%) (5%) Total Europe 12,837 2,428 9,872 7,517 2,355 25,137 (51%) (10%) (39%) (30%) (9%) United States 27,495 4,842 6,503 6,298 205 38,840 (71%) (12%) (17%) (16%) (1%) Total 40,332 7,270 16,375 13,815 2,560 63,977 (63%) (11%) (26%) (22%) (4%) Note: This table examines the distribution of the number of innovating firms by organizational form and by country. We include all firms that have at least one patent from the USPTO (1975-2007), at least one patent from the EPO (1978-2007). A firm is classified as a standalone if it has no equity ties to other firms, as a corporate headquarters if it holds equity stakes in other companies, as a wholly-owned affiliate if it has a parent company that owns 100% of its shares, and as a partly-owned affiliate if it has minority shareholders in addition to its controlling ultimate owner.
TABLE 1. Innovating Firms by Country and Structure Type (Cont'd) Panel B. Patents from the USPTO (weighted by citations)
Ultimate Owner Country Stand Alone Corporate
headquarters Affiliates Total All affiliates Wholly-owned Partly-owned Austria 100.0 226.6 410.2 324.7 85.5 736.8
(2%) (13%) (85%) (80%) (5%) Switzerland 549.2 1,058.7 5,679.9 4,147.6 1,532.3 7,287.8 (8%) (14%) (78%) (57%) (21%) Total Europe 9,492.3 39,440.5 49,074.2 40,110.1 8,964.1 98,007.0 (10%) (40%) (50%) (41%) (9%) United States 86,093.5 293,129.4 62,506.4 61,662.9 843.5 441,729.3 (20%) (66%) (14%) (14%) (0%) Total 95,585.8 332,569.9 111,580.6 101,773.0 9,807.6 539,736.3 (18%) (61%) (21%) (19%) (2%) Note: This table examines the distribution of USPTO patents by organizational form and by country. Patents are weighted by the number of citations they receive. A firm is classified as a standalone if it has no equity ties to other firms, as a corporate headquarters if it holds equity stakes in other companies, as a wholly-owned affiliate if it has a parent company that owns 100% of its shares, and as a partly-owned affiliate if it has minority shareholders in addition to its controlling ultimate owner.
TABLE 1. Innovating Firms by Country and Structure Type (Cont'd)
Panel C. Patents from the EPO (weighted by citations)
Ultimate Owner Country Stand Alone Corporate
headquarters Affiliates Total All affiliates Wholly-owned Partly-owned Austria 243.0 322.8 781.8 650.5 131.3 1,347.6
(3%) (18%) (79%) (75%) (4%) Switzerland 754.0 1,489.9 6,722.6 6,610.4 112.2 8,966.5 (8%) (17%) (75%) (74%) (1%) Total Europe 8,876.8 40,544.2 43,263.4 34,358.4 8,905.0 92,684.4 (9%) (44%) (47%) (37%) (10%) United States 1,170.2 14,440.6 7,921.0 7,759.2 161.8 23,531.8 (5%) (61%) (34%) (33%) (1%) Total 10,047.0 54,984.8 51,184.4 42,117.6 9,066.8 116,216.2 (9%) (47%) (44%) (36%) (8%) Note: This table examines the distribution of EPO patents by organizational form and by country. Patent are weighted by the number of citations they receive. A firm is classified as a standalone if it has no equity ties to other firms, as a corporate headquarters if it holds equity stakes in other companies, as a wholly-owned affiliate if it has a parent company that owns 100% of its shares, and as a partly-owned affiliate if it has minority shareholders in addition to its controlling ultimate owner.
TABLE 2. Panel A. Top 20 Innovating U.S. Firms
Company name
Total Group Patents USPTO
Patents USPTO
Patents EPO Ultimate Owner Organizational form of the unit
(1) IBM 43,241 43,125 14,319 IBM Corp. headquarters (public) (2) General Electric 22,348 21,830 9,641 General Electric Corp. headquarters (public) (3) Eastman Kodak 17,441 17,157 9,676 Eastman Kodak Corp. headquarters (public) (4) Motorola 17,639 16,380 4,839 Motorola Corp. headquarters (public) (5) Micron Technology 13,986 13,986 561 Micron Technology Corp. headquarters (public) (6) Intel 12,936 12,934 2,103 Intel Corp. headquarters (public) (7) Texas Instruments 12,695 12,668 3,180 Texas Instruments Corp. headquarters (public) (8) Xerox 12,636 12,635 4,402 Xerox Corp. headquarters (public) (9) E.I. du Pont de Nemours 11,198 10,700 6,967 E.I. du Pont de Nemours Corp. headquarters (public)
(10) 3M 10,806 10,640 8,796 3M Corp. headquarters (public) (11) General Motors 9,392 9,275 1,643 General Motors Corp. headquarters (public) (12) Hewlett Packard 9,150 9,028 5,181 Hewlett Packard Corp. headquarters (public) (13) Advanced Micro Systems 8,466 8,466 685 Advanced Micro Systems Corp. headquarters (public) (14) Ford Motor 7,349 7,321 1,586 Ford Corp. headquarters (public) (15) Procter & Gamble 7,522 6,417 8,463 Procter & Gamble Corp. headquarters (public) (16) Microsoft 5,888 6,864 2,460 Microsoft Corp. headquarters (public) (17) Sun Microsystems 6,452 5,641 2,193 Sun Microsystems Corp. headquarters (public) (18) Boeing 6,072 4,981 1,384 Boeing Corp. headquarters (public) (19) United Technologies 7,151 4,297 2,002 United Technologies Corp. headquarters (public) (20) Applied Materials 3,842 3,842 1,109 Applied Materials Corp. headquarters (public) Note: This table lists American firms with most patents in the USPTO. A firm is classified as a standalone if it has no equity ties to other firms, as a corporate headquarters if it holds equity stakes in other companies, as a wholly-owned affiliate if it has a parent company that owns 100% of its shares, and as a partly-owned affiliate if it has minority shareholders in addition to its controlling ultimate owner. (public) refers to whether the unit is publicly-listed.
TABLE 2. Panel B. Top 20 British Innovating Firms
Company name
Total Group Patents USPTO
Patents USPTO
Patents EPO Ultimate Owner Organizational form of the unit
(1) Imperial Chemical Industries 4,147 3,178 2,410 Imperial Chemical Industries Corp. headquarters (public) (2) Rolls Royce 1,288 1,242 805 Rolls Royce Corp. headquarters (public) (3) British Telecommunications 1,074 1,073 1,848 British Telecommunications Corp. headquarters (public) (4) Beecham Group 3,326 743 801 GlaxoSmithKline Wholly-Owned Affiliate (5) BOC 692 686 504 BOC Corp. headquarters (public) (6) British Technology Group 590 590 1,201 BTG Corp. headquarters (public) (7) BP Chemicals 4,917 583 728 BP Wholly-Owned Affiliate (8) Glaxo Group 3,326 506 1,377 GlaxoSmithKline Wholly-Owned Affiliate (9) The British Petroleum 4,917 499 531 BP Wholly-Owned Affiliate (public) (10) SmithKline Beecham 3,326 440 1,101 GlaxoSmithKline Wholly-Owned Affiliate (11) Johnson Matthey 314 300 384 Johnson Metthey Corp. headquarters (public) (12) Merck Sharp & Dohme 4,408 300 323 Merck Wholly-Owned Affiliate (13) Smiths Industries 530 293 141 Smiths Group Wholly-Owned Affiliate (14) Molins 293 287 78 Molins Corp. headquarters (public) (15) British Gas 274 274 211 Centrica Wholly-Owned Affiliate (16) John Wyeth & Brother 1,957 253 77 Wyeth Wholly-Owned Affiliate (17) Renishaw 215 214 308 Renishaw Corp. headquarters (public) (18) ARM 272 184 64 ARM Corp. headquarters (public) (19) BAE Systems 490 128 282 BAE Systems Corp. headquarters (public) (20) Qinetiq 245 122 489 Qinetiq Corp. headquarters (public) Note: This table lists British firms with most patents in the USPTO. A firm is classified as a standalone if it has no equity ties to other firms, as a corporate headquarters if it holds equity stakes in other companies, as a wholly-owned affiliate if it has a parent company that owns 100% of its shares, and as a partly-owned affiliate if it has minority shareholders in addition to its controlling ultimate owner. (public) refers to whether the unit is publicly-listed.
TABLE 2. Panel C. Top 20 Innovating French Firms
Company name
Total Group Patents USPTO
Patents USPTO
Patents EPO Ultimate Owner Organizational form of the unit
(1) L'Oreal 4,882 3,135 4,066 Nestlé Partly-Owned Affiliate (public) (2) Thales 2,652 2,604 3,438 TSA Partly-Owned Affiliate (public) (3) Valeo 890 586 291 Valeo Corp. headquarters (public) (4) France Telecom 543 525 1,839 France Telecom Corp. headquarters (public) (5) Thomson Licensing 536 498 2,671 Thomson Wholly-Owned Affiliate (6) Hutchinson 383 259 509 Total Wholly-Owned Affiliate (7) Rhone Poulnec Biochimie 6,465 187 6 Sanofi Aventis Wholly-Owned Affiliate (8) Automobiles Peugeot 219 150 1,177 ETS Peugeot-Frères Partly-Owned Affiliate (9) Valois 203 128 248 Aptargroup Wholly-Owned Affiliate (10) ELA Medical 245 123 96 Fingruppo Partly-Owned Affiliate (11) Airbus France 565 112 353 Lagardere Partly-Owned Affiliate (12) Nexans 131 105 344 Nexans Corp. headquarters (public) (13) Saint Gobain Glass France 469 102 475 Saint Gobain Wholly-Owned Affiliate (14) Kuhn 121 95 279 Bucher Industries Wholly-Owned Affiliate (15) Gaz De France 88 88 211 Gaz De France Corp. headquarters (public) (16) Valeo Vision 890 84 598 Valeo Wholly-Owned Affiliate (17) Somfy 91 82 219 J.P.J Holding company Partly-Owned Affiliate (18) Valeo Equipment Electriques Moteur 890 81 296 Valeo Wholly-Owned Affiliate (19) Transgene 67 67 137 TSGH Partly-Owned Affiliate (public) (20) Gemplus 68 64 325 Gemalto Partly-Owned Affiliate Note: This table lists French firms with most patents in the USPTO. A firm is classified as a standalone if it has no equity ties to other firms, as a corporate headquarters if it holds equity stakes in other companies, as a wholly-owned affiliate if it has a parent company that owns 100% of its shares, and as a partly-owned affiliate if it has minority shareholders in addition to its controlling ultimate owner. (public) refers to whether the unit is publicly-listed.
TABLE 2. Panel D. Top 20 Innovating German Firms
Company name
Total Group Patents USPTO
Patents USPTO
Patents EPO Ultimate Owner Organizational form of the unit
(1) Siemens 31,999 29,156 52,566 Siemens Corp. headquarters (public) (2) Robert Bosch Stiftung 10,437 10,437 13,832 Robert Bosch Stiftung Corp. headquarters (3) Bayer 11,501 9,969 10,913 Bayer Corp. headquarters (public) (4) BASF 9,659 9,009 11,331 BASF Corp. headquarters (public) (5) Hoechst 6,465 5,364 5,868 Sanofi Aventis Wholly-Owned Affiliate (6) Infineon Technologies 4,107 3,914 4,044 Infineon Technologies Corp. headquarters (public) (7) DaimlerChrysler 1,903 1,894 2,241 Daimler Wholly-Owned Affiliate (public) (8) Heidelberger Druckmaschinen 1,755 1,748 1,138 Heidelberger Druckmaschinen Corp. headquarters (public) (9) Henkel 1,565 1,438 4,008 Henkel Corp. headquarters (public) (10) Atecs Mannesmann 1,408 1,408 1,186 Vodafone Wholly-Owned Affiliate (11) Porsche 1,492 903 26 Porsche Wholly-Owned Affiliate (public) (12) ZF Friedrichshafen 881 865 1,031 Zeppelin Stiftung Partly-Owned Affiliate (13) Man Roland Druckmaschinen 928 822 1,263 Allianz SE Partly-Owned Affiliate (14) Wacker Chemie 922 728 1,019 Dr Alexander Wacker Partly-Owned Affiliate (public) (15) BMW 708 708 2,866 BMW Corp. headquarters (public) (16) Freudenberg 584 584 530 Freudenberg Group Corp. headquarters (17) Schering 11,501 552 1,116 Bayer Wholly-Owned Affiliate (18) Degussa 630 548 894 RWE Partly-Owned Affiliate (19) Alfred Teves 698 485 80 Continental Wholly-Owned Affiliate (20) Volkswagen 1,492 440 0 Porsche Partly-Owned Affiliate (public) Note: This table lists German firms with most patents in the USPTO. A firm is classified as a standalone if it has no equity ties to other firms, as a corporate headquarters if it holds equity stakes in other companies, as a wholly-owned affiliate if it has a parent company that owns 100% of its shares, and as a partly-owned affiliate if it has minority shareholders in addition to its controlling ultimate owner. (public) refers to whether the unit is publicly-listed.
TABLE 2. Panel E. Top 20 Innovating Italian Firms
Company name
Total Group Patents USPTO
Patents USPTO
Patents EPO Ultimate Owner Organizational form of the unit
(1) STMicroelectronics 2,002 1,370 2,544 STMicroelectronics Wholly-Owned Affiliate (2) Montedison 452 396 251 Edison Wholly-Owned Affiliate (3) Biofarmitalia 336 336 148 Biofarmitalia Standalone (4) Fiat Auto 306 237 784 Giovanni Agnelli & C. Partly-Owned Affiliate (5) Gruppo Lepetit 6,465 133 67 Sanofi Aventis Partly-Owned Affiliate (6) Zambon Group 108 108 121 Zambon Corp. headquarters (7) GD 96 96 123 GD Corp. headquarters (8) Indena 94 93 134 IdB Holding Wholly-Owned Affiliate (9) SKF Industrie 345 57 115 SKF Wholly-Owned Affiliate (10) Arturo Salice 47 47 125 Giorgio E Luicano Salice Wholly-Owned Affiliate (11) Solvay Solexis 253 45 273 Solvac Partly-Owned Affiliate (12) Chiesi Farmaceutici 46 45 116 Chiesi Farmaceutici Corp. headquarters (13) Snamprogetti 163 37 47 Eni Wholly-Owned Affiliate (14) Claber 37 37 1 Claber Standalone (15) Dideco 245 33 26 Fingruppo Partly-Owned Affiliate (16) Magneti Marelli PowerTrain 306 32 126 Giovanni Agnelli & C. Partly-Owned Affiliate (17) Lonati 66 32 42 Lonati Corp. headquarters (18) Italfarmaco 34 31 31 Italfarmaco Holding Wholly-Owned Affiliate (19) Eni 163 30 123 Eni Corp. headquarters (public) (20) ACRAF 30 29 49 APO Conerpo Partly-Owned Affiliate Note: This table lists German firms with most patents in the USPTO. A firm is classified as a standalone if it has no equity ties to other firms, as a corporate headquarters if it holds equity stakes in other companies, as a wholly-owned affiliate if it has a parent company that owns 100% of its shares, and as a partly-owned affiliate if it has minority shareholders in addition to its controlling ultimate owner. (public) refers to whether the unit is publicly-listed.
(34%) (15%) (52%) (51%) (1%) United States 6,722.1 13,416.7 5,161.6 5,119.7 41.9 25,300 (27%) (53%) (20%) (20%) (0%) Total 7,907.7 16,771.1 9,999.4 8,493.6 1,505.8 34,678.2 (23%) (48%) (29%) (24%) (4%) Notes: This table examines the distribution of organizational form across technology areas that are characterized as having a strong intellectual property regime and a relatively long and fundamental innovation cycle. Classification of patents to technology areas is based on the International Patent Classification system. Patents are from the USPTO and weighted by the number of citations received. A firm is classified as a standalone if it has no equity ties to other firms, as a corporate headquarters if it holds equity stakes in other companies, as a wholly-owned affiliate if it has a parent company that owns 100% of its shares, and as a partly-owned affiliate if it has minority shareholders in addition to its controlling ultimate owner.
TABLE 3. Structure Type by Main Technology Fields (Cont'd) Ultimate Owner
Country Stand Alone
Corporate headquarters
Affiliates Total
All affiliates Wholly-owned Partly-owned
Telecommunications Continental Europe 113.2 1,791.2 3,693.1 3,504.5 188.6 5,597.5
(21%) (8%) (71%) (70%) (1%) United States 3,247.7 28,358.0 1,093.8 1,061.1 32.7 32,699.4 (10%) (87%) (3%) (3%) (0%) Total 3,490.1 30,343.3 2,421.7 2,147.2 274.5 36,255.1 (9%) (84%) (7%) (6%) (1%) Notes: This table examines the distribution of organizational form across main technology areas that are characterized as having a weak intellectual property regime and a relatively complex and short innovation cycle. Classification of patents to technology areas is based on the International Patent Classification system. Patents are from the USPTO and weighted by the number of citations received. A firm is classified as a standalone if it has no equity ties to other firms, as a corporate headquarters if it holds equity stakes in other companies, as a wholly-owned affiliate if it has a parent company that owns 100% of its shares, and as a partly-owned affiliate if it has minority shareholders in addition to its controlling ultimate owner.
TABLE 4. County and Industry Effects on Innovation in Partly-Owned Affiliates Dependent variable: Dummy for Minority Shareholders
No. of patents 499,675 499,675 201,140 123,691 272,400 227,281 499,685 201,140 123,691 Note: This table reports the estimation results of a Linear Probability Model that examines the effect of country and industry dummies on the probability that a patent belongs to a partly-owned affiliate firms for a sample of USPTO patents that were granted in the period 1975-2007. We include firms that have, on average, at least 20 employees and generate at least $1 million in annual sales. Assignment of firms to countries is based on the nationality of the ultimate owner. A firm is classified as a partly-owned affiliate if it has minority shareholders in addition to its controlling ultimate owner. Regressions include a complete set of patent grant year dummies and a dummy for publicly-listed firms (excluding column 1). Firm age refers to the age of the firm at the grant year of the patent (where firm age is the number of years from the year of incorporation). Standard errors (in brackets) are robust to arbitrary heteroskedasticity and allow for serial correlation through clustering by firms. * significant at 10%; ** significant at 5%; *** significant at 1%.
Notes: This graph plots the share of patents held by partly owned affiliates in Europe against the share of patents generated by European firms relative to American firms in the same industry. A positive relationship is evident between the share of patents generated by partly-owned affiliates in Europe and relative innovative performance by European firms in the same industry.