The Origins of Life History Variation in Steelhead/ Rainbow Trout from Coastal California John Carlos Garza, Alicia Abadía-Cardoso, Devon Pearse Molecular Ecology & Genetic Analysis Team Southwest Fisheries Science Center and UC Santa Cruz
Transcript
The Origins of Life History Variation in Steelhead/Rainbow Trout from Coastal California John Carlos Garza, Alicia Abadía-Cardoso, Devon Pearse
Molecular Ecology & Genetic Analysis Team Southwest Fisheries Science Center and UC Santa Cruz
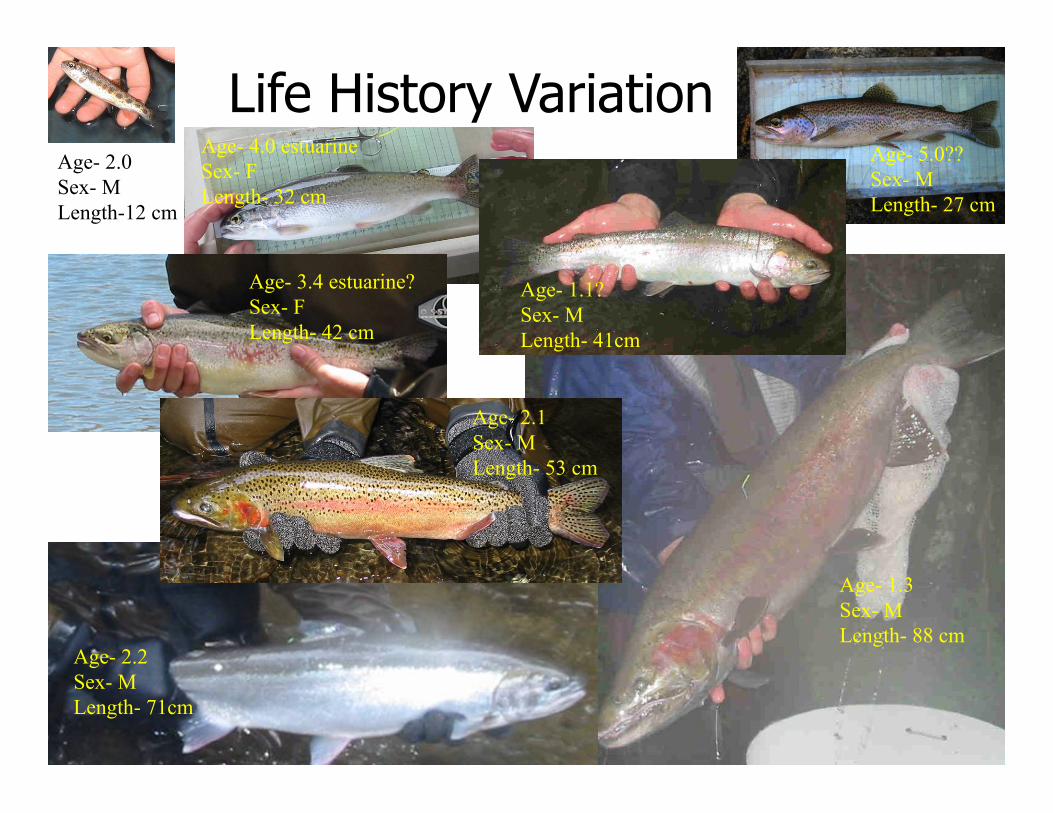
Life History Variation Age- 2.0 Sex- M Length-12 cm
Age- 1.1? Sex- M Length- 41cm
Age- 5.0?? Sex- M Length- 27 cm
Age- 1.3 Sex- M Length- 88 cm
Age- 2.2 Sex- M Length- 71cm
Age- 4.0 estuarine Sex- F Length- 32 cm
Age- 3.4 estuarine? Sex- F Length- 42 cm
Age- 2.1 Sex- M Length- 53 cm
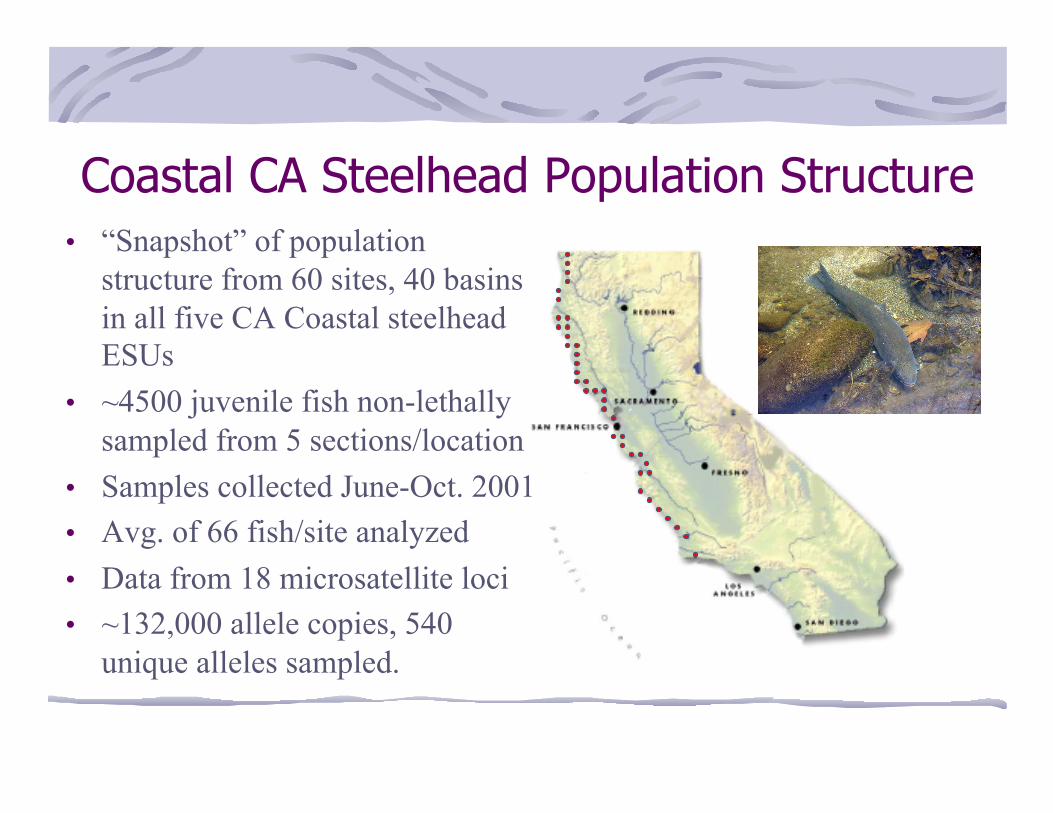
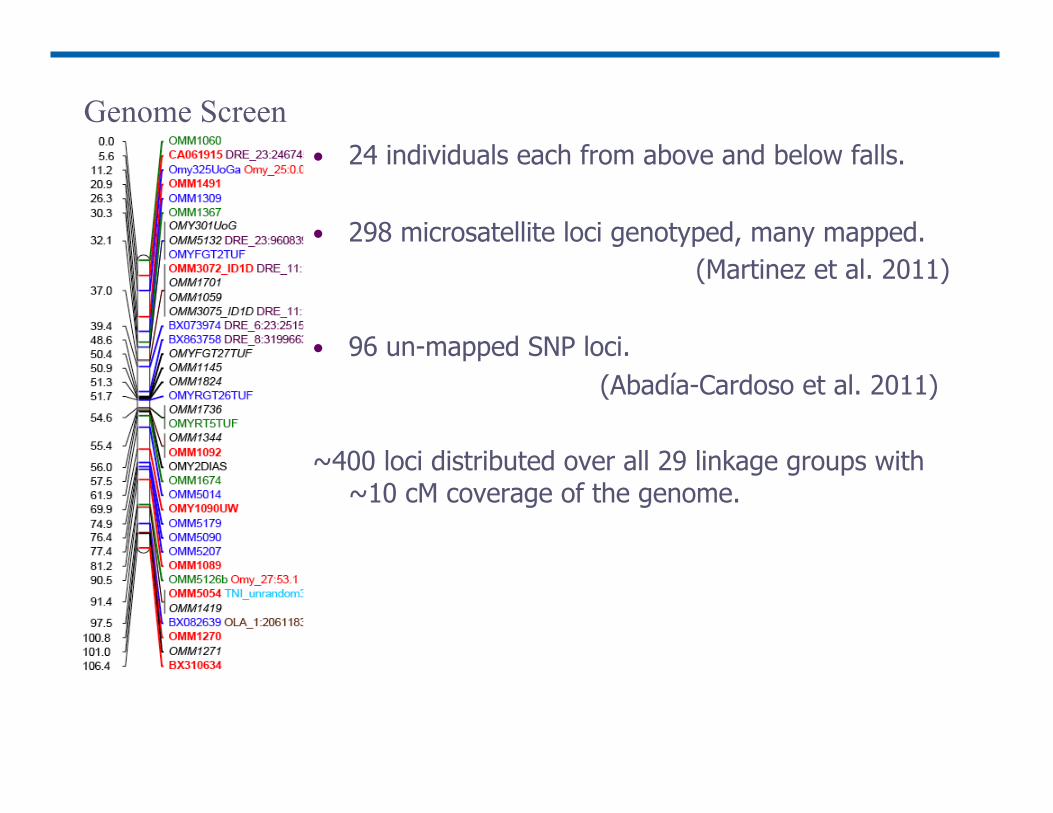
Coastal CA Steelhead Population Structure • “Snapshot” of population
structure from 60 sites, 40 basins in all five CA Coastal steelhead ESUs
• ~4500 juvenile fish non-lethally sampled from 5 sections/location
• Samples collected June-Oct. 2001 • Avg. of 66 fish/site analyzed • Data from 18 microsatellite loci • ~132,000 allele copies, 540
unique alleles sampled.
100 replicates
Redwood-Prairie
BigCk
SanL-Bear!Waddell
Pescadero Scott
SanL-Boulder!
Corralitos SanL-Zayante!
SanPedro SanL-Carbonera
Chorro SanSimeon
Carmel
BigSur WillowCk!
Mont
507 656
Redwd!Marin
Walker Lagunitas
Blueline Olema
949 Miller!
LosTrancos
558
Big-Humb
Smith-Rowdy
Klamath-Hunter WilsonCk
794
767
Klamath-HLinto Klamath-Blue!
597
831
Redwood-Panther Redwood- LostMan!
Freshwater 891
719 702
Mattole-Bear BearHumb Eel-HTree Mad-Blue
Eel-Indian Eel-Willits Eel-Lawrence Mad-Canon
Mad-Sullivan
934
647 707
777
Ten-LNFk Ten-SFk
Ten-Smith Ten-Redwd
507
Wages Usal Elk
Gualala Garcia
652 Big
Noyo NoyoSfk
Albion Noyo-Kass Noyo-LNFk
912 BigSalmon
Pudding Navarro
Russian
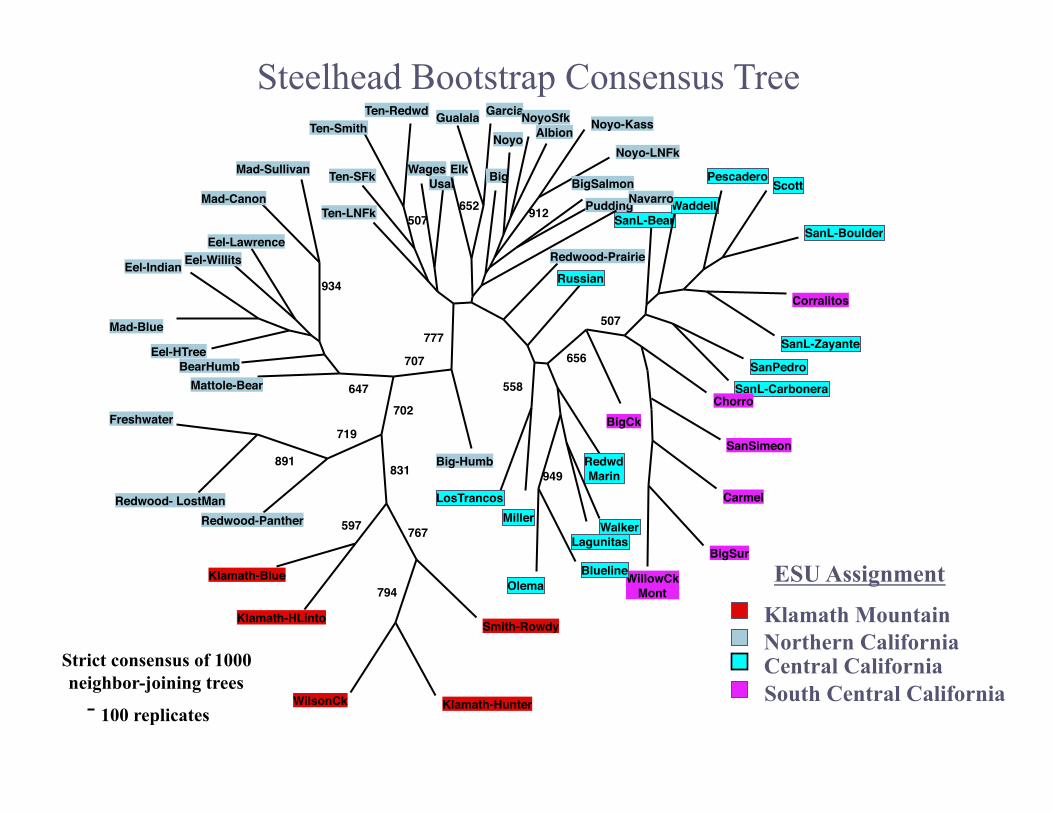
Steelhead Bootstrap Consensus Tree
South Central California
Klamath Mountain Northern California Central California
ESU Assignment
Strict consensus of 1000 neighbor-joining trees
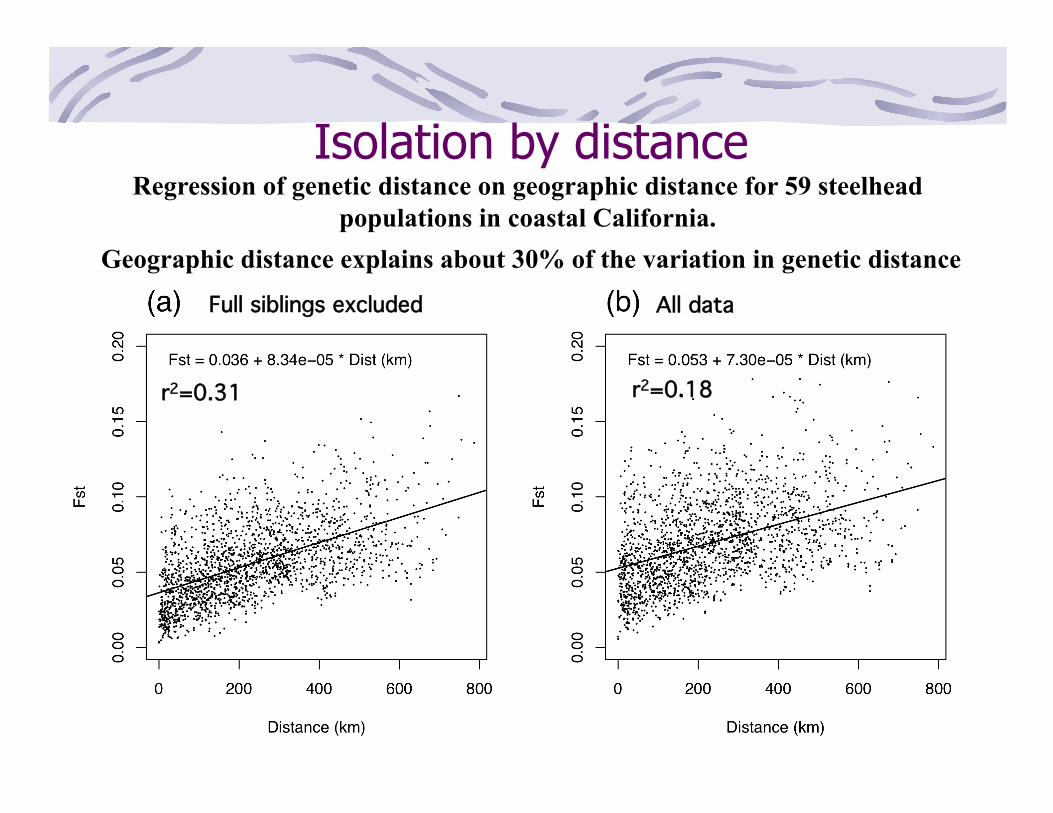
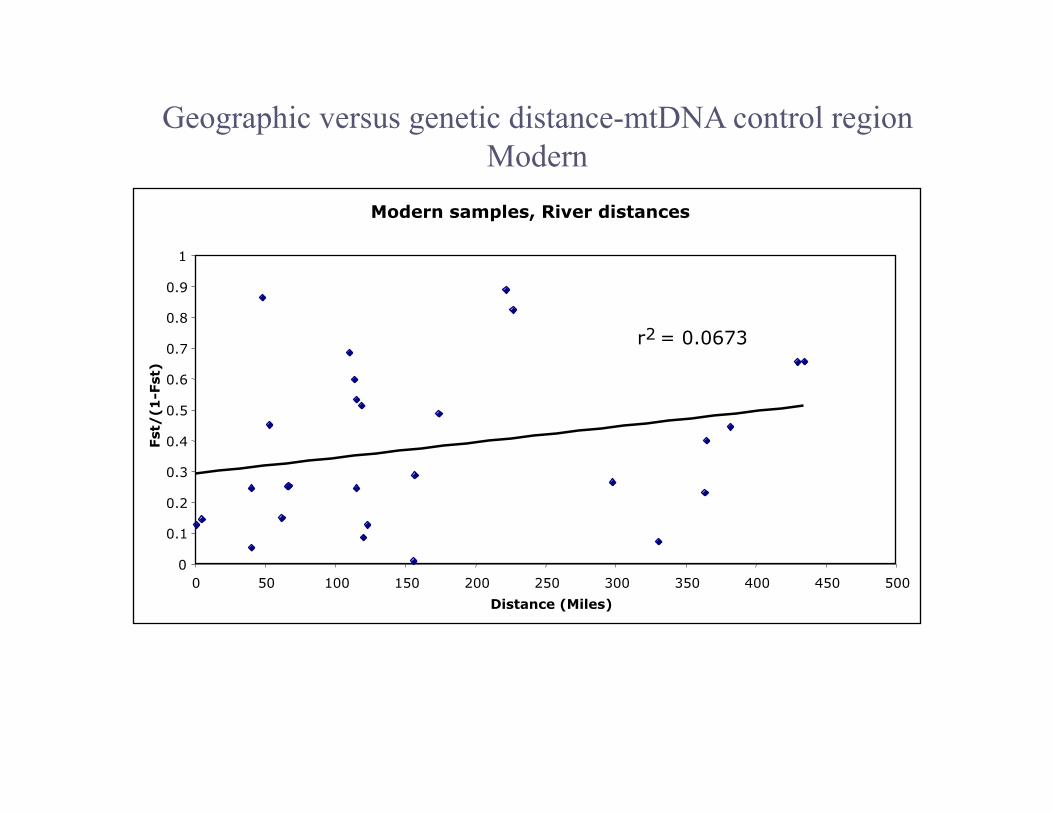
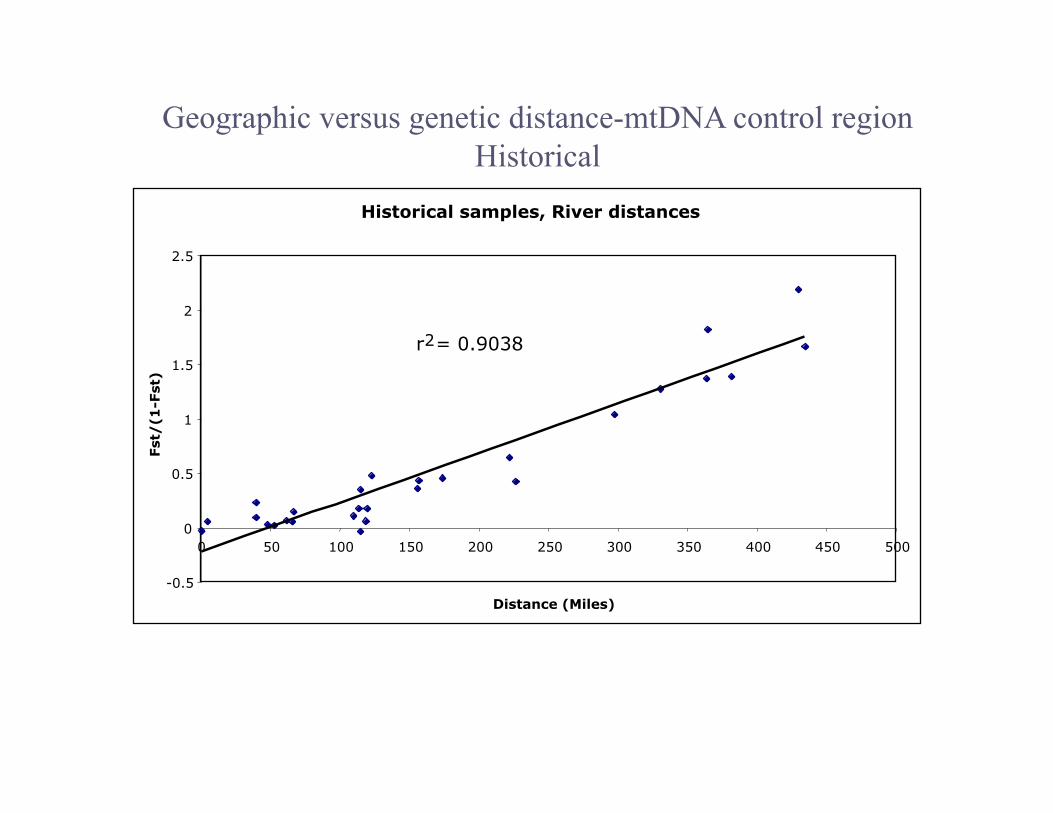
Isolation by distance Regression of genetic distance on geographic distance for 59 steelhead
populations in coastal California. Geographic distance explains about 30% of the variation in genetic distance
r2=0.31! r2=0.18!
All data!Full siblings excluded!
Model Based Clustering Assignment Tests
Coastal CA Steelhead Population Structure
Model Based Clustering Assignment Tests Coastal CA Steelhead Population Structure
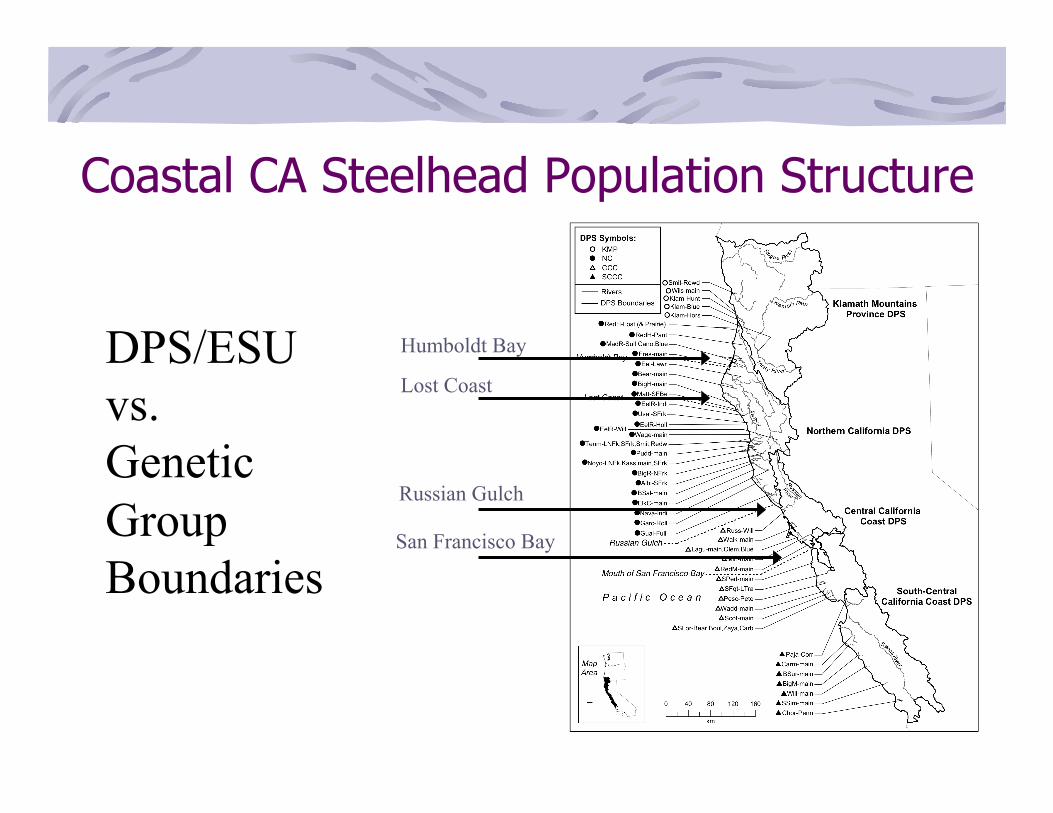
DPS/ESU vs. Genetic Group Boundaries
Coastal CA Steelhead Population Structure
Humboldt Bay
Lost Coast
Russian Gulch
San Francisco Bay
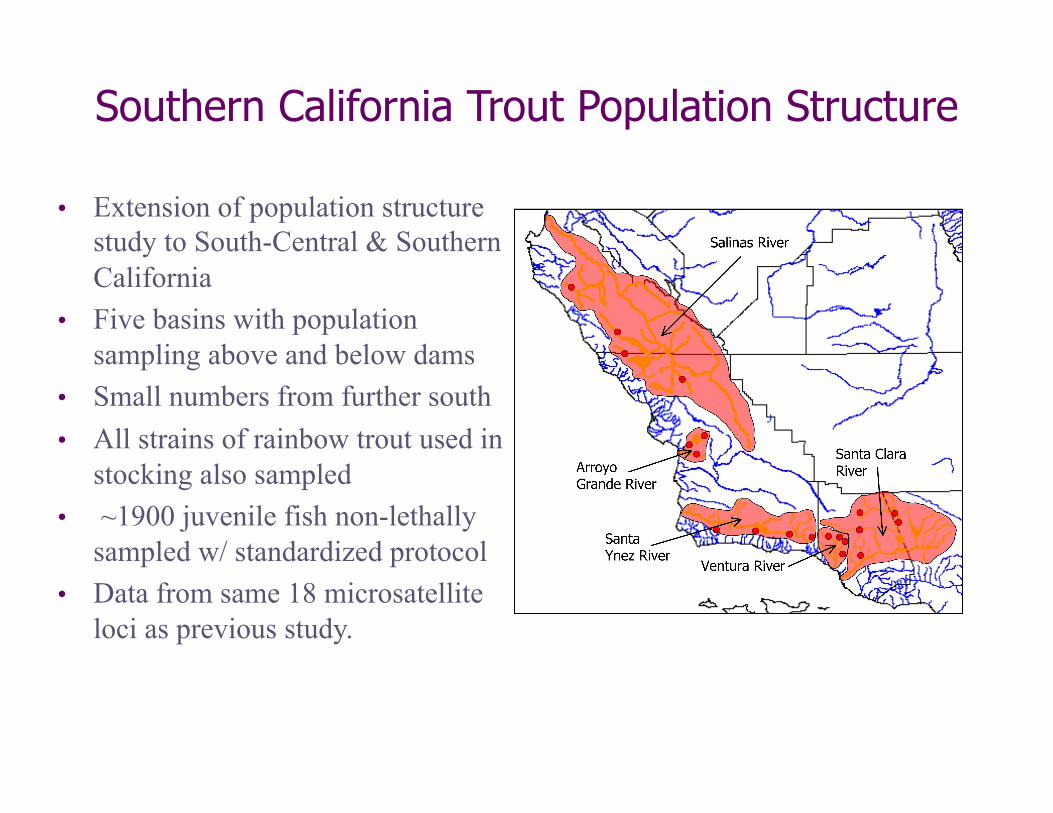
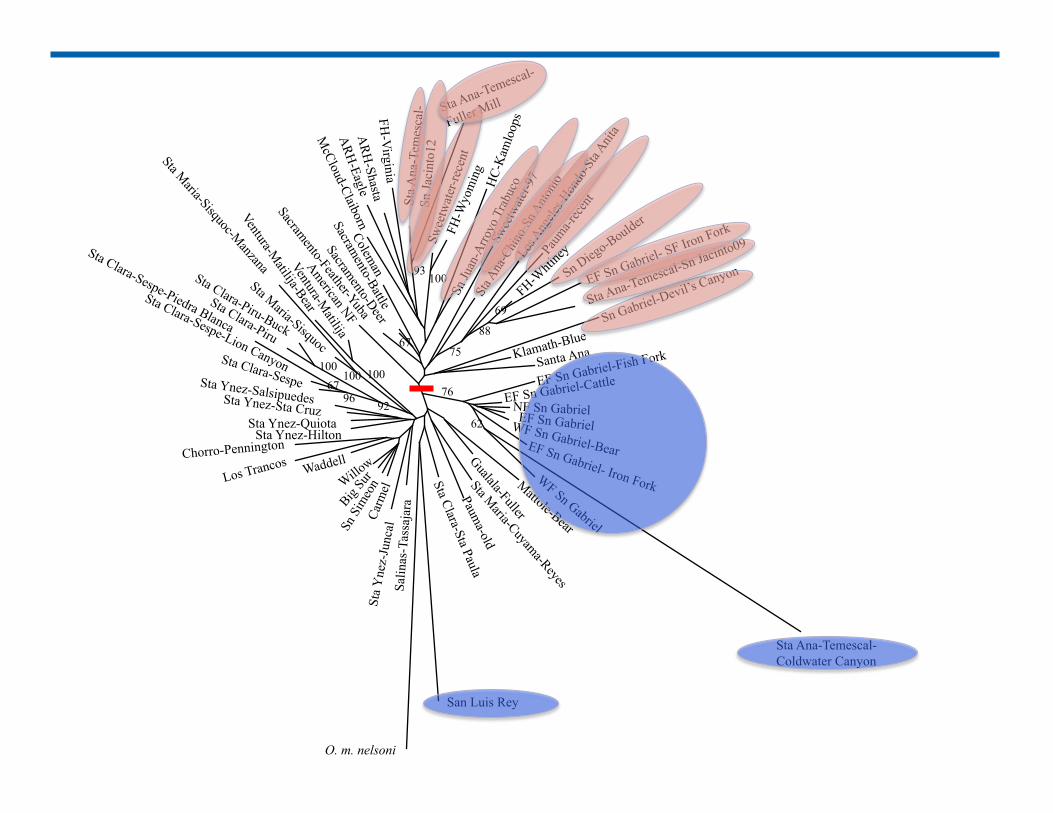
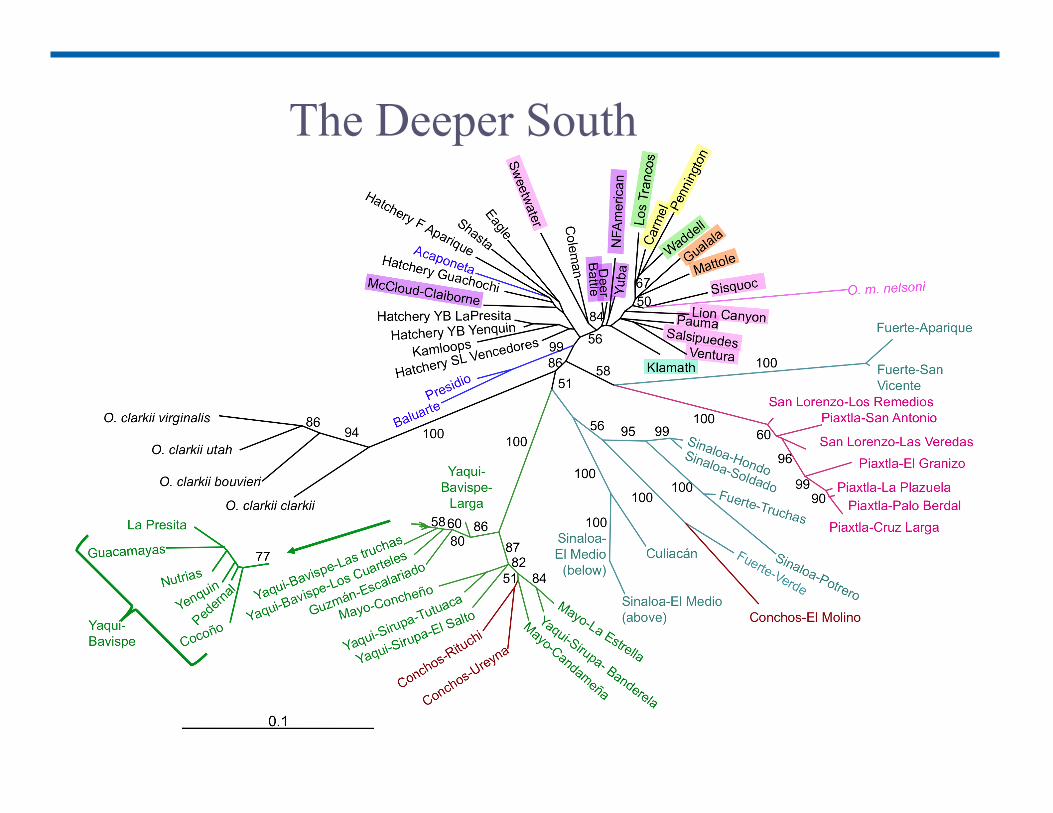
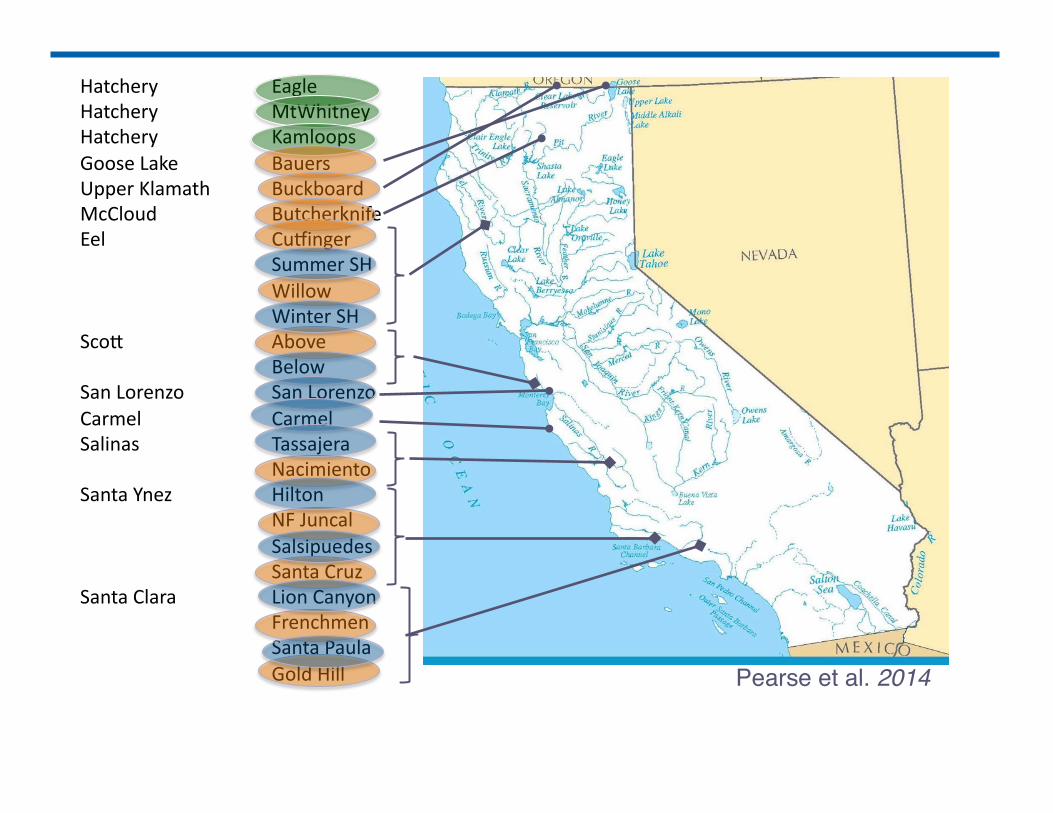
Southern California Trout Population Structure
• Extension of population structure study to South-Central & Southern California
• Five basins with population sampling above and below dams
• Small numbers from further south • All strains of rainbow trout used in
stocking also sampled • ~1900 juvenile fish non-lethally
sampled w/ standardized protocol • Data from same 18 microsatellite
loci as previous study.
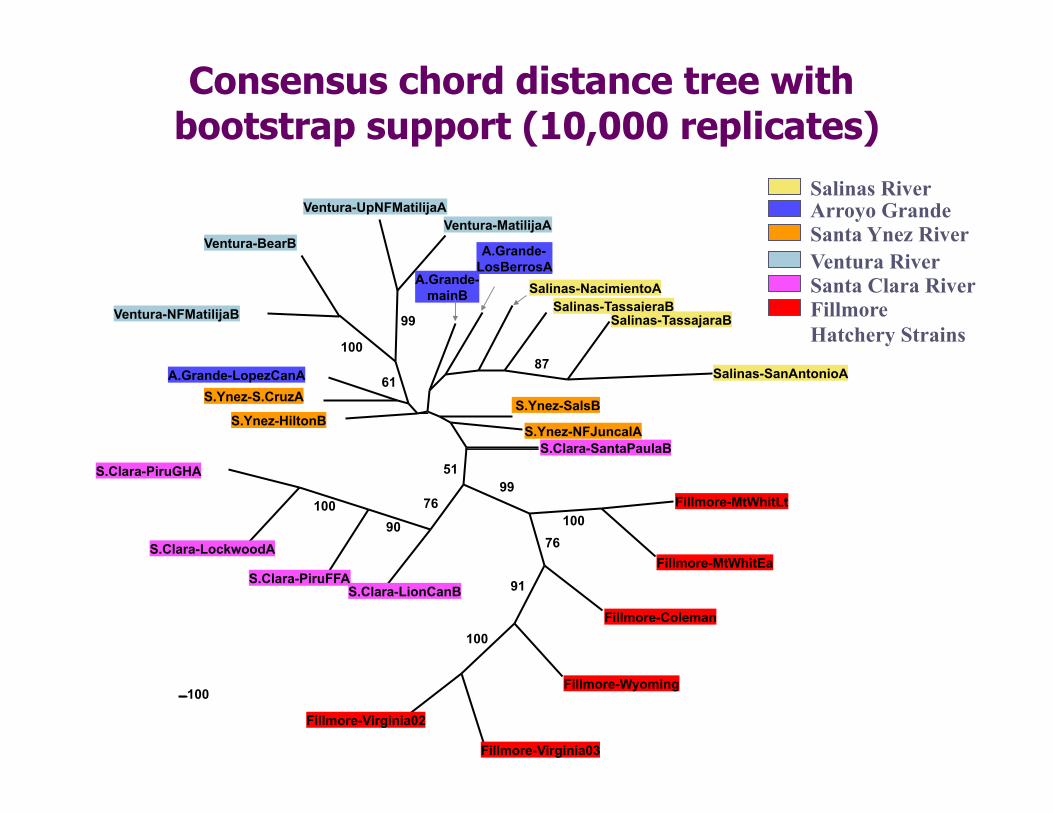
Consensus chord distance tree with bootstrap support (10,000 replicates)
Santa Clara River
Salinas River Arroyo Grande Santa Ynez River
Fillmore Hatchery Strains
Ventura River
100
S.Ynez-SalsB
S.Ynez-NFJuncalA S.Clara-SantaPaulaB
Fillmore-MtWhitLt
Fillmore-MtWhitEa
100
Fillmore-Coleman
Fillmore-Wyoming
Fillmore-Virginia03
Fillmore-Virginia02
100
91
76
99
S.Clara-LionCanB S.Clara-PiruFFA
S.Clara-LockwoodA
S.Clara-PiruGHA
100 90
76
51
S.Ynez-HiltonB
S.Ynez-S.CruzA A.Grande-LopezCanA
Ventura-NFMatilijaB
Ventura-BearB
100
Ventura-UpNFMatilijaA Ventura-MatilijaA
99
61
A.Grande- mainB
A.Grande- LosBerrosA
Salinas-NacimientoA Salinas-TassajeraB
Salinas-TassajaraB
Salinas-SanAntonioA 87
Fillmore Hatchery Southern Steelhead
Factorial Correspondence Analysis
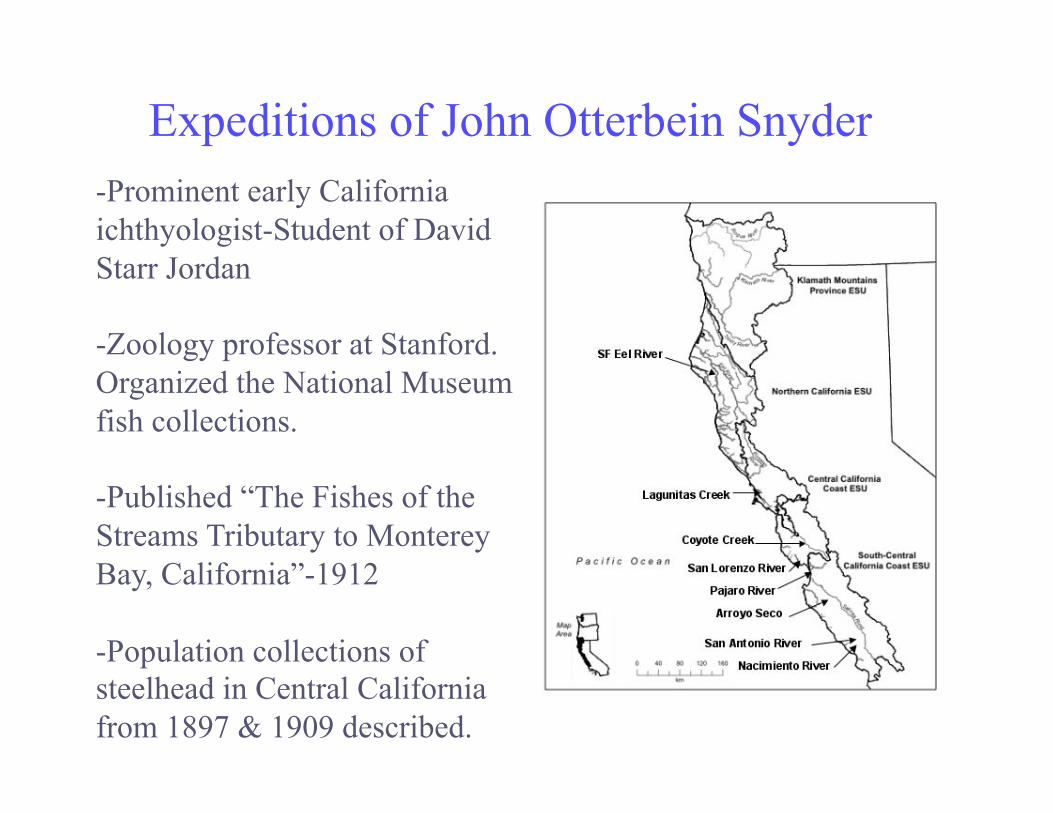
Expeditions of John Otterbein Snyder -Prominent early California ichthyologist-Student of David Starr Jordan
-Zoology professor at Stanford. Organized the National Museum fish collections.
-Published “The Fishes of the Streams Tributary to Monterey Bay, California”-1912
-Population collections of steelhead in Central California from 1897 & 1909 described.
Historical ModernWatershed Location Year N Year NEel River South Fork 1897 30 2001, 03 24Lagunitas Creek 1909 10 2001, 03 20Coyote Creek 1909 15 1998-2000 40San Lorenzo River 1897, 1909 41 2002, 04 32Pajaro River Uvas Creek 1909 19 1997, 98 16
Llagas Creek 1897 13 1997, 98 32Salinas River Arroyo Seco 1897, 1909 33 2001 32
San Antonio River 1909 27 2003 22Nacimiento River 1909 24 2003 22
TOTAL: 212 240American River Hatchery-Mt. Shasta - 2002 24Santa Clara River Hatchery-Virginia - 2003 23
Sampling for Historical Steelhead Study
Mitochondrial DNA- ~200bp section of control region
-Lagunitas population coho!
-No significant difference in number of alleles/diversity
-Four new alleles detected: 3 historically, 1 contemporary
-Differences range from very minor to dramatic
-No major replacement with hatchery stocks, although poorly sampled
Eel River
San Lorenzo
Pajaro-Llagas
Pajaro-Uvas
Salinas-Nacimiento
Coyote Creek
Salinas-Arroyo Seco
Salinas-San Antonio
Mt Shasta Virginia
Results
Mitochondrial DNA- ~200bp section of control region
-Lagunitas population coho!
-No significant difference in number of alleles/diversity
-Four new alleles detected: 3 historically, 1 contemporary
-Differences range from very minor to dramatic
-No major replacement with hatchery stocks, although poorly sampled
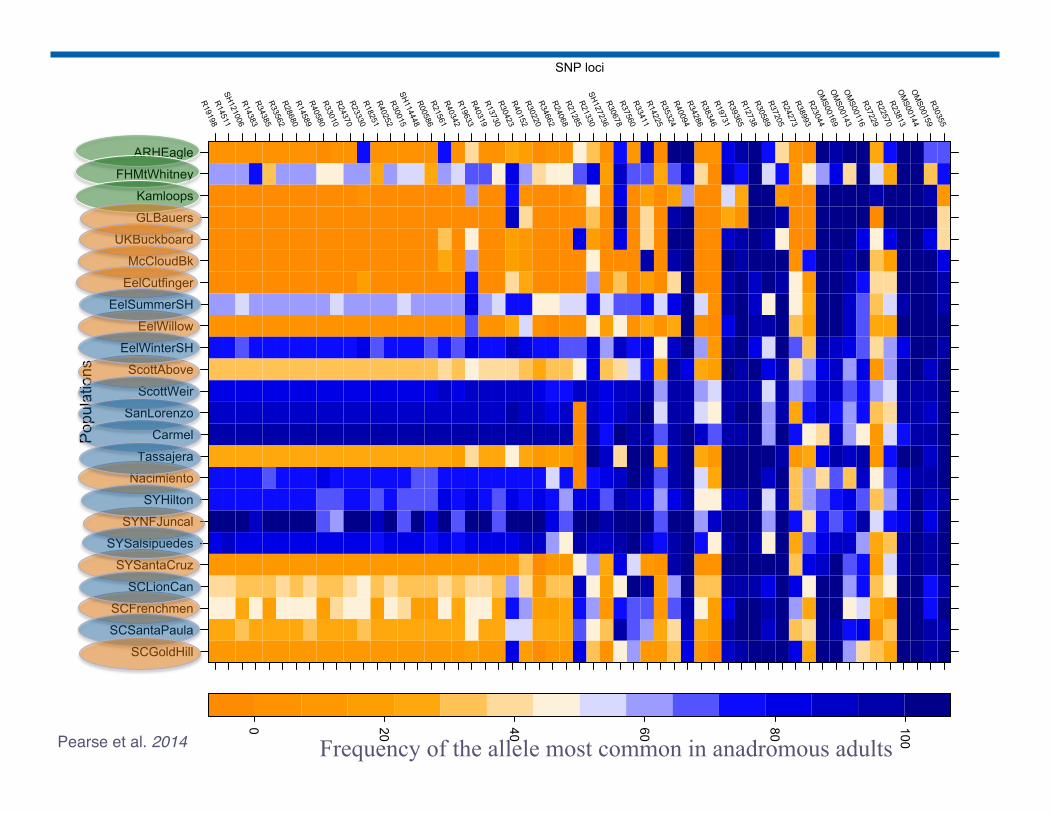
0 20 40 60 80 100Pearse et al. 2014! Frequency of the allele most common in anadromous adults
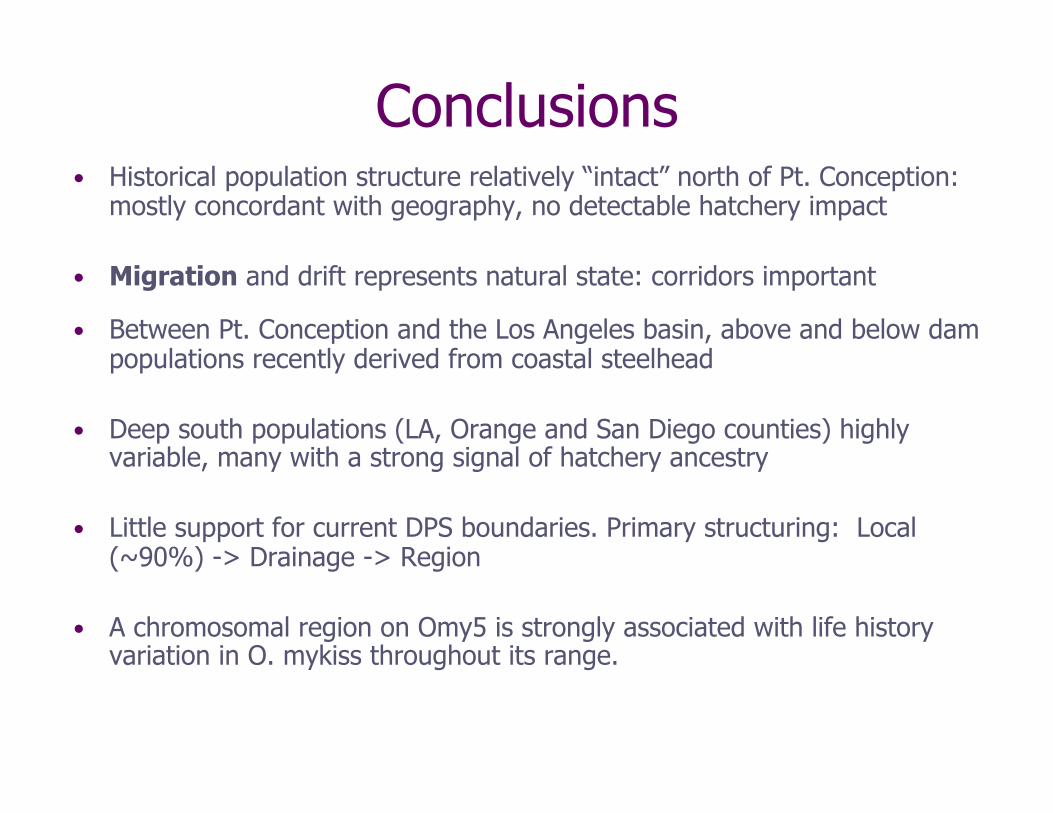
Conclusions • Historical population structure relatively “intact” north of Pt. Conception:
mostly concordant with geography, no detectable hatchery impact
• Migration and drift represents natural state: corridors important
• Between Pt. Conception and the Los Angeles basin, above and below dam populations recently derived from coastal steelhead
• Deep south populations (LA, Orange and San Diego counties) highly variable, many with a strong signal of hatchery ancestry
• Little support for current DPS boundaries. Primary structuring: Local (~90%) -> Drainage -> Region
• A chromosomal region on Omy5 is strongly associated with life history variation in O. mykiss throughout its range.
Acknowledgements • Eric Anderson • Joe Anderson • Andres Aguilar • Russell Barabe • David Boughton • Anthony Clemento • Heidi Fish • Libby Gilbert-Horvath • Derek Girman • Steve Gough • David Hamm
• Terry Jackson • Sandi Jacobson • Mary Larson • Chris Lima • Jack Marshall • Andy Martinez • Edith Martinez • Dennis McEwan • Chris McKibbin • Brian Spence • Tommy Williams
Other collaborators who helped in sample collection. Funding: Fishery Restoration Grant Program, NOAA Fisheries