1 The Outlook for Energy includes Exxon Mobil Corporation’s internal estimates and forecasts of energy demand, supply, and trends through 2040 based upon internal data and analyses as well as publicly available information from external sources including the International Energy Agency. Work on the report was conducted throughout 2015. This presentation includes forward looking statements. Actual future conditions and results (including energy demand, energy supply, the relative mix of energy across sources, economic sectors and geographic regions, imports and exports of energy) could differ materially due to changes in economic conditions, technology, the development of new supply sources, political events, demographic changes, and other factors discussed herein and under the heading “Factors Affecting Future Results” in the Investors section of our website at www.exxonmobil.com. This material is not to be used or reproduced without the permission of Exxon Mobil Corporation. All rights reserved. The Outlook for Energy: A View to 2040 Tahmid Mizan June 27, 2016
Transcript
1
The Outlook for Energy includes Exxon Mobil Corporation’s internal estimates and forecasts of energy demand, supply, and trends through 2040 based upon internal data and analyses as well as publicly available information from external sources including the International Energy Agency. Work on the report was conducted throughout 2015. This presentation includes forward looking statements. Actual future conditions and results (including energy demand, energy supply, the relative mix of energy across sources, economic sectors and geographic regions, imports and exports of energy) could differ materially due to changes in economic conditions, technology, the development of new supply sources, political events, demographic changes, and other factors discussed herein and under the heading “Factors Affecting Future Results” in the Investors section of our website at www.exxonmobil.com. This material is not to be used or reproduced without the permission of Exxon Mobil Corporation. All rights reserved.
The Outlook for Energy: A View to 2040 Tahmid Mizan June 27, 2016
2
Global fundamentals
3
ExxonMobil 2016 Outlook for Energy
0%
25%
50%
75%
100%
125%
2014 20400%
25%
50%
75%
100%
125%
2014 20400%
25%
50%
75%
100%
125%
2014 20400%
25%
50%
75%
100%
125%
2014 2040
Global Trends Continue to Evolve
GDP
Population Demand
Carbon Emissions
Percent
Growth from 2014 Level
4
ExxonMobil 2016 Outlook for Energy
Energy Fuels Human Development
0.00
0.25
0.50
0.75
1.00
10 100 1000 10000
U.N. Human Development Index 2013 Index
Source: United Nations, ExxonMobil estimates Energy Use per Capita (Thousand BTU/person/day)
Norway United States
Brazil
Germany
Niger
India China
Nigeria
Bangladesh
5
ExxonMobil 2016 Outlook for Energy
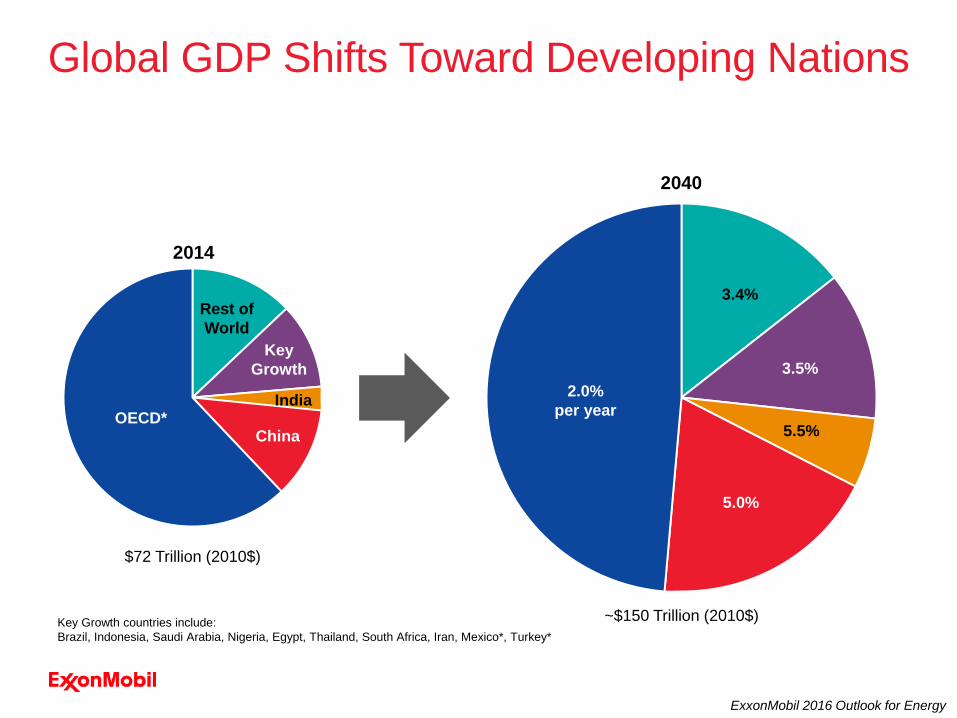
Global GDP Shifts Toward Developing Nations
2014
2040
$72 Trillion (2010$)
~$150 Trillion (2010$) Key Growth countries include: Brazil, Indonesia, Saudi Arabia, Nigeria, Egypt, Thailand, South Africa, Iran, Mexico*, Turkey*
2.0% per year
5.0%
5.5%
3.5%
3.4%
OECD* China
India
Key Growth
Rest of World
6
ExxonMobil 2016 Outlook for Energy
0
200
400
600
800
1000
1200
1400
2000 2020 20400
40
80
120
160
2000 2020 20400
3
6
9
12
15
18
21
2000 2020 2040
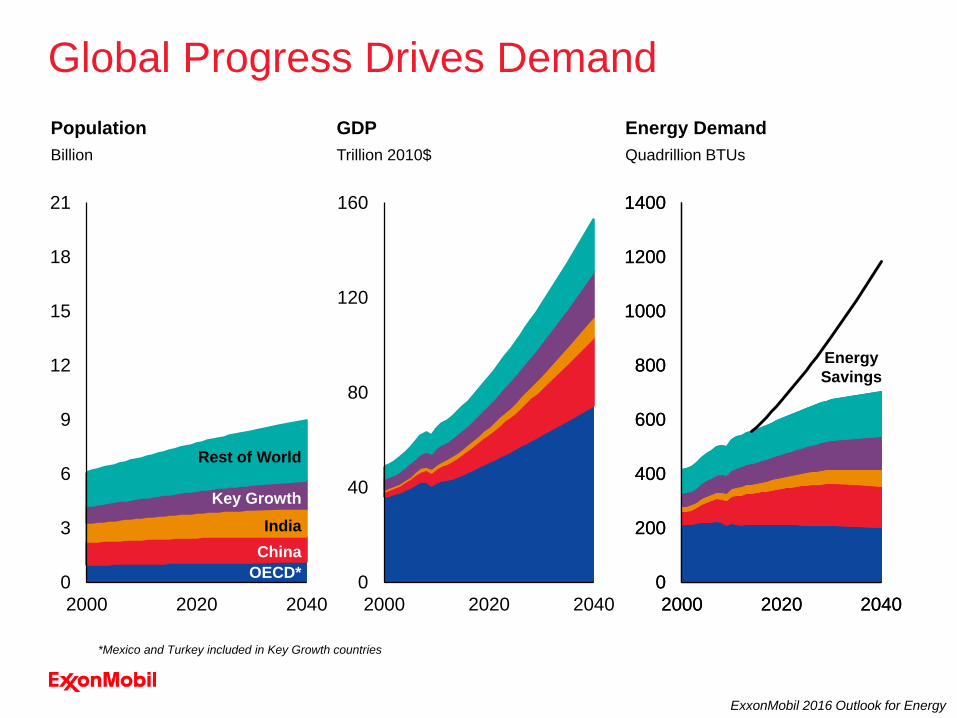
Global Progress Drives Demand Population Billion
GDP Trillion 2010$
Energy Demand Quadrillion BTUs
OECD*
Key Growth
China India
Rest of World
Energy Savings
0
200
400
600
800
1000
1200
1400
2000 2020 2040
*Mexico and Turkey included in Key Growth countries
7
ExxonMobil 2016 Outlook for Energy
0
5
10
15
1970 1980 1990 2000 2010 2020 2030 2040
Technology Helps Us Do More With Less Global Average Energy Intensity Thousand BTUs per dollar GDP (2010$)
2014
8
Emissions
9
ExxonMobil 2016 Outlook for Energy
~ 35 $/ton
~ 20 $/ton
~ 80 $/ton
< 10 $/ton
2040 CO2 “Proxy” Cost
CO2 Policy Assumptions Vary by Region
10
ExxonMobil 2016 Outlook for Energy
0%
25%
50%
75%
100%
2014 20400
10
20
30
40
2000 2020 2040
Energy-Related CO2 Emissions by Region Billion Tonnes
CO2 Emissions Plateau Energy Mix Shifts to Lower-Carbon Fuels
India
Key Growth
Rest of World
OECD*
China
Global Energy Mix Percent
Oil
Coal
Gas
Biomass Renewables Nuclear
*Mexico and Turkey included in Key Growth countries
11
Transportation
12
ExxonMobil 2016 Outlook for Energy
0
25
50
75
2000 2020 2040
Sector Demand MBDOE
Light Duty
Marine
Rail
Heavy Duty
Aviation
Transportation Demand
Commercial
13
ExxonMobil 2016 Outlook for Energy
0
15
30
45
60
75
2010 2020 2030 20400
15
30
45
60
75
2010 2020 2030 2040
Average Vehicle Efficiency On-Road Miles per Gallon
Average Fleet
Light Duty Vehicle Efficiency
0
200
400
600
800
1000
1200
1400
1600
1800
2010 2015 2020 2025 2030 2035 2040
Elec/Plug-in/Fuel CellHybridNatural Gas & LPGDieselGasoline
Fleet by Type Million
U.S.
Europe
14
Industrial
15
ExxonMobil 2016 Outlook for Energy
0
100
200
300
1980 2010 2040
Industrial Demand By Sector Quadrillion BTUs
Other
Energy Industry
Heavy Industry
Chemical
0
100
200
300
1980 2010 2040
By Fuel Quadrillion BTUs
Oil
Gas
Coal
Biomass
Electricity
16
ExxonMobil 2016 Outlook for Energy
Chemicals Demand Grows Globally
0
10
20
30
40
2000 2020 2040
Asia Pacific
Europe
North America
Middle East
Russia/Caspian Latin America
Africa
MBDOE By Region
MBDOE
By Sector
0
10
20
30
40
2000 2020 2040
Steam Cracking
Fertilizer
Other Chemicals
17
ExxonMobil 2016 Outlook for Energy
0
10
20
30
40
2000 2020 2040
Chemicals Demand Sees Significant Growth
MBDOE
By Sector MTA
Ethylene Production
0
100
200
300
2010 2025 2040
Asia Pacific
Rest of World
North America
Steam Cracking
Fertilizer
Other Chemicals
18
ExxonMobil 2016 Outlook for Energy
North America MBDOE
Chemicals Energy Demand by Region Asia Pacific MBDOE
Naphtha
Electricity/Heat
Gas Liquids
Coal
Gas
Other Oil
0
4
8
12
16
'00 '10 '20 '30 '40
Europe MBDOE
0
4
8
12
16
'00 '10 '20 '30 '400
4
8
12
16
'00 '10 '20 '30 '40
19
Electricity generation
20
ExxonMobil 2016 Outlook for Energy
0
10
20
30
40
2000 2020 2040
Electricity Grows in Developing Economies Electricity Demand by Region Thousand TWh
United States
OECD*
China
India Key Growth
Rest of World
*Mexico and Turkey included in Key Growth countries
0
5
10
15
1980 2010 2040
Per Capita Demand MWh per person
United States
India
Europe China
Key Growth
2014
21
ExxonMobil 2016 Outlook for Energy
0
10
20
30
40
2000 2020 2040
2010
2040
0
500
1000
1500
Nuclear Wind Solar0
500
1000
1500
Nuclear Wind Solar
GW Global Capacity
Global Electricity Generation Mix Evolves
Global Capacity Utilized
2014
2040
Thousand TWh By Generation Type
Wind & Solar
Oil
Coal
Nuclear
Other Renewables
Gas
22
ExxonMobil 2016 Outlook for Energy
Oil
A Shift in Electricity Generation
-2 0 2 4 6
OECD*ChinaIndiaKey GrowthRest of World
Thousand TWh Change in Electricity Net Delivered 2014-2040
Gas
Wind/Solar
Nuclear
Other Renewables
Coal
*Mexico and Turkey included in Key Growth countries