29
A View to 2030 December 13, 2005 The Outlook for Energy

A View to 2030
December 13, 2005
The Outlook for Energy

Cautionary Statement
This presentation includes forward-looking statements. Actual future conditions (including economic conditions, energy demand, and energy supply) could differ materially due to changes in technology, the development of new supply sources, political events, demographic changes, and other factors discussed herein (and in Item 1 of ExxonMobil’s latest report on Form 10-K). This material is not to be reproduced without the permission of Exxon Mobil Corporation.

A View to 2030
Jaime SpellingsGeneral Manager, Corporate PlanningDecember 13, 2005
The Outlook for Energy

Energy Outlook Basis
• Energy Outlook Buildup – Energy demand by countries and end use sectors– Total energy growth linked to economic drivers– Incorporates efficiency improvements– Fuel shares consider trends, economics, supply
• Oil & Gas supply outlook– Ultimate recoverable resources estimated– Production profiles modeled for key countries
• Outlook based on key assumptions– Growing population, improving living standards– Ongoing improvement in efficiency– Timely and adequate energy supplies– Technology advances for supply and demand
0
50
100
150
200
250
300
350
1980 2005 2030
OilOil
GasGas
CoalCoal
OtherOther
Energy Supply/Demand
MBDOE

Global Population - 80% in Developing Areas
0.4
Africa0.8
Middle East0.2
Russia/Caspian0.3
0.4
Europe0.6
Asia Pacific0.2
Asia Pacific3.2
Latin America
North America
World6.0 B
2000
2000 Non-OECD
OECD
Source: World Bank
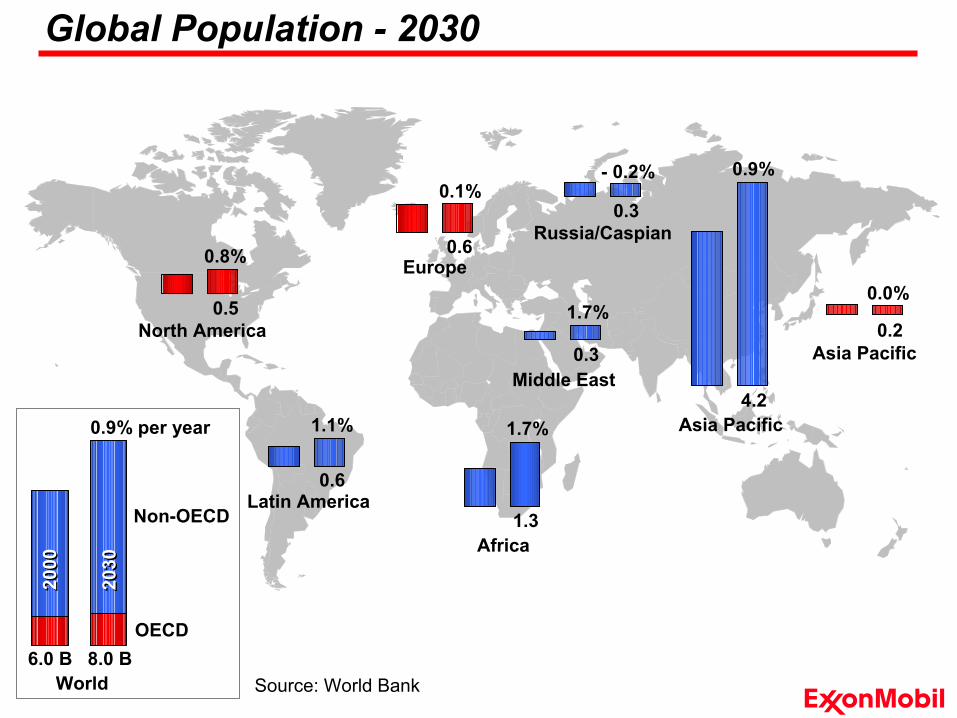
Global Population - 2030
Latin America0.6
1.1%
Africa1.3
1.7%
Middle East0.3
1.7%
Russia/Caspian0.3
- 0.2%
North America0.5
0.8% Europe0.6
0.1%
Asia Pacific0.2
0.0%
Asia Pacific4.2
0.9%
World8.0 B
0.9% per year
2000
2000
2030
2030
Non-OECD
OECD6.0 B
Source: World Bank
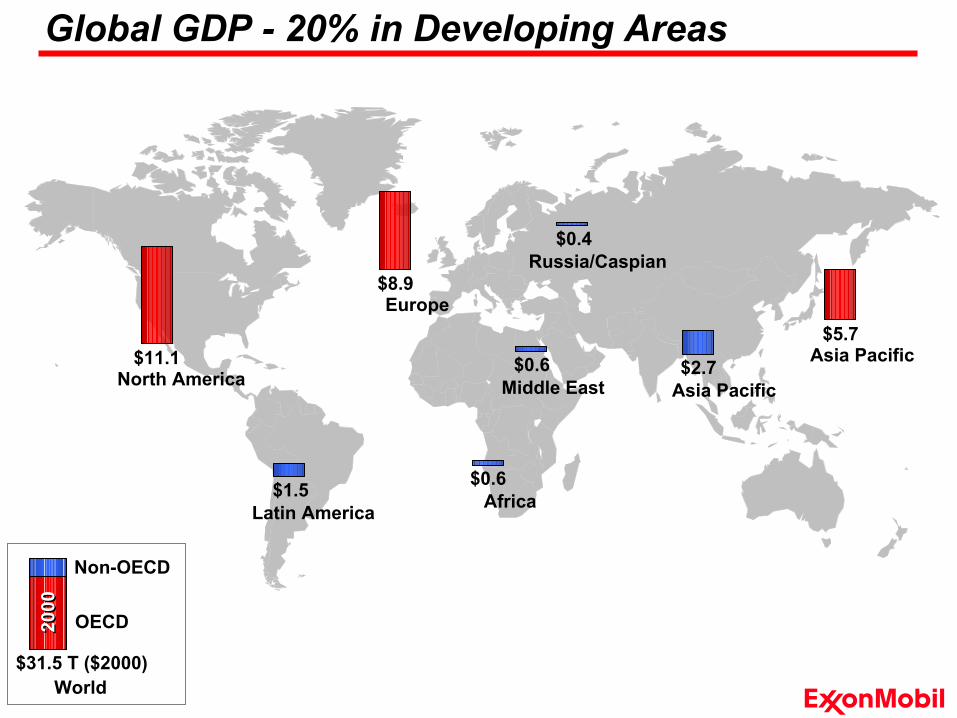
Global GDP - 20% in Developing Areas
OECD
World$31.5 T ($2000)
2000
2000
Non-OECD
$11.1
$1.5
Europe$8.9
Asia Pacific$5.7
Africa$0.6
Middle East$0.6
Russia/Caspian$0.4
Asia Pacific$2.7North America
Latin America
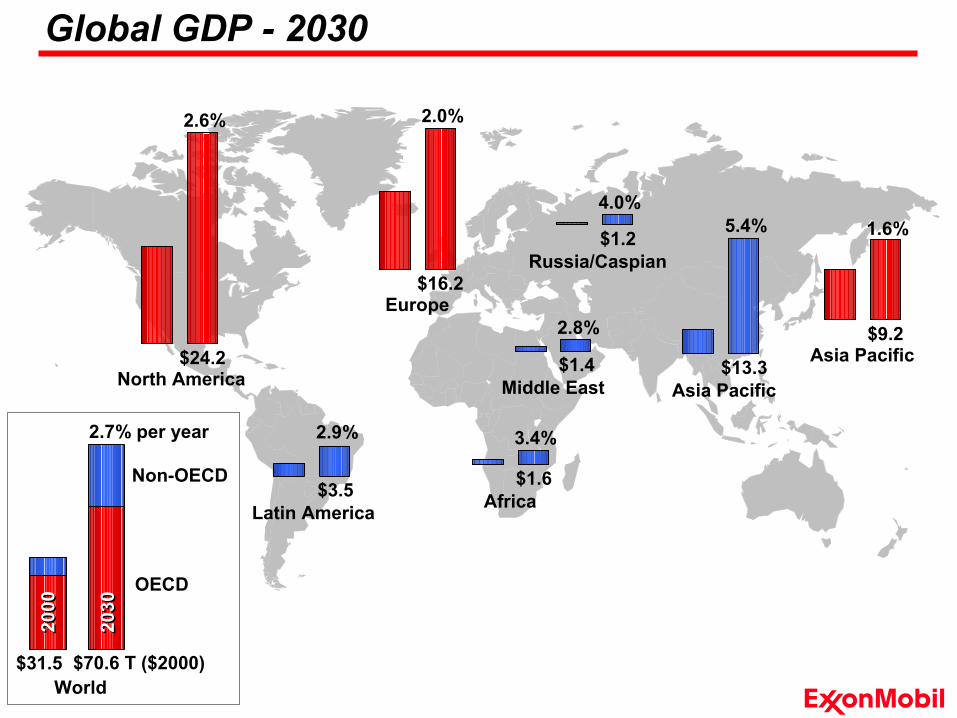
Global GDP - 2030
OECD
World$70.6 T ($2000)
2.7% per year
2000
2000
2030
2030
Non-OECD
North America
2.6%
$24.2
Latin America
2.9%
$3.5
Europe
2.0%
$16.2
Asia Pacific
1.6%
$9.2
Africa
3.4%
$1.6
Middle East
2.8%
$1.4
Russia/Caspian
4.0%
$1.2
Asia Pacific
5.4%
$13.3
$31.5
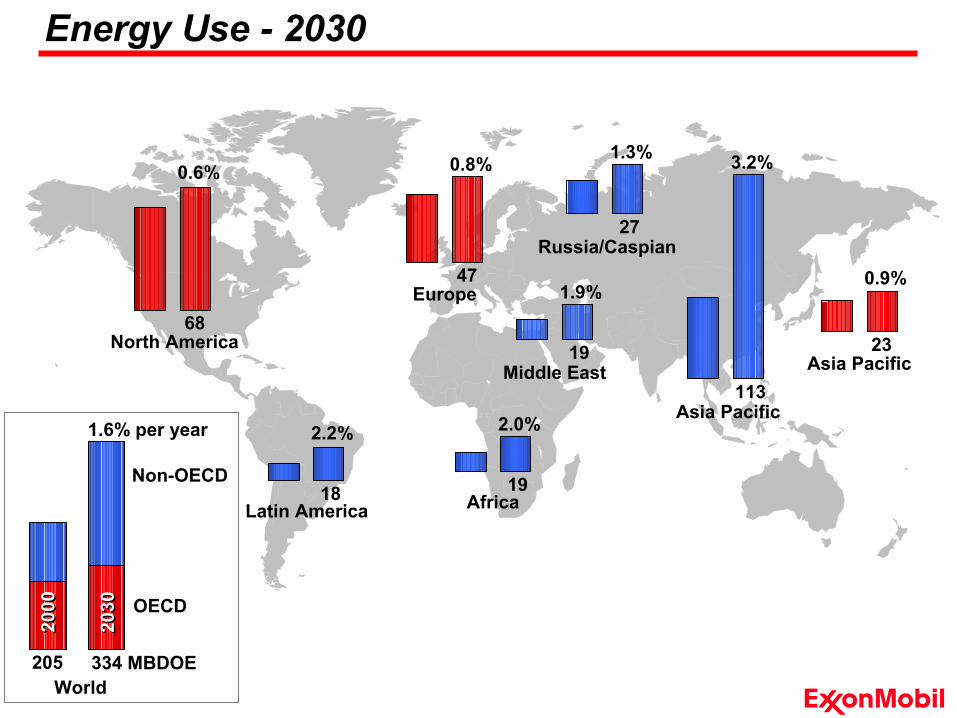
North America68
0.6%
World334 MBDOE
1.6% per year
2000
2000
2030
2030
Non-OECD
Latin America
2.2%
18 Africa
2.0%
19
Middle East
1.9%
19
Russia/Caspian
1.3%
27
Asia Pacific
3.2%
113
Europe47
0.8%
Asia Pacific23
0.9%
OECD
Energy Use - 2030
205

Energy Intensity - Declining Trend Accelerates
0
2
4
6
8
10
1980 1990 2000 2010 2020 2030
Non-OECD
OECD
Barrels of Oil Equivalent per $K GDP
-1.8%
-1.5%
-1.2%
Average Growth / Yr. 1980 - 2000
-1.4%
2000 - 2030

Energy Demand Grows
0
50
100
150
200
250
300
350
1980 1990 2000 2010 2020 2030
1.6%
1.7%1.7%
2.0%2.0%
1.7%1.7%
1.3%1.3%
Average Growth / Yr. 2000 - 2030
ElectricityElectricity
TransportTransportChemicalsChemicals
Heat/Other *Heat/Other *
Energy by UseMBDOE
* Heat/Other includes Residential, Commercial, Industrial, Agriculture

Average Growth / Yr. 2000 - 2030
Energy Demand Grows
0
50
100
150
200
250
300
350
1980 1990 2000 2010 2020 2030
Energy by Type
OilOil
GasGas
CoalCoal
OtherOther
MBDOE
1.6%
1.8%1.8%
1.4%1.4%
1.8%1.8%
1.6%1.6%
0
50
100
150
200
250
300
350
1980 1990 2000 2010 2020 2030
1.6%
1.7%1.7%
2.0%2.0%
1.7%1.7%
1.3%1.3%
ElectricityElectricity
TransportTransportChemicalsChemicals
Heat/Other *Heat/Other *
Energy by UseMBDOE
* Heat/Other includes Residential, Commercial, Industrial, Agriculture

Average Growth / Yr. 2000 - 2030
Oil and Gas Remain Predominant
0
1
2
3
4
1980 2005 20300
20
40
60
80
1980 2005 20300
50
100
150
200
250
300
350
1980 2005 2030
Total Energy Other Energy Wind & Solar
NuclearNuclear
HydroHydro
Biomass,MSW
Biomass,MSW
Wind & Solar
OilOil
GasGas
CoalCoal
OtherOther
MBDOE MBDOE MBDOE
1.8%1.8%
1.6%1.6%
1.8%1.8%
1.4%1.4%
1.6%
1.3%1.3%
1.9%1.9%
1.4%1.4% 9.6%9.6%
11.1%
SolarSolar
WindWind
12.4%12.4%

Average Growth / Yr. 2000 - 2030
Oil Growth Led by Non-OECD Transport Demand
0
10
20
30
40
50
60
70
1980 2005 2030
OECD
MBD
ElectricityElectricity
TransportTransport
ChemicalsChemicals
Heat/OtherHeat/Other
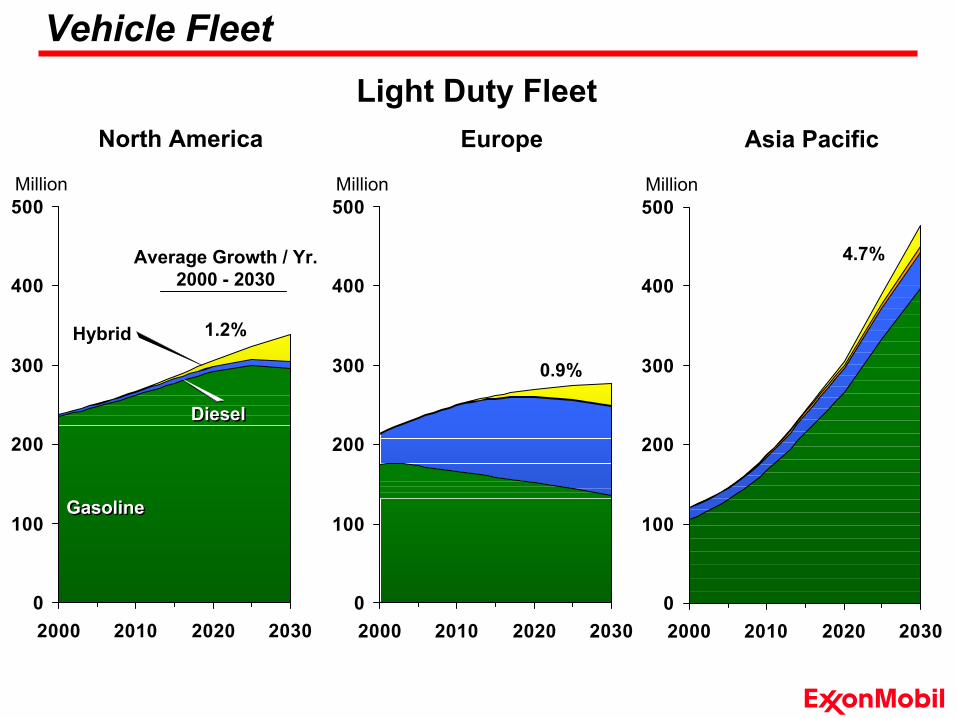
Light Duty Vehicles
0
10
20
30
40
50
60
70
1980 2005 2030
Non-OECD
MBD
0.1%0.1%
0.5%0.5%
0.6%0.6%
- 2.1%- 2.1%
0.3%
1.9%1.9%
3.4%3.4%
3.4%3.4%
0.6%0.6%
2.5%
Average Growth / Yr. 2000 - 2030
Vehicle Fleet
North America
0
100
200
300
400
500
2000 2010 2020 2030
Million
Light Duty Fleet
GasolineGasoline
1.2%
Europe
0
100
200
300
400
500
2000 2010 2020 2030
Million
0.9%
Asia Pacific
0
100
200
300
400
500
2000 2010 2020 2030
Million
4.7%
DieselDiesel
Hybrid
0
2
4
6
8
10
12
2000 2010 2020 2030
Average Growth / Yr. 2000 - 2030
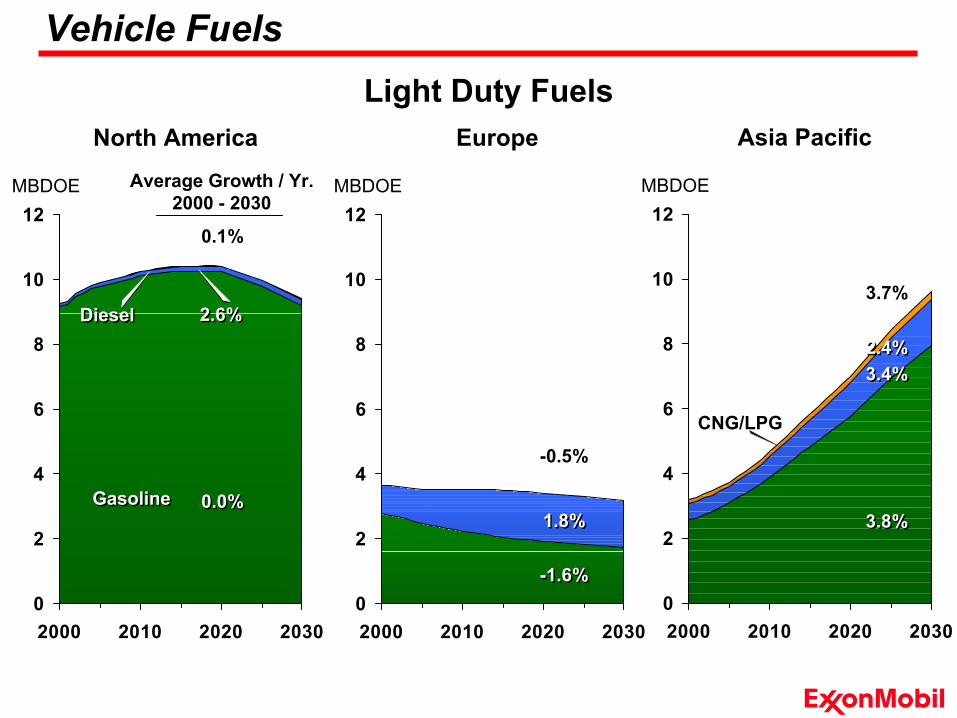
Vehicle Fuels
Asia Pacific
Light Duty Fuels
MBDOE
2.4%2.4%3.4%3.4%
3.8%3.8%
3.7%
Europe
0
2
4
6
8
10
12
2000 2010 2020 2030
MBDOE
-0.5%
1.8%1.8%
-1.6%-1.6%
North America
0
2
4
6
8
10
12
2000 2010 2020 2030
MBDOE
CNG/LPG
GasolineGasoline
0.1%
2.6%2.6%
0.0%0.0%
DieselDiesel

Conventional Oil Resources - 2005
North America
Latin America
Europe1.0
Middle East0.3
Africa
0.1
Asia Pacific
0.4
Russia/Caspian
2.2Remaining
Produced YE 2004
3.2 TBO
World
0.2
0.2
0.1
Conventional* Crude and Condensate (TBO)
* Excludes frontier resources – oil sands, extra heavy oil, shale oil

Worldwide Liquids Production ex. OPEC Crude
NonNon-OPEC Crude + CondensateOPEC Crude + Condensate
OPEC Condensate OPEC Condensate NGLNGL’’ss
BiofuelsOtherOther
Oil SandsOil Sands
0
20
40
60
80
100
120
1980
MBD
1990 2000 2010 2020 2030

NonNon-OPEC Crude + CondensateOPEC Crude + Condensate
OPEC Condensate OPEC Condensate NGLNGL’’ ss
BiofuelsOtherOther
0
20
40
60
80
100
120
1980
MBD
1990 2000 2010 2020 2030
Call on OPEC
~28
OPEC Crude
Liquids Demand
~30
~37~47
Oil SandsOil Sands
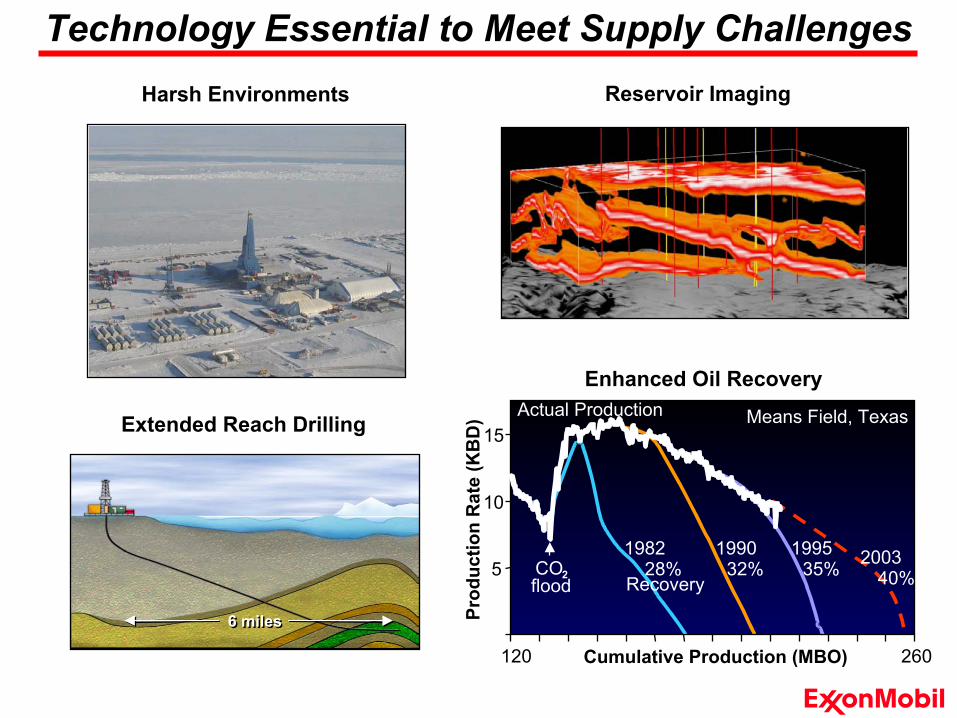
Technology Essential to Meet Supply ChallengesReservoir ImagingHarsh Environments
Enhanced Oil RecoveryMeans Field, Texas
CO2flood
1982 1990 1995 2003
Cumulative Production (MBO)
Prod
uctio
n R
ate
(KB
D)
120 260
28% 32% 35% 40%
Actual Production
Recovery5
10
15Extended Reach Drilling
6 miles6 miles
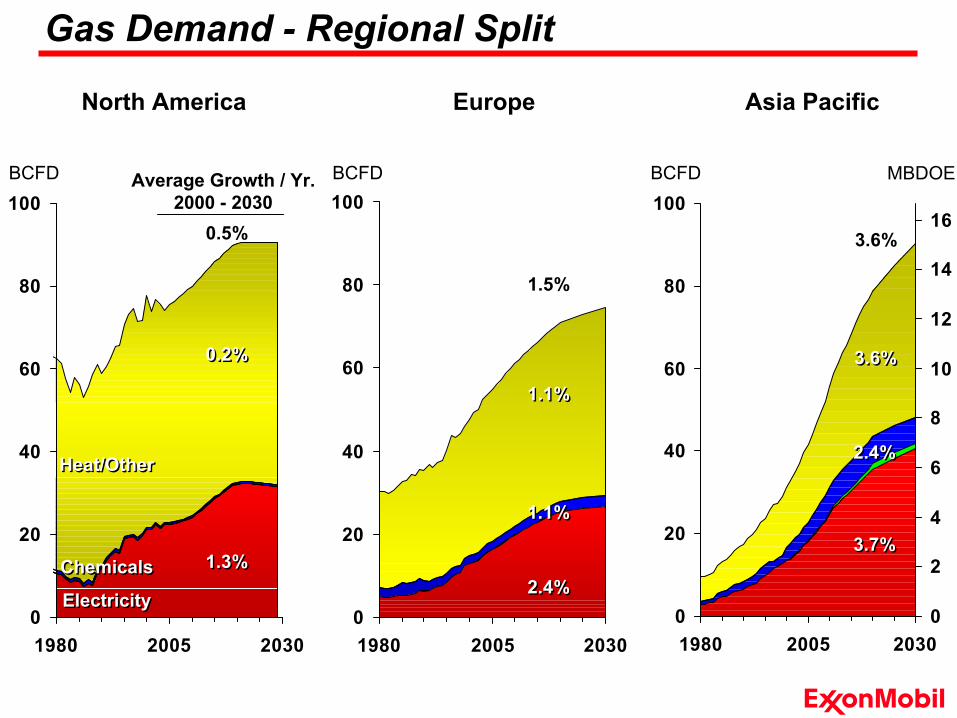
Gas Demand - Regional Split
0
20
40
60
80
100
1980 2005 2030
North America
0
20
40
60
80
100
1980 2005 20300
20
40
60
80
100
1980 2005 20300
2
4
6
8
10
12
14
16
Europe Asia Pacific
BCFD BCFD BCFD
ElectricityElectricityChemicalsChemicals
Heat/OtherHeat/Other
0.2%0.2%
1.3%1.3%
1.1%1.1%
1.1%1.1%
2.4%2.4%
2.4%2.4%
3.7%3.7%
0.5%
1.5%
3.6%3.6%
Average Growth / Yr. 2000 - 2030
3.6%
MBDOE

Growing Reliance on Gas Imports
0
20
40
60
80
100BCFD
North America Europe Asia Pacific
Local Production
Long Pipelines
2000
2000
2030
2030
LNG

Coal Demand - Regional Split
0
10
20
30
40
50
60
1980 2005 2030
North America
0
10
20
30
40
50
60
1980 2005 20300
10
20
30
40
50
60
1980 2005 2030
Europe Asia PacificMBDOE MBDOE MBDOE
ElectricityElectricity
Heat/Other -0.6%
0.5%0.5%
0.1%
0.0%0.0%0.1%0.1%
3.9%3.9%
0.4%
1.7%1.7%
Average Growth / Yr. 2000 - 2030
3.1%

Power Generation - Regional Split
0
10
20
30
40
50
60
1980 2005 20300
10
20
30
40
50
60
1980 2005 20300
10
20
30
40
50
60
1980 2005 2030
MBDOE MBDOE MBDOE
North America Europe Asia Pacific
OilOil HydroHydro
CoalCoal
GasGasNuclearNuclear
Other *
* Other includes Biomass, Wind and Solar
1.1%1.1%
0.5%0.5%
0.8%
Average Growth / Yr. 2000 - 2030
1.3%1.3%0.7%0.7%
0.1%0.1%
1.0%
2.4%2.4%
2.7%2.7%
3.9%3.9%
3.6%
3.7%3.7%

0
5
10
15
20
25
30
35
40
1980 1990 2000 2010 2020 2030
CO2 Growth - Primarily Non-OECD
OECDOECD
Non-OECDNon-OECD
Billion Tonnes CO2
Area
Growth 2000 - 2030
2.7%2.7%
0.5%0.5%
1.7%
Average Growth / Yr. 2000 - 2030

Technology Critical to Efficiency Improvements
CombustionVehicle Advancements
Fuels
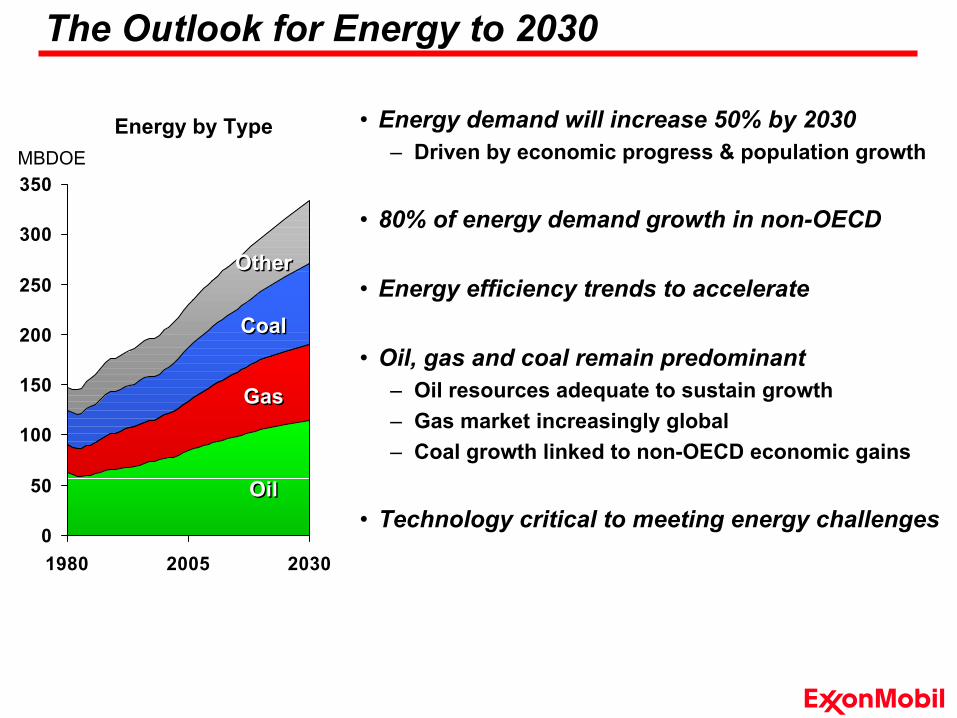
The Outlook for Energy to 2030
0
50
100
150
200
250
300
350
1980 2005 2030
OilOil
GasGas
CoalCoal
OtherOther
Energy by TypeMBDOE
• Energy demand will increase 50% by 2030– Driven by economic progress & population growth
• 80% of energy demand growth in non-OECD
• Energy efficiency trends to accelerate
• Oil, gas and coal remain predominant– Oil resources adequate to sustain growth– Gas market increasingly global– Coal growth linked to non-OECD economic gains
• Technology critical to meeting energy challenges
A View to 2030
Jaime SpellingsGeneral Manager, Corporate PlanningDecember 13, 2005
The Outlook for Energy

The Outlook for Energy
For more information regarding ExxonMobil’s Energy Outlook please visit the link below:
www.exxonmobil.com/energyoutlook


