43
1 Frost Perspective October 2017 VIG’s State of Innovation Survey The Pace of Innovation is Accelerating—Creativity, Passion, and Sacrifice are Needed to Keep Up
| Date post: | 15-Aug-2019 |
| Category: |
Documents |
| Upload: | truongdiep |
| View: | 214 times |
| Download: | 0 times |
1
Frost Perspective
October 2017
VIG’s State of Innovation Survey The Pace of Innovation is Accelerating—Creativity,
Passion, and Sacrifice are Needed to Keep Up
2
Contents
Section Slide Number
Executive Summary 5
Research Scope, Background, and Methodology 7
State of Innovation Survey Results 11
The Last Word 32
Respondent Demographics 35
Contact Information 41
3
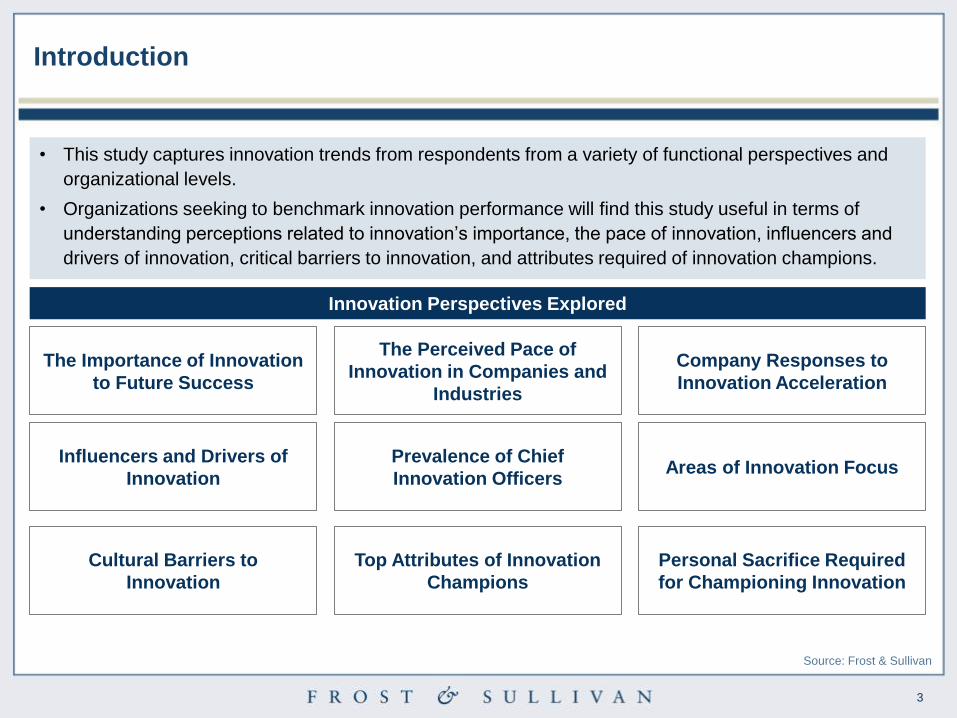
The Importance of Innovation
to Future Success
The Perceived Pace of
Innovation in Companies and
Industries
Company Responses to
Innovation Acceleration
Innovation Perspectives Explored
Influencers and Drivers of
Innovation
Prevalence of Chief
Innovation Officers Areas of Innovation Focus
Source: Frost & Sullivan
Introduction
• This study captures innovation trends from respondents from a variety of functional perspectives and
organizational levels.
• Organizations seeking to benchmark innovation performance will find this study useful in terms of
understanding perceptions related to innovation’s importance, the pace of innovation, influencers and
drivers of innovation, critical barriers to innovation, and attributes required of innovation champions.
Cultural Barriers to
Innovation
Top Attributes of Innovation
Champions
Personal Sacrifice Required
for Championing Innovation
4
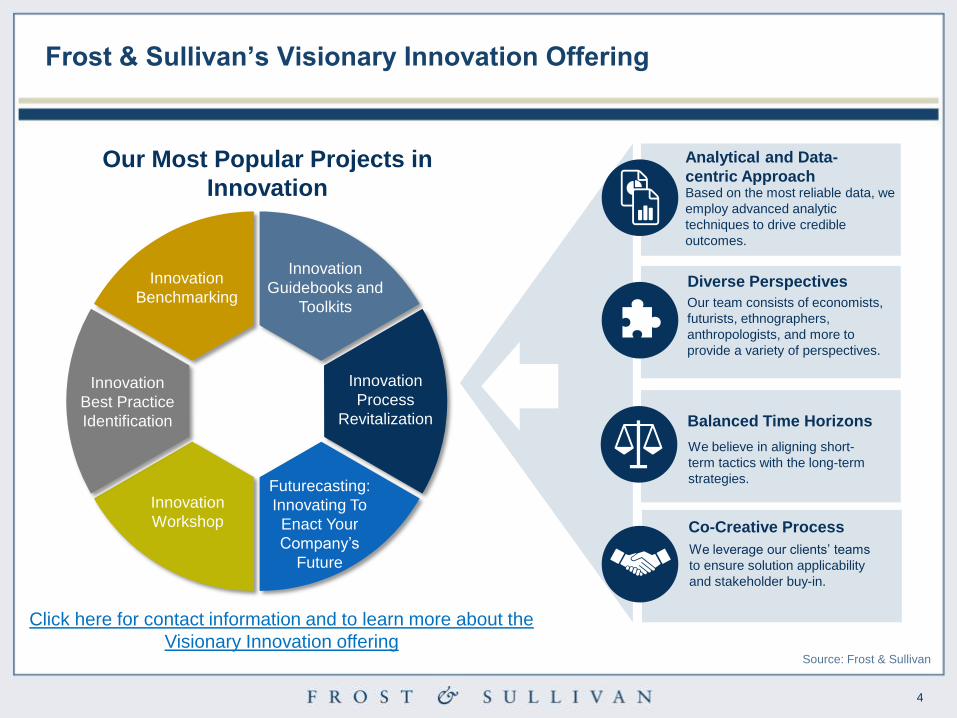
Frost & Sullivan’s Visionary Innovation Offering
Based on the most reliable data, we
employ advanced analytic
techniques to drive credible
outcomes.
Analytical and Data-
centric Approach
Our team consists of economists,
futurists, ethnographers,
anthropologists, and more to
provide a variety of perspectives.
Diverse Perspectives
We believe in aligning short-
term tactics with the long-term
strategies.
Balanced Time Horizons
We leverage our clients’ teams
to ensure solution applicability
and stakeholder buy-in.
Co-Creative Process
Source: Frost & Sullivan
Futurecasting:
Innovating To
Enact Your
Company’s
Future
Innovation
Process
Revitalization
Innovation
Guidebooks and
Toolkits
Innovation
Benchmarking
Innovation
Best Practice
Identification
Innovation
Workshop
Our Most Popular Projects in
Innovation
Click here for contact information and to learn more about the
Visionary Innovation offering
5
Return to contents
5
Executive Summary
6
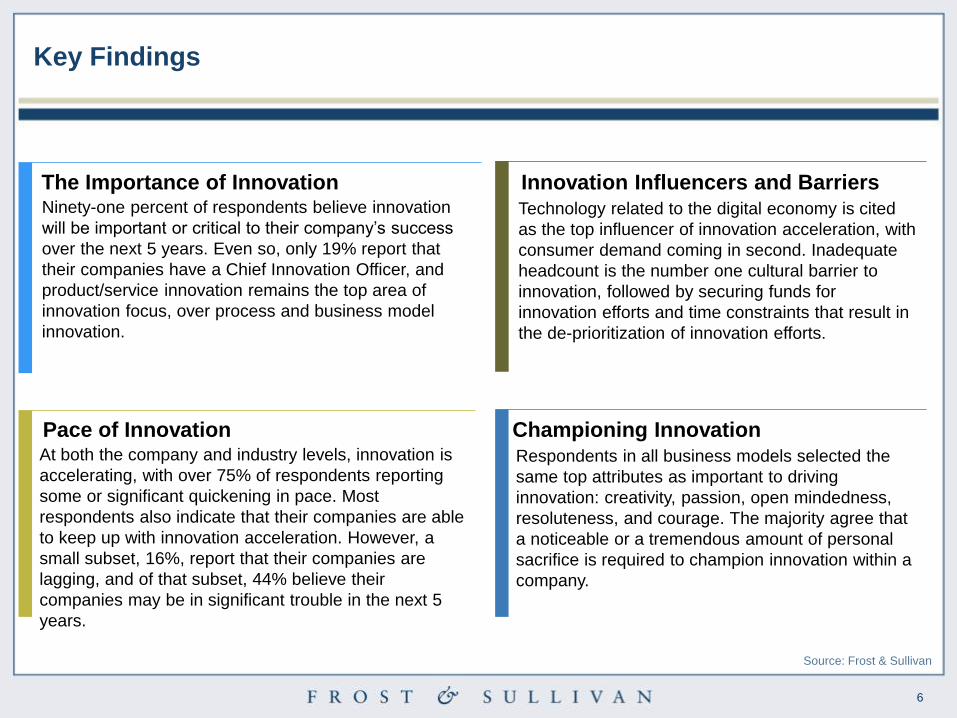
Ninety-one percent of respondents believe innovation
will be important or critical to their company’s success
over the next 5 years. Even so, only 19% report that
their companies have a Chief Innovation Officer, and
product/service innovation remains the top area of
innovation focus, over process and business model
innovation.
The Importance of Innovation Innovation Influencers and Barriers
Pace of Innovation Championing Innovation At both the company and industry levels, innovation is
accelerating, with over 75% of respondents reporting
some or significant quickening in pace. Most
respondents also indicate that their companies are able
to keep up with innovation acceleration. However, a
small subset, 16%, report that their companies are
lagging, and of that subset, 44% believe their
companies may be in significant trouble in the next 5
years.
Technology related to the digital economy is cited
as the top influencer of innovation acceleration, with
consumer demand coming in second. Inadequate
headcount is the number one cultural barrier to
innovation, followed by securing funds for
innovation efforts and time constraints that result in
the de-prioritization of innovation efforts.
Respondents in all business models selected the
same top attributes as important to driving
innovation: creativity, passion, open mindedness,
resoluteness, and courage. The majority agree that
a noticeable or a tremendous amount of personal
sacrifice is required to champion innovation within a
company.
Key Findings
Source: Frost & Sullivan
7
Return to contents
7
Research Scope, Background, and Methodology
8
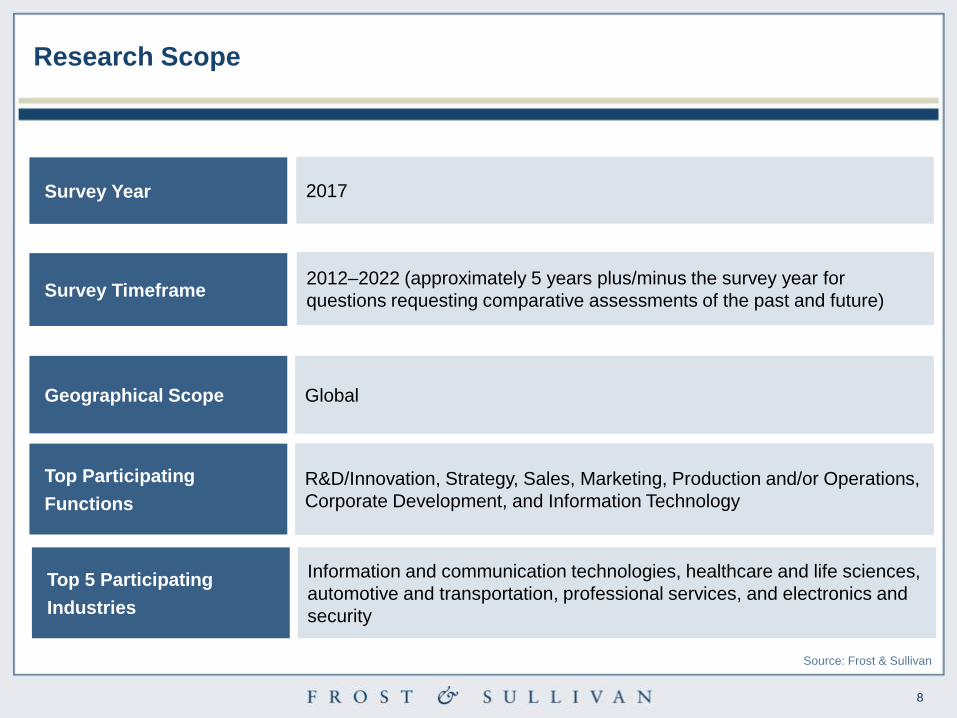
2012–2022 (approximately 5 years plus/minus the survey year for
questions requesting comparative assessments of the past and future) Survey Timeframe
2017 Survey Year
Global Geographical Scope
R&D/Innovation, Strategy, Sales, Marketing, Production and/or Operations,
Corporate Development, and Information Technology
Top Participating
Functions
Research Scope
Source: Frost & Sullivan
Information and communication technologies, healthcare and life sciences,
automotive and transportation, professional services, and electronics and
security
Top 5 Participating
Industries
9
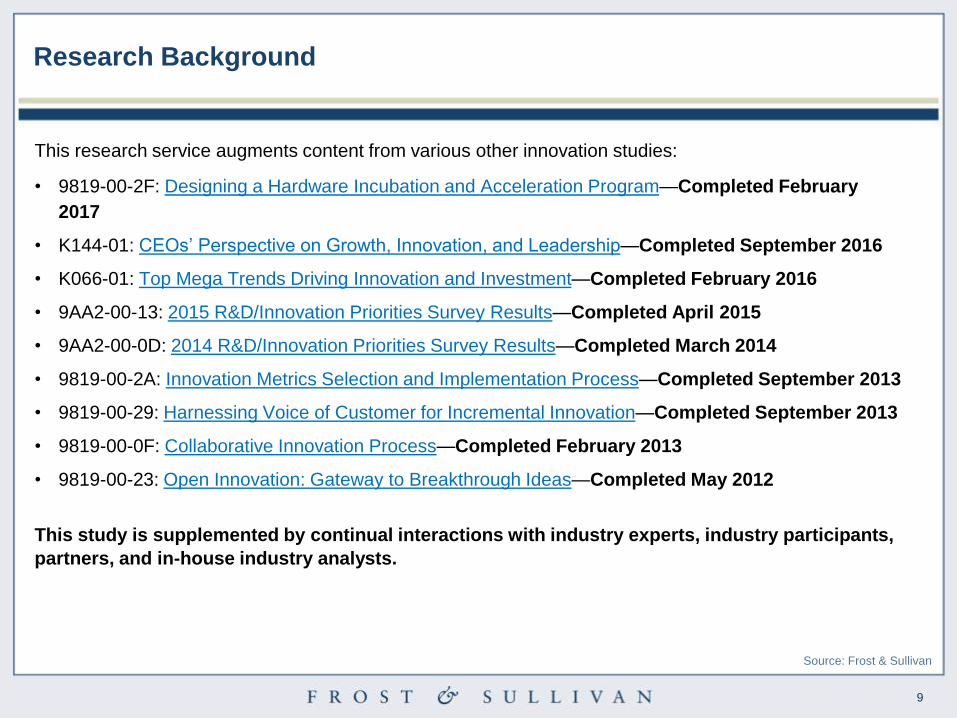
This research service augments content from various other innovation studies:
• 9819-00-2F: Designing a Hardware Incubation and Acceleration Program—Completed February
2017
• K144-01: CEOs’ Perspective on Growth, Innovation, and Leadership—Completed September 2016
• K066-01: Top Mega Trends Driving Innovation and Investment—Completed February 2016
• 9AA2-00-13: 2015 R&D/Innovation Priorities Survey Results—Completed April 2015
• 9AA2-00-0D: 2014 R&D/Innovation Priorities Survey Results—Completed March 2014
• 9819-00-2A: Innovation Metrics Selection and Implementation Process—Completed September 2013
• 9819-00-29: Harnessing Voice of Customer for Incremental Innovation—Completed September 2013
• 9819-00-0F: Collaborative Innovation Process—Completed February 2013
• 9819-00-23: Open Innovation: Gateway to Breakthrough Ideas—Completed May 2012
This study is supplemented by continual interactions with industry experts, industry participants,
partners, and in-house industry analysts.
Research Background
Source: Frost & Sullivan
10
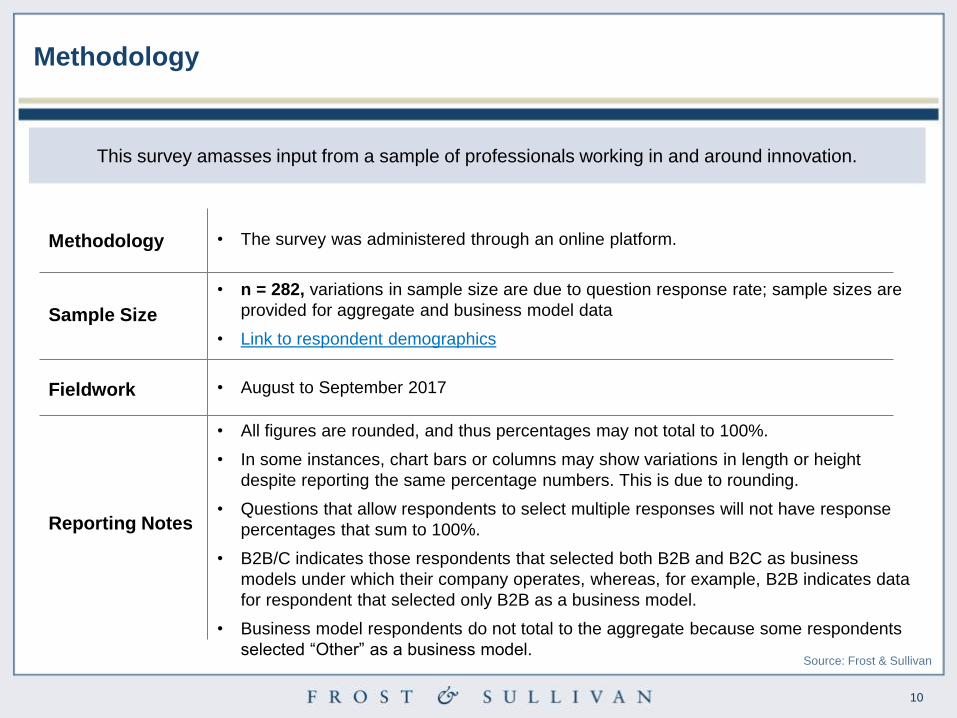
This survey amasses input from a sample of professionals working in and around innovation.
Methodology • The survey was administered through an online platform.
Sample Size
• n = 282, variations in sample size are due to question response rate; sample sizes are
provided for aggregate and business model data
• Link to respondent demographics
• August to September 2017 Fieldwork
Reporting Notes
• All figures are rounded, and thus percentages may not total to 100%.
• In some instances, chart bars or columns may show variations in length or height
despite reporting the same percentage numbers. This is due to rounding.
• Questions that allow respondents to select multiple responses will not have response
percentages that sum to 100%.
• B2B/C indicates those respondents that selected both B2B and B2C as business
models under which their company operates, whereas, for example, B2B indicates data
for respondent that selected only B2B as a business model.
• Business model respondents do not total to the aggregate because some respondents
selected ―Other‖ as a business model.
Methodology
Source: Frost & Sullivan
Return to contents
11
State of Innovation Survey Results
12
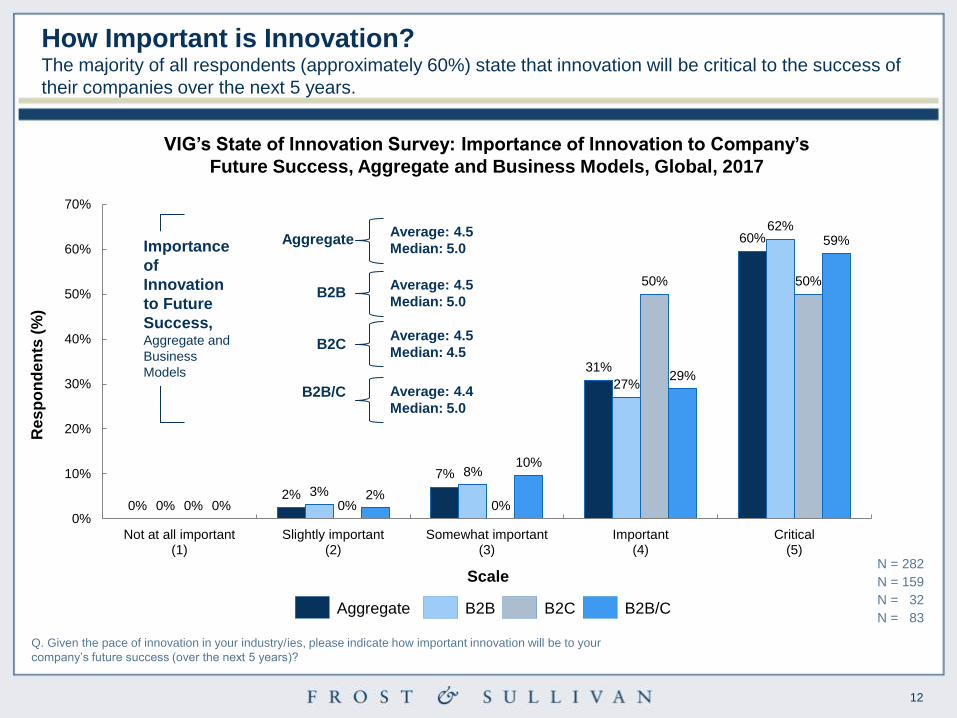
VIG’s State of Innovation Survey: Importance of Innovation to Company’s
Future Success, Aggregate and Business Models, Global, 2017
Q. Given the pace of innovation in your industry/ies, please indicate how important innovation will be to your
company’s future success (over the next 5 years)?
N = 282
0% 2%
7%
31%
60%
0% 3%
8%
27%
62%
0% 0% 0%
50% 50%
0% 2%
10%
29%
59%
0%
10%
20%
30%
40%
50%
60%
70%
Not at all important(1)
Slightly important(2)
Somewhat important(3)
Important(4)
Critical(5)
Res
po
nd
en
ts (
%)
Scale
Average: 4.5
Median: 5.0
Aggregate
Aggregate
B2B B2C B2B/C
Average: 4.5
Median: 4.5
Average: 4.5
Median: 5.0 B2B
B2C
Average: 4.4
Median: 5.0 B2B/C
N = 159
N = 32
N = 83
Importance
of
Innovation
to Future
Success, Aggregate and
Business
Models
How Important is Innovation? The majority of all respondents (approximately 60%) state that innovation will be critical to the success of
their companies over the next 5 years.
13
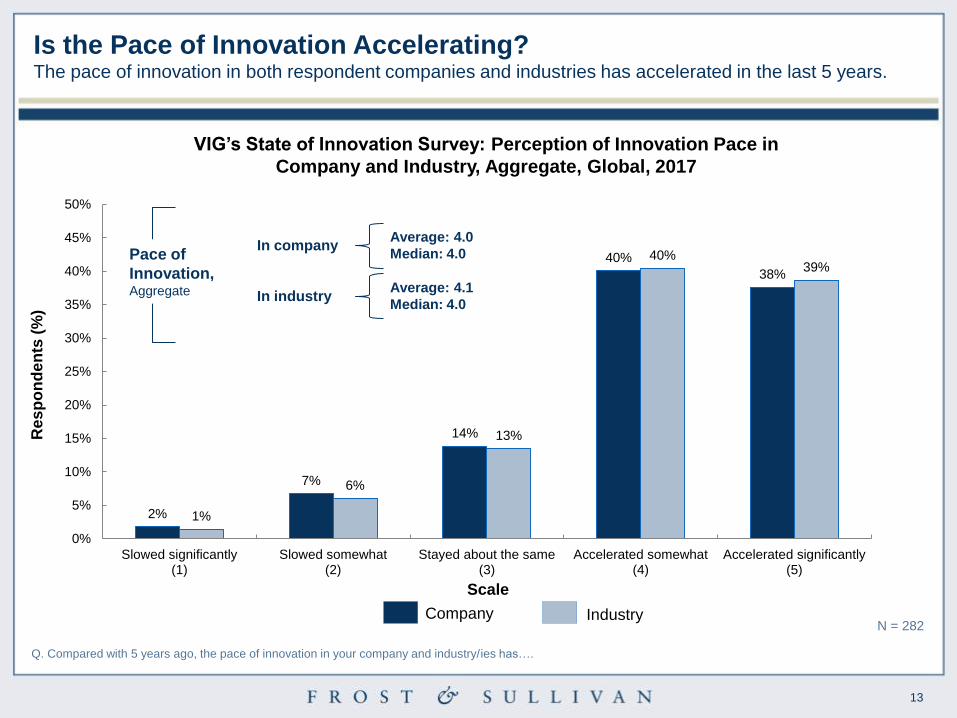
VIG’s State of Innovation Survey: Perception of Innovation Pace in
Company and Industry, Aggregate, Global, 2017
Q. Compared with 5 years ago, the pace of innovation in your company and industry/ies has….
N = 282
2%
7%
14%
40%
38%
1%
6%
13%
40% 39%
0%
5%
10%
15%
20%
25%
30%
35%
40%
45%
50%
Slowed significantly(1)
Slowed somewhat(2)
Stayed about the same(3)
Accelerated somewhat(4)
Accelerated significantly(5)
Res
po
nd
en
ts (
%)
Scale
Average: 4.1
Median: 4.0
Average: 4.0
Median: 4.0
Company Industry
In company
In industry
Pace of
Innovation, Aggregate
Is the Pace of Innovation Accelerating? The pace of innovation in both respondent companies and industries has accelerated in the last 5 years.
14
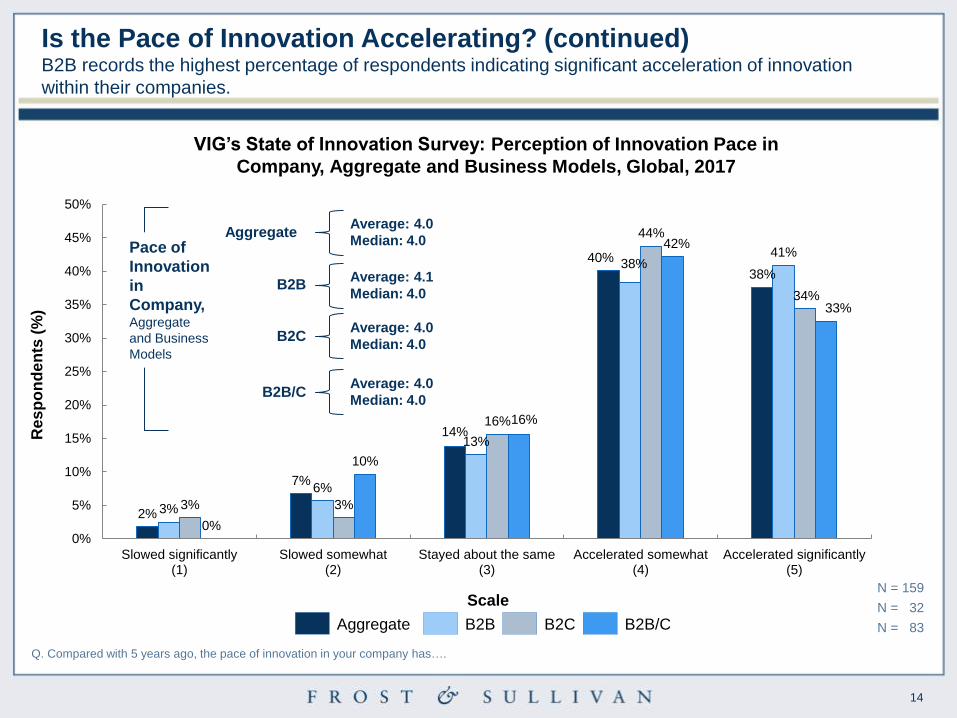
VIG’s State of Innovation Survey: Perception of Innovation Pace in
Company, Aggregate and Business Models, Global, 2017
Q. Compared with 5 years ago, the pace of innovation in your company has….
N = 159
2%
7%
14%
40%
38%
3%
6%
13%
38% 41%
3% 3%
16%
44%
34%
0%
10%
16%
42%
33%
0%
5%
10%
15%
20%
25%
30%
35%
40%
45%
50%
Slowed significantly(1)
Slowed somewhat(2)
Stayed about the same(3)
Accelerated somewhat(4)
Accelerated significantly(5)
Res
po
nd
en
ts (
%)
Scale
Average: 4.0
Median: 4.0
Average: 4.1
Median: 4.0 B2B
B2C
Average: 4.0
Median: 4.0 B2B/C
N = 32
N = 83
Pace of
Innovation
in
Company, Aggregate
and Business
Models
Is the Pace of Innovation Accelerating? (continued) B2B records the highest percentage of respondents indicating significant acceleration of innovation
within their companies.
Aggregate B2B B2C B2B/C
Average: 4.0
Median: 4.0 Aggregate
15
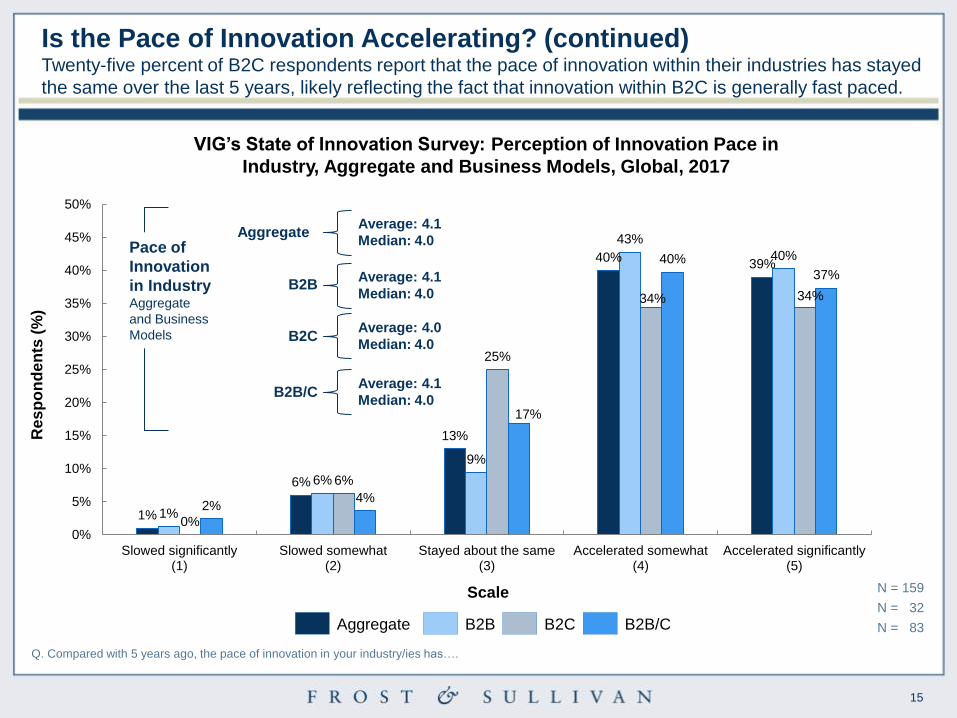
VIG’s State of Innovation Survey: Perception of Innovation Pace in
Industry, Aggregate and Business Models, Global, 2017
Q. Compared with 5 years ago, the pace of innovation in your industry/ies has….
1%
6%
13%
40% 39%
1%
6%
9%
43%
40%
0%
6%
25%
34% 34%
2% 4%
17%
40%
37%
0%
5%
10%
15%
20%
25%
30%
35%
40%
45%
50%
Slowed significantly(1)
Slowed somewhat(2)
Stayed about the same(3)
Accelerated somewhat(4)
Accelerated significantly(5)
Res
po
nd
en
ts (
%)
Scale
Average: 4.0
Median: 4.0
Average: 4.1
Median: 4.0 B2B
B2C
Average: 4.1
Median: 4.0 B2B/C
N = 159
N = 32
N = 83
Pace of
Innovation
in Industry Aggregate
and Business
Models
Aggregate Average: 4.1
Median: 4.0
Is the Pace of Innovation Accelerating? (continued) Twenty-five percent of B2C respondents report that the pace of innovation within their industries has stayed
the same over the last 5 years, likely reflecting the fact that innovation within B2C is generally fast paced.
Aggregate B2B B2C B2B/C
16
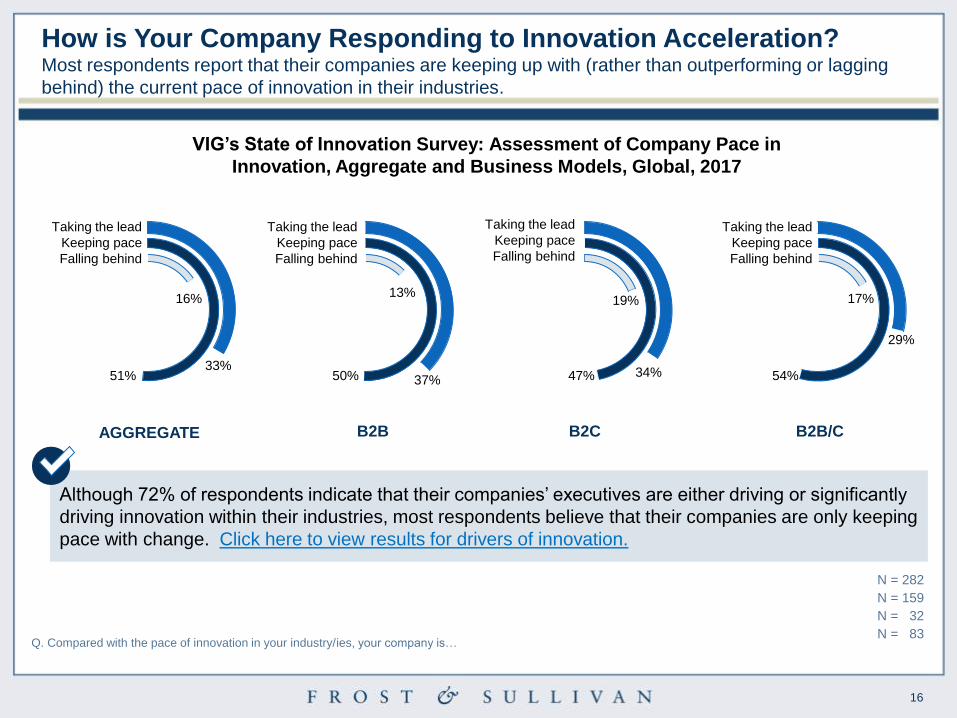
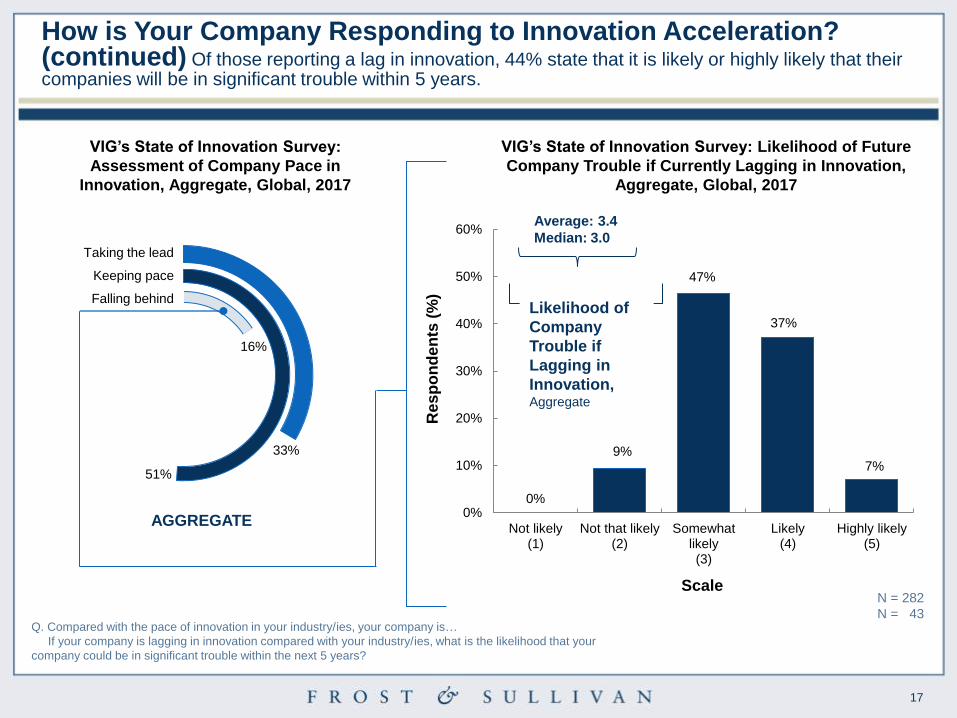
Q. Compared with the pace of innovation in your industry/ies, your company is…
N = 159
N = 32
N = 83
N = 282
B2B B2C B2B/C AGGREGATE
VIG’s State of Innovation Survey: Assessment of Company Pace in
Innovation, Aggregate and Business Models, Global, 2017
51%
16%
37% 50%
13%
Taking the lead
Keeping pace
Falling behind
Taking the lead
Keeping pace
Falling behind
Taking the lead
Keeping pace
Falling behind
33% 47%
19%
34%
Taking the lead
Keeping pace
Falling behind
17%
54%
29%
How is Your Company Responding to Innovation Acceleration? Most respondents report that their companies are keeping up with (rather than outperforming or lagging
behind) the current pace of innovation in their industries.
Although 72% of respondents indicate that their companies’ executives are either driving or significantly
driving innovation within their industries, most respondents believe that their companies are only keeping
pace with change. Click here to view results for drivers of innovation.
17
AGGREGATE
0%
9%
47%
37%
7%
0%
10%
20%
30%
40%
50%
60%
Not likely(1)
Not that likely(2)
Somewhatlikely(3)
Likely(4)
Highly likely(5)
Taking the lead
Keeping pace
Falling behind
N = 282
N = 43 Q. Compared with the pace of innovation in your industry/ies, your company is…
If your company is lagging in innovation compared with your industry/ies, what is the likelihood that your
company could be in significant trouble within the next 5 years?
51%
16%
33%
Average: 3.4
Median: 3.0
Likelihood of
Company
Trouble if
Lagging in
Innovation, Aggregate
VIG’s State of Innovation Survey:
Assessment of Company Pace in
Innovation, Aggregate, Global, 2017
VIG’s State of Innovation Survey: Likelihood of Future
Company Trouble if Currently Lagging in Innovation,
Aggregate, Global, 2017
Res
po
nd
en
ts (
%)
Scale
How is Your Company Responding to Innovation Acceleration? (continued) Of those reporting a lag in innovation, 44% state that it is likely or highly likely that their companies will be in significant trouble within 5 years.
18
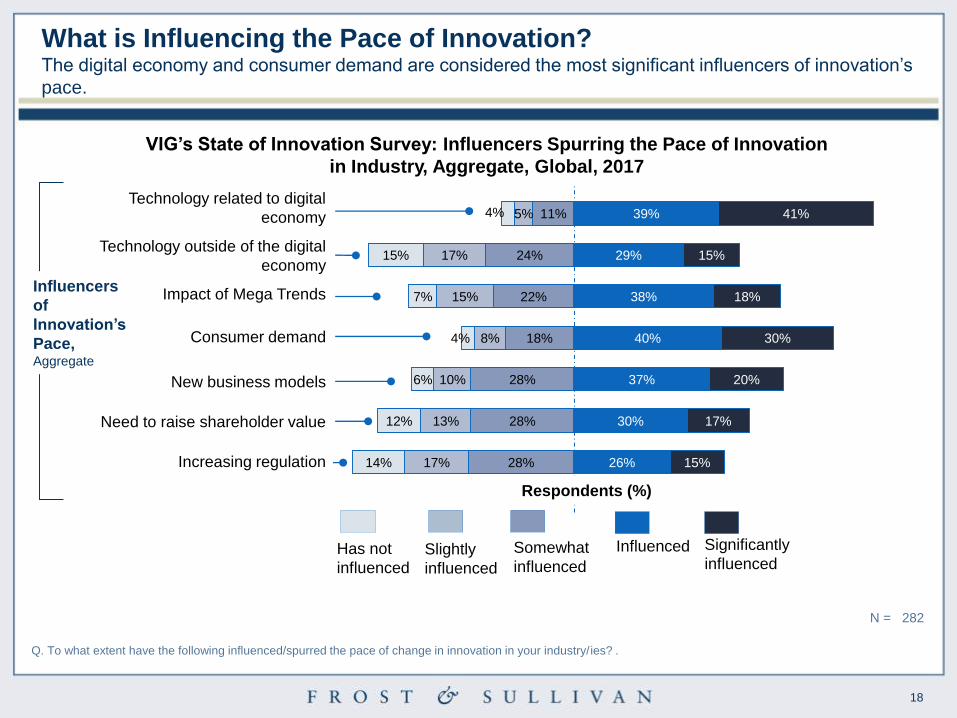
VIG’s State of Innovation Survey: Influencers Spurring the Pace of Innovation
in Industry, Aggregate, Global, 2017
Q. To what extent have the following influenced/spurred the pace of change in innovation in your industry/ies? .
N = 282
28%
28%
28%
18%
22%
24%
11%
17%
13%
10%
8%
15%
17%
5%
14%
12%
6%
4%
7%
15%
4%
26%
30%
37%
40%
38%
29%
39%
15%
17%
20%
30%
18%
15%
41%
Influencers
of
Innovation’s
Pace, Aggregate
Respondents (%)
Technology related to digital
economy
Technology outside of the digital
economy
Impact of Mega Trends
Consumer demand
New business models
Need to raise shareholder value
Increasing regulation
What is Influencing the Pace of Innovation? The digital economy and consumer demand are considered the most significant influencers of innovation’s
pace.
Has not
influenced
Slightly
influenced
Somewhat
influenced
Influenced Significantly
influenced
19
5%
16%
13%
5%
9%
3%
2%
5%
37%
53%
37%
51%
22%
42%
23%
34%
23%
16%
9%
19%
18%
6%
16%
28%
34%
29%
16%
16%
14%
13%
19%
27%
11%
13%
18%
6%
3%
9%
48%
34%
32%
22%
31%
13%
Respondents (%)
Technology
related to the
digital economy
N = 159
N = 32
N = 83
Slightly
influenced
Somewhat
influenced
Influenced Significantly
influenced
B2B
B2C
B2B/C
Has not
influenced
B2B
B2C
B2B/C
Technology
outside of the
digital economy
B2B
B2C
B2B/C
Impact of
socioeconomic
and demographic
Mega Trends
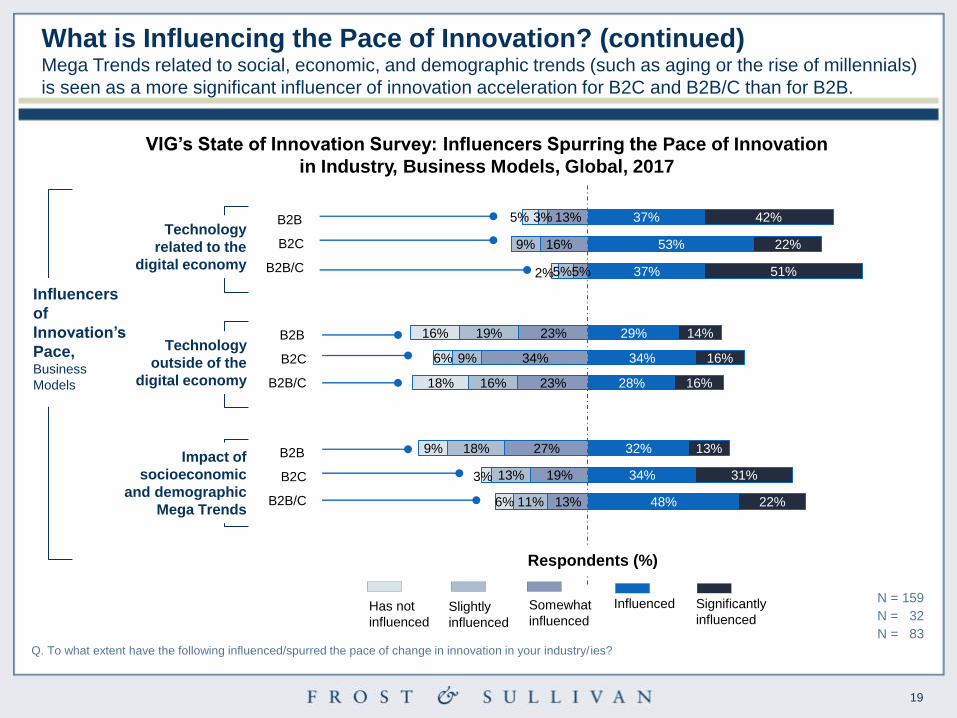
Q. To what extent have the following influenced/spurred the pace of change in innovation in your industry/ies?
VIG’s State of Innovation Survey: Influencers Spurring the Pace of Innovation
in Industry, Business Models, Global, 2017
What is Influencing the Pace of Innovation? (continued) Mega Trends related to social, economic, and demographic trends (such as aging or the rise of millennials)
is seen as a more significant influencer of innovation acceleration for B2C and B2B/C than for B2B.
Influencers
of
Innovation’s
Pace, Business
Models
20
17%
22%
18%
5%
9%
10%
4%
4%
37%
38%
42%
37%
31%
26%
29%
31%
26%
13%
13%
14%
12%
9%
11%
28%
31%
32%
18%
16%
16%
22%
41%
28%
8%
13%
10%
4%
6%
7%
43%
22%
36%
23%
19%
19%
27%
41%
28%
18%
3%
19%
11%
13%
16%
33%
22%
22%
12%
22%
14%
Respondents (%)
Consumer
demand
N = 159
N = 32
N = 83
B2B
B2C
B2B/C
B2B
B2C
B2B/C
New business
models
B2B
B2C
B2B/C
Need to raise
shareholder
value
B2B
B2C
B2B/C
Increasing
regulation
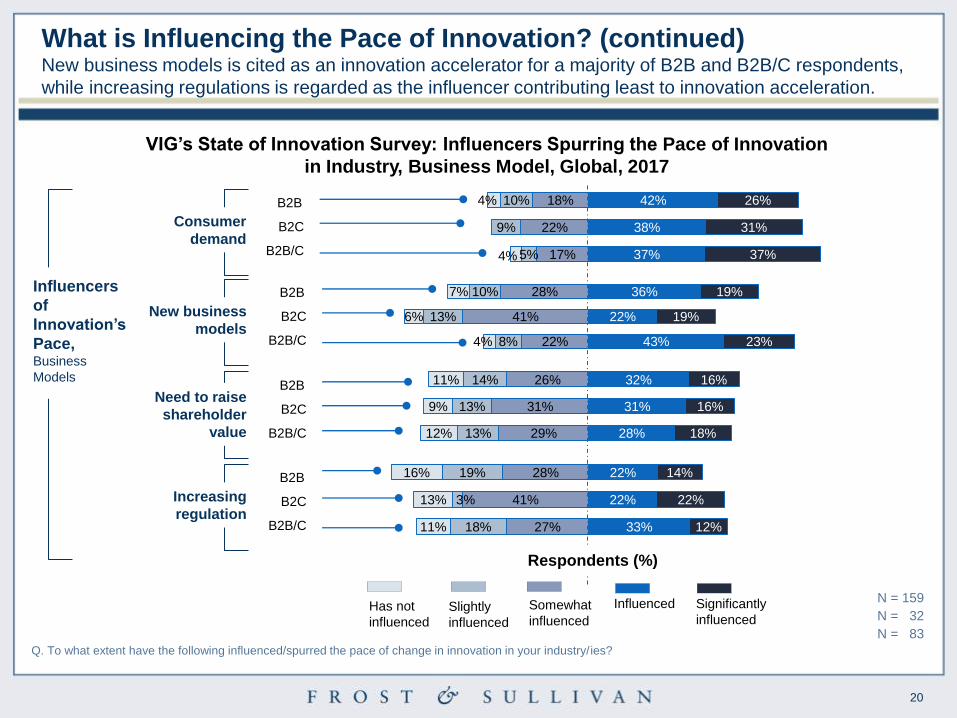
VIG’s State of Innovation Survey: Influencers Spurring the Pace of Innovation
in Industry, Business Model, Global, 2017
Q. To what extent have the following influenced/spurred the pace of change in innovation in your industry/ies?
Slightly
influenced
Somewhat
influenced
Influenced Significantly
influenced Has not
influenced
Influencers
of
Innovation’s
Pace, Business
Models
What is Influencing the Pace of Innovation? (continued) New business models is cited as an innovation accelerator for a majority of B2B and B2B/C respondents,
while increasing regulations is regarded as the influencer contributing least to innovation acceleration.
21
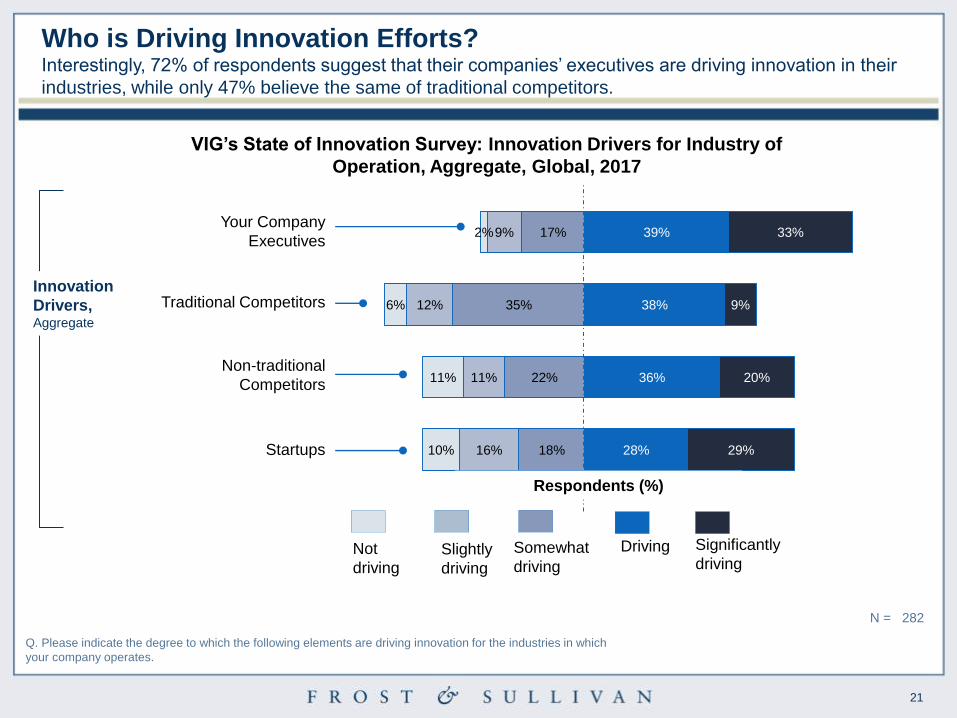
VIG’s State of Innovation Survey: Innovation Drivers for Industry of
Operation, Aggregate, Global, 2017
Q. Please indicate the degree to which the following elements are driving innovation for the industries in which
your company operates.
N = 282
18%
22%
35%
17%
16%
11%
12%
9%
10%
11%
6%
2%
28%
36%
38%
39%
29%
20%
9%
33%
Not
driving
Slightly
driving
Somewhat
driving
Driving Significantly
driving
Your Company
Executives
Traditional Competitors
Non-traditional
Competitors
Startups
Innovation
Drivers, Aggregate
Respondents (%)
Who is Driving Innovation Efforts? Interestingly, 72% of respondents suggest that their companies’ executives are driving innovation in their
industries, while only 47% believe the same of traditional competitors.
22
19%
13%
25%
12%
9%
11%
10%
19%
11%
36%
34%
37%
23%
25%
16%
37%
41%
35%
10%
9%
14%
8%
6%
5%
37%
38%
37%
7%
6%
9%
12%
16%
19%
13%
13%
7%
4%
3%
45%
44%
35%
27%
25%
38%
23%
13%
17%
13%
16%
18%
11%
9%
9%
27%
38%
26%
27%
25%
29%
Respondents (%)
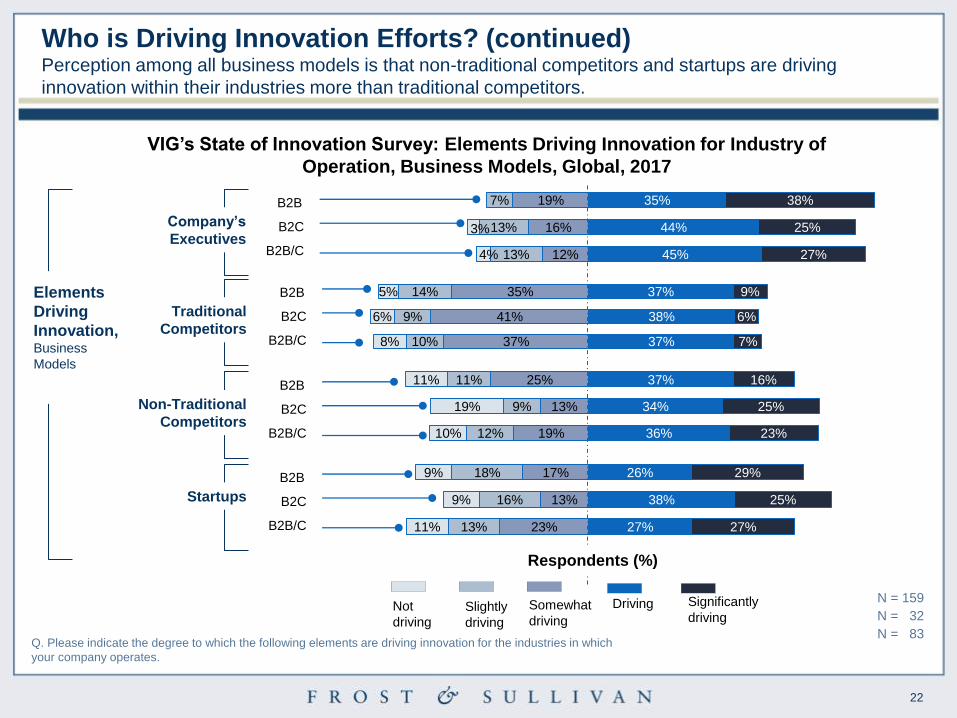
VIG’s State of Innovation Survey: Elements Driving Innovation for Industry of
Operation, Business Models, Global, 2017
Q. Please indicate the degree to which the following elements are driving innovation for the industries in which
your company operates.
Company’s
Executives
N = 159
N = 32
N = 83
Slightly
driving
Somewhat
driving
Driving Significantly
driving
B2B
B2C
B2B/C
Not
driving
B2B
B2C
B2B/C
Traditional
Competitors
B2B
B2C
B2B/C
Non-Traditional
Competitors
B2B
B2C
B2B/C
Startups
Elements
Driving
Innovation, Business
Models
Who is Driving Innovation Efforts? (continued) Perception among all business models is that non-traditional competitors and startups are driving
innovation within their industries more than traditional competitors.
23
Q. Does your company have a Chief Innovation Officer?
N = 151
N = 29
N = 79
N = 267
B2B B2C B2B/C AGGREGATE
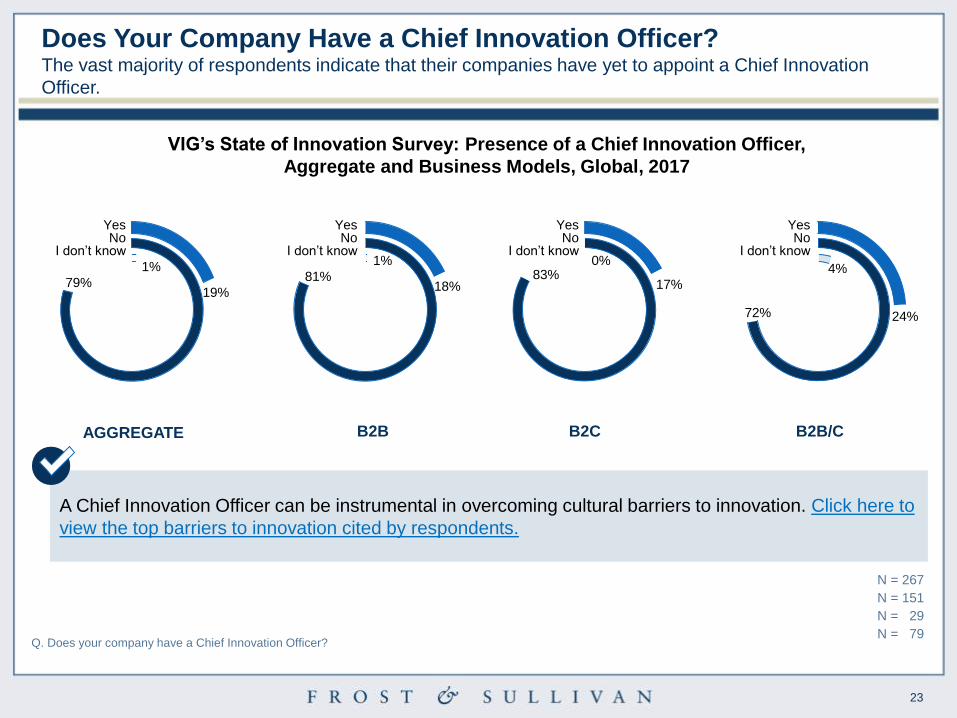
VIG’s State of Innovation Survey: Presence of a Chief Innovation Officer,
Aggregate and Business Models, Global, 2017
Yes No
I don’t know
Yes No
I don’t know
Yes No
I don’t know
Yes No
I don’t know
19% 79%
1%
18% 81%
1%
17% 83%
0%
24% 72%
4%
Does Your Company Have a Chief Innovation Officer? The vast majority of respondents indicate that their companies have yet to appoint a Chief Innovation
Officer.
A Chief Innovation Officer can be instrumental in overcoming cultural barriers to innovation. Click here to
view the top barriers to innovation cited by respondents.
24
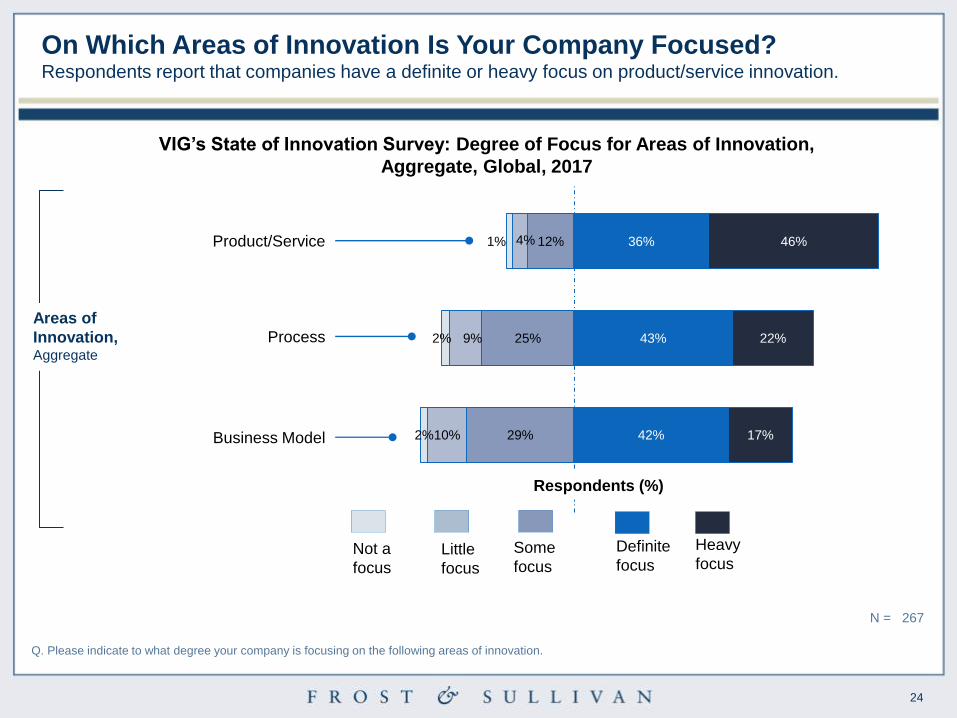
VIG’s State of Innovation Survey: Degree of Focus for Areas of Innovation,
Aggregate, Global, 2017
Q. Please indicate to what degree your company is focusing on the following areas of innovation.
N = 267
29%
25%
12%
10%
9%
4%
2%
2%
1%
42%
43%
36%
17%
22%
46%
Not a
focus
Little
focus
Some
focus
Definite
focus
Heavy
focus
Product/Service
Process
Business Model
Areas of
Innovation, Aggregate
Respondents (%)
On Which Areas of Innovation Is Your Company Focused? Respondents report that companies have a definite or heavy focus on product/service innovation.
25
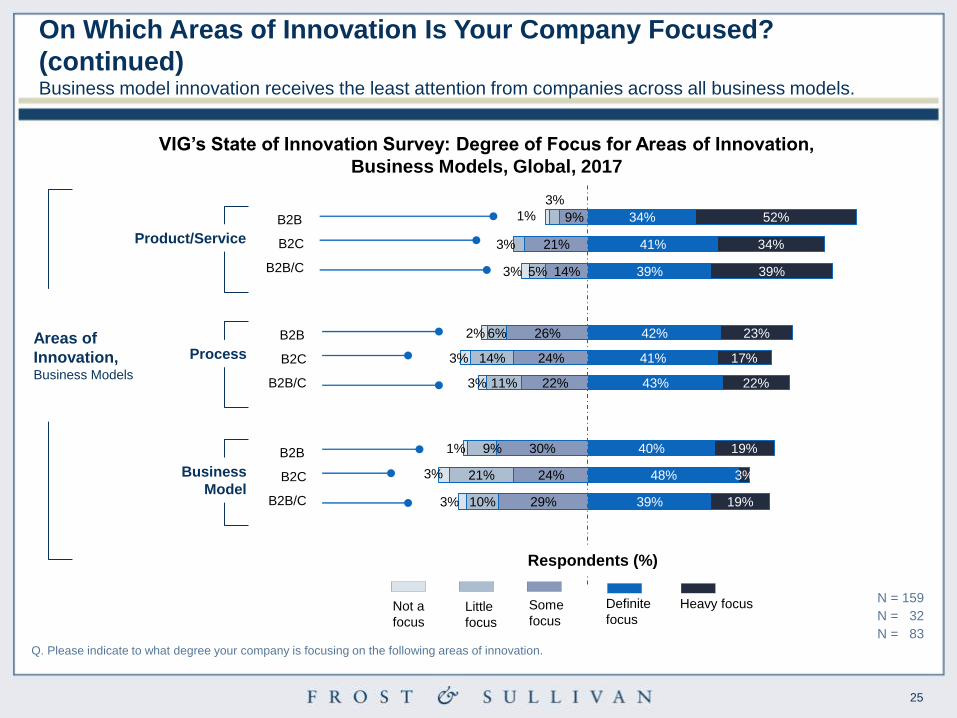
22%
24%
26%
11%
14%
6%
3%
3%
2%
43%
41%
42%
22%
17%
23%
14%
21%
9%
5%
3%
3%
3%
1%
39%
41%
34%
39%
34%
52%
29%
24%
30%
10%
21%
9%
3%
3%
1%
39%
48%
40%
19%
3%
19%
Respondents (%)
VIG’s State of Innovation Survey: Degree of Focus for Areas of Innovation,
Business Models, Global, 2017
Product/Service
N = 159
N = 32
N = 83
Little
focus
Some
focus
Definite
focus
Heavy focus
B2B
B2C
B2B/C
Not a
focus
B2B
B2C
B2B/C
Process
B2B
B2C
B2B/C
Business
Model
Areas of
Innovation, Business Models
Q. Please indicate to what degree your company is focusing on the following areas of innovation.
On Which Areas of Innovation Is Your Company Focused?
(continued) Business model innovation receives the least attention from companies across all business models.
26
Q. Please select the key cultural barriers to innovation within your company (check all that apply).
N = 150
N = 29
N = 79
N = 266
51%
46%
44%
42%
42%
28%
34%
34%
38%
52%
29%
31%
37%
47%
49%
35%
36%
39%
46%
48%
0% 10% 20% 30% 40% 50% 60%
Aggregate B2B B2C B2B/C
Respondents (%)
Headcount to support innovation efforts is
inadequate
Securing funds for innovation efforts is
difficult
Time constraints result in a de-prioritization
of innovation
Most functions remain siloed, undermining
cross-organizational collaboration and
knowledge sharing
Culture is built around consensus building,
which slows or stops innovation
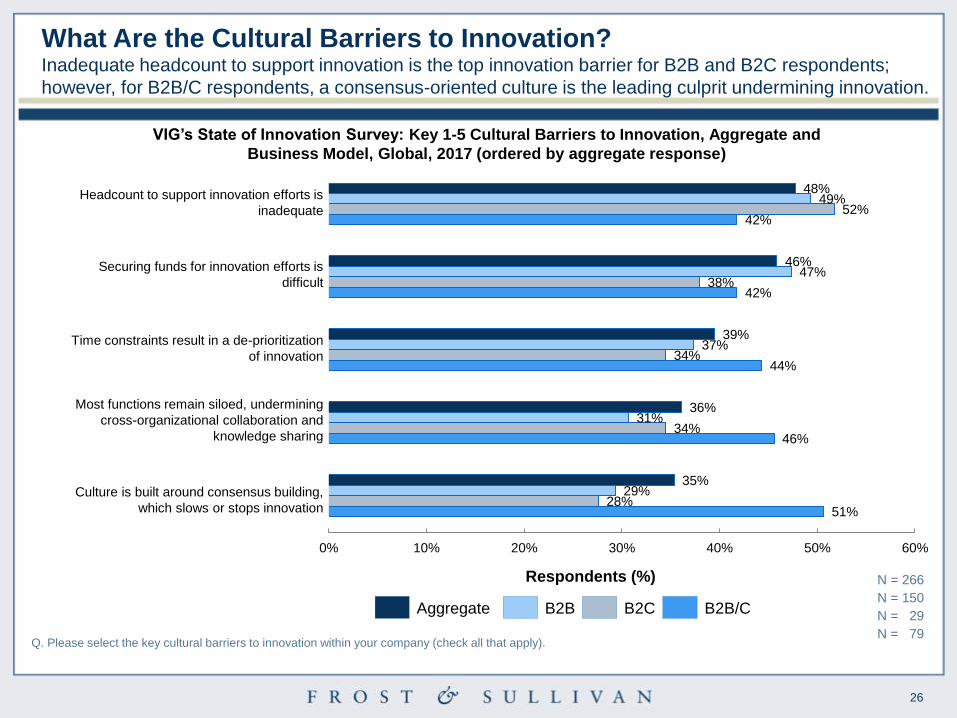
VIG’s State of Innovation Survey: Key 1-5 Cultural Barriers to Innovation, Aggregate and
Business Model, Global, 2017 (ordered by aggregate response)
What Are the Cultural Barriers to Innovation? Inadequate headcount to support innovation is the top innovation barrier for B2B and B2C respondents;
however, for B2B/C respondents, a consensus-oriented culture is the leading culprit undermining innovation.
27
Q. Please select the key cultural barriers to innovation within your company (check all that apply).
N = 150
N = 29
N = 79
N = 266
20%
15%
28%
32%
30%
17%
21%
24%
38%
41%
12%
15%
25%
22%
27%
15%
16%
26%
27%
30%
0% 10% 20% 30% 40% 50% 60%
Aggregate B2B B2C B2B/C
Respondents (%)
Culture is risk averse (afraid to try new
things)
Many functions/employees are resistant to
change
Communicating the strategic value of
innovation to the organization as a whole is
lacking
Senior management lacks commitment in
supporting innovation efforts
Organizational structure is too rigid
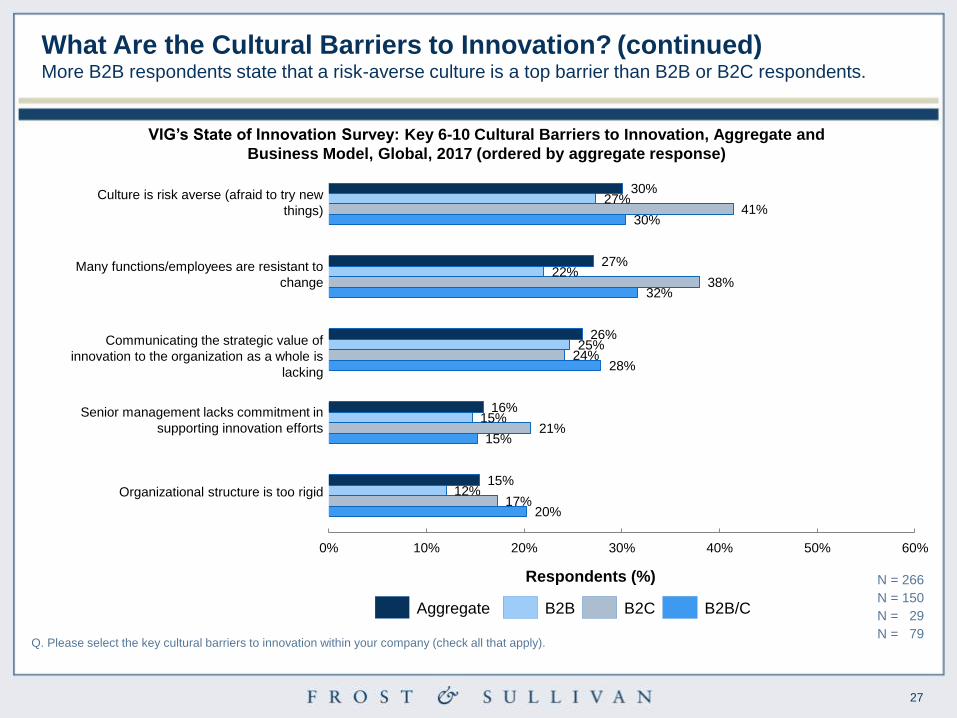
VIG’s State of Innovation Survey: Key 6-10 Cultural Barriers to Innovation, Aggregate and
Business Model, Global, 2017 (ordered by aggregate response)
What Are the Cultural Barriers to Innovation? (continued) More B2B respondents state that a risk-averse culture is a top barrier than B2B or B2C respondents.
28
1
2
3
4
5
3%
5%
23%
44%
25%
0%
5%
10%
15%
20%
25%
30%
35%
40%
45%
50%
No sacrifice(1)
Very littlesacrifice
(2)
Somesacrifice
(3)
Noticeablesacrifice
(4)
A tremendousamount ofsacrifice
(5)
Q. Please rank the top 3 attributes (with 1 representing the most important attribute) that describe
the type of personal leadership that is/would be required to drive innovation within your company.
Please indicate the amount of personal sacrifice (e.g., time, energy, stress) that is/would be
required of you to champion innovation within your company.
N = 267
Creativity or
divergent thinking
Passion or
enthusiasm
Open mindedness
Resoluteness or
determination
Courage
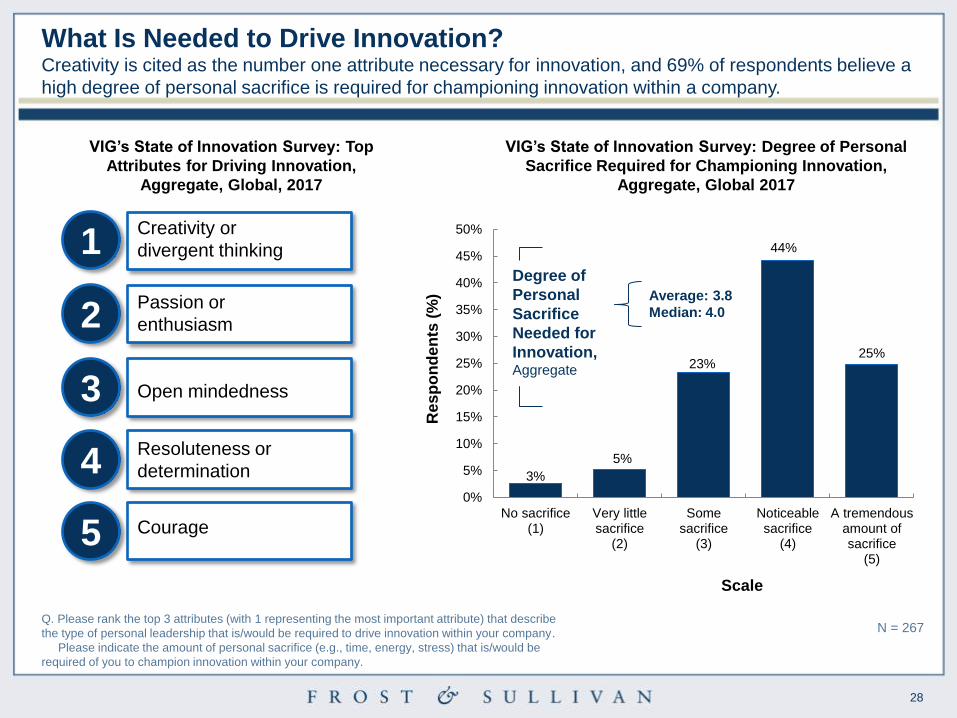
VIG’s State of Innovation Survey: Top
Attributes for Driving Innovation,
Aggregate, Global, 2017
VIG’s State of Innovation Survey: Degree of Personal
Sacrifice Required for Championing Innovation,
Aggregate, Global 2017
Res
po
nd
en
ts (
%)
Scale
Average: 3.8
Median: 4.0
Degree of
Personal
Sacrifice
Needed for
Innovation, Aggregate
What Is Needed to Drive Innovation? Creativity is cited as the number one attribute necessary for innovation, and 69% of respondents believe a
high degree of personal sacrifice is required for championing innovation within a company.
29
1
2
3
4
5
3%
6%
21%
46%
23%
0%
5%
10%
15%
20%
25%
30%
35%
40%
45%
50%
No sacrifice(1)
Very littlesacrifice
(2)
Somesacrifice
(3)
Noticeablesacrifice
(4)
A tremendousamount ofsacrifice
(5)
Q. Please rank the top 3 attributes (with 1 representing the most important attribute) that describe
the type of personal leadership that is/would be required to drive innovation within your company.
Please indicate the amount of personal sacrifice (e.g., time, energy, stress) that is/would be
required of you to champion innovation within your company.
N = 151
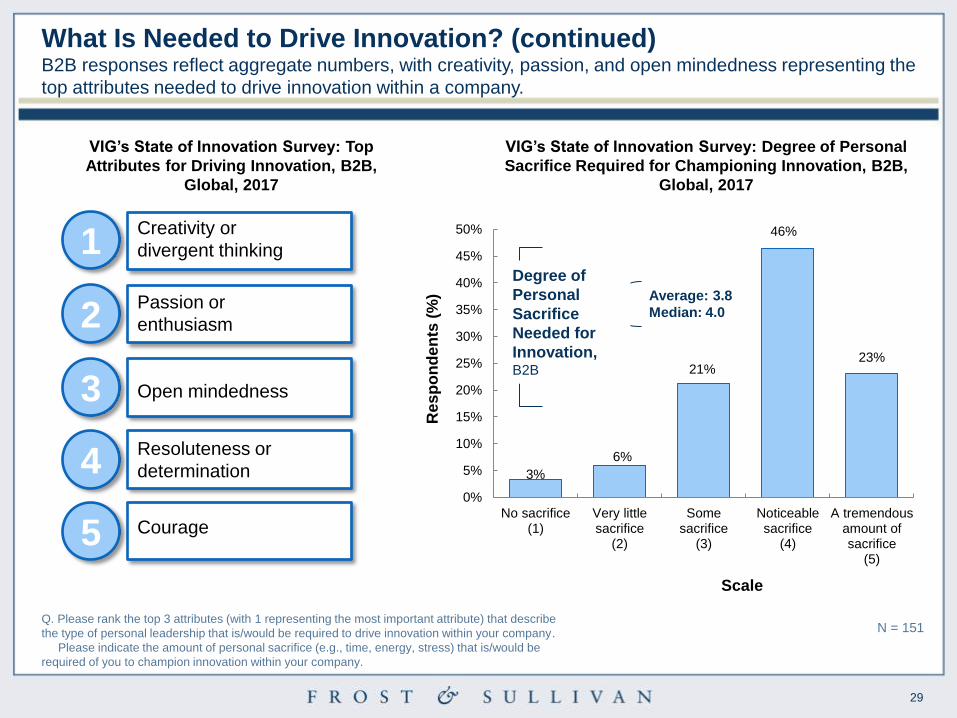
Creativity or
divergent thinking
Passion or
enthusiasm
Open mindedness
Resoluteness or
determination
Courage
VIG’s State of Innovation Survey: Top
Attributes for Driving Innovation, B2B,
Global, 2017
VIG’s State of Innovation Survey: Degree of Personal
Sacrifice Required for Championing Innovation, B2B,
Global, 2017
Res
po
nd
en
ts (
%)
Scale
Average: 3.8
Median: 4.0
Degree of
Personal
Sacrifice
Needed for
Innovation, B2B
What Is Needed to Drive Innovation? (continued) B2B responses reflect aggregate numbers, with creativity, passion, and open mindedness representing the
top attributes needed to drive innovation within a company.
30
1
2
3
4
5
0% 0%
17%
45%
38%
0%
5%
10%
15%
20%
25%
30%
35%
40%
45%
50%
No sacrifice(1)
Very littlesacrifice
(2)
Somesacrifice
(3)
Noticeablesacrifice
(4)
A tremendousamount ofsacrifice
(5)
Q. Please rank the top 3 attributes (with 1 representing the most important attribute) that describe
the type of personal leadership that is/would be required to drive innovation within your company.
Please indicate the amount of personal sacrifice (e.g., time, energy, stress) that is/would be
required of you to champion innovation within your company.
N = 29
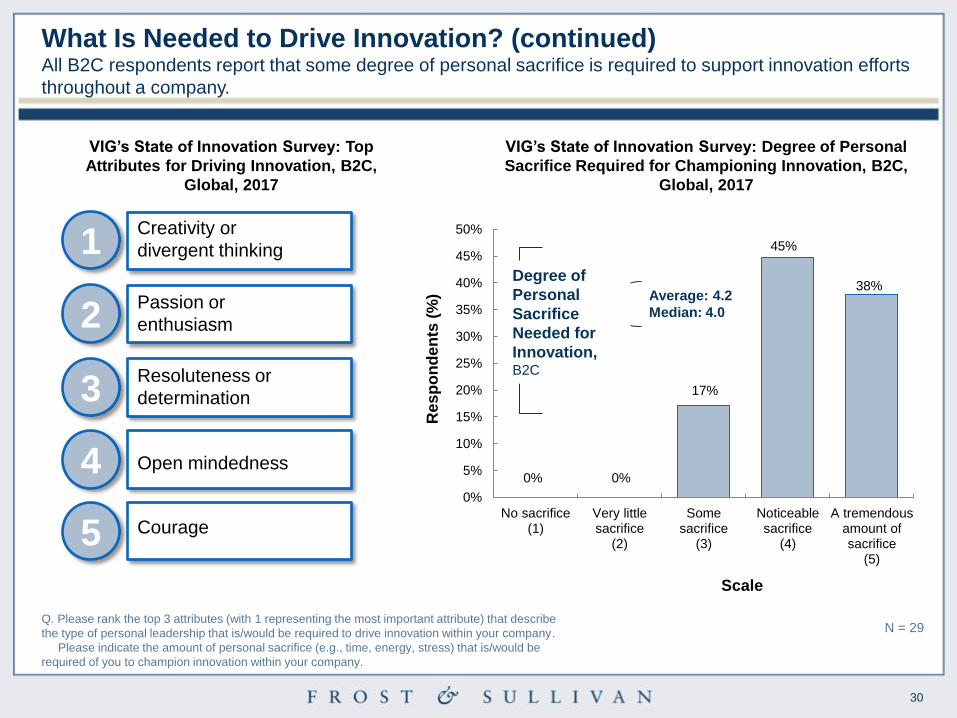
Creativity or
divergent thinking
Passion or
enthusiasm
Resoluteness or
determination
Courage
VIG’s State of Innovation Survey: Top
Attributes for Driving Innovation, B2C,
Global, 2017
VIG’s State of Innovation Survey: Degree of Personal
Sacrifice Required for Championing Innovation, B2C,
Global, 2017
Res
po
nd
en
ts (
%)
Scale
Average: 4.2
Median: 4.0
Open mindedness
Degree of
Personal
Sacrifice
Needed for
Innovation, B2C
What Is Needed to Drive Innovation? (continued) All B2C respondents report that some degree of personal sacrifice is required to support innovation efforts
throughout a company.
31
1
2
3
4
5
3%
6%
30%
39%
22%
0%
5%
10%
15%
20%
25%
30%
35%
40%
45%
50%
No sacrifice(1)
Very littlesacrifice
(2)
Somesacrifice
(3)
Noticeablesacrifice
(4)
A tremendousamount ofsacrifice
(5)
Q. Please rank the top 3 attributes (with 1 representing the most important attribute) that describe
the type of personal leadership that is/would be required to drive innovation within your company.
Please indicate the amount of personal sacrifice (e.g., time, energy, stress) that is/would be
required of you to champion innovation within your company.
N = 79
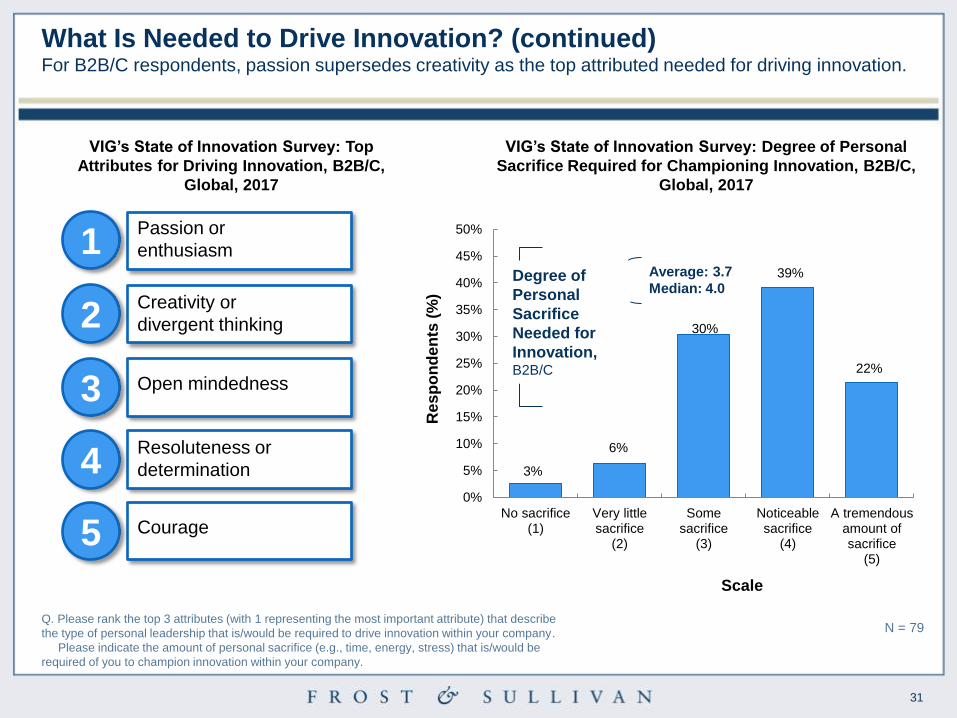
Passion or
enthusiasm
Creativity or
divergent thinking
Open mindedness
Courage
VIG’s State of Innovation Survey: Top
Attributes for Driving Innovation, B2B/C,
Global, 2017
VIG’s State of Innovation Survey: Degree of Personal
Sacrifice Required for Championing Innovation, B2B/C,
Global, 2017
Res
po
nd
en
ts (
%)
Scale
Average: 3.7
Median: 4.0
Resoluteness or
determination
Degree of
Personal
Sacrifice
Needed for
Innovation, B2B/C
What Is Needed to Drive Innovation? (continued) For B2B/C respondents, passion supersedes creativity as the top attributed needed for driving innovation.
32
Return to contents
32
The Last Word
33
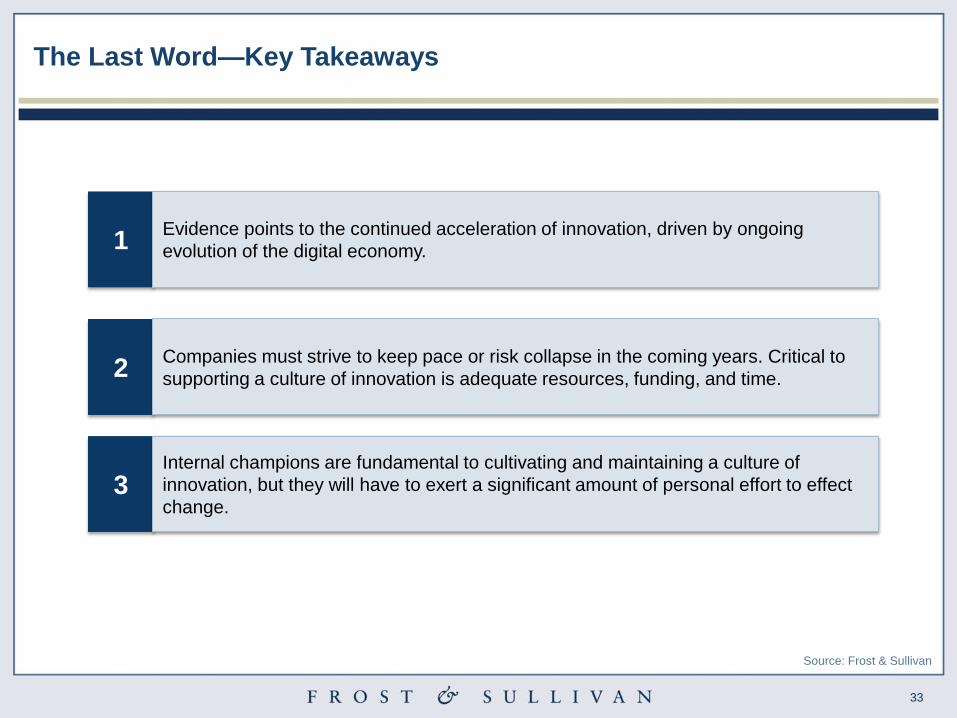
2 Companies must strive to keep pace or risk collapse in the coming years. Critical to
supporting a culture of innovation is adequate resources, funding, and time.
3 Internal champions are fundamental to cultivating and maintaining a culture of
innovation, but they will have to exert a significant amount of personal effort to effect
change.
1 Evidence points to the continued acceleration of innovation, driven by ongoing
evolution of the digital economy.
The Last Word—Key Takeaways
Source: Frost & Sullivan
34
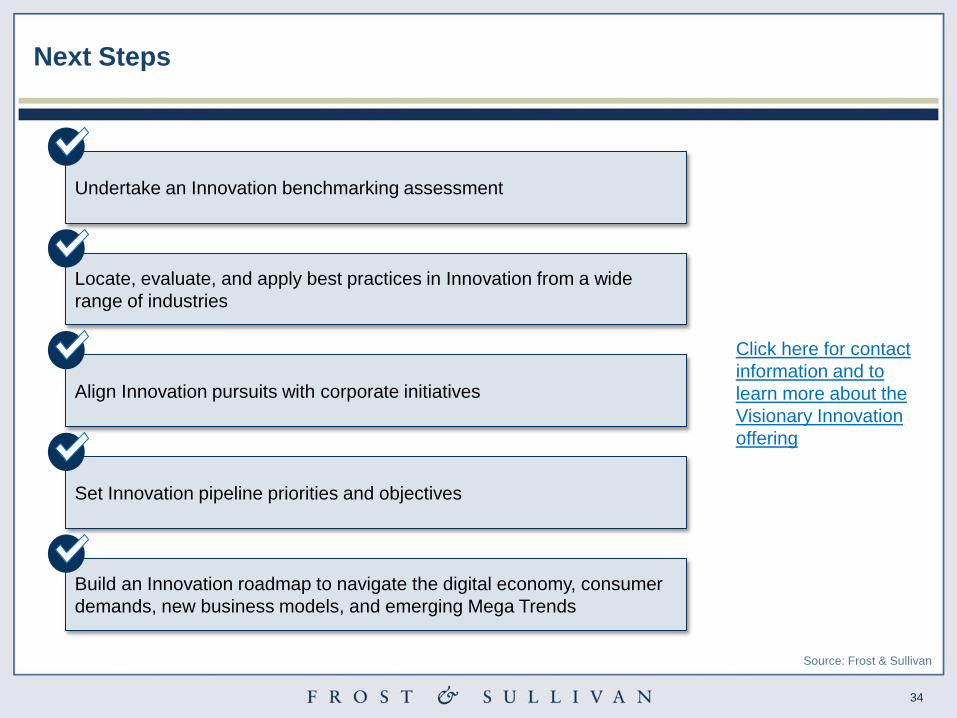
Next Steps
Source: Frost & Sullivan
Undertake an Innovation benchmarking assessment
Locate, evaluate, and apply best practices in Innovation from a wide
range of industries
Set Innovation pipeline priorities and objectives
Build an Innovation roadmap to navigate the digital economy, consumer
demands, new business models, and emerging Mega Trends
Align Innovation pursuits with corporate initiatives
Click here for contact
information and to
learn more about the
Visionary Innovation
offering
35
Return to contents
35
Respondent Demographics
36
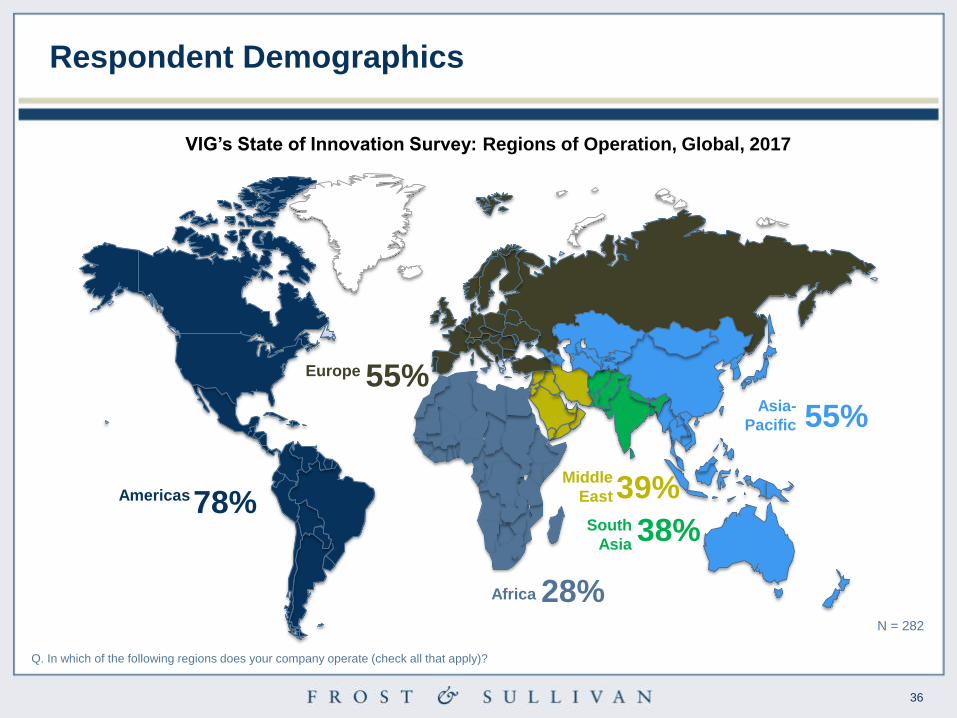
Americas 78%
Africa 28%
Asia-
Pacific 55%
Europe 55%
Middle
East 39%
VIG’s State of Innovation Survey: Regions of Operation, Global, 2017
Q. In which of the following regions does your company operate (check all that apply)?
N = 282
South
Asia 38%
Respondent Demographics
37
Respondent Demographics (continued)
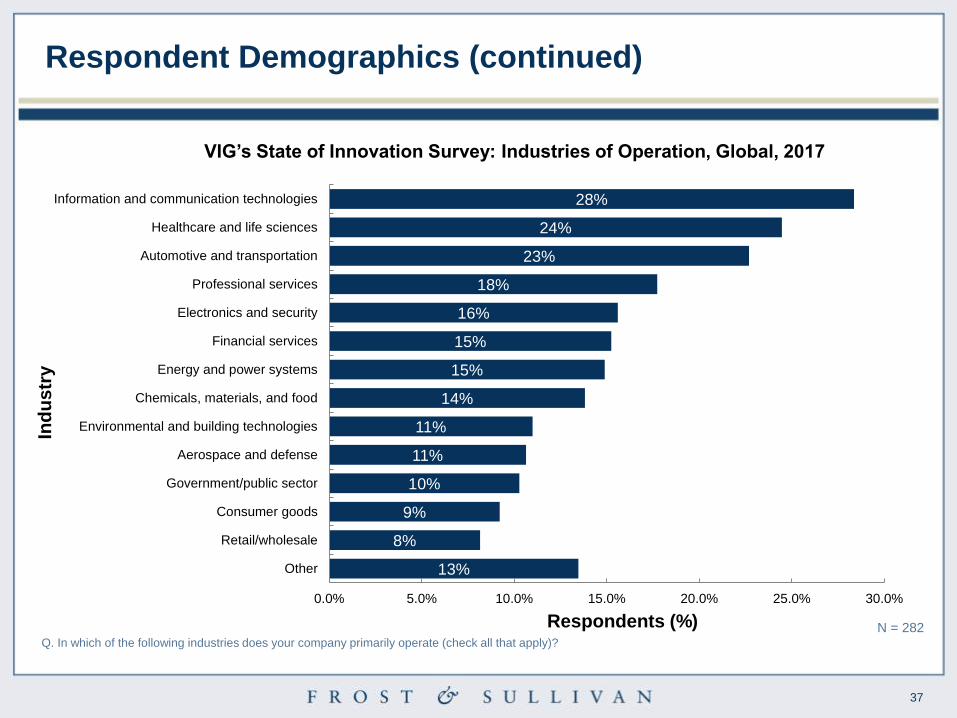
13%
8%
9%
10%
11%
11%
14%
15%
15%
16%
18%
23%
24%
28%
0.0% 5.0% 10.0% 15.0% 20.0% 25.0% 30.0%
Other
Retail/wholesale
Consumer goods
Government/public sector
Aerospace and defense
Environmental and building technologies
Chemicals, materials, and food
Energy and power systems
Financial services
Electronics and security
Professional services
Automotive and transportation
Healthcare and life sciences
Information and communication technologies
Q. In which of the following industries does your company primarily operate (check all that apply)?
N = 282
Ind
us
try
Respondents (%)
VIG’s State of Innovation Survey: Industries of Operation, Global, 2017
38
Respondent Demographics (continued)
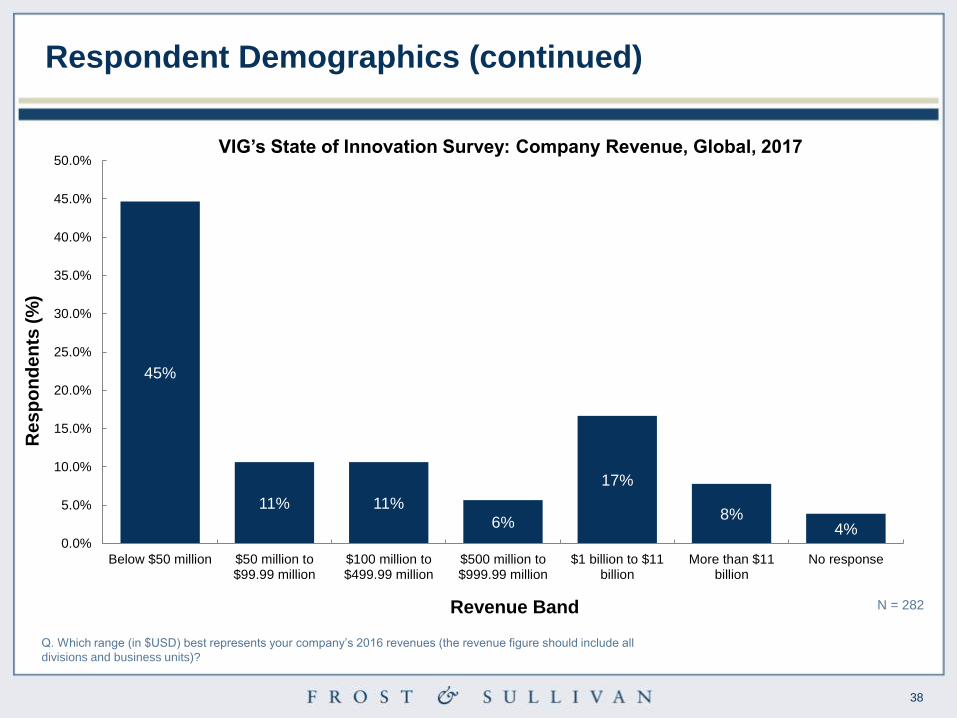
45%
11% 11%
6%
17%
8% 4%
0.0%
5.0%
10.0%
15.0%
20.0%
25.0%
30.0%
35.0%
40.0%
45.0%
50.0%
Below $50 million $50 million to$99.99 million
$100 million to$499.99 million
$500 million to$999.99 million
$1 billion to $11billion
More than $11billion
No response
Q. Which range (in $USD) best represents your company’s 2016 revenues (the revenue figure should include all
divisions and business units)?
N = 282 Revenue Band
Re
sp
on
de
nts
(%
)
VIG’s State of Innovation Survey: Company Revenue, Global, 2017
39
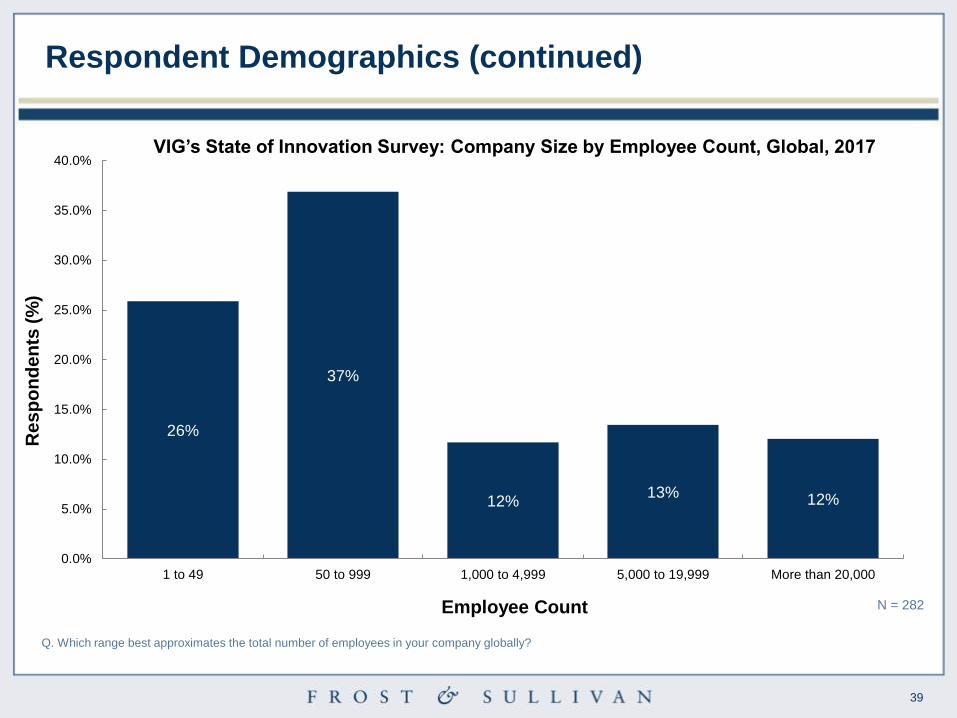
26%
37%
12% 13% 12%
0.0%
5.0%
10.0%
15.0%
20.0%
25.0%
30.0%
35.0%
40.0%
1 to 49 50 to 999 1,000 to 4,999 5,000 to 19,999 More than 20,000
Q. Which range best approximates the total number of employees in your company globally?
N = 282 Employee Count
Re
sp
on
de
nts
(%
)
VIG’s State of Innovation Survey: Company Size by Employee Count, Global, 2017
Respondent Demographics (continued)
40
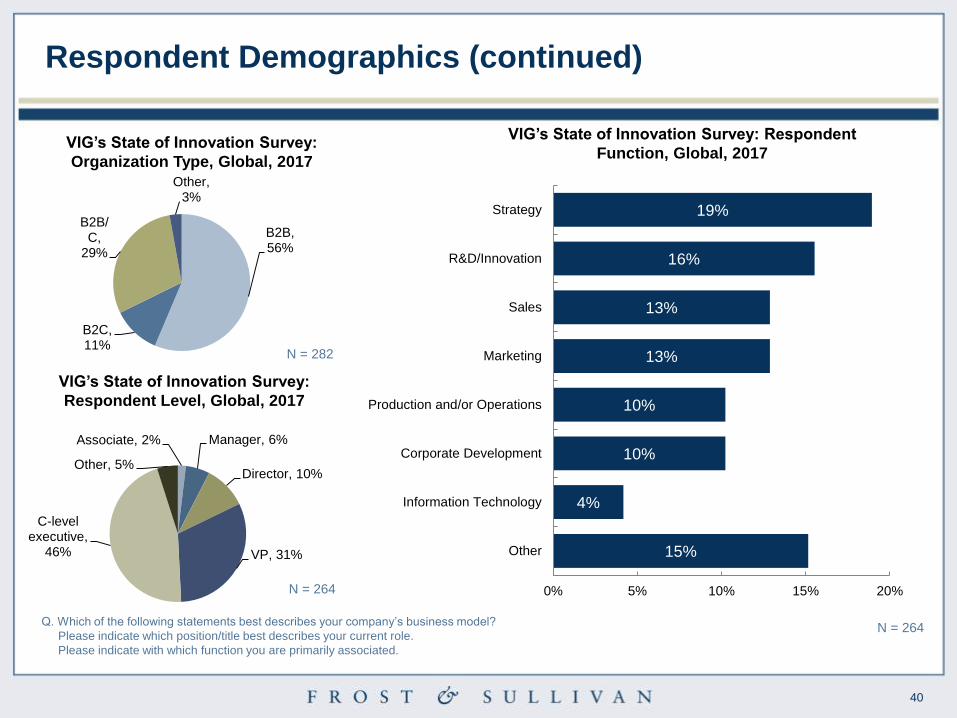
Respondent Demographics (continued)
Q. Which of the following statements best describes your company’s business model?
Please indicate which position/title best describes your current role.
Please indicate with which function you are primarily associated.
N = 264
VIG’s State of Innovation Survey: Respondent
Function, Global, 2017
B2B, 56%
B2C, 11%
B2B/C,
29%
Other, 3%
Associate, 2% Manager, 6%
Director, 10%
VP, 31%
C-level executive,
46%
Other, 5%
15%
4%
10%
10%
13%
13%
16%
19%
0% 5% 10% 15% 20%
Other
Information Technology
Corporate Development
Production and/or Operations
Marketing
Sales
R&D/Innovation
Strategy
VIG’s State of Innovation Survey:
Organization Type, Global, 2017
VIG’s State of Innovation Survey:
Respondent Level, Global, 2017
N = 264
N = 282
41
Return to contents
41
Contact Information
42
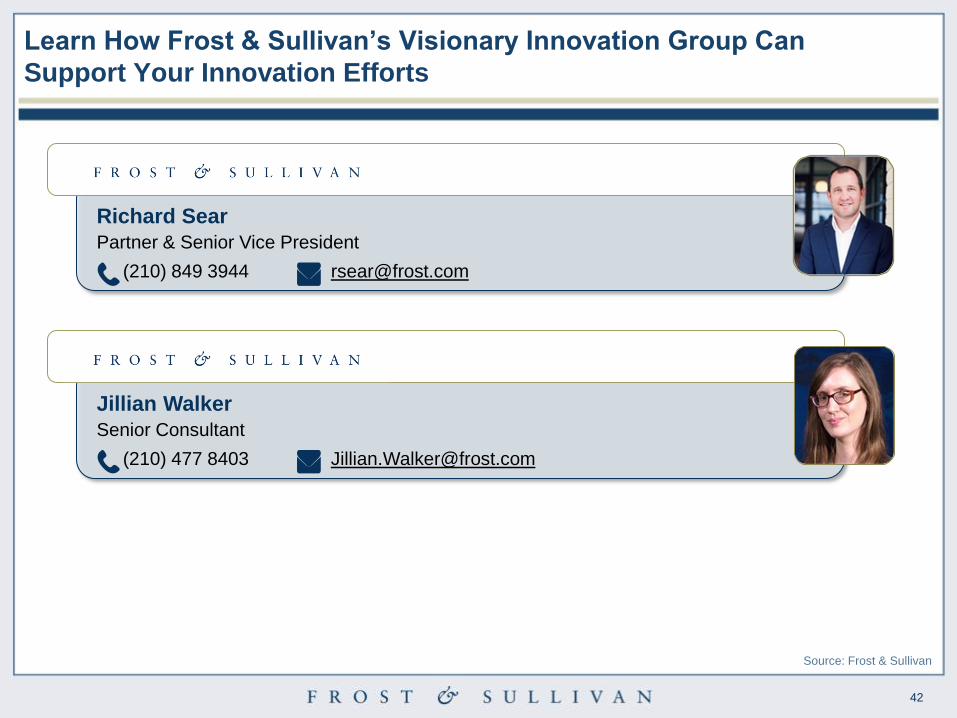
Learn How Frost & Sullivan’s Visionary Innovation Group Can
Support Your Innovation Efforts
Richard Sear
Partner & Senior Vice President
(210) 849 3944 [email protected]
Jillian Walker
Senior Consultant
(210) 477 8403 [email protected]
Source: Frost & Sullivan
43
Frost & Sullivan is not responsible for any incorrect information supplied to us by
manufacturers or users. Quantitative market information is based primarily on interviews and
therefore is subject to fluctuation. Frost & Sullivan research services are limited publications
containing valuable market information provided to a select group of customers. Our
customers acknowledge, when ordering or downloading, that Frost & Sullivan research
services are for customers’ internal use and not for general publication or disclosure to third
parties. No part of this research service may be given, lent, resold or disclosed to
noncustomers without written permission. Furthermore, no part may be reproduced, stored in
a retrieval system, or transmitted in any form or by any means, electronic, mechanical,
photocopying, recording or otherwise, without the permission of the publisher.
For information regarding permission, write to:
Frost & Sullivan
331 E. Evelyn Ave. Suite 100
Mountain View, CA 94041
© 2017 Frost & Sullivan. All rights reserved. This document contains highly confidential information and is the sole property of Frost & Sullivan.
No part of it may be circulated, quoted, copied or otherwise reproduced without the written approval of Frost & Sullivan.
Legal Disclaimer


