Journal of Food Science and Engineering 4 (2014) 203-211 The Panel Test as the Metrology of Extra Virgin Olive Oil Quality Evaluation and Its Dissemination Maurizio Caciotta 1 , Sabino Giarnetti 1 , Fabio Leccese 1 , Barbara Orioni 1 , Marco Oreggia 2 and Salvatore Rametta 1 1. Science Department, University of “Roma Tre”, Rome 00146, Italy 2. E.V.O. srl, Rome 00134, Italy Abstract: Nowadays, the check of the organoleptic characteristics for the evaluation of extra virgin olive oil (EVOO) quality is regulated by the European Union (EU) authorities, which indicate the use of the panel test (PT). It is composed by a team of specialists that give a numerical value to many characteristics about flavours, synthesising a sensory analysis. Each expert answers questions about the aroma by assigning the adequate scores to each oil. The evaluation becomes objective by applying the statistical analysis of all the scores given by the participants: This is the definition of “measure” of Russell. The PT can be considered a true standard “metrological system” (considering the number of questions in the questionnaire), while the perceptions of the testers are the solicitations of it. To allow access to an expensive evaluation process by small companies, this work proposes to “disseminate” the properties of the metrology represented by PT. The results of the PT are arranged in an unsupervised artificial neural network (ANN), the Kohonen map, which represents the synthesis of self-organised output that has only the goal, in this paper, to make readable PT results. The dissemination process is obtained by the gas chromatographic (GC) analysis of each oil sample and through the identification of peaks corresponding to the perceptions. These signals are used for the training of the supervised Multi Layer Perceptron (MLP) ANN, with the back propagation algorithm, whose outputs are represented by the results of the PT. This procedure is exact a “metrological dissemination of a standard” and also the aim of the work: to classify EVOO without always resorting to PT. Key words: EVOO, quality evaluation, gas chromatography, ANN. 1. Introduction The quality of goods is lexically defined as the “level of excellence”. The International Organisation for Standardisation (ISO), in 9001 norm, defines quality as “whatever the customer perceives good quality to be” [1]. The large increase in demand for high quality extra virgin olive oil (EVOO) is due to its peculiar characteristics that play an important role in human nutrition. The concept of its quality is not unique and the discussion within the scientific and technical community is extremely animated: EVOO quality may be defined from productive, commercial, nutritional and organoleptic points of view [2, 3]. Olive oil is the first food product which the assessment of the organoleptic quality used the panel Corresponding author: Barbara Orioni, Ph.D., research field: analytical chemistry. E-mail: [email protected]. test (PT) introduced at the level of European Union (EU) legislation as a criterion for the classification. The sensory evaluation of olive oil is now carried out according to the method described in the Reg. EU 1348/2013 annex XII (revision of Reg. EEC 2568/91) [4]. Usually, the PT is used to define the quality of the virgin olive oil rather than the intrinsic ability to analyse the relative organoleptic characteristics [5-8]. This work presents a “metrological system”, specific for EVOO, based on the evaluation of the panelists, the only custodian of the quality definition, in accordance to the norm. The PT is the standard of the organoleptic qualities and we propose the implementation of a metrology dissemination system, typical of all the scientific processes. The PT is a sensory analysis carried out by a team of experts (from 8 to 12 panelists) which, through the tasting, give a numerical subjective evaluation (from 0 DAVID PUBLISHING D
Transcript
Journal of Food Science and Engineering 4 (2014) 203-211
The Panel Test as the Metrology of Extra Virgin Olive Oil
Quality Evaluation and Its Dissemination
Maurizio Caciotta1, Sabino Giarnetti1, Fabio Leccese1, Barbara Orioni1, Marco Oreggia2 and Salvatore Rametta1
1. Science Department, University of “Roma Tre”, Rome 00146, Italy
2. E.V.O. srl, Rome 00134, Italy
Abstract: Nowadays, the check of the organoleptic characteristics for the evaluation of extra virgin olive oil (EVOO) quality is regulated by the European Union (EU) authorities, which indicate the use of the panel test (PT). It is composed by a team of specialists that give a numerical value to many characteristics about flavours, synthesising a sensory analysis. Each expert answers questions about the aroma by assigning the adequate scores to each oil. The evaluation becomes objective by applying the statistical analysis of all the scores given by the participants: This is the definition of “measure” of Russell. The PT can be considered a true standard “metrological system” (considering the number of questions in the questionnaire), while the perceptions of the testers are the solicitations of it. To allow access to an expensive evaluation process by small companies, this work proposes to “disseminate” the properties of the metrology represented by PT. The results of the PT are arranged in an unsupervised artificial neural network (ANN), the Kohonen map, which represents the synthesis of self-organised output that has only the goal, in this paper, to make readable PT results. The dissemination process is obtained by the gas chromatographic (GC) analysis of each oil sample and through the identification of peaks corresponding to the perceptions. These signals are used for the training of the supervised Multi Layer Perceptron (MLP) ANN, with the back propagation algorithm, whose outputs are represented by the results of the PT. This procedure is exact a “metrological dissemination of a standard” and also the aim of the work: to classify EVOO without always resorting to PT.
Key words: EVOO, quality evaluation, gas chromatography, ANN.
1. Introduction
The quality of goods is lexically defined as the
“level of excellence”. The International Organisation
for Standardisation (ISO), in 9001 norm, defines
quality as “whatever the customer perceives good
quality to be” [1]. The large increase in demand for
high quality extra virgin olive oil (EVOO) is due to its
peculiar characteristics that play an important role in
human nutrition. The concept of its quality is not
unique and the discussion within the scientific and
technical community is extremely animated: EVOO
quality may be defined from productive, commercial,
nutritional and organoleptic points of view [2, 3].
Olive oil is the first food product which the
assessment of the organoleptic quality used the panel
Corresponding author: Barbara Orioni, Ph.D., research
del Belice (g, G), Frantoio (i, I) [16]. Industrial sample
is identified by h and H letters.
2.2 Methods
The standard establishes that olive oil must be
tasted according to the rigid standards and regulations
of the PT that is carried out by a group of at least eight
professional tasters with a chief. The components of
the PT are required to provide a numerical rating,
ranging between 0 and 5, for a series of flavours,
which are listed in a sheet. The table used in this work
contains more questions than EU model: This choice
is dictated by a desire to enhance the possible
correlations between the flavours. Positive and
negative attributes and other perceptions are listed in
EU regulation [4].
Aromatic analysis is carried out by smelling the
sample, taking slow deep breaths to evaluate the oil,
with a pause between each breath. Then, the taster
shall then evaluate the gustatory and retronasal
sensations by taking a small sip of oil. It is very
important to distribute the oil throughout the whole of
the mouth cavity.
The members of the PT follow a training of six
months before being a reliable component of the panel
itself. They have to pass some exams as pre-selections
and exams during the lessons of training. In order to
deepen the metrological value of the PT, reserve the
regulation, a more extended questionnaire than that
provided by the EU sheet was prepared. In the present
The Panel Test as the Metrology of Extra Virgin Olive Oil Quality Evaluation and Its Dissemination
205
work, static head space (HS) sampling was applied
[17]. HS-GC analyses have been performed by placing
a 1.8 g sample of EVOO into a 10 mL headspace vial.
Then the vial has been hermetically sealed with a
PTFE (Polytetrafluoroethylene, best known as
Teflon®) septum and pre-incubated at 40 °C for 1 h;
this simulates the oropharyngeal cavity, where the
flavours develop. The vapour in equilibrium with
sample has been extracted by a Hamilton syringe and
immediately inserted into the injection port of the GC
system at 250 °C and in splitless mode (pressure 25
psi). Analyses were performed using an Agilent
7820A Gas Chromatograph (Agilent Technologies,
Santa Clara USA) using helium carrier gas at a flow
rate of 6.5 mL/min and a Flame Inoization Detector
(FID) detector maintained at 300 °C. The volatile
fraction has been transferred into a non-polar capillary
column (5% phenyl, 95% dimethylpolysiloxane, 30 m,
0.32 mm i.d., 0.25 μm film thickness). The oven
temperature is held at 75 °C for 30 s and programmed
to rise at 20 °C/min to a final temperature of 200 °C,
at which it is held for 120 s. On a quality level, many
of the signals have been assigned to organic volatile
molecules by comparing our gas chromatograms to
Agilent database and, consequently, correlated to
characteristic flavour [18] in accordance to other
authors which used a similar column [19].
In unsupervised training, the networks learn to form
their own classifications of the training data without
external help. The unsupervised network [20] is
designed to perform a non-linear mapping of a
high-dimensionality data space, transforming it in a
low-dimensional space, usually 2D. This
representation is the Kohonen map. The visualisation
of the output data is performed from the
distance/proximity of neurons in an output grid. The
output neurons are only connected to its nearest
neighbours. The proximity represents a similar pattern
represented by an output neuron. The system is based
on competitive learning, in which the output neurons
compete amongst themselves to be activated, with the
result that only one is activated at any one time. This
activated neuron is called the winning neuron. The
result is that the neurons are forced to organise
themselves. For obvious reasons, such a network is
called a self organising map (SOM). The structure is
shown in Fig. 1.
This type of ANN maps sets input data onto a set of
appropriate outputs, and it is a supervised network
because it requires a desired output in order to learn.
A multi layer perceptron (MLP) consists of multiple
layers of nodes in a directed graph, with each layer
fully connected to the next one. The MLP uses an
algorithm called back-propagation (BP), which uses
the data in order to modify the weights and other
parameters to minimise the prediction “learning error”.
This error decreases with each iteration and the neural
model gets closer and closer to producing the desired
output. This process is known as “training” [21]. The
supervised learning, given a set of example pairs (X,
Y), has the purpose of finding a function f: X→Y in the
allowed class of functions that matches the examples.
It has three-layered system: an input layer,
intermediate called hidden layer and an output one, as
shown in Fig. 2.
3. Results and Discussion
The main parameters that identify the best oils are
fruity, green, bitter, spicy and sweet qualities. Fig. 3
shows the results of PT. Each perception is
represented in accordance to the average value of the
assigned score.
Fig. 1 Structure of unsupervised ANN.
The
206
Fig. 2 Multi
Fig. 3 SynthOn the left—th
The volat
by detecting
peaks corr
comparison
support [17,
Each peak
Panel Test as
i layer percept
hesis of PT evahe positive attri
tile fraction o
g 37 peaks. Fi
respond to
with litera
22].
k is correlate
s the Metrolo
ron topology.
aluation. ibutes; in the m
of the oils ha
ig. 4 shows s
flavours,
ature and A
ed to a molec
ogy of Extra V
middle—the aver
as been analy
some results.
identified
Agilent techn
cule, the dete
Virgin Olive O
rage values ass
ysed
The
by
nical
ected
com
liste
T
num
The
neu
Oil Quality Ev
igned by panell
mpounds and
ed in Table 1
The number o
mber of perce
e output dime
urons map, a
aluation and
lists; on the righ
d their relativ
.
of inputs of
eptions on wh
ensions are a
and all availa
Its Dissemin
ht—the legend
ve sensory a
the SOM is
hich the PT i
arbitrary set i
able inputs, c
nation
of oil samples.
attributes are
equal to the
is stimulated.
in a 10 10
connected to
e
e
0
o
The Panel Test as the Metrology of Extra Virgin Olive Oil Quality Evaluation and Its Dissemination
207
Fig. 4 (a) Sample I, Frantoio variety and (b) sample H, industrial type (arbitrary units on y-axis). The peaks numbers correspond to flavour listed in Table 1.
oils for two cycles, one of 100 epochs with a learning
rate from 0.08 to 0.02, and the second of 1,000 cycle
with a learning rate from 0.1 to 0.001. The results are
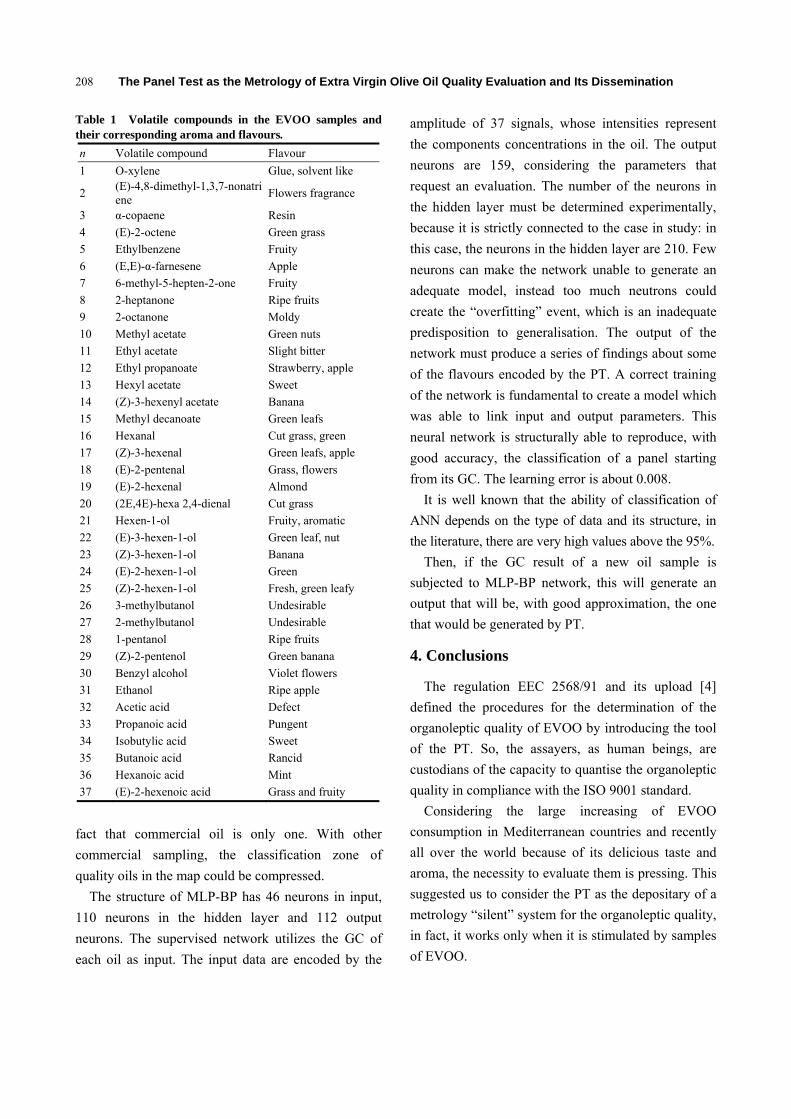
displayed in Fig. 5.
The classification in Fig. 6 shows, in map
interpretation, the abscissa axis ripe-spicy develops
from left to right and the y-axis ripe-sweet from the
bottom to the top. The analysis can be completed by
considering the sweet-fresh and spicy-fresh axis, in
which oils are set according to their main
characteristics. An analysis of these characteristics,
highlighted by the Kohonen map, deserves in a future
work a study on the meaning of the metrology system
of PT.
This arrangement solves the objective problem
related to the fact that the PT is a “multiple standard”,
seat of a large number of organoleptic characteristics
which the work is addressed through the instrument of
unsupervised ANN, that help a diversification in the
sample that stimulate the PT and allow an internal
evaluation that can be considered as its “calibration”.
On the other hand, our intent is to study of the
ability to “disseminate the standard” and the Kohonen
map is used only as a tool for display of the response
of the PT. A further work will underline the meaning
of the map of Kohonen results, related to each
organoleptic characteristics investigated.
To check the ability of the SOM to correct
classification after the learning step, only eight of the
nine oil samples were used, the sample “i” was
excluded. In Fig. 5, the results of the classification are
shown in light-blue. The excluded sample, whose PT
evaluation is known, was used to test the ability of
classification of the Kohonen map and it is reported in
light orange. With the aim of identifying the
“objectivity” of this classification, the learning process
was repeated, also taking into account the sample
previously excluded. In Fig. 5, the new positioning of
samples is indicated with uppercase letters on blue
background.
Discrepancies will be explained in the conclusions
section. It’s clear that the left shift of almost all of the
classifications of the samples, the sample “i” keeps its
position in the lower left of the Kohonen map.
Other consideration is the marginality of industrial
product (h, H), in the classification space in the
Kohonen map. The vicinity with the zone in which are
distributed the “quality” oils, can be explained by the
The Panel Test as the Metrology of Extra Virgin Olive Oil Quality Evaluation and Its Dissemination
208
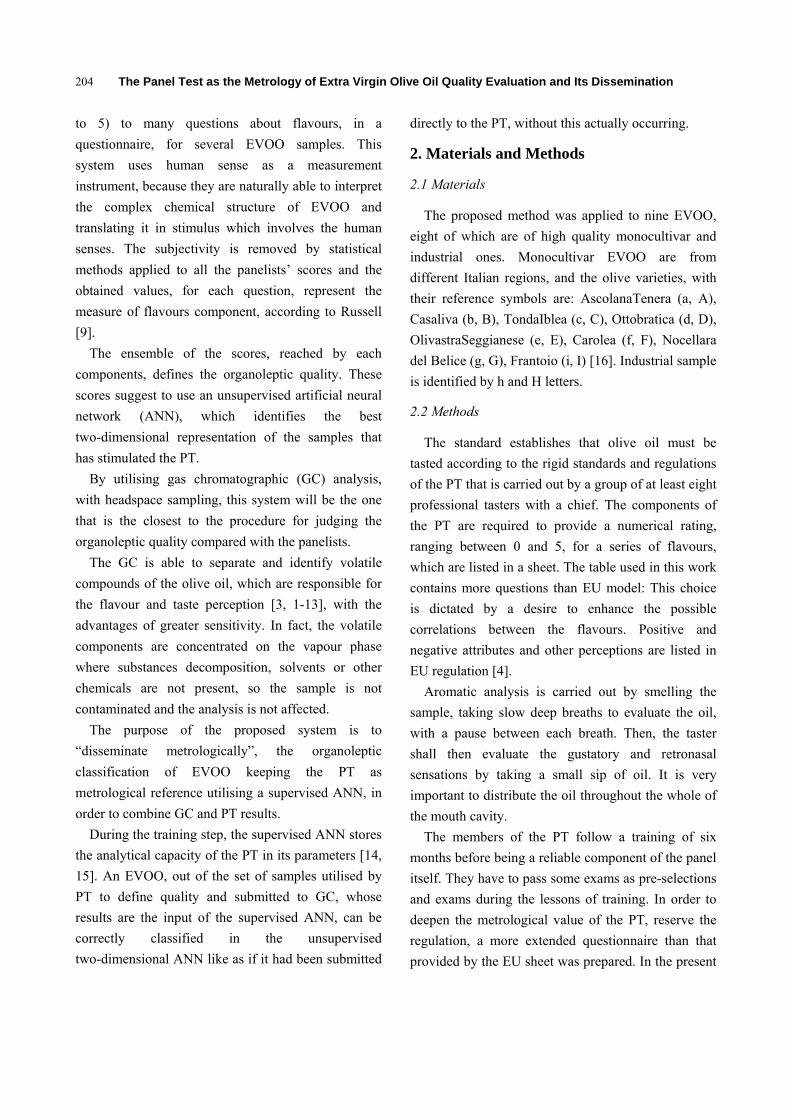
Table 1 Volatile compounds in the EVOO samples and their corresponding aroma and flavours. n Volatile compound Flavour
1 O-xylene Glue, solvent like
2 (E)-4,8-dimethyl-1,3,7-nonatriene
Flowers fragrance
3 α-copaene Resin
4 (E)-2-octene Green grass
5 Ethylbenzene Fruity
6 (E,E)-α-farnesene Apple
7 6-methyl-5-hepten-2-one Fruity
8 2-heptanone Ripe fruits
9 2-octanone Moldy
10 Methyl acetate Green nuts
11 Ethyl acetate Slight bitter
12 Ethyl propanoate Strawberry, apple
13 Hexyl acetate Sweet
14 (Z)-3-hexenyl acetate Banana
15 Methyl decanoate Green leafs
16 Hexanal Cut grass, green
17 (Z)-3-hexenal Green leafs, apple
18 (E)-2-pentenal Grass, flowers
19 (E)-2-hexenal Almond
20 (2E,4E)-hexa 2,4-dienal Cut grass
21 Hexen-1-ol Fruity, aromatic
22 (E)-3-hexen-1-ol Green leaf, nut
23 (Z)-3-hexen-1-ol Banana
24 (E)-2-hexen-1-ol Green
25 (Z)-2-hexen-1-ol Fresh, green leafy
26 3-methylbutanol Undesirable
27 2-methylbutanol Undesirable
28 1-pentanol Ripe fruits
29 (Z)-2-pentenol Green banana
30 Benzyl alcohol Violet flowers
31 Ethanol Ripe apple
32 Acetic acid Defect
33 Propanoic acid Pungent
34 Isobutylic acid Sweet
35 Butanoic acid Rancid
36 Hexanoic acid Mint
37 (E)-2-hexenoic acid Grass and fruity
fact that commercial oil is only one. With other
commercial sampling, the classification zone of
quality oils in the map could be compressed.
The structure of MLP-BP has 46 neurons in input,
110 neurons in the hidden layer and 112 output
neurons. The supervised network utilizes the GC of
each oil as input. The input data are encoded by the
amplitude of 37 signals, whose intensities represent
the components concentrations in the oil. The output
neurons are 159, considering the parameters that
request an evaluation. The number of the neurons in
the hidden layer must be determined experimentally,
because it is strictly connected to the case in study: in
this case, the neurons in the hidden layer are 210. Few
neurons can make the network unable to generate an
adequate model, instead too much neutrons could
create the “overfitting” event, which is an inadequate
predisposition to generalisation. The output of the
network must produce a series of findings about some
of the flavours encoded by the PT. A correct training
of the network is fundamental to create a model which
was able to link input and output parameters. This
neural network is structurally able to reproduce, with
good accuracy, the classification of a panel starting
from its GC. The learning error is about 0.008.
It is well known that the ability of classification of
ANN depends on the type of data and its structure, in
the literature, there are very high values above the 95%.
Then, if the GC result of a new oil sample is
subjected to MLP-BP network, this will generate an
output that will be, with good approximation, the one
that would be generated by PT.
4. Conclusions
The regulation EEC 2568/91 and its upload [4]
defined the procedures for the determination of the
organoleptic quality of EVOO by introducing the tool
of the PT. So, the assayers, as human beings, are
custodians of the capacity to quantise the organoleptic
quality in compliance with the ISO 9001 standard.
Considering the large increasing of EVOO
consumption in Mediterranean countries and recently
all over the world because of its delicious taste and
aroma, the necessity to evaluate them is pressing. This
suggested us to consider the PT as the depositary of a
metrology “silent” system for the organoleptic quality,
in fact, it works only when it is stimulated by samples
of EVOO.
The
Fig. 5 ResulUppercase lett
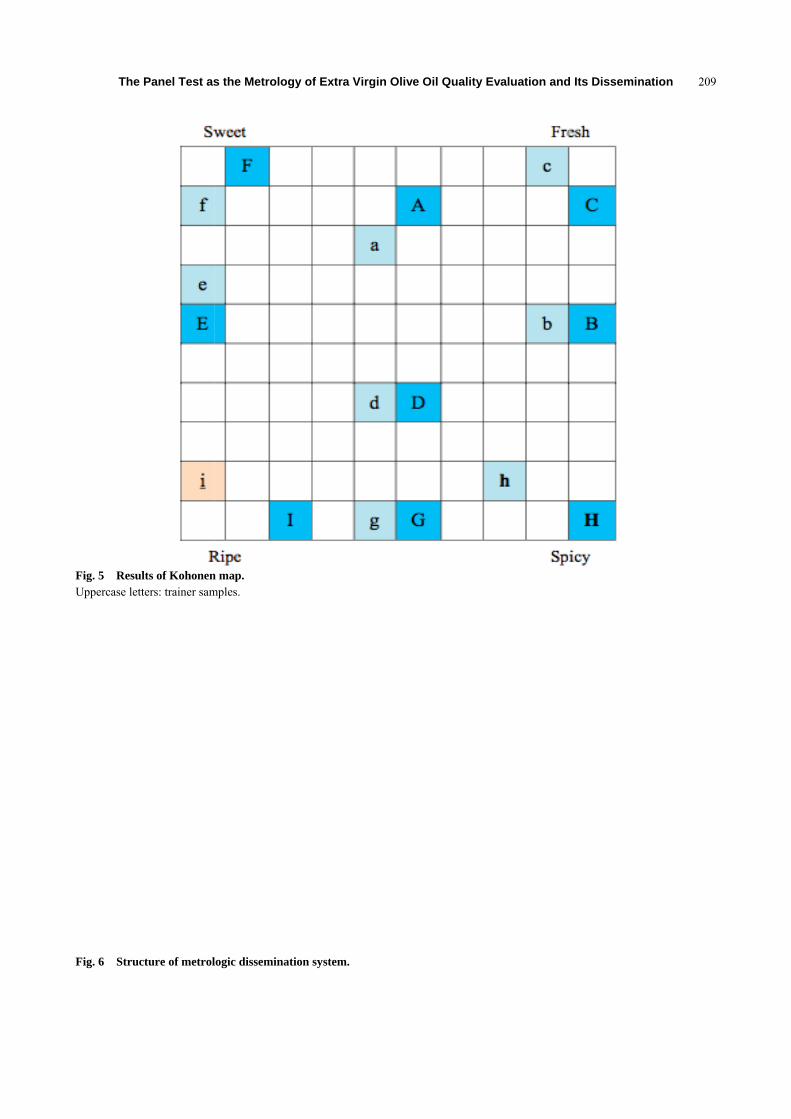
Fig. 6 Struc
Panel Test as
lts of Kohonenters: trainer sam
cture of metrol
s the Metrolo
n map. mples.
logic dissemina
ogy of Extra V
ation system.
Virgin Olive OOil Quality Evaluation and Its Dissemin
nation 2099
The Panel Test as the Metrology of Extra Virgin Olive Oil Quality Evaluation and Its Dissemination
210
The data of the PT have been used to train the
Kohonen map with the purpose to make it more easily
readable and highlight autonomously the clearest
characteristics.
A later study will look for all the stimulation that
could be mathematically “independent”, allowing the
eventual identification in PT of a “stimuli base system”
that could be an equivalent of a measurement unit
system of the flavour.
It is clear that the space of arbitrary output of the
map of Kohonen is occupied as a function of the
stimulation of the PT, but in text it has been observed
that the “empirical priority” is respected in both of the
classifications. These properties of Kohonen map have
not been analysed and they will be the subject of a
future work.
Now, this evaluation is realised by very expensive
systems. A PT, performed according to the EU
procedures, is hard because it requires accredited
assayers. It is also an expensive process and, therefore,
it is not easily accessible to the companies that have
limited productions and if they were of high quality
they might not have the correct market price.
From a technical point of view, the ANN
architecture is robust to the possible variability of
peaks of GC of each sample, because it is more
sensible to the “signature” of GC, despite the
variability of peaks intensity.
The identification of GC peaks does not seem to
exclude the possibility that small signals could be
instead determinants in sensory perception. This
aspect can be revealed only through a wide and
diversified stimulation of PT.
Knowing the capabilities of generalisation of
MLP-BP, GC of a sample excluded from learning will
likely to give an output which applied to the map of
Kohonen, will place the sample in the map in a similar
position to that in which it would have positioned the
PT without that this has actually analysed.
This is the exact procedure of metrology
dissemination extracted from PT. Then, a PT on a
certain number of samples is undoubtedly the
expression of an organoleptic metrology, incomplete
but always improvable.
Finally, the developed tool is shown in Fig. 6, the
cascade of the two ANNs and the MLP-BP are able to
classify a sample different from those used for the
learning of both the Kohonen map and the MLP-BP.
This system of classification has the advantage of a
greater “readability” by consumers, than the PT results.
They can directly read the original results. Common
producers who can’t easily reach a professional PT are
aiming to provide access to it.
Acknowledgments
The realisation of this work has been possible
thanks to some Italian EVOO producers. The author
also wishes to thank “Flos Olei”, the guide to the
world best EVOO describing, popularising and
promoting the ones that will excel in this selection.
References
[1] Quality Systems, Model for Quality Assurance in Design, Development, Production, Installation and Servicing, ISO 9001, 1994.
[2] R.M. Duran, Relationship between the composition and ripening of the olive and the quality of the oil, Acta Horticulturae 286 (1990) 441-451.
[3] C.M. Kalua, M.S. Allen, D.R. Bedgood, A.G. Bishop, P.D. Prenzler, K. Robards, Olive oil volatile compounds, flavour development and quality: A critical review, Food Chem. 100 (1) (2007) 273-286.
[5] R. Garcia-Villalba, T. Pacchiarotta, A. Carrasco-Pancorbo, A. Segura-Carretero, A. Fernández-Gutiérrez, A.M. Deelder, et al., Gas chromatography—atmospheric pressure chemical ionization-time of flight mass spectrometry for profiling of phenolic compounds in extra virgin olive oil, Journal of Chromatography A 1218 (7) (2011) 959-971.
[6] M.C. Whitehead, C.S. Beeman, B.A. Kinsella, Distribution of taste and general sensory nerve endings in fungiform papillae of the hamster, American Journal of Anatomy 173 (3) (1985) 185-201.
[7] M.T. Morales, M. Tsimidou, The role of volatile
The Panel Test as the Metrology of Extra Virgin Olive Oil Quality Evaluation and Its Dissemination
211
compounds and polyphenols in olive oil sensory quality, in: J. Harwood, R. Aparicio (Eds.), Handbook of Olive Oil, Analysis and Properties, Aspen Publication, Gaithersburg, Maryland, 2000, pp. 393-458.
[8] International Olive Council, Testing methods, http://www.internationaloliveoil.org (accessed Mar. 20, 2014).
[9] B. Russell, The Principles of Mathematics, Cambridge University Press, Cambridge, 1903.
[10] F. Angerosa, Influence of volatile compounds on virgin olive oil quality evaluated by analytical approaches and sensor panels, European Journal of Lipid Science and Technology 104 (9-10) (2002) 639-660.
[11] D. Tura, P.D. Prenzler, D.R. Bedgood, J.M. Antolovich, K. Robards, Varietal and processing effects on the volatile profile of Australian olive oils, Food Chemistry 84 (3) (2004) 341-349.
[12] G. Luna, M.T. Morales, R. Aparicio, Characterization of 39 varietal virgin olive oils by their volatile composition, Food Chemistry 98 (2) (2006) 243-252.
[13] C. Pizarro, S. Rodríguez-Tecedor, N. Pérez-del-Notario, J.M. González-Sáiz, Recognition of volatile compounds as markers in geographical discrimination of Spanish extra virgin olive oils by chemometric analysis of non-specific chromatography volatile profiles, Journal of Chromatography A 1218 (3) (2011) 518-523.
[14] K. Gurney, An Introduction to Neural Networks, Routledge, London, 1997.
[15] S. Haykin, Neural Networks: A Comprehensive Foundation, Prentice Hall, Upper Saddle River, New Jersey, 1999.
[16] M. Oreggia, Flos Olei—A Guide to the World of Extra Virgin Olive Oil, E.V.O. srl, Rome, 2014. (in Italian)
[17] N.H. Snow, G.C. Slack, Head-space analysis in modern gas chromatography, TrAC Trends in Analytical Chemistry 21 (9-10) (2002) 608-617.
[18] M.T. Morales, M.V. Alonso, J.J. Rios, R. Aparicio, Virgin olive oil aroma: Relationship between volatile compounds and sensory attributes by chemometrics, Journal of Agriculture and Food Chemistry 43 (11) (1995) 2925-2931.
[19] S. Vichi, A.I. Castellote, L. Pizzale, L.S. Conte, S. Buxaderas, E. López-Tamames, Analysis of virgin olive oil volatile compounds by headspace solid-phase microextraction coupled to gas chromatography with mass spectrometric and flame ionization detection, Journal of Chromatography A 983 (1-2) (2003) 19-33.
[21] M. Caciotta, S. Giarnetti, F. Leccese, Hybrid neural network system for electric load forecasting of telecommunication station, in: Proceeding of XIX IMEKO World Congress—Fundamental and Applied Metrology, Lisbon, 2009.
[22] Agilent 7820A Gas Chromatograph Data Sheet, http://www.agilent.com (accessed Mar. 20, 2014).