The parallel system for integrating impact models and sectors (pSIMS) Joshua Elliott a, b, * , David Kelly a, b , James Chryssanthacopoulos c , Michael Glotter d , Kanika Jhunjhnuwala e , Neil Best a , Michael Wilde a, b , Ian Foster a, b, f a University of Chicago Computation Institute, 5735 S. Ellis Avenue, Chicago, IL 60637, USA b Argonne National Laboratory Math & Comp. Science Division, Argonne, IL 60439, USA c Columbia University Center for Climate Systems Research, 2880 Broadway, NY, NY 10025, USA d University of Chicago Department of Geophysical Sciences, 5734 S. Ellis Avenue, Chicago, IL 60637, USA e New Zealand Landcare Research, 231 Morrin Road, St Johns, Auckland 1072, New Zealand f Department of Computer Science, University of Chicago, Chicago, IL 60637, USA article info Article history: Received 1 November 2013 Received in revised form 20 March 2014 Accepted 13 April 2014 Available online xxx Keywords: Climate change impacts, adaptation, and vulnerabilities (VIA) Parallel computing Data processing and standardization Crop modeling Forestry modeling Multi-model Ensemble simulation abstract We present a framework for massively parallel climate impact simulations: the parallel System for Integrating Impact Models and Sectors (pSIMS). This framework comprises a) tools for ingesting and converting large amounts of data to a versatile datatype based on a common geospatial grid; b) tools for translating this datatype into custom formats for site-based models; c) a scalable parallel framework for performing large ensemble simulations, using any one of a number of different impacts models, on clusters, supercomputers, distributed grids, or clouds; d) tools and data standards for reformatting outputs to common datatypes for analysis and visualization; and e) methodologies for aggregating these datatypes to arbitrary spatial scales such as administrative and environmental demarcations. By auto- mating many time-consuming and error-prone aspects of large-scale climate impacts studies, pSIMS accelerates computational research, encourages model intercomparison, and enhances reproducibility of simulation results. We present the pSIMS design and use example assessments to demonstrate its multi- model, multi-scale, and multi-sector versatility. Ó 2014 Elsevier Ltd. All rights reserved. Software and data availability The first open release of the source code is planned for 2014. 1. Introduction Understanding the vulnerability of human society to climate change is necessary for sound decision-making in climate policy. However, the research needed to build this understanding is hindered by the fact that science and information products must be integrated across vastly different spatial and temporal scales (Rosenzweig et al., 2013). Biophysical responses to global change generally depend on environmental (e.g., soil type), socioeconomic (e.g., farm and forest management), and climatic factors that vary substantially over re- gions. Global Gridded Biophysical Models (GGBMs) are designed to capture spatial heterogeneity and simulate biophysical responses (e.g., of crops and forests) to climate over large areas (Rosenzweig et al., 2014; Elliott et al., 2014a). GGBMs derived from site-based (“field-scale” or “stand-scale”) models (e.g., APSIM, DSSAT, and CenW) estimate some measures of productivity (e.g., crop yield) from local management, climate, and soil profiles that represent a single field or stand. By running site-based models many times to simulate behavior at different sitesdin some studies considered here, at 10s or even 100s of thousands of sitesdGGBMs can provide information at an unprecedented detail and scale. However, such studies require high-resolution data concerning soil types, environmental condi- tions, and management practices at many individual sites. The primary obstacle to obtaining the data inputs necessary for a comprehensive high-resolution assessment of climate impacts is often not that data does not exist, but that the task of converting this data into a usable form involves much effort and expertise. Researchers must typically catalog, assimilate, test, and process data from multiple sources with vastly different spatial and tem- poral scales and extents. Each dataset may come in a different format and have a unique set of issues and quirks. The labor- intensive and error-prone process of accessing, understanding, scaling, and integrating such diverse data involves the creation of * Corresponding author. University of Chicago Computation Institute, 5735 S. Ellis Avenue, Chicago, IL 60637, USA. Tel.: þ1 212 678 5630; fax: þ1 773 834 3700. E-mail address: [email protected](J. Elliott). Contents lists available at ScienceDirect Environmental Modelling & Software journal homepage: www.elsevier.com/locate/envsoft http://dx.doi.org/10.1016/j.envsoft.2014.04.008 1364-8152/Ó 2014 Elsevier Ltd. All rights reserved. Environmental Modelling & Software xxx (2014) 1e8 Please cite this article in press as: Elliott, J., et al., The parallel system for integrating impact models and sectors (pSIMS), Environmental Modelling & Software (2014), http://dx.doi.org/10.1016/j.envsoft.2014.04.008
The parallel system for integrating impact models and sectors (pSIMS)
Joshua Elliott a,b,*, David Kelly a,b, James Chryssanthacopoulos c, Michael Glotter d,Kanika Jhunjhnuwala e, Neil Best a, Michael Wilde a,b, Ian Foster a,b,f
aUniversity of Chicago Computation Institute, 5735 S. Ellis Avenue, Chicago, IL 60637, USAbArgonne National Laboratory Math & Comp. Science Division, Argonne, IL 60439, USAcColumbia University Center for Climate Systems Research, 2880 Broadway, NY, NY 10025, USAdUniversity of Chicago Department of Geophysical Sciences, 5734 S. Ellis Avenue, Chicago, IL 60637, USAeNew Zealand Landcare Research, 231 Morrin Road, St Johns, Auckland 1072, New ZealandfDepartment of Computer Science, University of Chicago, Chicago, IL 60637, USA
a r t i c l e i n f o
Article history:Received 1 November 2013Received in revised form20 March 2014Accepted 13 April 2014Available online xxx
http://dx.doi.org/10.1016/j.envsoft.2014.04.0081364-8152/� 2014 Elsevier Ltd. All rights reserved.
Please cite this article in press as: Elliott, JModelling & Software (2014), http://dx.doi.o
a b s t r a c t
We present a framework for massively parallel climate impact simulations: the parallel System forIntegrating Impact Models and Sectors (pSIMS). This framework comprises a) tools for ingesting andconverting large amounts of data to a versatile datatype based on a common geospatial grid; b) tools fortranslating this datatype into custom formats for site-based models; c) a scalable parallel framework forperforming large ensemble simulations, using any one of a number of different impacts models, onclusters, supercomputers, distributed grids, or clouds; d) tools and data standards for reformattingoutputs to common datatypes for analysis and visualization; and e) methodologies for aggregating thesedatatypes to arbitrary spatial scales such as administrative and environmental demarcations. By auto-mating many time-consuming and error-prone aspects of large-scale climate impacts studies, pSIMSaccelerates computational research, encourages model intercomparison, and enhances reproducibility ofsimulation results. We present the pSIMS design and use example assessments to demonstrate its multi-model, multi-scale, and multi-sector versatility.
� 2014 Elsevier Ltd. All rights reserved.
Software and data availability
The first open release of the source code is planned for 2014.
1. Introduction
Understanding the vulnerability of human society to climatechange is necessary for sound decision-making in climate policy.However, the researchneeded tobuild thisunderstanding ishinderedby the fact that science and information products must be integratedacross vastly different spatial and temporal scales (Rosenzweig et al.,2013). Biophysical responses to global change generally depend onenvironmental (e.g., soil type), socioeconomic (e.g., farm and forestmanagement), and climatic factors that vary substantially over re-gions. Global Gridded Biophysical Models (GGBMs) are designed tocapture spatial heterogeneity and simulate biophysical responses
utation Institute, 5735 S. Ellis0; fax: þ1 773 834 3700.
., et al., The parallel systemrg/10.1016/j.envsoft.2014.04.
(e.g., of crops and forests) to climate over large areas (Rosenzweiget al., 2014; Elliott et al., 2014a). GGBMs derived from site-based(“field-scale” or “stand-scale”) models (e.g., APSIM, DSSAT, andCenW) estimate somemeasures of productivity (e.g., crop yield) fromlocal management, climate, and soil profiles that represent a singlefield or stand. By running site-based models many times to simulatebehavior at different sitesdin some studies considered here, at 10s oreven 100s of thousands of sitesdGGBMs can provide information atan unprecedented detail and scale. However, such studies requirehigh-resolution data concerning soil types, environmental condi-tions, and management practices at many individual sites.
The primary obstacle to obtaining the data inputs necessary fora comprehensive high-resolution assessment of climate impacts isoften not that data does not exist, but that the task of convertingthis data into a usable form involves much effort and expertise.Researchers must typically catalog, assimilate, test, and processdata from multiple sources with vastly different spatial and tem-poral scales and extents. Each dataset may come in a differentformat and have a unique set of issues and quirks. The labor-intensive and error-prone process of accessing, understanding,scaling, and integrating such diverse data involves the creation of
for integrating impact models and sectors (pSIMS), Environmental008
J. Elliott et al. / Environmental Modelling & Software xxx (2014) 1e82
what is, in effect, a custom data processing pipeline for every study.A comparably complex set of transformations must often be per-formed on simulation outputs to produce information products forstakeholdersdincluding farmers, policy-makers, markets, andagro-business interestsdthat operate at very different scales.
To address these challenges and facilitate access to high-resolution climate impact modeling we have developed a suite oftools, data, and models called the parallel System for IntegratingImpacts Models and Sectors (pSIMS). This system largely automatesthe labor-intensive processes of creating and running data ingestand transformation pipelines and allows researchers to use high-performance computing to run simulations that extend over largespatial extents, run for many growing seasons, or evaluate manyalternative management practices or other input configurations. Inso doing, pSIMS dramatically reduces the time and technical skillsrequired to investigate global change vulnerability, impacts andpotential adaptations. pSIMS is designed to support integration andhigh-resolution application of any site-based climate impact modelthat can be compiled in a Unix environment (with a focus on pri-mary production: agriculture, livestock, and forestry). A variety ofexisting and ongoing efforts have developed software frameworksfor parallel spatial simulations of a specific impact model on aspecific compute cluster (e.g., Bryan, 2013; Nichols et al., 2011; Vitalet al., 2013; Zhao et al., 2013, 2012). The open-source pSIMSframework attempts to improve on these by adding features suchas multi-model versatility, system portability, and robust faulttolerance.
In this paper we detail the pSIMS structure and methodology(Sections 2e4); describe two example applications (Sections 5 and6); and summarize features of the high-performance software andcomputational architecture (Section 7). The pSIMS methodologypartitions the simulation process into four major stages: data ingestand standardization (Section 2), campaign specification (Section 3),campaign implementation (Section 4), and aggregation to arbitrarydecision-relevant scales (Fig. 1). pSIMS currently supports GGBMsconstructed from several site-based models: versions 4.0 and 4.5 ofthe Decision Support System for Agrotechnology Transfer (DSSAT;Jones et al., 2003; Hoogenboom et al., 2010), versions 7.4 and 7.5 ofthe Agricultural Production Systems Simulator (APSIM; Keatinget al., 2003), and version 4.0 of the CenW forest growth simula-tion model (Kirschbaum, 1999). We denote the pSIMS imple-mentations of these models as parallel DSSAT (pDSSAT), parallelAPSIM (pAPSIM), and parallel CenW (pCenW), respectively.
To date, pSIMS has been used to conduct continental to globalscale simulation experiments ranging in resolution from 3 to 30arcminutes on six crops (maize, wheat, soy, rice, sorghum, andmillet) and one tree species (pinus radiata) (e.g., Elliott et al.
Fig. 1. Schematic of pSIMS workflow. 1) Data ingest from arbitrary file formats and datatyportable site-based .psims.nc format. 3) Specification of a set of weather, soil, and managemTranslation converts the selected .psims.nc file(s) into the custom file format(s) required by mused to manage execution on selected computer(s). 6) Output reformatting extracts model ospecific custom output formats and translates them into a standard output format and thenoutput variables to specified decision-relevant regions and spatial or temporal scales (Sect
Please cite this article in press as: Elliott, J., et al., The parallel systemModelling & Software (2014), http://dx.doi.org/10.1016/j.envsoft.2014.04.
2014a,b, Elliott et al., 2013, Rosenzweig et al., 2014). We haveused pSIMS to conduct simulations with daily weather inputs fromover 40 distinct data products including historical station obser-vations, model reanalysis-based data, global and regional climatemodel outputs, and seasonal forecast model outputs, and for globaland continental scale simulations over both historical and futureperiods under dozens of socio-economic scenarios including fixedpresent day management and various potential climate adaptationpathways.
2. The pSIMS climate data input pipeline
The minimum weather data requirements for site-based cropand climate impact models such as DSSAT, APSIM, and CenW aretypically:
� Daily maximum temperature (degrees C at 2 m above theground surface)
� Dailyminimum temperature (degrees C at 2m above the groundsurface)
� Daily average downward shortwave radiation flux (W/m2
measured at the ground surface)� Total daily Precipitation (mm/day at the ground surface)
Some applications also require daily average wind speeds and ameasure of humidity (typically expressed as daily average dew-point temperature or vapor pressure or the relative humiditymeasured at the time of daily max temperature).
Thousands of observational datasets, model-based reanalyses,and multi-decadal climate model simulation outputs at regional orglobal scales are available to drive impact simulations (see forexample catalog and archive services such as Williams et al., 2009;Rutledge et al., 2006). These datasets are typically stored in stan-dard formats, with substantial standard metadata (Eaton et al.,2010), and are frequently identified by a unique Digital ObjectIdentifier (DOI; Paskin, 2005), making provenance and trackingfeasible. Nevertheless, data must often be remapped before use dueto varying spatial scales (from a few kilometers to several degrees),temporal resolutions (from an hour to a month), and map pro-jections. For some use cases, one or another data product may bedemonstrably superior to all others, but often simulations are re-run with multiple different inputs to obtain a clear understandingof the range of outcomes and uncertainty. For these reasons, inputdata sizes for high-resolution climate impact experiments can belarge and data processing and management can be challenging.
Daily time series of high-resolution climate data from observa-tion, reanalysis, or model simulations provide natural inputs to crop
pes. 2) Standardization reconstitutes each such dataset into one or more files in theent files and one or more climate impact models from the code library (Section 3). 4)odels (Section 4). 5) Simulation runs a separate simulation process per site, with Swiftutputs (dozens or even hundreds of time-series variables from each run) from model-into compressed spatial NetCDF4 files (Section 4). 7) Aggregation masks and aggregatesion 4).
for integrating impact models and sectors (pSIMS), Environmental008
J. Elliott et al. / Environmental Modelling & Software xxx (2014) 1e8 3
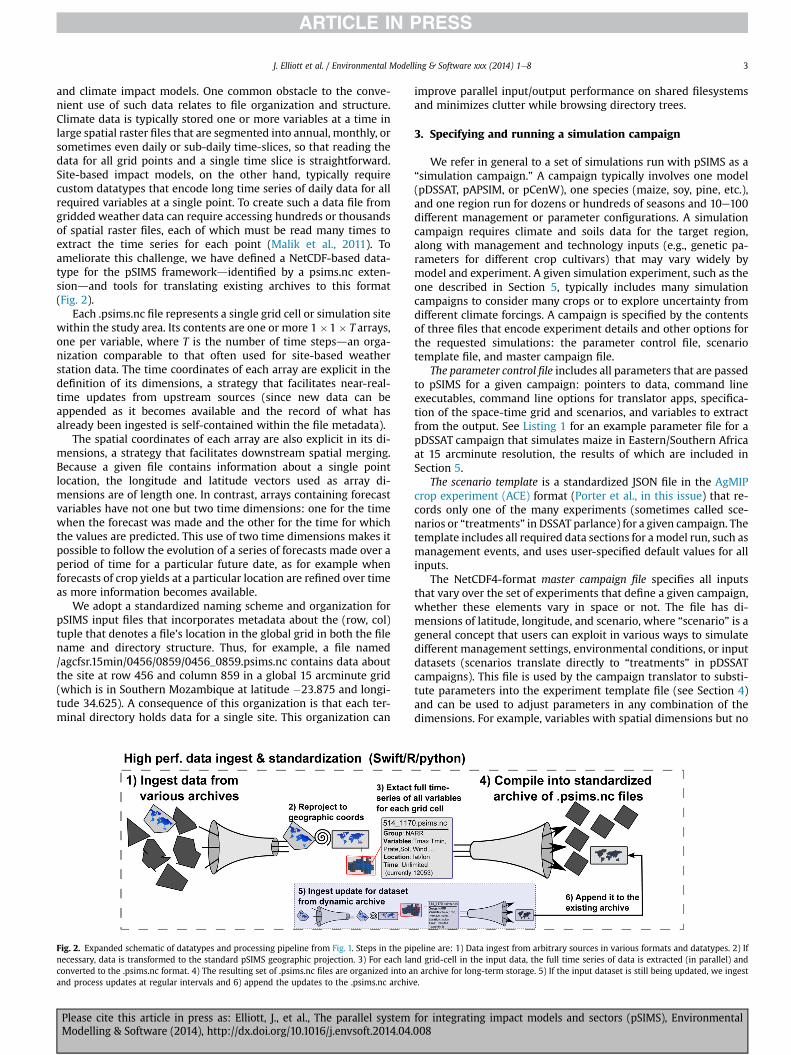
and climate impact models. One common obstacle to the conve-nient use of such data relates to file organization and structure.Climate data is typically stored one or more variables at a time inlarge spatial raster files that are segmented into annual, monthly, orsometimes even daily or sub-daily time-slices, so that reading thedata for all grid points and a single time slice is straightforward.Site-based impact models, on the other hand, typically requirecustom datatypes that encode long time series of daily data for allrequired variables at a single point. To create such a data file fromgridded weather data can require accessing hundreds or thousandsof spatial raster files, each of which must be read many times toextract the time series for each point (Malik et al., 2011). Toameliorate this challenge, we have defined a NetCDF-based data-type for the pSIMS frameworkdidentified by a psims.nc exten-siondand tools for translating existing archives to this format(Fig. 2).
Each .psims.nc file represents a single grid cell or simulation sitewithin the study area. Its contents are one or more 1 �1 � T arrays,one per variable, where T is the number of time stepsdan orga-nization comparable to that often used for site-based weatherstation data. The time coordinates of each array are explicit in thedefinition of its dimensions, a strategy that facilitates near-real-time updates from upstream sources (since new data can beappended as it becomes available and the record of what hasalready been ingested is self-contained within the file metadata).
The spatial coordinates of each array are also explicit in its di-mensions, a strategy that facilitates downstream spatial merging.Because a given file contains information about a single pointlocation, the longitude and latitude vectors used as array di-mensions are of length one. In contrast, arrays containing forecastvariables have not one but two time dimensions: one for the timewhen the forecast was made and the other for the time for whichthe values are predicted. This use of two time dimensions makes itpossible to follow the evolution of a series of forecasts made over aperiod of time for a particular future date, as for example whenforecasts of crop yields at a particular location are refined over timeas more information becomes available.
We adopt a standardized naming scheme and organization forpSIMS input files that incorporates metadata about the (row, col)tuple that denotes a file’s location in the global grid in both the filename and directory structure. Thus, for example, a file named/agcfsr.15min/0456/0859/0456_0859.psims.nc contains data aboutthe site at row 456 and column 859 in a global 15 arcminute grid(which is in Southern Mozambique at latitude �23.875 and longi-tude 34.625). A consequence of this organization is that each ter-minal directory holds data for a single site. This organization can
Fig. 2. Expanded schematic of datatypes and processing pipeline from Fig. 1. Steps in the pinecessary, data is transformed to the standard pSIMS geographic projection. 3) For each laconverted to the .psims.nc format. 4) The resulting set of .psims.nc files are organized into aand process updates at regular intervals and 6) append the updates to the .psims.nc archiv
Please cite this article in press as: Elliott, J., et al., The parallel systemModelling & Software (2014), http://dx.doi.org/10.1016/j.envsoft.2014.04.
improve parallel input/output performance on shared filesystemsand minimizes clutter while browsing directory trees.
3. Specifying and running a simulation campaign
We refer in general to a set of simulations run with pSIMS as a“simulation campaign.” A campaign typically involves one model(pDSSAT, pAPSIM, or pCenW), one species (maize, soy, pine, etc.),and one region run for dozens or hundreds of seasons and 10e100different management or parameter configurations. A simulationcampaign requires climate and soils data for the target region,along with management and technology inputs (e.g., genetic pa-rameters for different crop cultivars) that may vary widely bymodel and experiment. A given simulation experiment, such as theone described in Section 5, typically includes many simulationcampaigns to consider many crops or to explore uncertainty fromdifferent climate forcings. A campaign is specified by the contentsof three files that encode experiment details and other options forthe requested simulations: the parameter control file, scenariotemplate file, and master campaign file.
The parameter control file includes all parameters that are passedto pSIMS for a given campaign: pointers to data, command lineexecutables, command line options for translator apps, specifica-tion of the space-time grid and scenarios, and variables to extractfrom the output. See Listing 1 for an example parameter file for apDSSAT campaign that simulates maize in Eastern/Southern Africaat 15 arcminute resolution, the results of which are included inSection 5.
The scenario template is a standardized JSON file in the AgMIPcrop experiment (ACE) format (Porter et al., in this issue) that re-cords only one of the many experiments (sometimes called sce-narios or “treatments” in DSSAT parlance) for a given campaign. Thetemplate includes all required data sections for amodel run, such asmanagement events, and uses user-specified default values for allinputs.
The NetCDF4-format master campaign file specifies all inputsthat vary over the set of experiments that define a given campaign,whether these elements vary in space or not. The file has di-mensions of latitude, longitude, and scenario, where “scenario” is ageneral concept that users can exploit in various ways to simulatedifferent management settings, environmental conditions, or inputdatasets (scenarios translate directly to “treatments” in pDSSATcampaigns). This file is used by the campaign translator to substi-tute parameters into the experiment template file (see Section 4)and can be used to adjust parameters in any combination of thedimensions. For example, variables with spatial dimensions but no
peline are: 1) Data ingest from arbitrary sources in various formats and datatypes. 2) Ifnd grid-cell in the input data, the full time series of data is extracted (in parallel) andn archive for long-term storage. 5) If the input dataset is still being updated, we ingeste.
for integrating impact models and sectors (pSIMS), Environmental008
Fig. 3. A sketch of the simulation campaign framework (labeled 4e6 in Fig. 1)including the basic translator apps released with pSIMS v0.9 and input/output fil-enames for DSSAT v4.5 and APSIM v7.5. camp2json.py takes user-specified input files(Campaign.nc4 and exp_template.json) to generate generic experiment files (con-taining all necessary management inputs) in the model-agnostic AgMIP JSON format.jsons2[model].py combines these with pre-computed soil profiles in AgMIP format andconverts to model specific input files. psims2[met,WTH].py generates model-specificweather files. Once the impact model is executed, all the raw input and output filesare collected into a compressed archive to ensure future reproducibility, and a userspecified output processing routine (e.g., out2psims.py) is called to extract the desiredvariable subset and convert it to standard psims output format. Finally, once all sim-ulations for a given campaign have completed, the append utility collects each variablein highly-compressed and portable NetCDF v4 files.
J. Elliott et al. / Environmental Modelling & Software xxx (2014) 1e84
scenario dimension are applied to all scenarios at the appropriate(latitude, longitude) pair, while variables with a scenario dimensionbut no spatial dependence are applied uniformly at all locations.
4. The pSIMS codebase
pSIMS runs in a UNIX environment and requires common de-pendencies such as Python and NetCDF operators (NCO; http://nco.sourceforge.net/) alongwith some less common dependencies suchas the Swift parallel scripting language (Section 7). Additionalsoftware packages may be needed to compile or run a particularmodel, such as the Free Pascal Compiler (http://www.freepascal.org/) for CenW and the Boost Cþþ libraries (http://www.boost.org/) and Mono (http://www.mono-project.com) for APSIM.
The pSIMS code base also includes a set of translator apps,software utilities that are used to accomplish a wide variety oftasks within the framework, ranging from simple data reformat-ting to statistical data processing (e.g., applying statistical pertur-bations or bias-corrections to a given input climate dataset). Sometranslator apps are used for offline processing, such as convertingclimate data into psims.nc format, while others are used whileprocessing a campaign. Users can easily incorporate customtranslator apps into the framework using any number of softwarepackages, use multi-model translator utilities developed in theAgMIP framework (Porter et al., in this issue), or use existingutilities distributed with pSIMS. Here we describe some keytranslator types and give examples of apps that are distributedwith pSIMS v0.9 (Fig. 3). We do not attempt an exhaustive ac-counting of offline utilities, but rather focus on the translator appsthat are key to simulation campaign execution and to incorpo-rating new models into the framework.
Campaign translator apps extract parameters from the mastercampaign file and populate the necessary fields in the scenariotemplate file to produce a JSON file (in the standard AgMIP ACEformat) that contains all management and scenario info needed forthe simulation. pSIMS v0.9 is distributed with a single model-agnostic campaign translator utility (camp2json.py).
Experiment translator apps convert from the JSON-based model-agnostic AgMIP experiment format into the model-specific file(s)that are needed for a simulation. Besides this “experiment” filegenerated by the campaign translator, it also pulls in the relevantsoil data (in generic ACE soil data format) from the pre-computedarchive. pSIMS v0.9 is distributed with customized python appsfor DSSAT and APSIM formats (jsons2dssat.py and jsons2apsim.py)which are closely related to the AgMIP QUADUI data translators (itwas convenient in early work to create our own versions, but infuture releases we expect to support the native AgMIP family ofexperiment translators as well).
Weather translator apps convert .psims.nc climate files to themodel-specific format needed for a particular simulation, con-verting units, deriving combined variables, and (if requested) per-turbing or bias-correcting the data series in the psims.nc file.
Output translator apps convert data from the custom ASCIIoutput formats that the models produce into standard site-basedNetCDF files that use the psims.nc standards. Each file contains allthe user-requested variables (as defined in the parameter file, seeListing 1 for example) for a given point in a compact self-describingfile that can be conveniently merged into spatial NetCDF files.
5. A multi-model multi-scale example assessment study withpDSSAT and pAPSIM
To demonstrate how pSIMS facilitates multi-model multi-scaleassessments of crop growth and climate impacts, we describefour pSIMS campaigns that we conducted for maize in Africa from
Please cite this article in press as: Elliott, J., et al., The parallel systemModelling & Software (2014), http://dx.doi.org/10.1016/j.envsoft.2014.04.
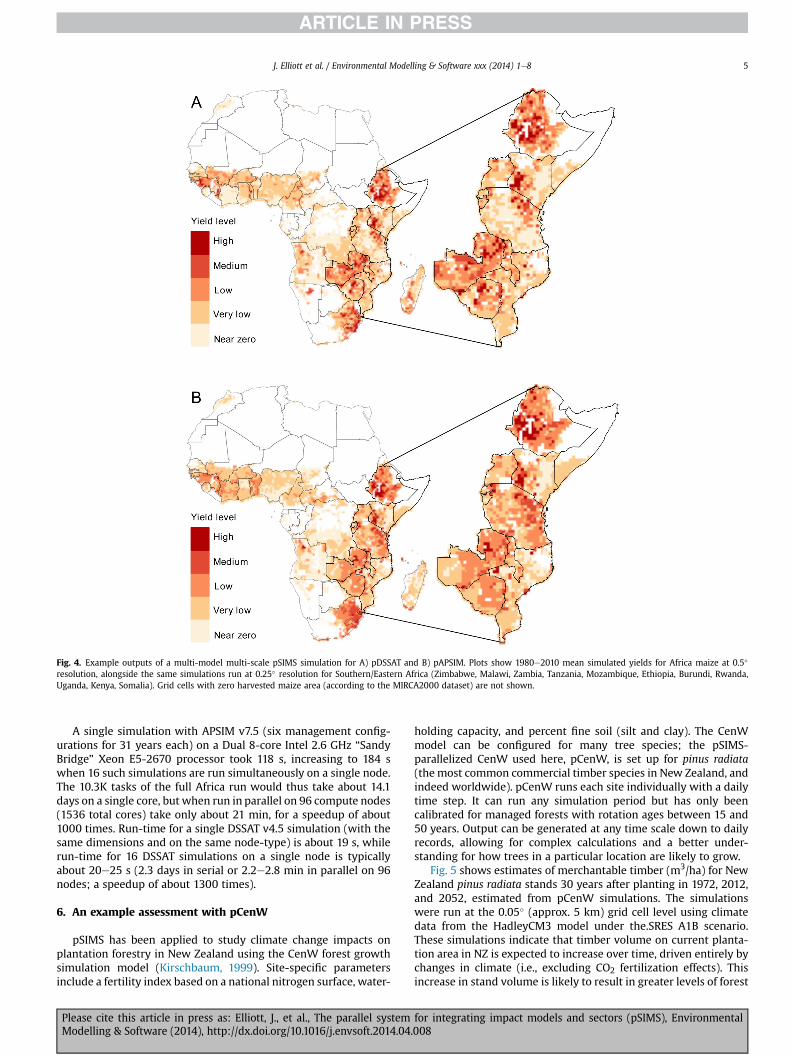
1980 to 2010 (Fig. 4) using climate forcings from AgCFSR. The fourcampaigns involve two models (pDSSAT and pAPSIM), eachsimulating a) the full continent at 0.5� spatial resolution (10,301grid cells for 30 years) and b) the Southern/Eastern Africancountries of Zimbabwe, Malawi, Zambia, Tanzania, Mozambique,Ethiopia, Burundi, Rwanda, Uganda, Kenya, and Somalia at 0.25�
spatial resolution (7778 grid cells, again for 30 years). Thesecampaigns are small compared to long-duration 0.5� globalclimate impact runs that we have performed (56,537 land gridcells, 150 years), but convey the versatility of the framework. Allruns were conducted with the same fertilizer inputs, generatedby combining organic and chemical fertilizer data from threesources (Mueller et al., 2012; Potter et al., 2010; Foley et al., 2011)and similar sowing dates (pAPSIM uses a fixed sowing date eachyear while pDSSAT has a variable planting rule confined to aperiod around the observed value) based on the SAGE (Sackset al., 2010) and MIRCA2000 (Portmann et al., 2010) crop calen-dar datasets (extrapolated globally using environmentalconsiderations).
We match cultivar coefficients as closely as possible betweenthe twomodels andmap them to the same spatial grid to reproduceobserved maturity dates from crop calendars. For this purpose, wedefined 10 generic hybrid and 10 generic open-pollinated cultivarsin consultation with crop model experts, using open pollinatedvariants for grid cells dominated by subsistence maize farming,according to You and Wood (2006). We distribute these cultivardefinitions with the pSIMS software.
for integrating impact models and sectors (pSIMS), Environmental008
Fig. 4. Example outputs of a multi-model multi-scale pSIMS simulation for A) pDSSAT and B) pAPSIM. Plots show 1980e2010 mean simulated yields for Africa maize at 0.5�
resolution, alongside the same simulations run at 0.25� resolution for Southern/Eastern Africa (Zimbabwe, Malawi, Zambia, Tanzania, Mozambique, Ethiopia, Burundi, Rwanda,Uganda, Kenya, Somalia). Grid cells with zero harvested maize area (according to the MIRCA2000 dataset) are not shown.
J. Elliott et al. / Environmental Modelling & Software xxx (2014) 1e8 5
A single simulation with APSIM v7.5 (six management config-urations for 31 years each) on a Dual 8-core Intel 2.6 GHz “SandyBridge” Xeon E5-2670 processor took 118 s, increasing to 184 swhen 16 such simulations are run simultaneously on a single node.The 10.3K tasks of the full Africa run would thus take about 14.1days on a single core, but when run in parallel on 96 compute nodes(1536 total cores) take only about 21 min, for a speedup of about1000 times. Run-time for a single DSSAT v4.5 simulation (with thesame dimensions and on the same node-type) is about 19 s, whilerun-time for 16 DSSAT simulations on a single node is typicallyabout 20e25 s (2.3 days in serial or 2.2e2.8 min in parallel on 96nodes; a speedup of about 1300 times).
6. An example assessment with pCenW
pSIMS has been applied to study climate change impacts onplantation forestry in New Zealand using the CenW forest growthsimulation model (Kirschbaum, 1999). Site-specific parametersinclude a fertility index based on a national nitrogen surface, water-
Please cite this article in press as: Elliott, J., et al., The parallel systemModelling & Software (2014), http://dx.doi.org/10.1016/j.envsoft.2014.04.
holding capacity, and percent fine soil (silt and clay). The CenWmodel can be configured for many tree species; the pSIMS-parallelized CenW used here, pCenW, is set up for pinus radiata(the most common commercial timber species in New Zealand, andindeed worldwide). pCenW runs each site individually with a dailytime step. It can run any simulation period but has only beencalibrated for managed forests with rotation ages between 15 and50 years. Output can be generated at any time scale down to dailyrecords, allowing for complex calculations and a better under-standing for how trees in a particular location are likely to grow.
Fig. 5 shows estimates of merchantable timber (m3/ha) for NewZealand pinus radiata stands 30 years after planting in 1972, 2012,and 2052, estimated from pCenW simulations. The simulationswere run at the 0.05� (approx. 5 km) grid cell level using climatedata from the HadleyCM3 model under the.SRES A1B scenario.These simulations indicate that timber volume on current planta-tion area in NZ is expected to increase over time, driven entirely bychanges in climate (i.e., excluding CO2 fertilization effects). Thisincrease in stand volume is likely to result in greater levels of forest
for integrating impact models and sectors (pSIMS), Environmental008
Fig. 5. pCenW estimate of merchantable timber volume (m3/ha) for New Zealand pinus radiata stands 30 years after planting in 1972, 2012, and 2052, under climate model HadCM3and scenario SRES A1B.
J. Elliott et al. / Environmental Modelling & Software xxx (2014) 1e86
carbon sequestration for the country overall, though economicadaptations to faster tree growth (such as a reduction in theoptimal harvest age) may affect these trends.
Fig. 6. Typical Swift configuration for pSIMS execution.
7. Use of Swift parallel scripting
Each pSIMS simulation campaign typically requires the execu-tion of O(104e105) small serial jobs, one per grid cell, each of whichuses one CPU core for anywhere from 30 s to many minutes. TheSwift parallel scripting language (Wilde et al., 2009) makes itstraightforward to write and execute pSIMS runs, using highlyportable and system-independent scripts such as the example inListing 2. Space does not permit a detailed description of Listing 2,but in brief, it 1) defines a machine-independent interface to themodel executable, 2) loads a list of geographic locations on whichthat executable is to be run, and 3) defines a set of simulations atthese locations.
The Swift language is implicitly parallel, high-level, and func-tional. It automates the difficult and science-distracting tasks ofdistributing tasks and data across multiple remote systems, and ofretrying failing tasks and restarting failing workflow runs. Its run-time can manage efficiently the execution of many small single-core or multi-core jobs, dynamically packing those jobs tightlyonto multiple computing nodes to maximize system utilization.Swift automates node acquisition; inter-job data dependencies;throttling; scheduling and dispatch of work to cores; and retry offailing jobs.
The key to Swift’s ability to execute large numbers of small tasksefficiently on large parallel computers is its use of a two-levelscheduling strategy. Internally, Swift launches a pilot job called a“coaster” on each nodewithin a resource pool (Hategan et al., 2011).The Swift runtime then manages the dispatch of application in-vocations, plus any data that these tasks require, to those coasters,which manage their execution on compute nodes. As tasks finish,Swift schedules more work to those nodes, achieving high CPUutilization even for fine-grained workloads. Individual tasks can beserial, OpenMP, MPI, or other parallel applications. Swift makescomputing location independent, allowing us to run pSIMS on a
Please cite this article in press as: Elliott, J., et al., The parallel systemModelling & Software (2014), http://dx.doi.org/10.1016/j.envsoft.2014.04.
variety of grids, supercomputers, clouds, and clusters, with thesame scripts used on multiple distributed sites and diverse re-sources. Fig. 6 shows a typical execution scenario, inwhich pSIMS isrun across two University of Chicago campus resources: the UChi-cago Campus Computing Cooperative (UC3) (Bryant, 2012) and theUChicago Research Computing Center (UCRCC).
We have run pSIMS on UC3, Open Science Grid (Pordes et al.,2007), and UCRCC; the XSEDE clusters Ranger and its successorStampede; the Amazon Elastic Compute Cloud (EC2) and severalother clusters and supercomputers. In production mode (i.e.,excluding testing and prototype stages) pSIMS has been used formore than 100 large-scale simulation campaigns of DSSAT, CenW,and APSIM. These campaigns have already totaled over 5.6 millionindividual DSSAT runs, each of 30e150 years and including 10e100independent scenarios, and a growing number of runs with othermodels such as CenW and APSIM (Table 1).
8. Discussion
The parallel System for Integrating Impacts Models and Sectors(pSIMS) is a new framework for efficient implementation of large-
for integrating impact models and sectors (pSIMS), Environmental008
Listing 1. Annotated example parameter file for a pDSSAT campaign for maize in Southern/Eastern Africa.
Listing 2. Annotated pSIMS Swift script.
J. Elliott et al. / Environmental Modelling & Software xxx (2014) 1e8 7
scale assessments of climate vulnerabilities, impacts, and adapta-tions across multiple sectors and at unprecedented scales. pSIMSincludes an extensible, high-performance data ingest and pro-cessing pipeline that generates a standardized collection of man-agement, environmental, and climate datasets based on portableand efficient datatypes, as well as a code base to enable large-scale,high-resolution simulations of the impacts of changing climate onprimary production (agriculture, livestock, and forestry) usingmany site-based climate impact models.
Please cite this article in press as: Elliott, J., et al., The parallel systemModelling & Software (2014), http://dx.doi.org/10.1016/j.envsoft.2014.04.
These new capabilities are enabled by the use of high-performance computing, which in turn is harnessed by the Swiftparallel scripting language. The pSIMS framework also containsdata translation tools that can handle the input and output formatsused in various models; specifications for integrating translatorsdeveloped in AgMIP; and tools for aggregation and scaling ofsimulation outputs to arbitrary spatial and temporal scales relevantfor decision support, validation, and downstream model coupling.This framework has been used for high-resolution crop yield and
for integrating impact models and sectors (pSIMS), Environmental008
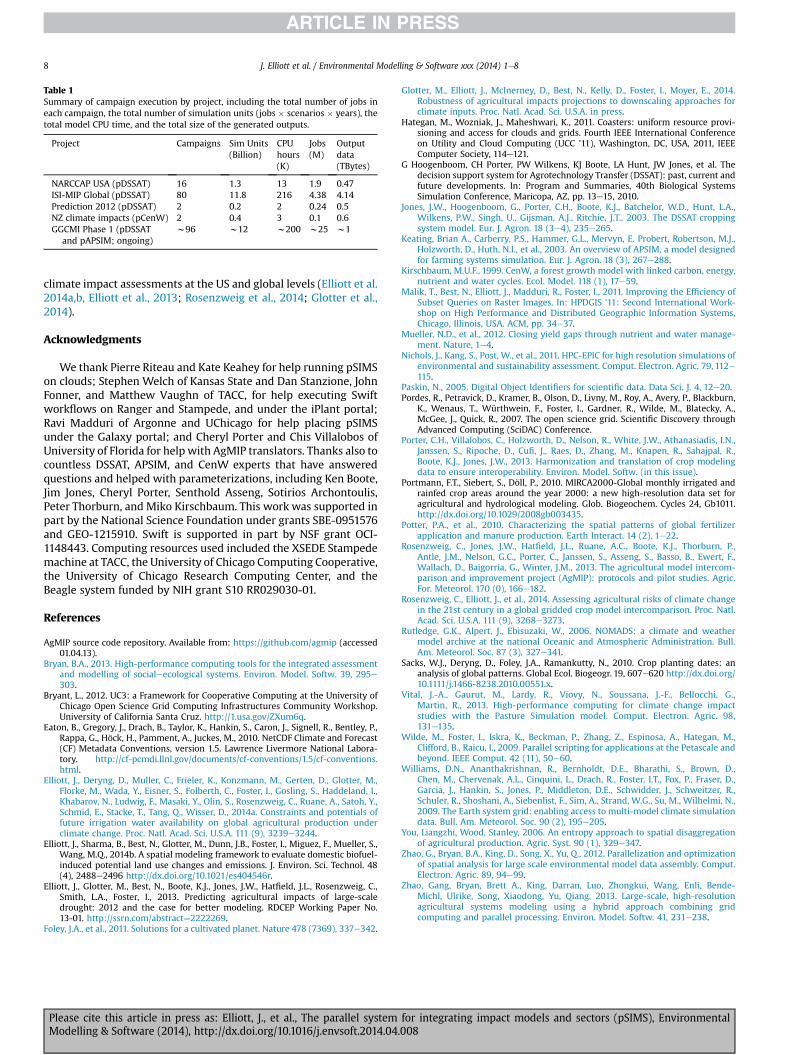
Table 1Summary of campaign execution by project, including the total number of jobs ineach campaign, the total number of simulation units (jobs � scenarios � years), thetotal model CPU time, and the total size of the generated outputs.
J. Elliott et al. / Environmental Modelling & Software xxx (2014) 1e88
climate impact assessments at the US and global levels (Elliott et al.2014a,b, Elliott et al., 2013; Rosenzweig et al., 2014; Glotter et al.,2014).
Acknowledgments
We thank Pierre Riteau and Kate Keahey for help running pSIMSon clouds; Stephen Welch of Kansas State and Dan Stanzione, JohnFonner, and Matthew Vaughn of TACC, for help executing Swiftworkflows on Ranger and Stampede, and under the iPlant portal;Ravi Madduri of Argonne and UChicago for help placing pSIMSunder the Galaxy portal; and Cheryl Porter and Chis Villalobos ofUniversity of Florida for help with AgMIP translators. Thanks also tocountless DSSAT, APSIM, and CenW experts that have answeredquestions and helped with parameterizations, including Ken Boote,Jim Jones, Cheryl Porter, Senthold Asseng, Sotirios Archontoulis,Peter Thorburn, and Miko Kirschbaum. This work was supported inpart by the National Science Foundation under grants SBE-0951576and GEO-1215910. Swift is supported in part by NSF grant OCI-1148443. Computing resources used included the XSEDE Stampedemachine at TACC, the University of Chicago Computing Cooperative,the University of Chicago Research Computing Center, and theBeagle system funded by NIH grant S10 RR029030-01.
References
AgMIP source code repository. Available from: https://github.com/agmip (accessed01.04.13).
Bryan, B.A., 2013. High-performance computing tools for the integrated assessmentand modelling of socialeecological systems. Environ. Model. Softw. 39, 295e303.
Bryant, L., 2012. UC3: a Framework for Cooperative Computing at the University ofChicago Open Science Grid Computing Infrastructures Community Workshop.University of California Santa Cruz. http://1.usa.gov/ZXum6q.
Eaton, B., Gregory, J., Drach, B., Taylor, K., Hankin, S., Caron, J., Signell, R., Bentley, P.,Rappa, G., Höck, H., Pamment, A., Juckes, M., 2010. NetCDF Climate and Forecast(CF) Metadata Conventions, version 1.5. Lawrence Livermore National Labora-tory. http://cf-pcmdi.llnl.gov/documents/cf-conventions/1.5/cf-conventions.html.
Elliott, J., Deryng, D., Muller, C., Frieler, K., Konzmann, M., Gerten, D., Glotter, M.,Florke, M., Wada, Y., Eisner, S., Folberth, C., Foster, I., Gosling, S., Haddeland, I.,Khabarov, N., Ludwig, F., Masaki, Y., Olin, S., Rosenzweig, C., Ruane, A., Satoh, Y.,Schmid, E., Stacke, T., Tang, Q., Wisser, D., 2014a. Constraints and potentials offuture irrigation water availability on global agricultural production underclimate change. Proc. Natl. Acad. Sci. U.S.A. 111 (9), 3239e3244.
Elliott, J., Sharma, B., Best, N., Glotter, M., Dunn, J.B., Foster, I., Miguez, F., Mueller, S.,Wang, M.Q., 2014b. A spatial modeling framework to evaluate domestic biofuel-induced potential land use changes and emissions. J. Environ. Sci. Technol. 48(4), 2488e2496 http://dx.doi.org/10.1021/es404546r.
Elliott, J., Glotter, M., Best, N., Boote, K.J., Jones, J.W., Hatfield, J.L., Rosenzweig, C.,Smith, L.A., Foster, I., 2013. Predicting agricultural impacts of large-scaledrought: 2012 and the case for better modeling. RDCEP Working Paper No.13-01. http://ssrn.com/abstract¼2222269.
Foley, J.A., et al., 2011. Solutions for a cultivated planet. Nature 478 (7369), 337e342.
Please cite this article in press as: Elliott, J., et al., The parallel systemModelling & Software (2014), http://dx.doi.org/10.1016/j.envsoft.2014.04.
Glotter, M., Elliott, J., McInerney, D., Best, N., Kelly, D., Foster, I., Moyer, E., 2014.Robustness of agricultural impacts projections to downscaling approaches forclimate inputs. Proc. Natl. Acad. Sci. U.S.A. in press.
Hategan, M., Wozniak, J., Maheshwari, K., 2011. Coasters: uniform resource provi-sioning and access for clouds and grids. Fourth IEEE International Conferenceon Utility and Cloud Computing (UCC ’11), Washington, DC, USA, 2011, IEEEComputer Society, 114e121.
G Hoogenboom, CH Porter, PW Wilkens, KJ Boote, LA Hunt, JW Jones, et al. Thedecision support system for Agrotechnology Transfer (DSSAT): past, current andfuture developments. In: Program and Summaries, 40th Biological SystemsSimulation Conference, Maricopa, AZ, pp. 13e15, 2010.
Keating, Brian A., Carberry, P.S., Hammer, G.L., Mervyn, E. Probert, Robertson, M.J.,Holzworth, D., Huth, N.I., et al., 2003. An overview of APSIM, a model designedfor farming systems simulation. Eur. J. Agron. 18 (3), 267e288.
Kirschbaum, M.U.F., 1999. CenW, a forest growth model with linked carbon, energy,nutrient and water cycles. Ecol. Model. 118 (1), 17e59.
Malik, T., Best, N., Elliott, J., Madduri, R., Foster, I., 2011. Improving the Efficiency ofSubset Queries on Raster Images. In: HPDGIS ’11: Second International Work-shop on High Performance and Distributed Geographic Information Systems,Chicago, Illinois, USA. ACM, pp. 34e37.
Mueller, N.D., et al., 2012. Closing yield gaps through nutrient and water manage-ment. Nature, 1e4.
Nichols, J., Kang, S., Post, W., et al., 2011. HPC-EPIC for high resolution simulations ofenvironmental and sustainability assessment. Comput. Electron. Agric. 79, 112e115.
Paskin, N., 2005. Digital Object Identifiers for scientific data. Data Sci. J. 4, 12e20.Pordes, R., Petravick, D., Kramer, B., Olson, D., Livny, M., Roy, A., Avery, P., Blackburn,
K., Wenaus, T., Würthwein, F., Foster, I., Gardner, R., Wilde, M., Blatecky, A.,McGee, J., Quick, R., 2007. The open science grid. Scientific Discovery throughAdvanced Computing (SciDAC) Conference.
Porter, C.H., Villalobos, C., Holzworth, D., Nelson, R., White, J.W., Athanasiadis, I.N.,Janssen, S., Ripoche, D., Cufi, J., Raes, D., Zhang, M., Knapen, R., Sahajpal, R.,Boote, K.J., Jones, J.W., 2013. Harmonization and translation of crop modelingdata to ensure interoperability. Environ. Model. Softw. (in this issue).
Portmann, F.T., Siebert, S., Döll, P., 2010. MIRCA2000-Global monthly irrigated andrainfed crop areas around the year 2000: a new high-resolution data set foragricultural and hydrological modeling. Glob. Biogeochem. Cycles 24, Gb1011.http://dx.doi.org/10.1029/2008gb003435.
Potter, P.A., et al., 2010. Characterizing the spatial patterns of global fertilizerapplication and manure production. Earth Interact. 14 (2), 1e22.
Rosenzweig, C., Jones, J.W., Hatfield, J.L., Ruane, A.C., Boote, K.J., Thorburn, P.,Antle, J.M., Nelson, G.C., Porter, C., Janssen, S., Asseng, S., Basso, B., Ewert, F.,Wallach, D., Baigorria, G., Winter, J.M., 2013. The agricultural model intercom-parison and improvement project (AgMIP): protocols and pilot studies. Agric.For. Meteorol. 170 (0), 166e182.
Rosenzweig, C., Elliott, J., et al., 2014. Assessing agricultural risks of climate changein the 21st century in a global gridded crop model intercomparison. Proc. Natl.Acad. Sci. U.S.A. 111 (9), 3268e3273.
Rutledge, G.K., Alpert, J., Ebisuzaki, W., 2006. NOMADS: a climate and weathermodel archive at the national Oceanic and Atmospheric Administration. Bull.Am. Meteorol. Soc. 87 (3), 327e341.
Sacks, W.J., Deryng, D., Foley, J.A., Ramankutty, N., 2010. Crop planting dates: ananalysis of global patterns. Global Ecol. Biogeogr. 19, 607e620 http://dx.doi.org/10.1111/j.1466-8238.2010.00551.x.
Vital, J.-A., Gaurut, M., Lardy, R., Viovy, N., Soussana, J.-F., Bellocchi, G.,Martin, R., 2013. High-performance computing for climate change impactstudies with the Pasture Simulation model. Comput. Electron. Agric. 98,131e135.
Wilde, M., Foster, I., Iskra, K., Beckman, P., Zhang, Z., Espinosa, A., Hategan, M.,Clifford, B., Raicu, I., 2009. Parallel scripting for applications at the Petascale andbeyond. IEEE Comput. 42 (11), 50e60.
Williams, D.N., Ananthakrishnan, R., Bernholdt, D.E., Bharathi, S., Brown, D.,Chen, M., Chervenak, A.L., Cinquini, L., Drach, R., Foster, I.T., Fox, P., Fraser, D.,Garcia, J., Hankin, S., Jones, P., Middleton, D.E., Schwidder, J., Schweitzer, R.,Schuler, R., Shoshani, A., Siebenlist, F., Sim, A., Strand, W.G., Su, M., Wilhelmi, N.,2009. The Earth system grid: enabling access to multi-model climate simulationdata. Bull. Am. Meteorol. Soc. 90 (2), 195e205.
You, Liangzhi, Wood, Stanley, 2006. An entropy approach to spatial disaggregationof agricultural production. Agric. Syst. 90 (1), 329e347.
Zhao, G., Bryan, B.A., King, D., Song, X., Yu, Q., 2012. Parallelization and optimizationof spatial analysis for large scale environmental model data assembly. Comput.Electron. Agric. 89, 94e99.
Zhao, Gang, Bryan, Brett A., King, Darran, Luo, Zhongkui, Wang, Enli, Bende-Michl, Ulrike, Song, Xiaodong, Yu, Qiang, 2013. Large-scale, high-resolutionagricultural systems modeling using a hybrid approach combining gridcomputing and parallel processing. Environ. Model. Softw. 41, 231e238.
for integrating impact models and sectors (pSIMS), Environmental008