24
1 SIA ANALYST/MEDIA BRIEFING 1H FY2014/15 Results 07 November 2014 THE PARENT AIRLINE 1H FY2014/15 RESULTS

1
SIA ANALYST/MEDIA BRIEFING 1H FY2014/15 Results
07 November 2014
THE PARENT AIRLINE1H FY2014/15
RESULTS

2
THE PARENT AIRLINE COMPANY OPERATING PERFORMANCE – 2Q & 1H FY14/15
Slide 3
25,016Revenue Pax-KM(million)
2Q/14
-0.2
% Change
81.9Passenger Load Factor (%)
+0.8 pt
30,562Available Seat-KM (million)
-1.1 -0.260,825
+0.2 pt79.8
+0.148,516
1H/14%
Change
Slide 4
Passenger Yield(¢/pkm)
Passenger Unit Cost(¢/ask)
Passenger Breakeven Load Factor (%)
10.9 -0.9
9.0 -1.1
82.6 -0.1 pt
THE PARENT AIRLINE COMPANY OPERATING PERFORMANCE – 2Q & 1H FY14/15
2Q/14%
Change
Passenger Unit Ex-Fuel Cost (¢/ask)
5.1 -
-3.38.8
-0.910.9
-2.0 pts80.7
1H/14%
Change
-3.94.9

3
THE PARENT AIRLINE COMPANY RESULTS – 2Q & 1H FY14/15
Slide 5
4.3Operating Profit Margin (%)
1.3 pts
41138Operating Profit 42
3,084
(62)
Total Expenditure
1,175- Fuel Cost18- Fuel Hedging
Loss/(Gain)1,891- Ex-fuel Cost
41
105
(2)
1.3
8.3n.m.
(0.1)
3,222Total Revenue
2Q/14$million
-
Better/(Worse)
$million %
-
(3)183
1486,048
(151)6,231
1H/14$million
982,3531(10)
493,705
Better/(Worse)
$million %
-2.9
(1.6)
2.4
4.07.9
1.3
(2.4)
THE PARENT AIRLINE COMPANY OPERATING PERFORMANCE
0
68
72
76
80
84
88
1H 10/11 1H 11/12 1H 12/13 1H 13/14
Passenger Load FactorBreakeven Load Factor
(%)
79.4
Slide 6
77.579.6
1H 14/15
79.6 79.8

4
THE PARENT AIRLINE COMPANY OPERATING PERFORMANCE
75.4
78.079.8
0
68
72
76
80
84
88
1H 10/11 1H 11/12 1H 12/13 1H 13/14
Passenger Load FactorBreakeven Load Factor
(%)
79.4
Slide 7
77.579.6
1H 14/15
79.6
82.7
79.8
80.7
THE PARENT AIRLINE COMPANY OPERATING PERFORMANCE
75.4
78.079.8
0
68
72
76
80
84
88
1H 10/11 1H 11/12 1H 12/13 1H 13/14
Passenger Load FactorBreakeven Load Factor
(%)
79.4
4.0 -0.5-0.2
Slide 8
77.579.6
1H 14/15
79.6
82.7-3.1
79.8
80.7-0.9

5
THE PARENT AIRLINE COMPANY MONTHLY PASSENGER YIELD
Slide 9
10.8
11.1
11.2
11.411.6
11.311.3
11.611.5
11.411.2
11.0
11.4
10.9
11.2
10.8
11.3
11.1
10.9
11.1 11.311.311.1
10
11
12
Apr May Jun Jul Aug Sep Oct Nov Dec Jan Feb Mar
2012-13 2013-14 2014-15
¢/pkm
11.1
10.810.7 10.910.7
11.2
THE PARENT AIRLINE COMPANY COST COMPOSITION – 1H FY14/15
Slide 10
LPO* Charges 5.1% (+0.2% pt)
Others 10.1% (-0.3% pt)
Fuel Cost Post Hedging
38.7% (-0.7% pt)AMO Costs 5.4% (-)
Passenger Costs5.7% (+0.3% pt)
Handling Charges 7.3% (+0.2% pt)
Staff12.9% (-0.1% pt)
Aircraft Depreciation & Lease Rentals
14.8% (+0.4% pt)*Landing, Parking and Overflying

6
THE PARENT AIRLINE COMPANY TOP EXPENDITURE ITEMS – 1H FY14/15
Slide 11
6,195.7
0
6,000
6,100
6,150
6,200
H1 FY13/14
-99.1 (-4.1%)
Fuel after
hedging
Lower net fuel
cost
-6.9 (-2.1%)
AMO Cost
+11.5 (+44.1%)
Exchange
Higher revaluation
and hedging
loss
-34.6 (-1.5%)
Others
+8.1 (+2.4%)
Passenger Cost
6,048.0
H1 FY14/15
-147.7(-2.4%)
Composition of decrease in Operating Expenditure
$M
-26.7 (-3.3%)
Staff Cost
THE PARENT AIRLINE COMPANY FUEL PRICE AND EXPENDITURE - TREND
Slide 12
9690 90
10094
135
134124
121 123 124 121
123
80
93 90
136
132120
126 127 126 124
122
8885
400
600
800
1,000
1,200
1,400
1,600
1,800
2,000
0102030405060708090100110120130140150160
Fuel Cost after hedging
Fuel Price before hedging
Fuel Price after hedging
2Q 3Q 4Q 1Q 2Q 3Q 4Q 1Q 2Q 3Q 4Q 1Q 2Q 3Q 4Q 1Q 2Q 3Q 4Q 1Q 2Q
2009-10 2010-11 2011-12 2012-13 2013-14 2014-15
($ million)
1,26
8
851
85996
0
939
899
1,15
0
1,15
6
1,17
4
1,23
6
1,20
6
1,19
4

7
THE PARENT AIRLINE COMPANY FUEL EXPENDITURE – 1H FY14/15
Slide 13
2,442
2300
2400
2500
1HFY13/14
$M
2,343
1HFY14/15
-99(-4.1%)
-75
Volume
Lowervolume uplifted
-1
Hedging
Higher hedging gain vs
last year-9
Price
Lower weighted average
fuel price-14
Exchange
WeakerUS Dollar
THE GROUP1H FY2014/15
RESULTS

8
($ million)2013/14 2014/15
GROUP REVENUE – 1H FY2014/15
3,840
3,682
0
2,750
3,000
3,250
3,500
3,750
4,000
Q1 Q2
Year-on-Year$154M-2.0%
Half Year Revenue$7,587M-$158m
-4.1%
Slide 15
3,901 3,905 +$4m+0.1%
2013/14 2014/15
GROUP EXPENDITURE– 1H FY2014/15
3,7583,643
Q1 Q2
($ million)
0
2,750
3,000
3,250
3,500
3,750
4,000
-$115m-3.1%
Slide 16
3,814 3,773 -$41m-1.1%
Year-on-Year$156M-2.1%
Half Year Expenditure
$7,416M

9
2013/14 2014/15
GROUP OPERATING PROFIT– 1H FY2014/15
82
39
0
25
50
75
100
125
150
Q1 Q2
Half Year Op Profit$171M
Year-on-Year$2M
+1.2%
($ million)
-$43m-52.4%
Slide 17
87
132+$45m+51.7%
CONTRIBUTION TO GROUP OPERATING PROFIT – 1H FY14/15 ($ million)
5
183
1H 1415
(34)
37
SilkAir
Singapore Airlines
SIA Cargo
SIA Engineering
22
186
(71)
56
1H 13/14
17-
3-
37+
19-
Change
Slide 18
77.3-
1.6-
52.1+
33.9-
% Change

10
($ million)2013/14 2014/15
GROUP NET PROFIT– 1H FY2014/15
122
35
0
50
100
150
200
Q1 Q2
-$87M-71.3%
Half Year Net Profit
$126M
Year-on-Year$157M -55.5%
Slide 19
161
91
-$70M-43.5%
($ million)
GROUP NET PROFIT – 1H FY2014/15
0
50
100
150
200
250
300
1H FY13/14
Associates Operating Profit
Interestand
Others
283
1H FY14/15
126
-157-55.5%
Slide 20
AircraftDisposal
ExceptionalItems
-154
Share of losses from associates
against profits last
year
-32
Exceptional items
+2
Higher operating
profit
+31
Higher gain on
disposal of aircraft
-4.0
Others

11
Slide 21
10.05.0Interim Dividend Per Share (¢)
1.251.09EBITDAR Per Share ($)
1H 13141H 1415
11.2610.96Net Asset Value Per Share ($)
At 31 Mar 14At 30 Sep 14
24.010.7Earnings Per Share (¢)
GROUP RESULTS – 1H FY2014/15
- 4
- 1
OUT: Decommissioned B777-200
OUT: Decommissioned A330-300
FLEET DEVELOPMENT - SIA
Slide 22
105Operating Fleet at 30 September 14
No. of Aircraft
105Operating Fleet at 31 March 15
+ 2IN: Delivery of A330-300+ 3Delivery of B777-300ER

12
- 1
- 1
OUT: Decommissioned A320-200
Decommissioned A319-100
FLEET DEVELOPMENT - SLK
Slide 23
26Operating Fleet at 30 September 14
No. of Aircraft
27Operating Fleet at 31 March 15
+ 3IN: Delivery of B737-800
FLEET DEVELOPMENT - SCOOT
Slide 24
6Operating Fleet at 30 September 14
No. of Aircraft
+ 2IN: Delivery of B787-9
- 2OUT: Decommissioned B777-200
6Operating Fleet at 31 March 15

13
GROUP CAPITAL EXPENDITURE
FY15/16 FY16/17 FY17/18 FY18/19 FY19/20
Aircraft 2,750 2,900 4,150 4,200 3,800
Other Assets 200 200 150 100 100
Total 2,950 3,100 4,300 4,300 3,900
Slide 25
GROUP FUEL HEDGING POSITION
Slide 26
For the period Oct 14 to Mar 15
Jet Fuel Brent
Percentage hedged (%)
65.3 0.8
Average hedged price (USD/BBL - Jet Fuel)
116 100

14
BUSINESS OUTLOOK FOR
FY2014/15
OUTLOOK
Intense competition
Geopolitical factors
Economic risks
Slide 28

15
MEETING THECHALLENGES
CHALLENGES
Geography Additional Hubs
LCC Competition
Group Portfolio
FSC Competition
NetworkServiceProduct
Slide 30

16
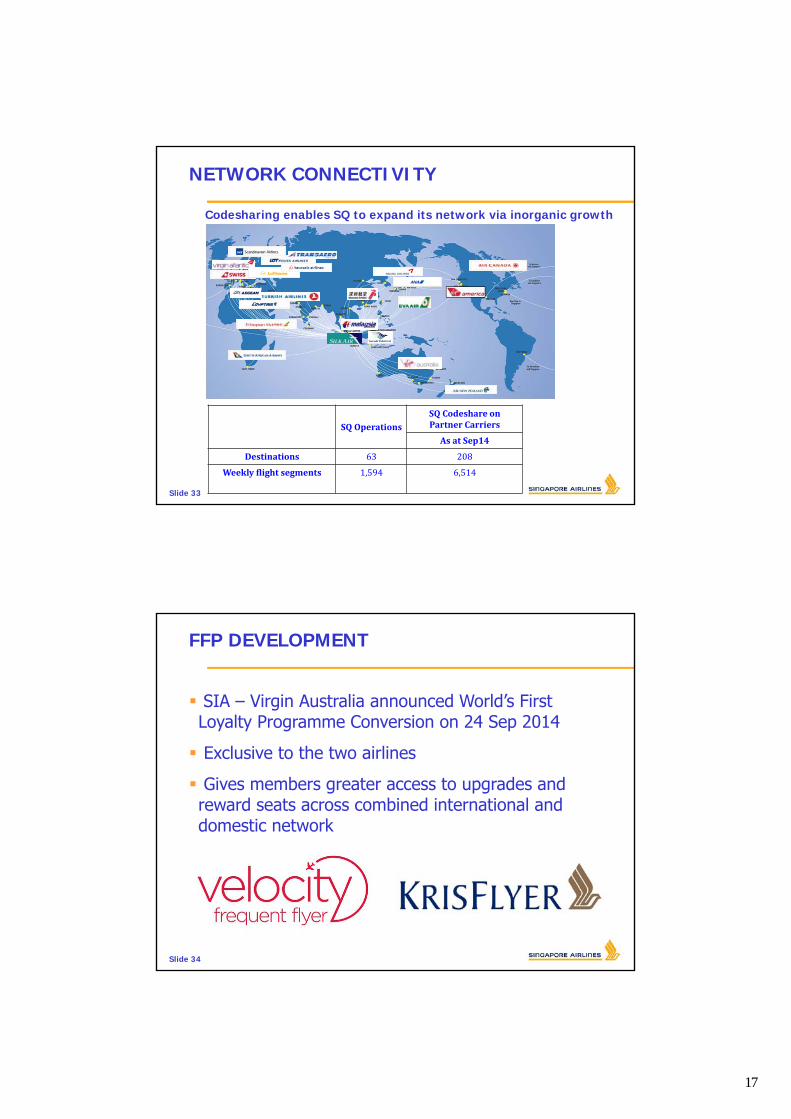
NETWORK CONNECTIVITY
Slide 31
SilkAir Projected capacity growth of 7% for FY14-15 over FY13-14
New destinations & frequency increase for existing destinations
4 new destinations: Kalibo, Mandalay, Hangzhou, Bali
NETWORK CONNECTIVITY
Air New Zealand SQ – NZ alliance to launch on 6 Jan 2015
NZ to operate daily AKL-SIN vv on B772
SQ to operate daily SIN-AKL vv on A380 and daily SIN-CHC vv on B772
20% capacity increase between Singapore and New Zealand
Turkish Airlines Major expansion of codeshare ties commencing May 14
Connecting passengers between SQ and TK increased more than 13,000 in the period Jun 14 – Sep 14, year-on-year
Slide 32
17
NETWORK CONNECTIVITY
Slide 33
SQOperationsSQCodeshareonPartnerCarriers
AsatSep14
Destinations 63 208
Weeklyflightsegments 1,594 6,514
Codesharing enables SQ to expand its network via inorganic growth
SIA – Virgin Australia announced World’s First Loyalty Programme Conversion on 24 Sep 2014
Exclusive to the two airlines
Gives members greater access to upgrades and reward seats across combined international and domestic network
FFP DEVELOPMENT
Slide 34

18
KrisFlyer Spree− Launched 19 Jun 2014
− Online platform where memberscan earn miles when they shop
− Attract new KF members and increase engagement and benefits to existing ones
Pay with KrisFlyer Miles− Members are able to use miles
to pay for all or part of theircommercial airfares, fuel surcharge, and fees.
− Effective Aug 2014, miles can be used to pay for preferred seats
− Minimum miles level reduced from 5,000 to 3,000Slide 35
FFP DEVELOPMENT
BRANDING INITIATIVES
Slide 36
Projecting the SIA Brand to a global audience through sponsorships 2014 Formula 1 Singapore Airlines Singapore Grand Prix
2014 WTA Finals Singapore

19
Full Service
LCC
Regional
The Group’s portfolio of brands extends its market reach
Long-HaulMarkets
Po
siti
on
ing
Extend
Market
Reach
SIA GROUP PORTFOLIO
Slide 37
Gaining Travellers' Mindshare
Slide 38
SIA GROUP PORTFOLIO

20
Strong LCC growth in Asia Pacific
Further growth potential
LCC participation as an engine of growth
Asia Pacific 5-year CAGR*(2009 – 2013)
Full Service Carriers +6%
Low Cost Carriers +18%
Region Market Share* of LCCs(January –August 2014)
Europe 42%
United States 31%
Asia Pacific 26%
Singapore 30%
*Source: Diio Mi, CAPASlide 39
SIA GROUP PORTFOLIO
FSC platform SQ/MI synergy 50% increase in SQ/MI connecting traffic in
last three years 60% of MI traffic is connecting SQ
A short-haul LCC platform is essential
SilkAir SIA
Traffic growth in Singapore has been driven by transfer traffic
From/To Singapore YoY Growth*
Point to Point Traffic 3.4%
Transfer Traffic 6.1%
Slide 40
SIA GROUP PORTFOLIO
Tiger
LCC platform Scoot-Tiger ATI Mutually beneficial cooperation between a
short haul LCC and Scoot Tiger Airways remains the most viable
short-haul LCC platform for the Group
ScootTigerTiger

21
Unprofitable overseas subsidiaries have been disposed of
Capacity overhang has been addressed
Refocus on Singapore operations
Commercial cooperation with Scoot - with ATI - will bring clear benefits to both Tiger Airways and Scoot
Tiger Airways is entering a rebuilding phase
Slide 41
TIGER AIRWAYS
Tiger Airways needs to repair balance sheet SIA providing support
To support the increased investment in Tiger Airways, SIA will require Greater influence over Tiger Airways’ development Greater alignment of interests Therefore, stepping up to controlling stake
For Tiger Airways to grow, it would need capabilities of SIA Group Economies of scale Network connectivity and distribution
SIA’s stake in Tiger Airways
Slide 42
TIGER AIRWAYS

22
Passed 3 million passenger milestone in Jul 2014
Commence renewal of fleet from end of 2014 with first delivery of B787
13 destinations in eight countries or territories
Slide 43
SCOOT
LCC based in Don Mueang International Airport, Bangkok
Second home market for Scoot
Fleet of B777s
Milestones:
−Brand Launch on 8 Sep 2014
−Air Transport Service License granted on 8 Sep 2014
−Air Operator Certificate received on 30 Oct 2014
NOKSCOOT JOINT VENTURE
Slide 44
23
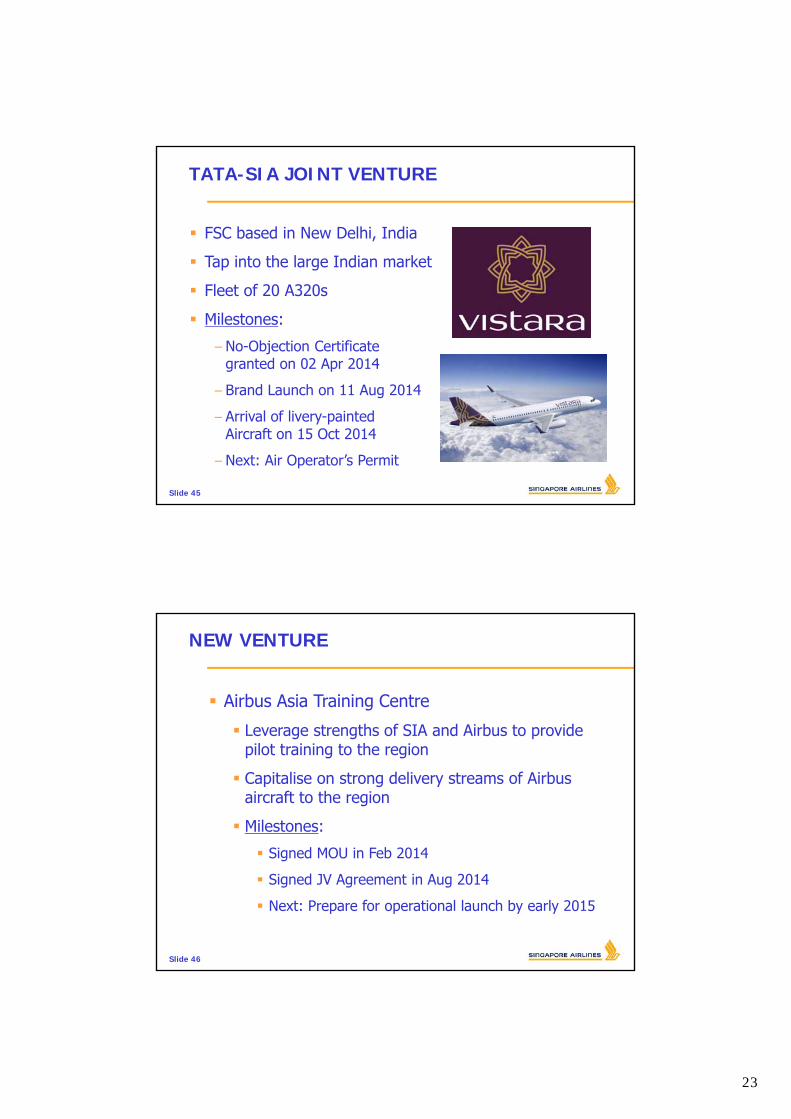
FSC based in New Delhi, India
Tap into the large Indian market
Fleet of 20 A320s
Milestones:
−No-Objection Certificategranted on 02 Apr 2014
−Brand Launch on 11 Aug 2014
−Arrival of livery-painted Aircraft on 15 Oct 2014
−Next: Air Operator’s Permit
TATA-SIA JOINT VENTURE
Slide 45
NEW VENTURE
Slide 46
Airbus Asia Training Centre
Leverage strengths of SIA and Airbus to provide pilot training to the region
Capitalise on strong delivery streams of Airbus aircraft to the region
Milestones:
Signed MOU in Feb 2014
Signed JV Agreement in Aug 2014
Next: Prepare for operational launch by early 2015

24
Thank You


![[REVISI] PiO Syndicate 3 Singapore Airlines](https://static.documents.pub/doc/80x56/55cf8d2d5503462b1392bd46/revisi-pio-syndicate-3-singapore-airlines.jpg)


