Recommended CitationLupo, Katie J. (2006) "The Pattern of Convergence of Eastern German Labor Markets to Western Standards Post-Unification," Undergraduate Economic Review: Vol. 2: Iss. 1, Article 6.Available at: http://digitalcommons.iwu.edu/uer/vol2/iss1/6
The Pattern of Convergence of Eastern German Labor Markets to WesternStandards Post-Unification
AbstractIn this paper, I analyze the patterns of convergence of the eastern German labor markets to western standardsfollowing German unification. Soon after unification, the eastern states adopted the Deutschmark to avoidwestward migration. Along with large transfers from the western states, the introduction of the Deutschmarkcaused real eastern wages to increase dramatically relative to increases in productivity. Using data from theGerman Socio-Economic Panel, this research analyzes inequality in education, unemployment, and wagesbetween 1992 and 2003 for eastern and western Germans. I find an overall convergence of eastern levels towestern standards in each of these areas. Despite the rises in equality between the eastern and western states,eastern levels remain far below western levels in 2003.
This article is available in Undergraduate Economic Review: http://digitalcommons.iwu.edu/uer/vol2/iss1/6
The Pattern of Convergence of Eastern German Labor
Markets to Western Standards Post-Unification†
Katie J. Lupo‡§
Lake Forest College
Abstract: In this paper, I analyze the patterns of convergence of the eastern German labor markets to western standards following German unification. Soon after unification, the eastern states adopted the Deutschmark to avoid westward migration. Along with large transfers from the western states, the introduction of the Deutschmark caused real eastern wages to increase dramatically relative to increases in productivity. Using data from the German Socio-Economic Panel, this research analyzes inequality in education, unemployment, and wages between 1992 and 2003 for eastern and western Germans. I find an overall convergence of eastern levels to western standards in each of these areas. Despite the rises in equality between the eastern and western states, eastern levels remain far below western levels in 2003. Keywords: German Labor Market, German Unification, Returns to Human Capital JEL Classification Codes: J21, J31, J64, O12, R11
† I thank David Boden, Rob Lemke, and Bill Moskoff for guidance on this topic, as well as comments on this and previous drafts. All remaining errors are my own. ‡ Box 1246, Lake Forest College, 555 N. Sheridan Road, Lake Forest, IL 60045. Telephone: (847) 735-5529. E-mail: [email protected]. § Faculty Sponsor: Rob Lemke, Lake Forest College Box M3, 555 N. Sheridan Road, Lake Forest, IL. Telephone (847) 735-5143. E-mail: [email protected].
1
Lupo: The Pattern of Convergence of Eastern German Labor Markets to Wes
Published by Digital Commons @ IWU, 2006
1
I. Introduction
The unification of Germany in 1989 necessitated the fusion of two very different
education programs, labor markets, and monetary systems. The East German education
system was highly regulated and mandatory. As a result, average education levels were
higher in East Germany than in West Germany pre-unification. In westernized nations,
higher education is typically coupled with higher earnings. This was not the case in eastern
Germany (the states formerly a part of East Germany) in 1992. Further, it is commonly
held that returns to education increase in transitional economies with the acquisition of a
free-market economy (Chase, 1997; Campos and Coricelli, 2002; Munich, Svejnar, and
Terell, 2002). In particular, Bird, Schwarz, and Wagner (1994) found rising returns to
education in the eastern German states during the initial transitioning years of 1989 until
1991. There is little subsequent research on the convergence of returns to education in the
eastern states to western standards after unification. Therefore, the first question this paper
addresses is to what extent the returns to schooling in the eastern states have converged
returns to schooling in the western states.
Next, a transitional economy usually must undergo a restructuring of its labor
force. As expected, unemployment in the eastern German states rose by approximately 35
percent between 1989 and 1992 (Hunt, 2003), while eastern output decreased by more than
65 percent (Sander & Schmidt, 1993). When output eventually began to rise, again, it was
expected that eastern levels of employment would increase and begin to converge to
western levels. The second question of this study is to what extent eastern levels of
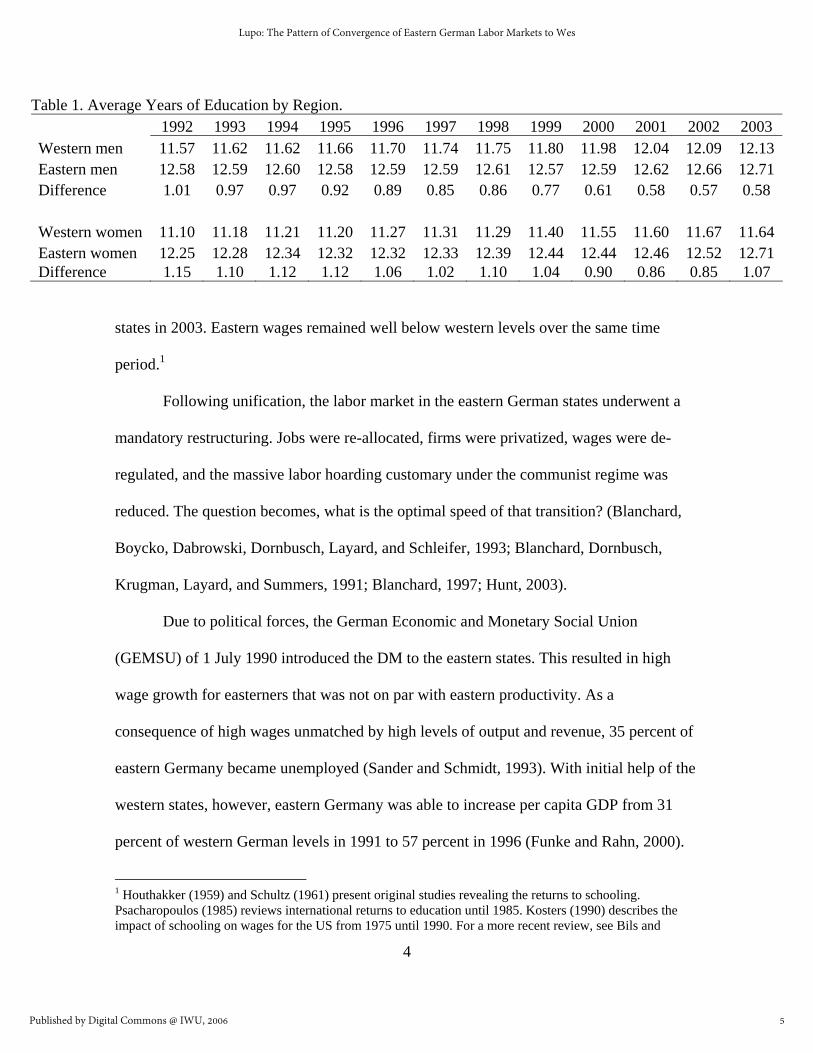
states in 2003. Eastern wages remained well below western levels over the same time
period.1
Following unification, the labor market in the eastern German states underwent a
mandatory restructuring. Jobs were re-allocated, firms were privatized, wages were de-
regulated, and the massive labor hoarding customary under the communist regime was
reduced. The question becomes, what is the optimal speed of that transition? (Blanchard,
Boycko, Dabrowski, Dornbusch, Layard, and Schleifer, 1993; Blanchard, Dornbusch,
Krugman, Layard, and Summers, 1991; Blanchard, 1997; Hunt, 2003).
Due to political forces, the German Economic and Monetary Social Union
(GEMSU) of 1 July 1990 introduced the DM to the eastern states. This resulted in high
wage growth for easterners that was not on par with eastern productivity. As a
consequence of high wages unmatched by high levels of output and revenue, 35 percent of
eastern Germany became unemployed (Sander and Schmidt, 1993). With initial help of the
western states, however, eastern Germany was able to increase per capita GDP from 31
percent of western German levels in 1991 to 57 percent in 1996 (Funke and Rahn, 2000).
1 Houthakker (1959) and Schultz (1961) present original studies revealing the returns to schooling. Psacharopoulos (1985) reviews international returns to education until 1985. Kosters (1990) describes the impact of schooling on wages for the US from 1975 until 1990. For a more recent review, see Bils and
5
Lupo: The Pattern of Convergence of Eastern German Labor Markets to Wes
Published by Digital Commons @ IWU, 2006
5
Like many communist states, East Germany had numerous laws that encouraged
families to have children. For example, mothers were ensured of work after pregnancy and
maternal leave, and there was adequate free childcare available. During the communist
regime, over 80 percent of women participated in the labor market. Even in 2000, 72
percent of women in the former east were in the workforce, compared to 62 percent of
The initial wage explosion slowed considerably after mid 1995. It is commonly
held that there were two phases of structural adjustments of eastern wages. First, wages
grew excessively between 1989 and 1995. In the last couple years of this phase, growth
rates of wages declined and finally stabilized around an annual rate of 5 percent growth
(Franz and Steiner, 2000; Lange and Pugh, 1998b; Burda and Hunt, 2001). Numerous
studies report the decomposition of wages for the period ranging from unification until
1997. These reveal a rise in returns to education for easterners, an absence of an impact of
experience on wages, an increase of eastern wages, and a decrease in wage inequality
between men and women in the eastern states (Hunt, 2002; Burda and Schmidt, 1997;
Franz and Steiner, 2000). Only one paper by Gang and Yun (2002) explores changes in
inequality and wage growth trends in eastern and western Germany between 1990 and
2000 but does not discuss the convergence to western standards. Their findings point to
little change in western equality and a slight increase in eastern levels of equality. Wage
growth trends are only examined for males and showed a positive correlation between firm
size and earnings, as well as education and earnings. Little literature exists that compares
explanatory variables between men and women, as well as differences in rates of
convergence, after 1997.
III. The Data
The data comes from the public-use version of the German-Socio Economic Panel
(GSOEP) data for the years 1992-2003. The GSOEP data are collected by the Deutsche
Institut für Wirtschaft (DIW) and are a representative sample of German households and
individuals. This data have been collected for the western states (states included in the
7
Lupo: The Pattern of Convergence of Eastern German Labor Markets to Wes
Published by Digital Commons @ IWU, 2006
7
former West Germany) since 1984. From 1984 until 1990, the survey was composed of
two sample groups: West Germans (sample A) and foreign nationals living in West
Germany (sample B). In 1990, the eastern states were added to create a third sample
(sample C). Much of the income data for eastern Germany for 1990 and 1991 are missing.
Therefore, my analysis begins with 1992. One of the most prominent features of the data
set is its large and stable size, which enables longitudinal analysis to account for
compositional changes. A possible problem with the data is that using a longitudinal
sample creates the possibility for attrition bias.2
The GSOEP contains some “generated variables,” which are produced by
researchers and staff affiliated with Cornell University and the DIW Berlin to fill in
missing observations (Grabka, 2005). The analysis here includes the following variables:
number of children in the respondent’s household, marital status, industry of employment,
employment status, annual hours worked, number of years of education, attainment of high
school diploma or equivalent, and earned income. Each of these variables is summarized in
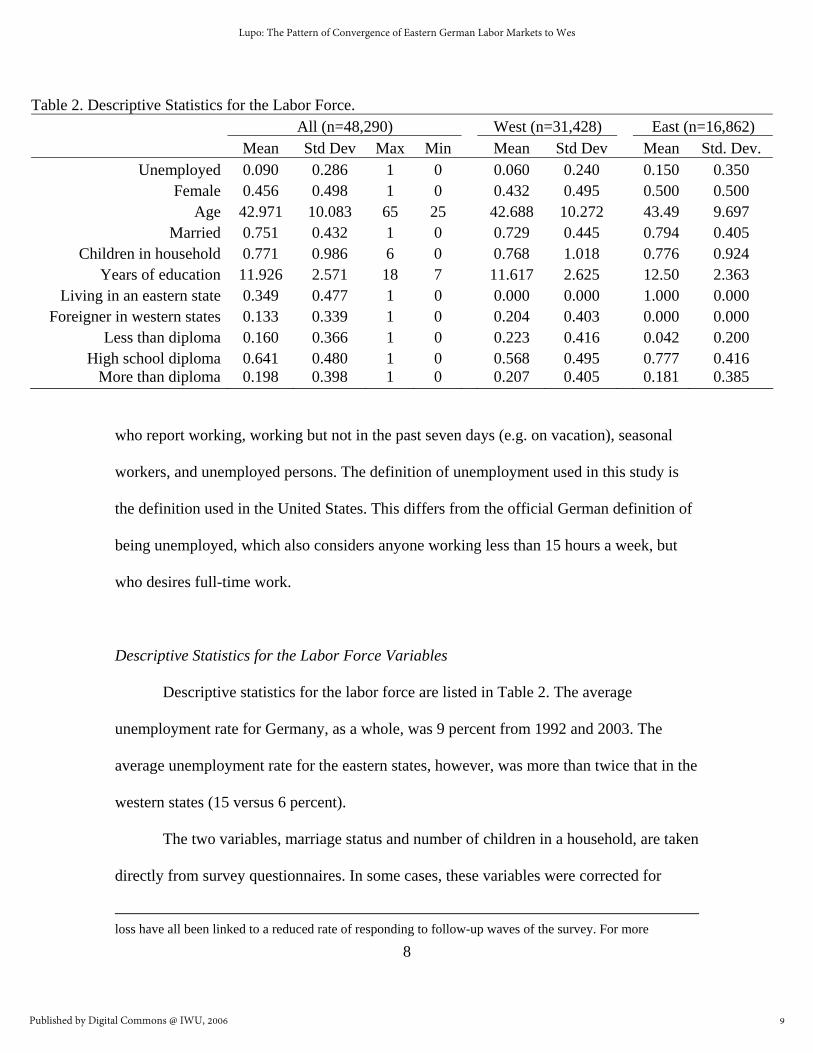
Table 2.
Before discussing the variables in detail, it should be noted that this study is limited
to citizens who are in the labor force. Therefore, I restrict the sample to individuals
between 25 and 65 years of age. Additionally, the GSOEP contains each respondent’s
labor force status. Respondents who report being unemployed and not seeking work,
retired, on maternity leave, involved in military or civil service, or enrolled in education
and training are not included in this study. As usual, the labor force consists of individuals
2 Studies concerning the attrition bias of the GSOEP point to problems with unsuccessful follow-up interviews (e.g. households moves, separation of households, etc.). Divorce, residing in East Berlin. and job
Age 42.971 10.083 65 25 42.688 10.272 43.49 9.697 Married 0.751 0.432 1 0 0.729 0.445 0.794 0.405
Children in household 0.771 0.986 6 0 0.768 1.018 0.776 0.924 Years of education 11.926 2.571 18 7 11.617 2.625 12.50 2.363
Living in an eastern state 0.349 0.477 1 0 0.000 0.000 1.000 0.000 Foreigner in western states 0.133 0.339 1 0 0.204 0.403 0.000 0.000
Less than diploma 0.160 0.366 1 0 0.223 0.416 0.042 0.200 High school diploma 0.641 0.480 1 0 0.568 0.495 0.777 0.416
More than diploma 0.198 0.398 1 0 0.207 0.405 0.181 0.385
who report working, working but not in the past seven days (e.g. on vacation), seasonal
workers, and unemployed persons. The definition of unemployment used in this study is
the definition used in the United States. This differs from the official German definition of
being unemployed, which also considers anyone working less than 15 hours a week, but
who desires full-time work.
Descriptive Statistics for the Labor Force Variables
Descriptive statistics for the labor force are listed in Table 2. The average
unemployment rate for Germany, as a whole, was 9 percent from 1992 and 2003. The
average unemployment rate for the eastern states, however, was more than twice that in the
western states (15 versus 6 percent).
The two variables, marriage status and number of children in a household, are taken
directly from survey questionnaires. In some cases, these variables were corrected for
loss have all been linked to a reduced rate of responding to follow-up waves of the survey. For more
9
Lupo: The Pattern of Convergence of Eastern German Labor Markets to Wes
Published by Digital Commons @ IWU, 2006
9
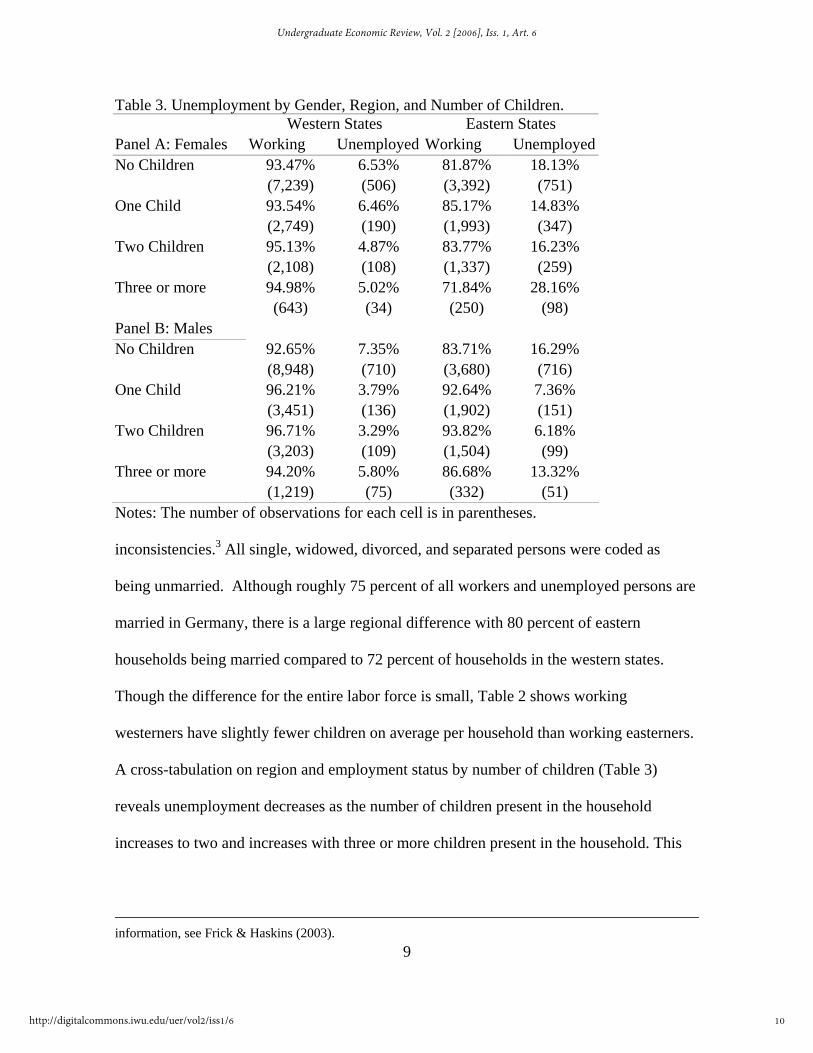
Table 3. Unemployment by Gender, Region, and Number of Children. Western States Eastern States
Panel A: Females Working Unemployed Working Unemployed No Children 93.47% 6.53% 81.87% 18.13%
(7,239) (506) (3,392) (751) One Child 93.54% 6.46% 85.17% 14.83%
(2,749) (190) (1,993) (347) Two Children 95.13% 4.87% 83.77% 16.23%
(2,108) (108) (1,337) (259) Three or more 94.98% 5.02% 71.84% 28.16% (643) (34) (250) (98) Panel B: Males No Children 92.65% 7.35% 83.71% 16.29%
(8,948) (710) (3,680) (716) One Child 96.21% 3.79% 92.64% 7.36%
(3,451) (136) (1,902) (151) Two Children 96.71% 3.29% 93.82% 6.18%
(3,203) (109) (1,504) (99) Three or more 94.20% 5.80% 86.68% 13.32%
(1,219) (75) (332) (51) Notes: The number of observations for each cell is in parentheses. inconsistencies.3 All single, widowed, divorced, and separated persons were coded as
being unmarried. Although roughly 75 percent of all workers and unemployed persons are
married in Germany, there is a large regional difference with 80 percent of eastern
households being married compared to 72 percent of households in the western states.
Though the difference for the entire labor force is small, Table 2 shows working
westerners have slightly fewer children on average per household than working easterners.
A cross-tabulation on region and employment status by number of children (Table 3)
reveals unemployment decreases as the number of children present in the household
increases to two and increases with three or more children present in the household. This
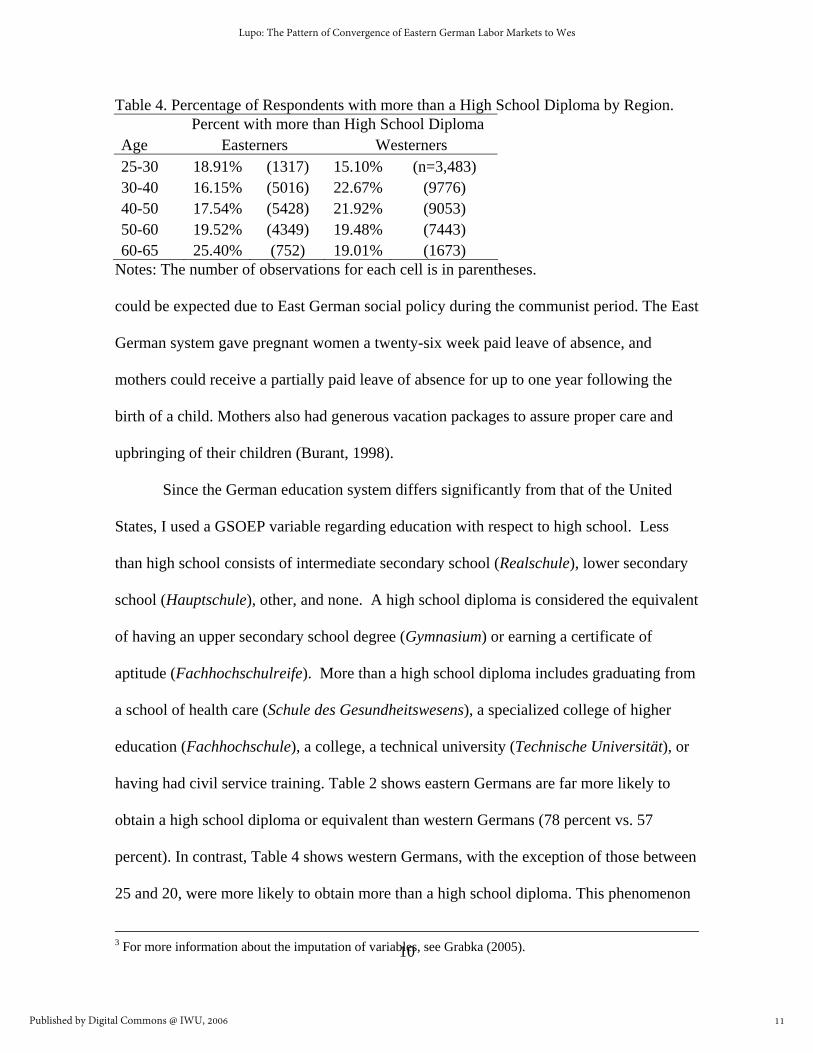
Table 4. Percentage of Respondents with more than a High School Diploma by Region. Percent with more than High School Diploma Age Easterners Westerners 25-30 18.91% (1317) 15.10% (n=3,483) 30-40 16.15% (5016) 22.67% (9776) 40-50 17.54% (5428) 21.92% (9053) 50-60 19.52% (4349) 19.48% (7443) 60-65 25.40% (752) 19.01% (1673)
Notes: The number of observations for each cell is in parentheses. could be expected due to East German social policy during the communist period. The East
German system gave pregnant women a twenty-six week paid leave of absence, and
mothers could receive a partially paid leave of absence for up to one year following the
birth of a child. Mothers also had generous vacation packages to assure proper care and
upbringing of their children (Burant, 1998).
Since the German education system differs significantly from that of the United
States, I used a GSOEP variable regarding education with respect to high school. Less
than high school consists of intermediate secondary school (Realschule), lower secondary
school (Hauptschule), other, and none. A high school diploma is considered the equivalent
of having an upper secondary school degree (Gymnasium) or earning a certificate of
aptitude (Fachhochschulreife). More than a high school diploma includes graduating from
a school of health care (Schule des Gesundheitswesens), a specialized college of higher
education (Fachhochschule), a college, a technical university (Technische Universität), or
having had civil service training. Table 2 shows eastern Germans are far more likely to
obtain a high school diploma or equivalent than western Germans (78 percent vs. 57
percent). In contrast, Table 4 shows western Germans, with the exception of those between
25 and 20, were more likely to obtain more than a high school diploma. This phenomenon
3 For more information about the imputation of variables, see Grabka (2005).
11
Lupo: The Pattern of Convergence of Eastern German Labor Markets to Wes
Published by Digital Commons @ IWU, 2006
11
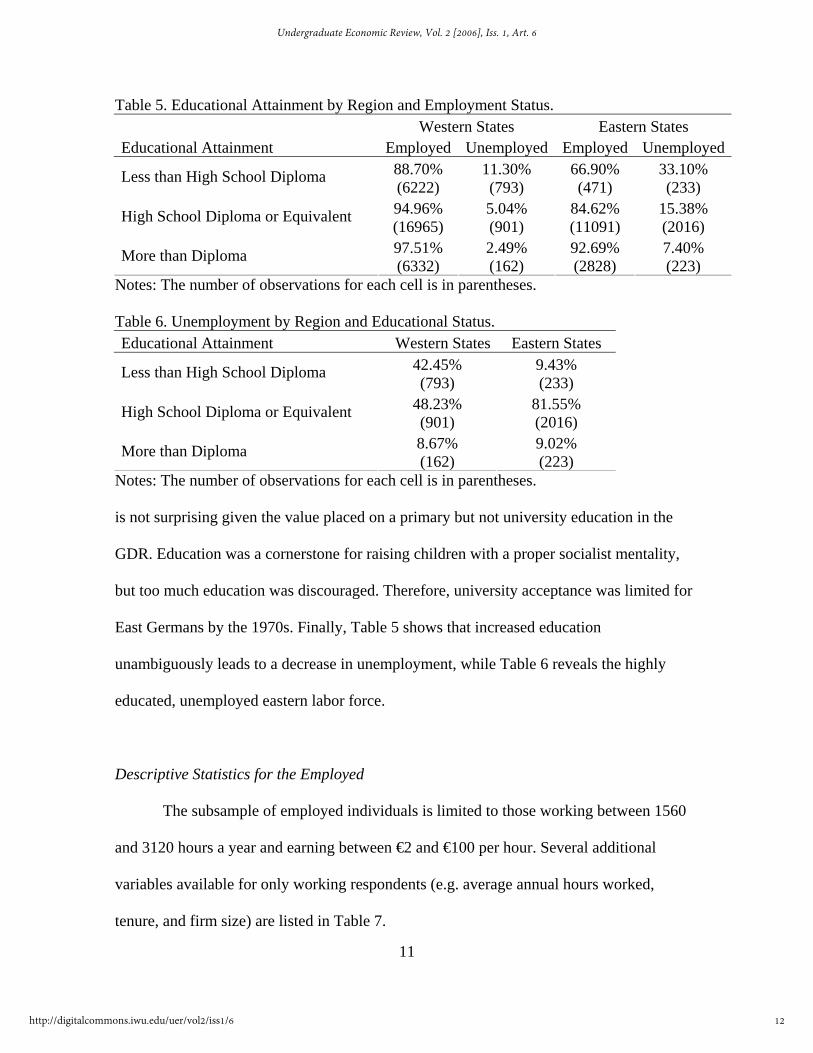
Table 5. Educational Attainment by Region and Employment Status. Western States Eastern States Educational Attainment Employed Unemployed Employed Unemployed
88.70% 11.30% 66.90% 33.10% Less than High School Diploma (6222) (793) (471) (233) 94.96% 5.04% 84.62% 15.38% High School Diploma or Equivalent (16965) (901) (11091) (2016) 97.51% 2.49% 92.69% 7.40% More than Diploma (6332) (162) (2828) (223)
Notes: The number of observations for each cell is in parentheses.
Table 6. Unemployment by Region and Educational Status. Educational Attainment Western States Eastern States
42.45% 9.43% Less than High School Diploma (793) (233)
48.23% 81.55% High School Diploma or Equivalent (901) (2016) 8.67% 9.02% More than Diploma (162) (223)
Notes: The number of observations for each cell is in parentheses.
is not surprising given the value placed on a primary but not university education in the
GDR. Education was a cornerstone for raising children with a proper socialist mentality,
but too much education was discouraged. Therefore, university acceptance was limited for
East Germans by the 1970s. Finally, Table 5 shows that increased education
unambiguously leads to a decrease in unemployment, while Table 6 reveals the highly
educated, unemployed eastern labor force.
Descriptive Statistics for the Employed
The subsample of employed individuals is limited to those working between 1560
and 3120 hours a year and earning between €2 and €100 per hour. Several additional
variables available for only working respondents (e.g. average annual hours worked,
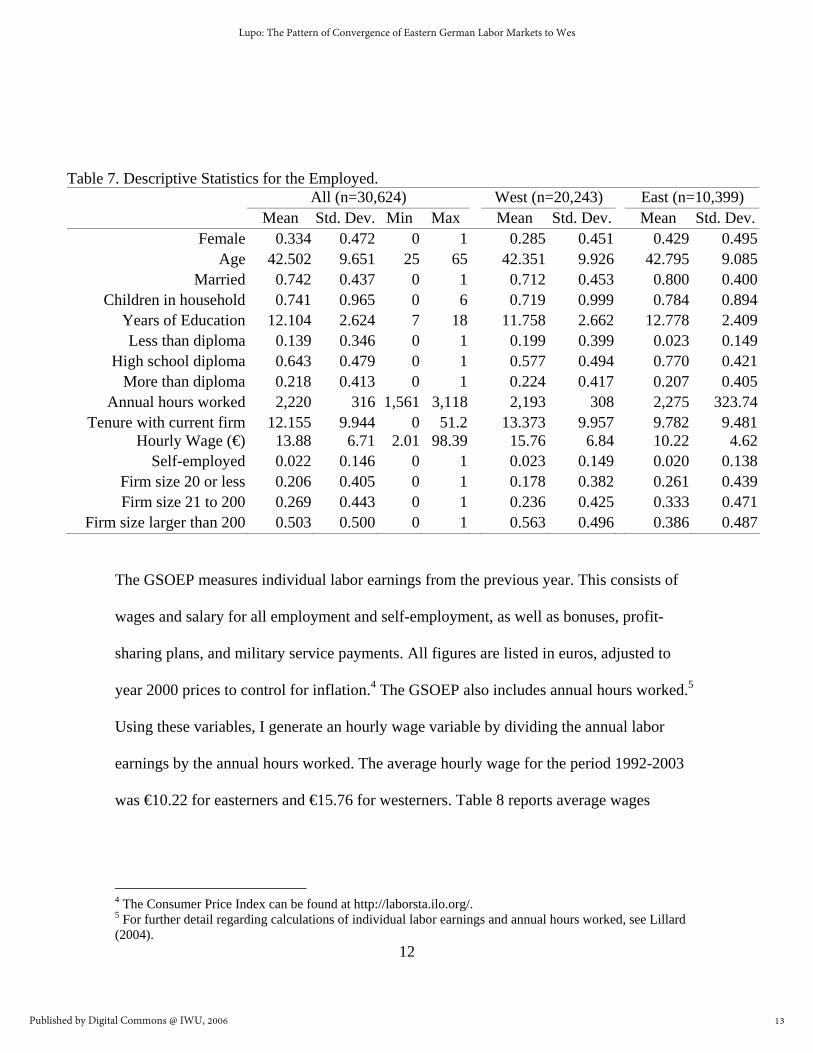
The GSOEP measures individual labor earnings from the previous year. This consists of
wages and salary for all employment and self-employment, as well as bonuses, profit-
sharing plans, and military service payments. All figures are listed in euros, adjusted to
year 2000 prices to control for inflation.4 The GSOEP also includes annual hours worked.5
Using these variables, I generate an hourly wage variable by dividing the annual labor
earnings by the annual hours worked. The average hourly wage for the period 1992-2003
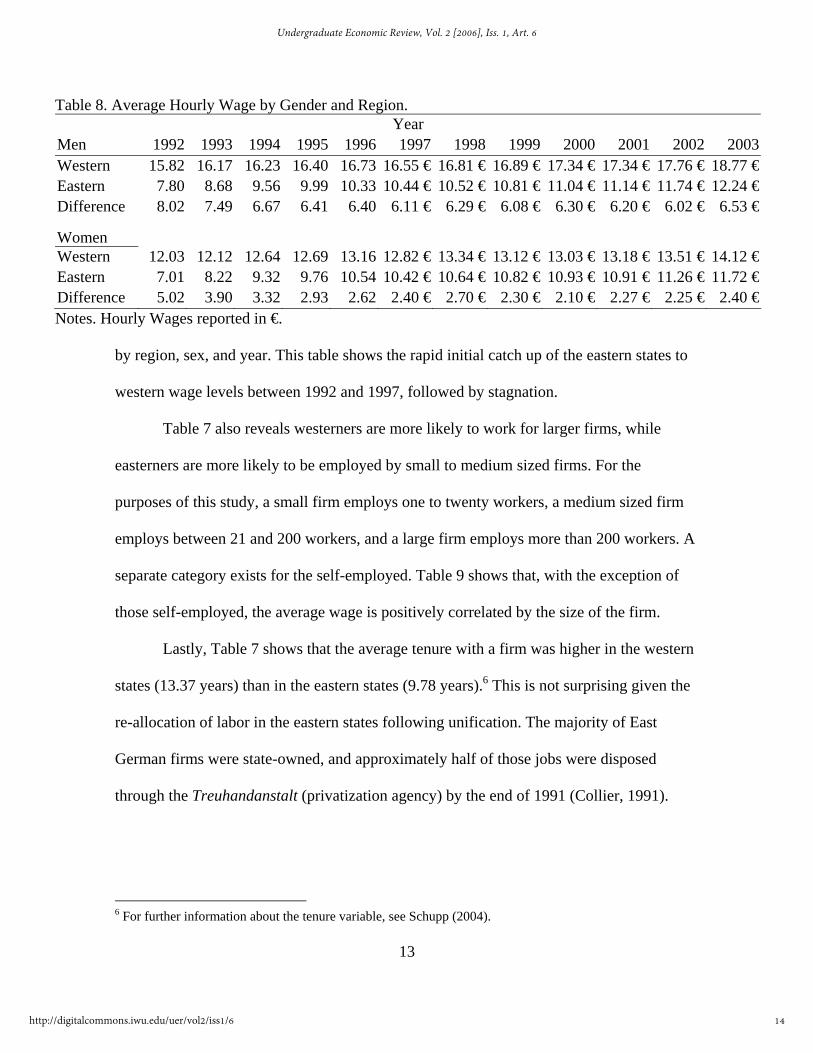
was €10.22 for easterners and €15.76 for westerners. Table 8 reports average wages
4 The Consumer Price Index can be found at http://laborsta.ilo.org/. 5 For further detail regarding calculations of individual labor earnings and annual hours worked, see Lillard (2004).
13
Lupo: The Pattern of Convergence of Eastern German Labor Markets to Wes
Published by Digital Commons @ IWU, 2006
13
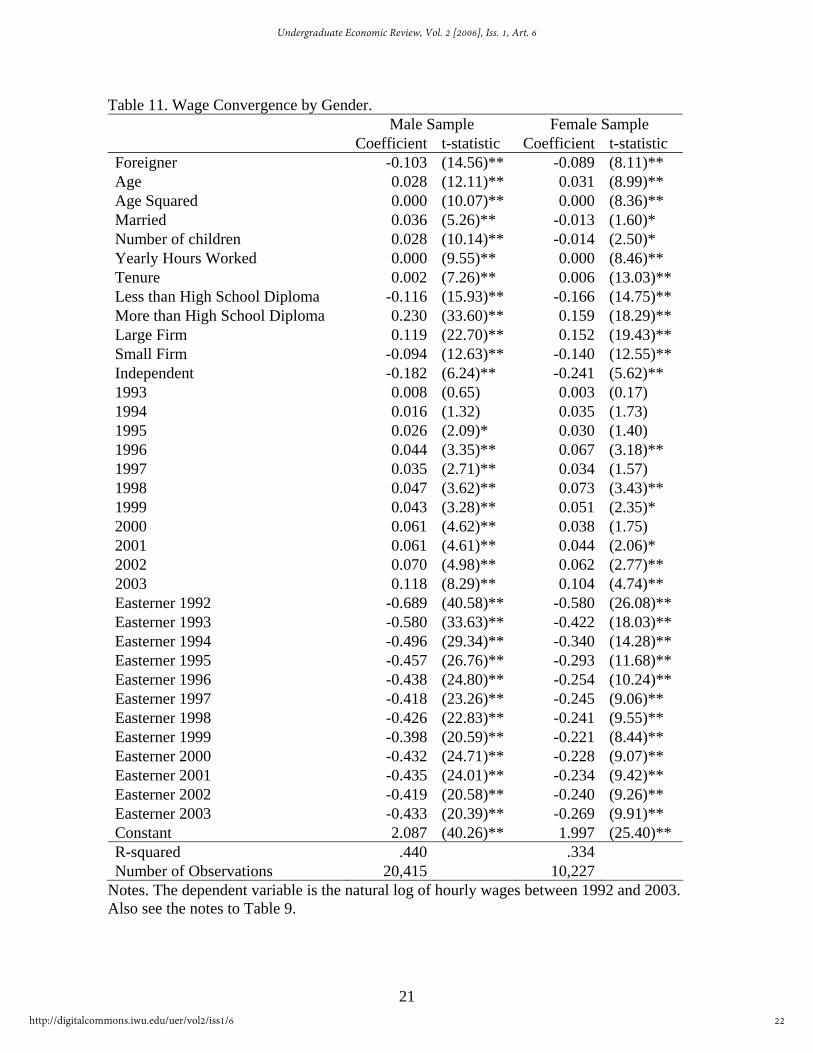
Table 8. Average Hourly Wage by Gender and Region. Year
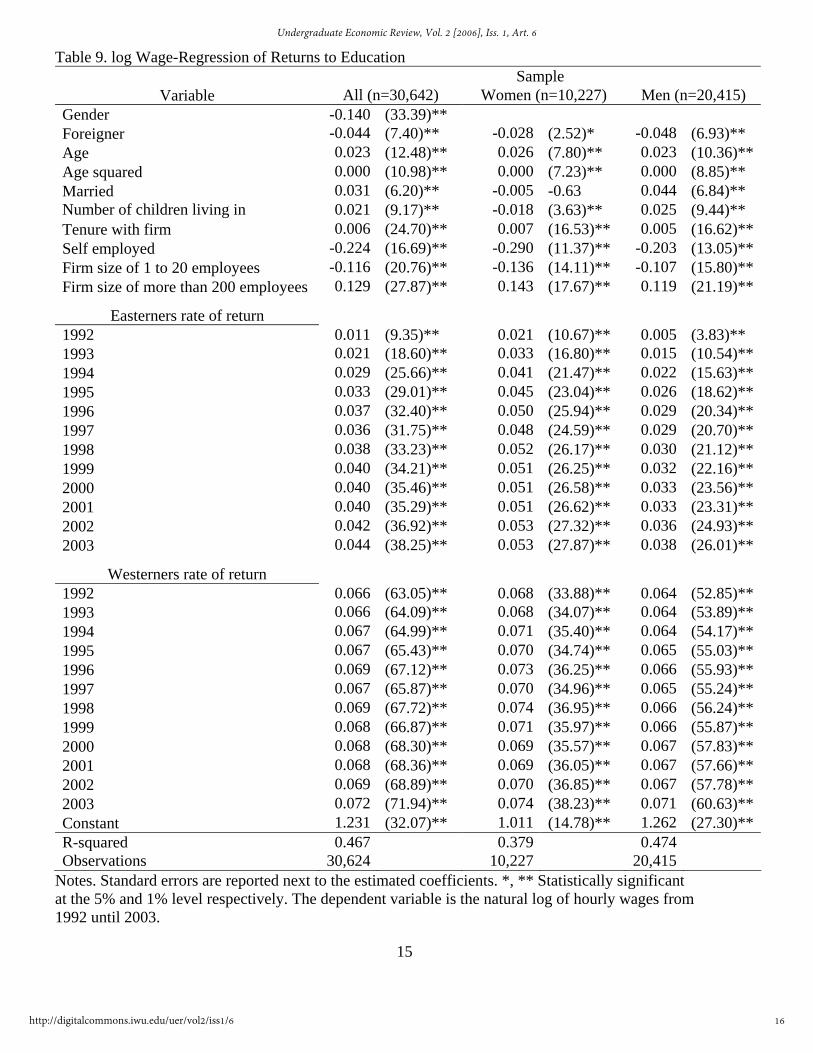
Notes. Standard errors are reported next to the estimated coefficients. *, ** Statistically significant at the 5% and 1% level respectively. The dependent variable is the natural log of hourly wages from 1992 until 2003.
convergence of the eastern states to western levels of rates of return on additional years of
schooling, followed by a period of less rapid convergence.
It is interesting to note the differences in returns to education between women and
men. First, there is only a small difference between women and men in the western states.
The average returns to each year of schooling for women range from 6.8 to 7.4 percentage
points, while that of men varies between 6.4 and 7.1 percentage points. In contrast, returns
by sex in the eastern states are notably distinct. In 1992, women realized returns for each
year of schooling of approximately 2.1 percentage points, while men received an average
rate of return of just 0.5 percentage points for each year of schooling. This inequality
between men and women remained virtually unchanged 12 years later. In 2003, returns for
each year of schooling for women reached 5.3 percentage points (a 3.2 percentage point
increase over 1992) and 3.8 percentage points for men (3.3 percentage points higher than
1992). This implication is that rates of return in the eastern states moved toward the
western rates in the early 1990s, but that the convergence was, in magnitude, the same for
men and women.
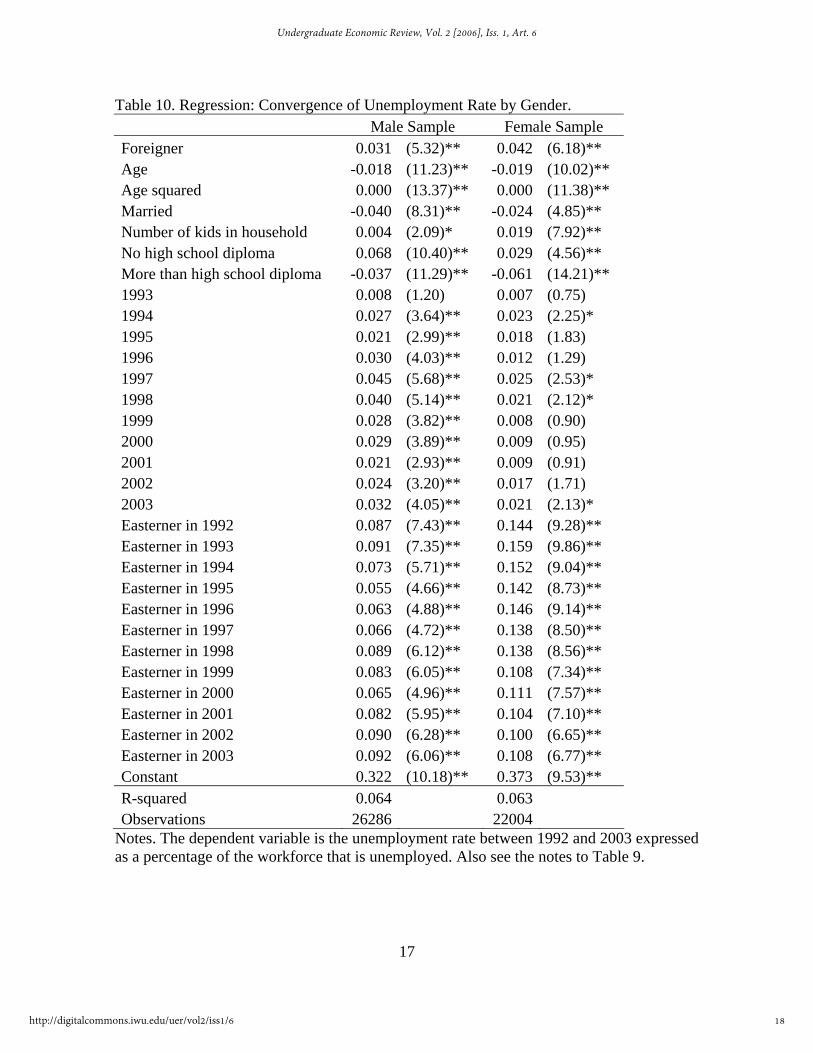
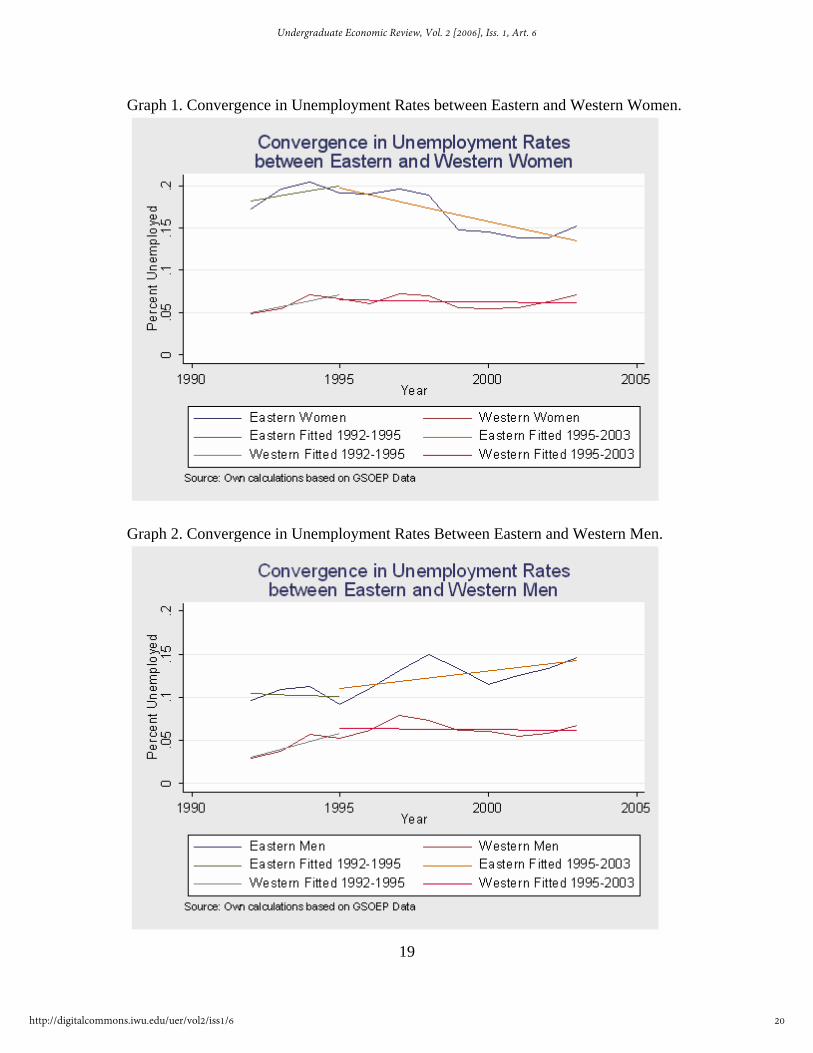
Convergence in Unemployment Rates between Genders
The results from estimating unemployment in the eastern and western states are
reported in Table 10. Both models in Table 10 are robust, linear probability models, in
which the dependent variable equals 1 for unemployed individuals and 0 for employed
individuals. The coefficient for the year represents the returns seen by easterners and
17
Lupo: The Pattern of Convergence of Eastern German Labor Markets to Wes
Published by Digital Commons @ IWU, 2006
17
Table 10. Regression: Convergence of Unemployment Rate by Gender. Male Sample Female Sample Foreigner 0.031 (5.32)** 0.042 (6.18)** Age -0.018 (11.23)** -0.019 (10.02)** Age squared 0.000 (13.37)** 0.000 (11.38)** Married -0.040 (8.31)** -0.024 (4.85)** Number of kids in household 0.004 (2.09)* 0.019 (7.92)** No high school diploma 0.068 (10.40)** 0.029 (4.56)** More than high school diploma -0.037 (11.29)** -0.061 (14.21)** 1993 0.008 (1.20) 0.007 (0.75) 1994 0.027 (3.64)** 0.023 (2.25)* 1995 0.021 (2.99)** 0.018 (1.83) 1996 0.030 (4.03)** 0.012 (1.29) 1997 0.045 (5.68)** 0.025 (2.53)* 1998 0.040 (5.14)** 0.021 (2.12)* 1999 0.028 (3.82)** 0.008 (0.90) 2000 0.029 (3.89)** 0.009 (0.95) 2001 0.021 (2.93)** 0.009 (0.91) 2002 0.024 (3.20)** 0.017 (1.71) 2003 0.032 (4.05)** 0.021 (2.13)* Easterner in 1992 0.087 (7.43)** 0.144 (9.28)** Easterner in 1993 0.091 (7.35)** 0.159 (9.86)** Easterner in 1994 0.073 (5.71)** 0.152 (9.04)** Easterner in 1995 0.055 (4.66)** 0.142 (8.73)** Easterner in 1996 0.063 (4.88)** 0.146 (9.14)** Easterner in 1997 0.066 (4.72)** 0.138 (8.50)** Easterner in 1998 0.089 (6.12)** 0.138 (8.56)** Easterner in 1999 0.083 (6.05)** 0.108 (7.34)** Easterner in 2000 0.065 (4.96)** 0.111 (7.57)** Easterner in 2001 0.082 (5.95)** 0.104 (7.10)** Easterner in 2002 0.090 (6.28)** 0.100 (6.65)** Easterner in 2003 0.092 (6.06)** 0.108 (6.77)** Constant 0.322 (10.18)** 0.373 (9.53)** R-squared 0.064 0.063 Observations 26286 22004
Notes. The dependent variable is the unemployment rate between 1992 and 2003 expressed as a percentage of the workforce that is unemployed. Also see the notes to Table 9.
with Houthakker (1959) and Schultz (1961), several studies have exhibited the significant
impact education has on an individual’s earnings in a free-market economy.7 Bird,
Schwarze, and Wagner (1994) showed returns to work experience with the GDR had
insignificant effects on eastern wages between 1989 and 1991 but education obtained
during the socialist time period did have a slight positive impact on wage. This study uses
the same data (plus more recent waves). There is little research on German returns to
education between 1991 and 2003. The results of the paper fill in this gap and support the
results of studies of returns to education in other transitional economies. Findings support
the expectation that rates of return to education in the eastern states have moved closer to
western levels with the extension of the western education system to the eastern states.
Next, this study examines the convergence of unemployment rates between
genders in the eastern and the western states. It appears this has gone through two
periods: 1992 until 1995 and 1995 until 2003 (see Graphs 1 and 2). As expected, in the
first period, unemployment unambiguously rose in the eastern states, while western states
witnessed no drastic changes. In the next period, unemployment fell for women but
increased for men. This is related to an increase in real wages at a pace too rapid to
sustain. The reason for this increase in real wages was to slow the westward migration
that occurred after the fall of the Berlin Wall.
7 For a review of more recent studies, see Blundell, Dearden, Meghir, & Sianesi (1999); Brunello and Comi (2000); Ammermüller, Kuckulenz, Lauer, and Zwick (2005).
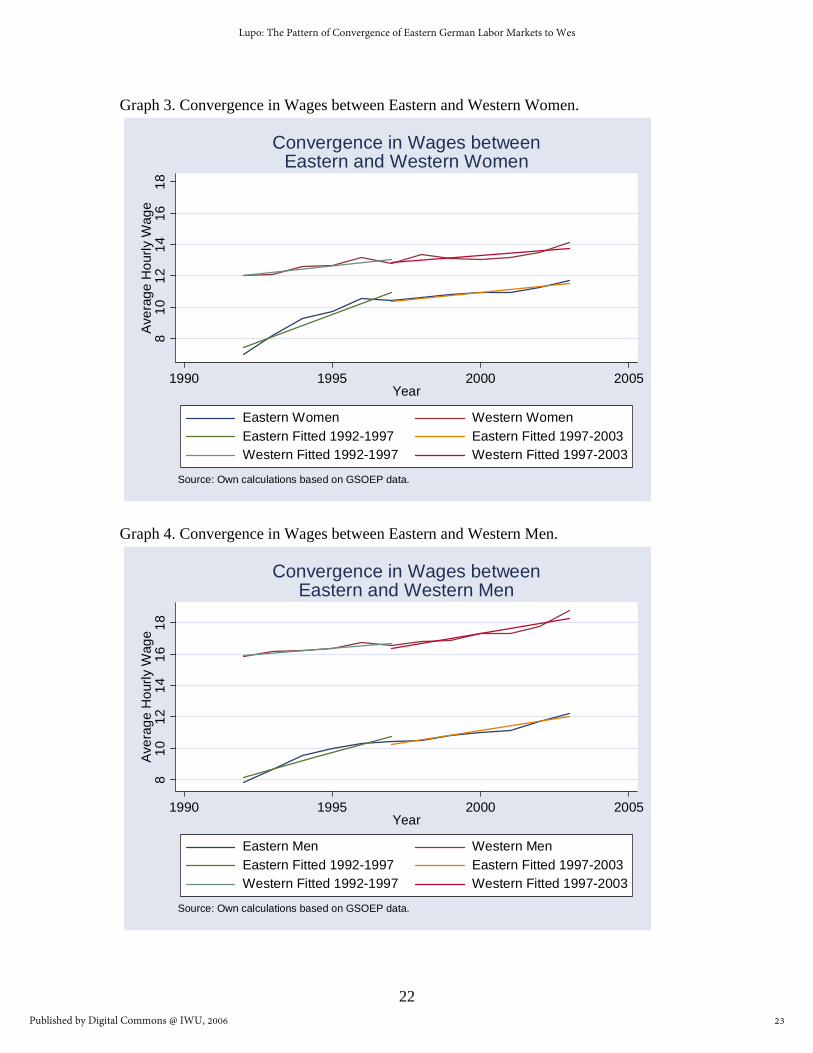
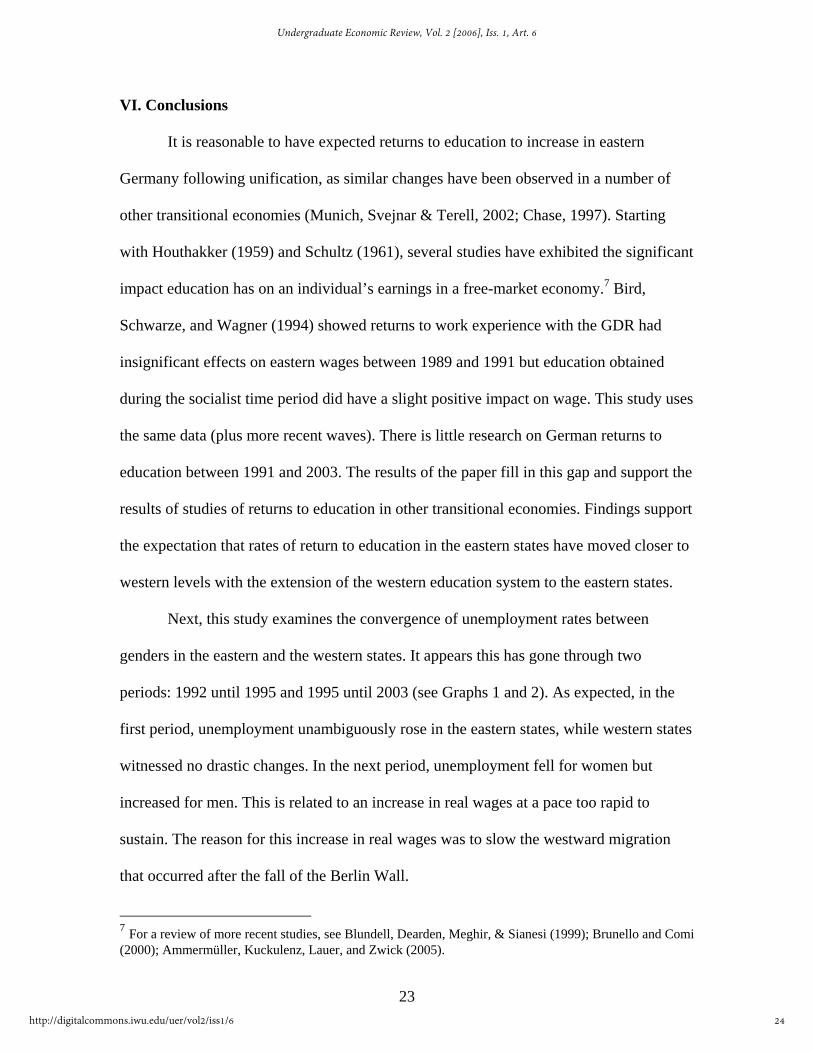
Lastly, this paper investigates the convergence of eastern wages to western
standards separately for women and men. Burda and Wyplosz (1992) explain that an
initial wage increase would be expected to abate massive westward migration in the years
following unification. Their study suggested wages would rise to an equilibrium, where
migration would decrease to nominal levels. I find wages do rise quickly until 1997, at
which time they appear to be at some sort of a steady state. I also find wages for women
are rising at a faster pace than wages for men. In conjunction with falling unemployment
rates for women, further research is needed to analyze trends in women’s labor market
participation. This study also suggests that there has not been much movement from the
steady state, which began in 1997. It was about this time when transfers from the western
states ended, and aid programs were finished. The problem is that the western firms
purchased eastern firms during the privatization period. This has made it difficult for the
eastern economy to be self-sustaining at levels on par with the western states.
25
Lupo: The Pattern of Convergence of Eastern German Labor Markets to Wes
Published by Digital Commons @ IWU, 2006
25
References
Akerlof, G.A., A.K. Rose, H. Hessenius, J.L. Yellen, M. Guitian, & R. Dornbusch. (1991). East Germany in form the cold: The economic aftermath of currency union. Brookings Papers on Economic Activity, 1991(1), 1-105.
Ammermüller, A., A. Kuckulenz, C. Lauer, & T. Zwick. Human capital as a factor of
growth and promotion of employment at the regional level: The case of France and Germany. Brussels: European Union Publications Office.
Bird, E.J., J Schwarze, & G.G. Wagner. (1994). Wage effects of the move toward free
markets in East Germany. Industrial and Labor Relations Review, 47(3), 390-400. Blanchard, O. (1997). The economics of post-communist transition. New York: Oxford
University Press. Blanchard O., Dornbusch R., Krugman P., Layard R., & Summers L. (1991). Reform in
Eastern Europe. Cambridge, Masschusetts: MIT Press. Blanchard, O., Boycko, M., Dabrowski, M., Dornbusch, R., Layard, R., & Schleifer, A.
(1993). Post-communist reform. Cambridge, Masschusettes: MIT Press. Blundell, R., L. Dearden, C. Meghir, & B. Sianesi. (1999). Human capital investment: the
returns from education and training to the individual, the firm and the economy. Fiscal Studies, 20(1), 1-23.
Bonin, H. & R. Euwals. (2001). Participation behavior of East German women after
German unification. IZA Discussion Paper No. 413. Brunello, G. & S. Comi. (2000). Education and earnings growth: Evidence from 11
European countries. PURE Research Project. Burant, Stephen, R., ed. (1998). East Germany: A Country Study. Washington, D.C.:
Library of Congress. Burda, M.C. & C.M. Schmidt. (1997).Getting behind the East-West [German] wage
differential: Theory and evidence. The Davidson Institute Working Paper Series, No. 105.
Burda, M.C. & C. Wyplosz. (1992). Labor mobility and German integration: Some
vignettes. In H. Siebert (Ed.). The Transformation of Socialist Economies. Tübingen, Germany: J.C.B. Mohr, pp. 331-359.
Burda, M.C. & J. Hunt. (2001). From reunification to economic integration: Productivity
and the labor market in eastern Germany. Brookings Papers on Economic Activity, 2, 1-92.
Campos, N.F. & F. Coricelli. (2002). Growth in transition: What we know, what we don’t, and what we should. Journal of Economic Literature, 40(3), 793-836.
Collier, Irvin. (1991). On the First Year of German Monetary, Economic and Social
Union. The Journal of Economic Perspectives 5(4), 179-186. Chase, R.B. (1997). Markets for communist human capital: Returns to education and
experience in the Czech Republic and Slovenia. Economic Growth Center Discussion Paper Number 770. New Haven, Connecticut: Yale University.
Franz, W. & V. Steiner. (2000). Wages in the East German transition process: Facts and
explanations. German Economic Review, 1(3), 241-269. Frick, J.R. & J.P. Haisken-DeNew (Eds.). (2003). DTC companion to the German socio-
economic panel study (SOEP). Retrieved 5 December, 2004, from http://www.diw.de/english/sop/service/dtc/dtc.pdf
Funke, M. and J. Rahn. (2002). How Efficient is the East German Economy? Economics
of Transition, 10(1), 201-223. Gang, I.G. & M.S. Yun. (2002). Analyzing wage change in East Germany during the last
decade. mimeo. Grabka, M.M. (2005). Codebook for the $PEQUIV File 1984-2004: CNEF Variables
with Extended Income Information for the SOEP. Berlin: DIW Berlin. Hahn, H.J. (1998). Education and society in Germany. New York: Berg. Hasse, R. (1993). German-German monetary union: main options, costs and
repercussions. In A.G. Ghaussy & W. Schäfer (Eds.). The economics of German unification. New York: Routledge, pp. 26-59.
Houthakker, H.S. (1959). Education and income. Review of Economics and Statistics, 41,
24-28. Hunt, J. (2002). The transition in East Germany: When is a ten-point fall in the gender
wage gap bad news? Journal of Labor Economics, 20(1), 148-169. Hunt, J. (2003). Convergence and determinants of non-employment durations in eastern
and western Germany. Journal of Population Economics, 17, 249-266. Kreckel, R. & S. Schenk. (1998). Full or part-time? The contradictory integration of the
East German female labor force in unified Germany. Der Hallesche Graureiher 98-3. Forschungsberichte des Instituts für Soziologie. Martin-Luther-Universität Halle-Wittenberg.
27
Lupo: The Pattern of Convergence of Eastern German Labor Markets to Wes
Published by Digital Commons @ IWU, 2006
27
Lange, T. & G. Pugh. (1998a). The economics of German unification: An introduction. Northampton, MA: Edward Elgar.
Lang, T. & G. Pugh. (1998b). Wage policy and transition in eastern Germany.
International Journal of Manpower 19(1/2), 95-114. Lillard, D.R. (2004). GSOEP Data File Volume I (1980-2003). Retrieved December 1,
2005, from http://www.legacyhuman.wpg.cornell.edu/units/pam/gsoep/equiv/g-equiv1.pdf
Munich D., J. Svejnar & K. Terell. (2002). Returns to human capital under the
communist wage grid and during the transition to a market economy. William Davidson Working Paper No. 272a.
Pritchard, R.M.O. (1999). Reconstructing education: East German schools and
universities after unification. New York: Bergham Books. Sander, B., & K.D. Schmidt. (1993). Wages, productivity and employment in eastern
Germany. In A.G. Ghaussy & W. Schäfer (Eds.). The economics of German unification. New York: Routledge, pp. 60-72.
Schultz, T.W. (1961). Investment in human capital. American Economic Review, 1(1), 1-
17. Schupp, J. (2004). Generated Person-Level Variables. Retrieved December 1, 2005, from
http://www.diw.de/deutsch/sop/service/doku/docs/pgen2004.pdf Sinn, H.W. (2002). Germany’s economic unification: An assessment after ten years.
Review of International Economics, 10(1), 113-128.