http://econ.geog.uu.nl/peeg/peeg.html Papers in Evolutionary Economic Geography # 17.08 The pattern of structural change: testing the Product Space framework Nicola D. Coniglio, Raffaele Lagravinese, Davide Vurchio, Massimo Armenise
Transcript
http://econ.geog.uu.nl/peeg/peeg.html
Papers in Evolutionary Economic Geography
# 17.08 The pattern of structural change: testing the Product Space
framework
Nicola D. Coniglio, Raffaele Lagravinese, Davide Vurchio, Massimo Armenise
1
The pattern of structural change: testing the Product Space framework
Nicola D. Coniglio1, Raffaele Lagravinese, Davide Vurchio, Massimo Armenise
Department of Economics and Mathematical Methods, University of Bari “A.Moro”
Abstract
The set of available local ‘capabilities’ determines what an economy produces today (its static comparative
advantage) and, at the same time, defines the trajectories that the process of structural change may take in the
future. The Product Space (PS) framework developed in recent seminal works by economists and physicists
suggests that path dependence characterizes the evolution of the production basket (Hausmann and Klinger,
2007; Hidalgo et al. 2007). These authors represent economies as sets of productive capabilities that can be
combined in different ways to produce different products. Countries progressively change their production
baskets and move towards goods that require capabilities that are already available; on the contrary radical
structural change rarely happens. In this paper, we analyse the evolution over time of the production baskets
in 107 Italian provinces (NUTS 3) and perform the first test on the PS hypothesis of path dependence. We
investigate whether new products entering the provincial production baskets are non-randomly related to initial
production baskets. We confirm the general tendency of path dependence, but highlight at the same time that
a sizable share of ‘new products’ are an exception to this general pattern. These ‘random entries’ over the PS
are particularly interesting for industrial policy since they represent radical deviations from the initial
comparative advantage. In the final part of the paper, we investigate using parametric analysis the product and
provincial characteristics that determine these deviations from the PS pattern.
1 Corresponding Author: [email protected]. Address: Largo Abbazia Santa Scolastica, 70124 Bari, Italy
2
1. Introduction
Economies evolve over time in a dynamic process in which available resources are combined in order
to produce a bundle of products (production basket) which reflects the comparative advantages of
those economies. The process of structural change may take different paths according to whether
marginal or radical changes in the composition of production baskets occur over time.
A new wave of intellectual effort in the analysis of the process of economic development has placed
structural change at the core of the policy debate (McMillian and Rodrik 2011; Spence 2011, Stiglitz
et al. 2013). As in early contributions (Kuznets, 1966), structural change is seen as a pre-condition
for sustained economic growth and development since economic wealth strictly depends on the
economic structure and sophistication of the production basket.2 In particular, the Product Space (PS)
framework developed in recent seminal works by economists and physicists suggests that the
evolution of the production basket is strongly characterized by path dependence (Hausmann and
Klinger, 2007; Hidalgo et al. 2007). These authors represent economies as sets of productive
capabilities that can be combined in different ways to produce different products. Countries
progressively change their production baskets and move towards goods that require capabilities that
are already at their disposal or easily obtained; on the contrary, radical structural change rarely
happens.3
Since capabilities cannot be easily identified, measured and observed, these authors employ an
‘agnostic approach’ and use an outcome-based measure which relies on the idea that if two goods are
‘related’ (i.e. produced and exported in tandem), they use production factors that are ‘common’.
Unrelated goods, i.e. those goods that are unlikely to be produced and exported by the same country,
do not share a similar set of productive factors.
2 An important difference between this wave of ‘structural economics’ and the early one is rooted in the role of the State and normative implications in general. The first wave of structural economics was based on a firm belief that structural differences were essentially the result of market failures which required pervasive and often highly distortionary Government interventions. This ‘dirigiste dogma’ led to the widespread adoption of quantitative restrictions to international trade flows and the heavy use of currency manipulations which caused several crises that paved the way to another extreme, the ‘market dogma’. The new wave of structural economics can be seen as a ‘market-State’ blend that is perfectly represented by the words of one of its main exponents, Justin Yifu Lin “the market should be the basic mechanism for resource allocation, but that government must play an active role in coordinating investments for industrial upgrading and diversification and in compensating for externalities generated by first movers in the dynamic growth process” (Lin, 2012).3Boschma et al (2015) using a similar approach introduce the concept of technological space and show that the acquisition of new technological capabilities in 366 US cities is more likely if related technologies have already been acquired. This result suggests that a strong path-dependence not only affects the introduction of new products but also characterizes the development of local productive capabilities.
3
The ‘product space’ (PS) was first presented in Hausmann and Klinger (2007) and Hidalgo et al
(2007) as a network of relatedness between 774 globally produced and exported products. The
Product Space has been represented effectively using a map (reported in Figure 1) of global
production in which each node represents a product and connections between nodes represent the
degree of proximity between them.4 The authors assert that goods entering a country’s export basket
are those highly connected with the set of products that were previously exported. In addition, Hidalgo
et al (2007) argue that where a country's export basket is ‘located’ in the product space matters for
economic development. As new industries/specialization develop from existing ones, countries that
produce goods that are better connected are more likely to develop more sophisticated goods. On the
contrary, countries specialized in goods that are located in the periphery of the product space are more
likely to be trapped in development ‘dead corners’ and face higher difficulties in kick-starting new
more complex and sophisticated industries.5
Figure 1: Hidalgo et al (2007) - representation of the network of relatedness between goods
4 The proximity between each couple of goods is given by the minimum of the pairwise conditional probability of being co-exported. In other words, products are connected or related if they tend to be exported by the same economies. 5 Several contributions, starting from the work of Hausmann et al (2007), have shown that ‘what you produce matters!’, the complexity and sophisticatedness of what an economy produces enhances its future growth.
4
According to many observers, these recent contributions add new ‘weapons’ to the arsenal of
industrial policies since the network of relatedness provides a guide for policymakers in terms of
which products/sectors are likely to be successfully developed in a country or region (latent
comparative advantage). In fact, most industrial policies that aim to implement ambitious projects
have failed because of the existence of capability constraints to ‘big leaps’. In this light, the product
space poses limits to overoptimistic and ‘comparative advantage defying’ policies and suggests a
step-by-step approach featuring ‘small leaps’ toward these products where countries may have a latent
comparative advantage.
Although the product space framework has spurred considerable interest among the academia6 and
policymakers7, to date, to the best of our knowledge, there is no systematic empirical test which shows
whether the pattern of specialization of countries or regions follows its predictions.
The aim of the analysis performed in this work is to fill this gap by providing a new methodological
approach for testing the validity of one of the key hypotheses of the product space: specialization in
new products does not follow a random process, but is likely to occur in products that are strongly
related (or connected) to the ones that are already produced.
We develop a ‘dart-board’ approach which allows us to compare the actual short-term evolution of
the export baskets in 107 Italian provinces (NUTS 3 classification) with randomly generated
counterfactuals. After presenting the methodology, which can be easily applied to other
countries/regions in the world, we show that although the overall evolution of the Italian export basket
shows a significant degree of path-dependence – as predicted by the PS framework – more radical
changes do often occur. In order to assess the impact of the recent crisis, we identify two periods: i)
pre-crisis, 2002-2006; ii) crisis 2007-2011. Interestingly, we find evidence in both periods of a large
heterogeneity in terms of frequency of these ‘big leaps’ over the PS both across provinces (NUTS 3
areas) and across sectors (HS 6 trade classification).8
From a policy perspective, these deviations from the hypothesis of path-dependence are the most
interesting ones in our opinion. In fact, the development of products that are unrelated to the pre-
6 Cfr. next section for details. 7 Industrial policy is back in the agenda of many countries around the world. The framework developed by Hausmann et al. 2007 has received a great deal of attention from several countries which are seeking the support of experts – for instance, the Centre for International Development, CID, based at Harvard University and led by Ricardo Hausmann – to design their industrial strategies. The list of countries inspired by this approach is expanding and includes Albania, Colombia and Mexico, among others. 8 We find that the share of new goods that is statistically unrelated to the initial export basket ranges from a minimum of 17% in the province of Isernia in the crisis period to a maximum of 75% in the province of Siracusa in the pre-crisis period. Such heterogeneity is also confirmed between sectors: only 27% of new entries belonging to the textile sector are found to be unrelated against 83% for the mineral sector.
5
existing export basket signals the ability of the economic system to combine old and new capabilities
in a way that allows production to be diversified away from the static comparative advantage. As
argued in Castaldi et al (2015) in the context of regional innovation, technological breakthroughs are
the result of the combination of knowledge from ‘unrelated’ technological capabilities and allows
economies to follow new technological trajectories (Dosi 1982).
Some successful and rather emblematic ‘jumps’ over the PS network have been hotly discussed in
the development literature. The rise of the aircraft industry in Brazil and the automotive industry in
Korea are notable examples.9The rise of the 64 Kbit DRAM sector in Korea is another emblematic
case which defeats the gravity of the product space (Lin and Chang, 2009).10 In both cases, the role
played by public actors in supporting industrial competitiveness has been determinant. The product
space framework is not able to explain why these jumps occur; quite the contrary, the framework
predicts small-distance and gradual jumps toward related goods.
In the last part of our work, we show that there is a positive relationship between provincial economic
performance and the share of new products that are unrelated to the initial composition of the export
basket (in particular before the crisis period). We take the analysis a step further and investigate –
using probit models – which provincial features are associated with the likelihood of observing these
more radical structural changes. Our results show that the diversification of provincial productions
away from the initial comparative advantage is more likely the more sophisticated the initial
production basket is, the higher the mix of unrelated varieties produced and the more open and skilled
intensive provincial economies are.11
The remainder of the paper is structured as follows. In Section 2 we discuss recent contributions to
the economic literature on Product Space. Then, in Section 3 we describe the data and the
methodology used for computing the econometric strategy to test the product space theory on Italian
provinces. In Section 4, we present the main evidence of analysis and investigate the determinants of
path-dependency in the evolution of Product Space in Italy distinguishing the pre-crisis period from
crisis one. Finally, we conclude with some policy remarks.
9 Cfr. Altenburg (2011) 10 According to H.-J. Chang, such a successful production specialization decision supported by active industrial policy in Korea is the proof that defying a country’s comparative advantage (in that period the economy was mainly specialized in the production of labour intensive goods) allows ‘learnable-by-doing’ competences that then made Korea one of the major producers of electronic components to be developed. On the other hand, J.Y. Lin asserts that the kind of electronic components produced at that time in Korea did not require very high skills since 64 Kbit DRAM was no longer at the technology frontier (Lin and Chang, 2009). Transposing these two views to the context of the network of relatedness between goods implies either that an economy is able – under certain conditions – to specialize in products that are not very proximal to the pre-existing export basket or that the product space is dynamic and that links connecting nodes change over time. 11Using US patent citation data, Castaldi et al (2015) find that technological breakthrough – i.e. radical innovations – are more likely to happen in US states endowed with a large set of unrelated varieties.
6
2. Specialization and path-dependence: a brief review of the Product Space framework
The Product Space framework briefly outlined above provides a powerful prediction of path-
dependence in the evolution of countries or regional specialization over time. In fact, the inclusion of
new products in the export basket of an economy is likely to be strictly related to the pre-existing
specialization. The economic intuition is the following: products that are closely connected in the PS
(i.e. high degree of proximity) require a similar set of production capabilities. If an economy has a
comparative advantage in a given product, then it is relatively simple for that economy to also develop
a comparative advantage in products requiring the same set of capabilities.
In recent years, an increasing number of studies based on the PS framework have investigated the
existence of path-dependence in the process of structural transformation. As in the original
contribution by Hidalgo et al (2007), these studies generally use trade specialization – measured by
revealed comparative advantage - as a proxy of production specialization and analyse the pattern of
specialization across the PS over time.
An important contribution made by this approach is the evidence that countries at a different level of
development tend to be positioned differently in the PS. While industrialized countries are mainly
specialized in the production of ‘central goods’ i.e. goods with higher average connections to others
and higher sophisticatedness12, low income countries have most of their export baskets located in the
periphery of the Product Space. Hausmann and Klinger (2010) and Hidalgo (2012) show how the
export baskets of Ecuador and a pool of African countries (Kenya, Mozambique, Rwanda, Tanzania
and Zambia) respectively mostly consist of peripheral products and highlight a rather strong
persistence of position on the PS over time. Felipe et al. (2013a; 2013b) perform single country
analyses on a long-term perspective (from the 1960s to the 2000s) for two important emerging
economies, China and India. Their works suggests that the process of development in these two
countries is accompanied by a gradual and continuous increase in export sophisticatedness.
Further studies based on the product space approach have focused attention on the nexus between
centrality in the PS and trade diversification. Minondo (2011) in a study on a set of 91 countries
shows that the average connectedness of countries’ export baskets (i.e. the degree of centrality in the
PS) is a strong predictor of actual diversification level. In a related study, Boschma and Capone (2016)
analyse the process of trade diversification for EU-27 and European Neighbourhood Policy (ENP)
countries between 1995 and 2010. The authors find evidence of path-dependence as countries
12 The degree of sophisticatedness of a product is generally proxied by the ProdY index originally presented in Hausmann et al (2007). The ProdY index represents the productivity level associated with the production of a certain product and is defined as in Appendix A2.
7
developed revealed comparative advantage at time t in products related to those in which they were
already specialized at time t-3 / t-5.13
So far only a few contributions have analysed the pattern of trade diversification at the sub-national
level which is likely to be the most significant since capabilities are lumpy across space and have a
strong local dimension. Using US States data in the period 2002-2012, Donoso and Martin (2016)
show that only the local capabilities have a role in the path-dependence process of industrial structure
dynamics whereas the industrial structure at the national level has a negative effect on States’ export
diversification. The authors also find that the higher internal migration, firm cluster strength and R&D
spending over GDP are, the stronger the effect of current structure on the probability of diversifying
a State’s production. The importance of looking at sub-national areas is confirmed by the contribution
of Boschma et al (2013). The authors show that during the period 1988-2008, Spanish regions
diversified into those new sectors that were related to the existing set of industries. Moreover,
Boschma et al (2013) find strong evidence that capabilities available at the regional level played a
larger role than capabilities available at the country level in the emergence and development of new
industries
A small but growing number of works have investigated the path dependence of structural
transformation using firm level data (Neffke et al 2011; Cirera et al 2012; Lo Turco and Maggioni
2016). Using plant-level data for 70 Swedish regions in the period 1962-2002, Neffke et al (2011)
find evidence of path-dependence in the evolution of long-term production diversification since
industries that are technologically related to pre-existing ones have a higher probability of entering
the region’s production portfolio whereas unrelated ones have a higher probability of exiting.
Analogous results are found by Cirera et al (2012) in Brazil for the period 2000-2009. The authors
document that trade diversification mostly stems from related sectors. Diversification in sectors that
are unrelated to the pre-existing production basket is limited and mainly concerns vertically integrated
firms which specialize in one or few stages in a specific value chain.
Lo Turco and Maggioni (2016) using Turkish firm-level data show that the introduction of new
products by manufacturing firms is significantly higher if related products are produced by the same
firm or by other firms in the affected province. In this study, relatedness is also measured using
13 The authors use the ‘density’ measure developed by Hidalgo et al (2007) in their parametric analysis of the probability that (new) goods enter the export basket of a country, computed as the average proximity of a new potential product to a country’s current productive capability.
8
‘density’ variables à la Hidalgo et al (2007). The local set of available capabilities is important –
although less than internal (firm-specific) resources – in explaining what firms produce.14
All these studies confirm the importance of the set of available local capabilities in guiding the
evolution of the comparative advantage of countries and/or regions and in shaping the introduction
of new goods and products by firms. It is easier to produce new goods requiring capabilities that are
already present in the local economy rather than those requiring different sets of capabilities. In other
words, according to the capability approach, jumps over the Product Space are unlikely and the
process of structural change – measured as the evolution of the basket exported with revealed
comparative advantage – is path-dependent. These studies also suggest that it is important to consider
the geographical dimension of the changes in the production basket since capabilities are not
uniformly distributed within a country.
Although the contributions described above document a large extent of path-dependence in the
evolution of the production basket, these studies cannot be considered as a formal test of the PS
framework since they do not discriminate between the relatedness due to shared production
capabilities (as the framework suggests) and spurious relatedness which is the result of a random
process.
Our analysis – using different definitions of ‘relatedness’ and different ‘new entry’ identification
methods – aims at testing whether new products in Italian provinces are non-randomly related to those
previously exported with revealed comparative advantage. While other studies employ measures of
‘density’15 or ‘open-forest’ indexes à la Hausmann and Klinger (2007) for assessing path-
dependence, we develop a test for inferring whether new entries in the export basket are related in a
statistically significant way compared with randomly generated ones. The methodology developed in
the paper allows us to measure the extent to which structural change deviates from the hypothesis of
path dependence and, in turn, to shed light on the provincial characteristics that are significantly
associated with ‘big leaps’ over the PS (i.e. rather radical changes in the composition of the production
basket).
14 Using Chinese firm-level data, Poncet and Starosta de Waldemar (2013) show that ‘domestic capabilities’ matter not only for explaining what firms produce, but also for the growth enhancement effects of new products and new technologies. 15 Previous studies (e.g. Boschma et al, 2013; Boschma and Capone, 2016; Lo Turco and Maggioni, 2016; Donoso and Martin, 2016) have used measures of ‘density’ as a predictor of the entry of a given product that was not previously exported.
9
3. Data and Methodology
3.1. A general test of path-dependence: a dart-board approach
What countries/regions produce and export changes over time as new products enter the production
baskets. In this section our aim is to test - using Italian NUTS 3 data (provinces) - whether new
products that enter the export baskets at time 𝑡" are related à la Hidalgo et al (2007) with the pre-
existing comparative advantage at time 𝑡#. As in the seminal contribution of these authors, the
relatedness between any two products is measured using their proximity in the PS, i.e. the minimum
of the pairwise conditional probability of being co-exported.
We develop a ‘dart-board approach’ in order to test the non-randomness of the development of
provincial production space over time during the period 2002-201116. Given the important role that
the crisis played in re-shaping the provincial pattern of trade (see Coniglio et al 2016), we consider
separately the pre-crisis period (2002-2006) from the crisis one (2007-2011)17. For this purpose, we
select two base years as 𝑡# (2002 and 2007) and two as 𝑡" (2006 and 2011). We allow for a lag of 4
years between 𝑡# and 𝑡" in order to investigate short-term changes in the structure of provincial
production.18 Data on Italian provinces’ exports are provided by the A.D.ELE. Laboratory at 6-digit
whereas data on country exports used to create proximity matrixes are obtained from the
UNCOMTRADE dataset.
In the first step of our analysis we need to define ‘new entries’ as those goods that are not part of the
production basket at time 𝑡# and enter the provincial export basket at time 𝑡". We recur to the standard
definition of revealed comparative advantage (RCA) and define the set of goods in the export basket
as those with a Balassa index that is larger than 1; i.e. the ratio between the provincial export share
and the world export share for each good is higher than unity. More precisely, in our study a new
entry is a product with a RCA lower than 0.5 at 𝑡# and higher than unity at 𝑡".19 For each province𝑘 ∈
𝐾we identify the set of new entries𝑛 ∈ 𝑁* in both sub-periods.
16 Our approach has some similarity with the one employed by Duranton and Overman (2005) to measure the non-randomness of the geographical concentration of industrial plants in the UK. 17 Between the two sub-periods, four new provinces have been formed (in 2005), hence the total number of provinces used in the analysis is 103 and 107, respectively. We do not have data in both periods for three provinces which are excluded from the analysis (Barletta-Andria-Trani, Fermo and Monza-Brianza). 18 For robustness, different base and term years have been used and are available upon request from the authors. Note that the split of the two sub-periods reported in the paper is also preferred because it allows us to use the same nomenclature for international and national trade statistics (Harmonized System revisions H2 and H3 have been issued in 2002 and 2007 respectively) between 𝑡# and 𝑡" hence avoid the use of correspondence tables that may result in a less precise conversion of the data. 19 Since this choice of RCA thresholds is arbitrary, for robustness we identify a new entry using three additional alternative thresholds. We use one definition of a new entry that is less restrictive that the one presented in the paper (𝑅𝐶𝐴./ <1and𝑅𝐶𝐴.5 ≥ 1) and two definitions that are more restrictive, respectively 𝑅𝐶𝐴./ lower than 0.1 and lower than 0.2 and
10
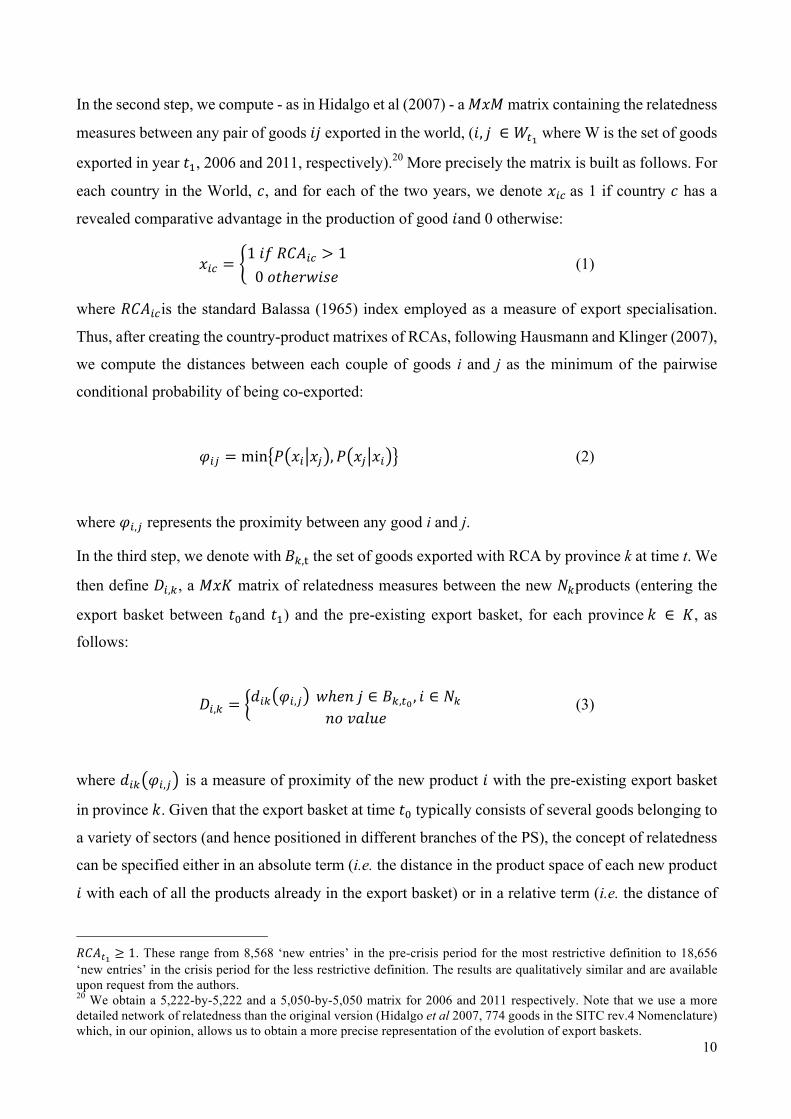
In the second step, we compute - as in Hidalgo et al (2007) - a 𝑀𝑥𝑀matrix containing the relatedness
measures between any pair of goods 𝑖𝑗 exported in the world, (𝑖, 𝑗 ∈ 𝑊.5where W is the set of goods
exported in year 𝑡", 2006 and 2011, respectively).20 More precisely the matrix is built as follows. For
each country in the World, 𝑐, and for each of the two years, we denote 𝑥>?as 1 if country 𝑐 has a
revealed comparative advantage in the production of good 𝑖and 0 otherwise:
𝑥>? =1𝑖𝑓𝑅𝐶𝐴>? > 10𝑜𝑡ℎ𝑒𝑟𝑤𝑖𝑠𝑒
(1)
where 𝑅𝐶𝐴>?is the standard Balassa (1965) index employed as a measure of export specialisation.
Thus, after creating the country-product matrixes of RCAs, following Hausmann and Klinger (2007),
we compute the distances between each couple of goods i and j as the minimum of the pairwise
conditional probability of being co-exported:
𝜑>K = min 𝑃 𝑥> 𝑥K , 𝑃 𝑥K 𝑥> (2)
where 𝜑>,K represents the proximity between any good i and j.
In the third step, we denote with𝐵*,P the set of goods exported with RCA by province k at time t. We
then define 𝐷>,*, a 𝑀𝑥𝐾 matrix of relatedness measures between the new 𝑁*products (entering the
export basket between 𝑡#and 𝑡") and the pre-existing export basket, for each province𝑘 ∈ 𝐾, as
follows:
𝐷>,* =𝑑>* 𝜑>,K 𝑤ℎ𝑒𝑛𝑗 ∈ 𝐵*,./, 𝑖 ∈ 𝑁*
𝑛𝑜𝑣𝑎𝑙𝑢𝑒 (3)
where 𝑑>* 𝜑>,K is a measure of proximity of the new product 𝑖 with the pre-existing export basket
in province 𝑘. Given that the export basket at time 𝑡# typically consists of several goods belonging to
a variety of sectors (and hence positioned in different branches of the PS), the concept of relatedness
can be specified either in an absolute term (i.e. the distance in the product space of each new product
𝑖 with each of all the products already in the export basket) or in a relative term (i.e. the distance of
𝑅𝐶𝐴.5 ≥ 1. These range from 8,568 ‘new entries’ in the pre-crisis period for the most restrictive definition to 18,656 ‘new entries’ in the crisis period for the less restrictive definition. The results are qualitatively similar and are available upon request from the authors. 20 We obtain a 5,222-by-5,222 and a 5,050-by-5,050 matrix for 2006 and 2011 respectively. Note that we use a more detailed network of relatedness than the original version (Hidalgo et al 2007, 774 goods in the SITC rev.4 Nomenclature) which, in our opinion, allows us to obtain a more precise representation of the evolution of export baskets.
11
new products relative to the overall pre-existing basket). For this reason, we employ three alternative
measures of relatedness:
Maximum proximity: 𝑑>*,W 𝜑>,K = 𝑚𝑎𝑥 𝜑>,K (4)
Average proximity: 𝑑>*,Y 𝜑>,K = Z[,\\
]^ (5)
Weighted Average proximity: 𝑑>*,_Y 𝜑>,K =
`ab\^,c/`ab\^,c/\
Z[,\\
]^ (6)
with 𝐽* being the number of goods in the export basket of province 𝑘 at 𝑡#. Equation (4) represents
relatedness of a new entrant product i with the set of products 𝐽* exported with revealed comparative
advantage at 𝑡# as the maximum value among the proximities between i and all 𝑗 ∈ 𝐽*; in other words,
distance is measured with respect to the closest product in the provincial product space that is already
exported. As an alternative, the measure computed using equation (5) identifies the distance as the
average proximity between good n and all the goods 𝑗 ∈ 𝐽*. Finally, equation (6) computes distance
as the weighted average proximity with weights represented by the export share of goods in 𝐽* at time
𝑡#.
The relatedness (or unrelatedness) of new products can be easily appreciated with a simple graphical
example. Figure 2 represents a subset of the export basket of a fictitious province at 𝑡# using a
simplified representation of the PS in which node A identifies a new product that enters the export
basket at 𝑡". In Panel A, the maximum proximity measure (eq. 4) is employed, thus the relevant pre-
existing product is the closest one. This measure represents an absolute dimension of proximity which
probably better captures the role of available capabilities in shaping the path-dependence of product
diversification. In Panel B, the relatedness takes into consideration all products exported with
revealed comparative advantage in time 𝑡# (respectively eq. 5 if no weights are employed and 6
otherwise). These two measures can provide information on the relative degree of proximity of new
entries.
12
Figure 1: Export basket subset of a fictitious province
Note: Blue dots represent products exported with RCA at time t0 while red ones represent new entrants at time t1.
Once new entries and proximities have been defined, the subsequent step is to perform a test that
allows us to reject the hypothesis that the new entries in province 𝑘 are randomly related to the initial
export basket of that province. Our idea is that if new entries are driven by path-dependence– as the
product space framework asserts – we should observe that the distribution of relatedness based on the
observed new entries (𝑁*) significantly differs from that of randomly generated new entries of
identical size. By drawing a parallel between the product space and a dartboard, each new entry is
equivalent to a dart and will be localized in a given place on the board. The actual data will tell us
where the 𝑛* ∈ 𝑁* darts are localized. Our test is based on the random draw – for 1,000 times and
for each k province– of a number of darts equal to 𝑁*and compares the resulting patterns with that
derived from the actual data. We then reject the null hypothesis of random localization on the board
when the actual draws produce a pattern that is different in a statistically significant way from the
random counterfactual.
In order to run our test, we implement a Kernel smoothed density estimation of relatedness of new
entries in provincial export baskets.21Like Duranton and Overman (2005), we estimate a smoothed
Kernel density function of relatedness for any level of proximity, 𝑑, defined as:
21 A vector of distances for each of the four definitions of new entries and for each alternative measure of relatedness is created in order to ensure the robustness of our results to the definition of these two key elements. In the paper, we only present, for the sake of brevity, the results for one definition of a new entry (𝑅𝐶𝐴./ < 0.5𝑎𝑛𝑑𝑅𝐶𝐴.5 ≥ 1).
13
𝐾 𝑑 ≡ "
h[,^i^j5
k[j5 l
𝑓 mnm[,^l
o*p"
q>p" (7)
with densities calculated non-parametrically using a Gaussian Kernel function with bandwidth h set
according to Silverman’s optimal rule of thumb (Silverman, 1986), where 𝑑>,* is measured using one
of the three alternative definitions of relatedness reported in eqs. (4)-(6) while Ii,k is a product by
province matrix of size 𝑀𝑥𝐾which has values of 1 for each new entrant product for each province
and 0 otherwise. Therefore, 𝐼>,*o*p"
q>p" is equal to the total number of new entries across all
provinces from 𝑡# to 𝑡".
Finally, we build a counterfactual distribution of relatedness and compare it with the actual one
obtained from eq. (7). The counterfactual density function is based on simulated relatedness computed
from 1,000 random draws of size 𝐼>,*o*p"
q>p" (total number of entries).22 More specifically, for
any value of proximity 𝑑 ∈ 0,1 , we rank the simulated kernel density values and obtain the 95th
percentiles in order to identify a 5% confidence threshold. If the kernel density estimation of our
actual data lies above the counterfactual’s threshold, for those proximities 𝑑 we can reject the
hypothesis of random relatedness. On the contrary, when the kernel density values of actual data fall
under the counterfactual’s threshold, we cannot reject the null hypothesis of random relatedness.
Following our discussion in Section 2, the prediction of the PS framework is a higher concentration
of actual kernel densities at higher values of proximities vis-à-vis the simulated ones (non-random
relatedness).
3.2. New entry in the export basket: a single product’s test of path-dependence
The methodology explained above allows us to test the ‘aggregate’ (or general) compliance of the
evolution of provincial specialization with the predictions of the product space framework. In this
section we describe a Monte-Carlo methodology which allows us to shift the analysis to each of the
new products that enters provinces’ export baskets at time 𝑡". For each Italian province𝑘 ∈ 𝐾, we
randomly draw, from the set of products that were not present in the export basket at time 𝑡#23,a
22 In every simulation, for each province we randomly draw a number of new entries from the products not in the basket at time 𝑡# which is identical to the number of effective ones. In other words, our counterfactual exercise takes explicit account of the province-specific distribution of new entries. 23 In other words, we draw random samples from all goods 𝑖 ∈ 𝑊.5 − 𝐵*,./ , where 𝑊 is the set of all goods exported in the world at time 𝑡" with 𝑡" = 2006,2011.
14
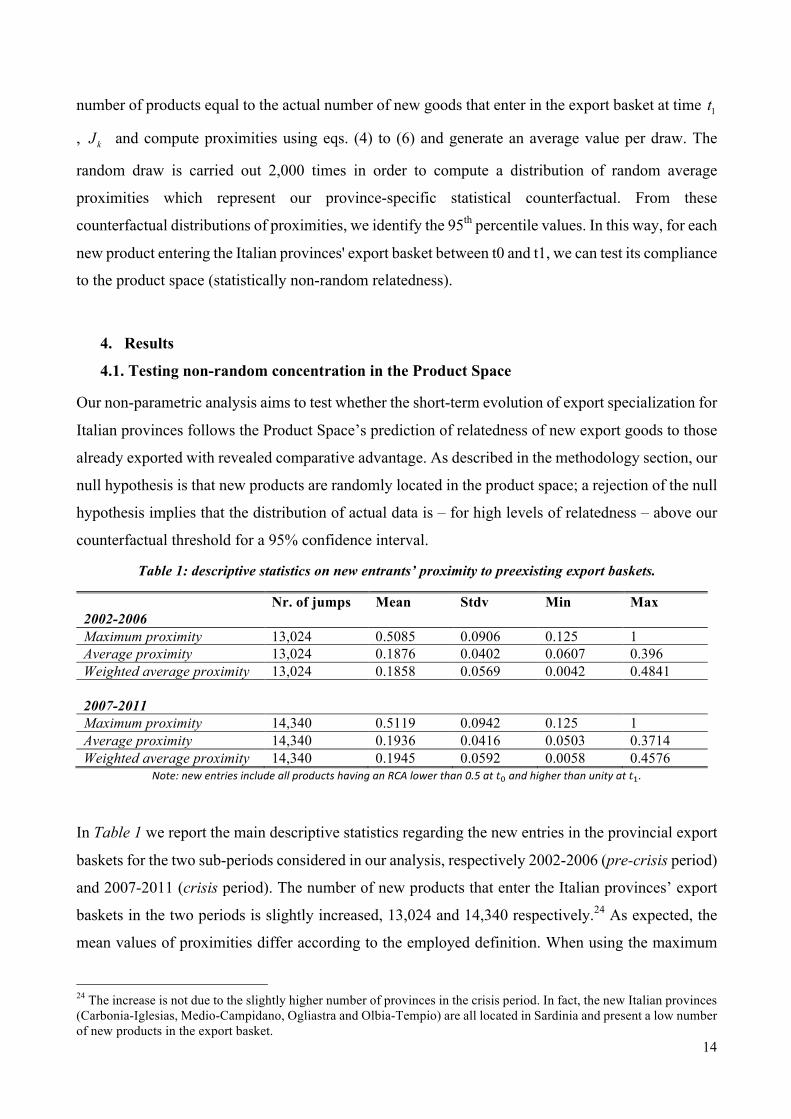
number of products equal to the actual number of new goods that enter in the export basket at time 1t
, kJ and compute proximities using eqs. (4) to (6) and generate an average value per draw. The
random draw is carried out 2,000 times in order to compute a distribution of random average
proximities which represent our province-specific statistical counterfactual. From these
counterfactual distributions of proximities, we identify the 95th percentile values. In this way, for each
new product entering the Italian provinces' export basket between t0 and t1, we can test its compliance
to the product space (statistically non-random relatedness).
4. Results
4.1. Testing non-random concentration in the Product Space
Our non-parametric analysis aims to test whether the short-term evolution of export specialization for
Italian provinces follows the Product Space’s prediction of relatedness of new export goods to those
already exported with revealed comparative advantage. As described in the methodology section, our
null hypothesis is that new products are randomly located in the product space; a rejection of the null
hypothesis implies that the distribution of actual data is – for high levels of relatedness – above our
counterfactual threshold for a 95% confidence interval.
Table 1: descriptive statistics on new entrants’ proximity to preexisting export baskets.
Nr. of jumps Mean Stdv Min Max 2002-2006 Maximum proximity 13,024 0.5085 0.0906 0.125 1 Average proximity 13,024 0.1876 0.0402 0.0607 0.396 Weighted average proximity 13,024 0.1858 0.0569 0.0042 0.4841 2007-2011 Maximum proximity 14,340 0.5119 0.0942 0.125 1 Average proximity 14,340 0.1936 0.0416 0.0503 0.3714 Weighted average proximity 14,340 0.1945 0.0592 0.0058 0.4576
In Table 1 we report the main descriptive statistics regarding the new entries in the provincial export
baskets for the two sub-periods considered in our analysis, respectively 2002-2006 (pre-crisis period)
and 2007-2011 (crisis period). The number of new products that enter the Italian provinces’ export
baskets in the two periods is slightly increased, 13,024 and 14,340 respectively.24 As expected, the
mean values of proximities differ according to the employed definition. When using the maximum
24 The increase is not due to the slightly higher number of provinces in the crisis period. In fact, the new Italian provinces (Carbonia-Iglesias, Medio-Campidano, Ogliastra and Olbia-Tempio) are all located in Sardinia and present a low number of new products in the export basket.
15
proximity, the ‘distance’ between the new products and the initial specialization is lower. When using
the relative measured of proximity (eqs. 5-6), these distances are higher since the proximity is
computed with respect to all goods exported with a RCA larger than unity at time 𝑡#. Interestingly,
from Table 1 it is clear that the mean values of proximities – regardless of the definition of new
products or the measure of proximity adopted – increase during the second sub-period. It is important
to note that we cannot infer evidence of increasing relatedness from this change in average levels of
proximities since the network structure of the provincial baskets is different in the two sub-periods.
For this reason, a methodology that explicitly takes into account how provincial export baskets evolve
is fundamental for testing the dynamics of specialization.
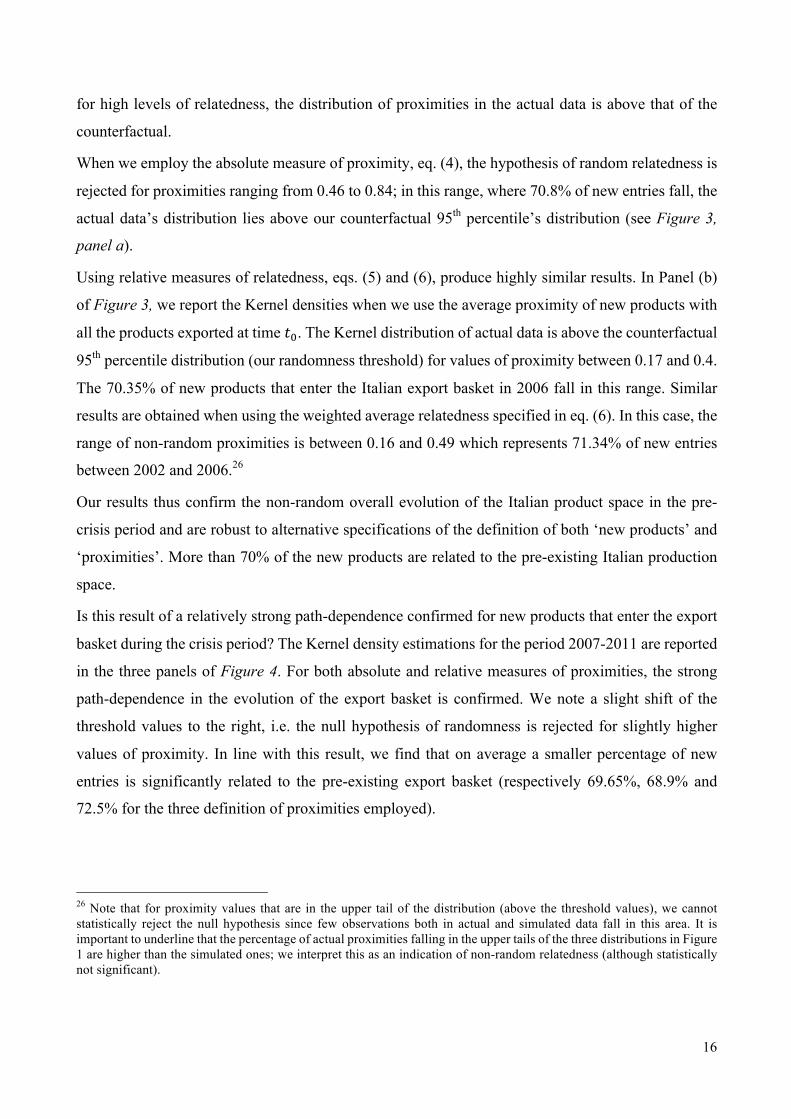
Figure 3: Kernel Density estimates for actual data and counterfactuals in the pre-crisis period.
Figure 3 represents the Kernel smoothed density estimates for our three definitions of proximity in
the sub-period 2002-2006.25 The horizontal axis measures the proximity between new products at 𝑡"
and the bundle of goods exported at time 𝑡#. The higher the value of our measure of proximity is, the
closer the new entrant product to the export basket at time 𝑡#. In all these estimates, we can see that
25 For both sub-periods, we report the figures representing the Kernel density distributions for the alternative identification strategies of new entries in Appendix A1. The results confirm the findings reported in this paragraph.
16
for high levels of relatedness, the distribution of proximities in the actual data is above that of the
counterfactual.
When we employ the absolute measure of proximity, eq. (4), the hypothesis of random relatedness is
rejected for proximities ranging from 0.46 to 0.84; in this range, where 70.8% of new entries fall, the
actual data’s distribution lies above our counterfactual 95th percentile’s distribution (see Figure 3,
panel a).
Using relative measures of relatedness, eqs. (5) and (6), produce highly similar results. In Panel (b)
of Figure 3, we report the Kernel densities when we use the average proximity of new products with
all the products exported at time 𝑡#. The Kernel distribution of actual data is above the counterfactual
95th percentile distribution (our randomness threshold) for values of proximity between 0.17 and 0.4.
The 70.35% of new products that enter the Italian export basket in 2006 fall in this range. Similar
results are obtained when using the weighted average relatedness specified in eq. (6). In this case, the
range of non-random proximities is between 0.16 and 0.49 which represents 71.34% of new entries
between 2002 and 2006.26
Our results thus confirm the non-random overall evolution of the Italian product space in the pre-
crisis period and are robust to alternative specifications of the definition of both ‘new products’ and
‘proximities’. More than 70% of the new products are related to the pre-existing Italian production
space.
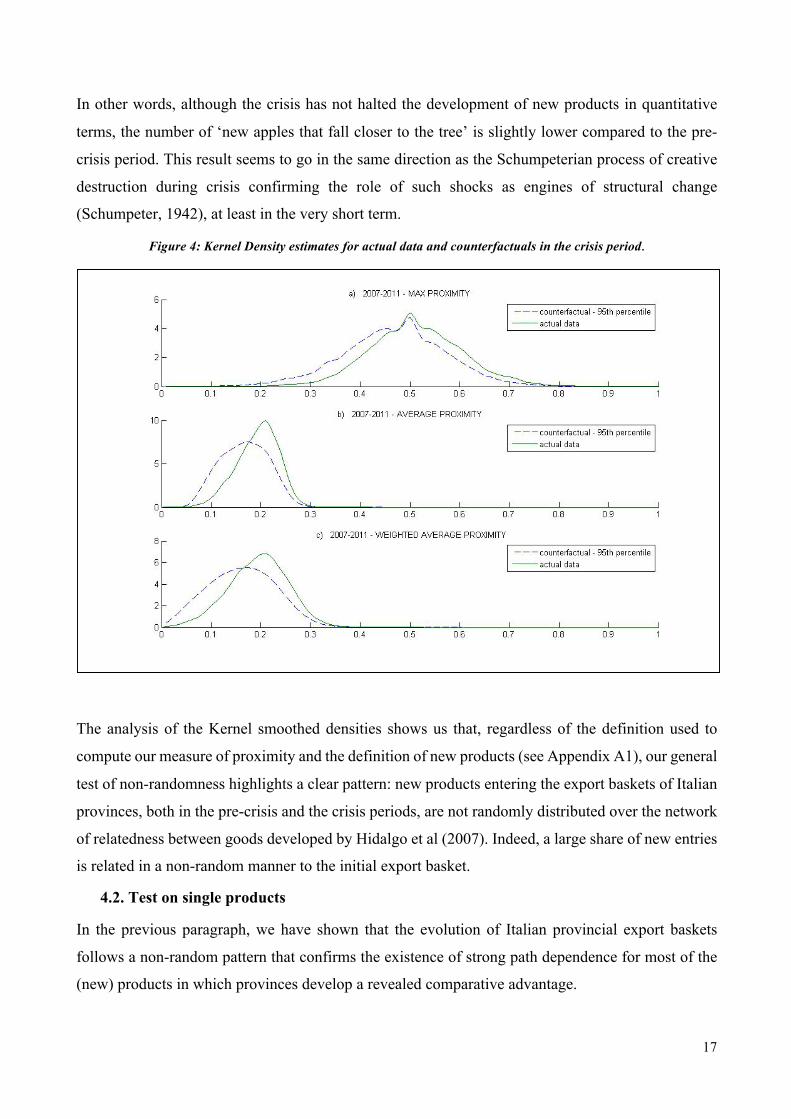
Is this result of a relatively strong path-dependence confirmed for new products that enter the export
basket during the crisis period? The Kernel density estimations for the period 2007-2011 are reported
in the three panels of Figure 4. For both absolute and relative measures of proximities, the strong
path-dependence in the evolution of the export basket is confirmed. We note a slight shift of the
threshold values to the right, i.e. the null hypothesis of randomness is rejected for slightly higher
values of proximity. In line with this result, we find that on average a smaller percentage of new
entries is significantly related to the pre-existing export basket (respectively 69.65%, 68.9% and
72.5% for the three definition of proximities employed).
26 Note that for proximity values that are in the upper tail of the distribution (above the threshold values), we cannot statistically reject the null hypothesis since few observations both in actual and simulated data fall in this area. It is important to underline that the percentage of actual proximities falling in the upper tails of the three distributions in Figure 1 are higher than the simulated ones; we interpret this as an indication of non-random relatedness (although statistically not significant).
17
In other words, although the crisis has not halted the development of new products in quantitative
terms, the number of ‘new apples that fall closer to the tree’ is slightly lower compared to the pre-
crisis period. This result seems to go in the same direction as the Schumpeterian process of creative
destruction during crisis confirming the role of such shocks as engines of structural change
(Schumpeter, 1942), at least in the very short term.
Figure 4: Kernel Density estimates for actual data and counterfactuals in the crisis period.
The analysis of the Kernel smoothed densities shows us that, regardless of the definition used to
compute our measure of proximity and the definition of new products (see Appendix A1), our general
test of non-randomness highlights a clear pattern: new products entering the export baskets of Italian
provinces, both in the pre-crisis and the crisis periods, are not randomly distributed over the network
of relatedness between goods developed by Hidalgo et al (2007). Indeed, a large share of new entries
is related in a non-random manner to the initial export basket.
4.2. Test on single products
In the previous paragraph, we have shown that the evolution of Italian provincial export baskets
follows a non-random pattern that confirms the existence of strong path dependence for most of the
(new) products in which provinces develop a revealed comparative advantage.
18
Our global test of non-random relatedness also reveals that a significant share of new products - over
30% - defeats the ‘static’ comparative advantage contrary to the product space framework’s dictates.27
In our opinion, these ‘apples that fall far from trees’ are probably the most interesting ones for
informing the current debate on structural change and industrial policy. It is thus interesting to analyse
whether there are any province- or product-specific characteristics that are systematically associated
with these ‘long distance’ jumps over the product space of Italian provinces.
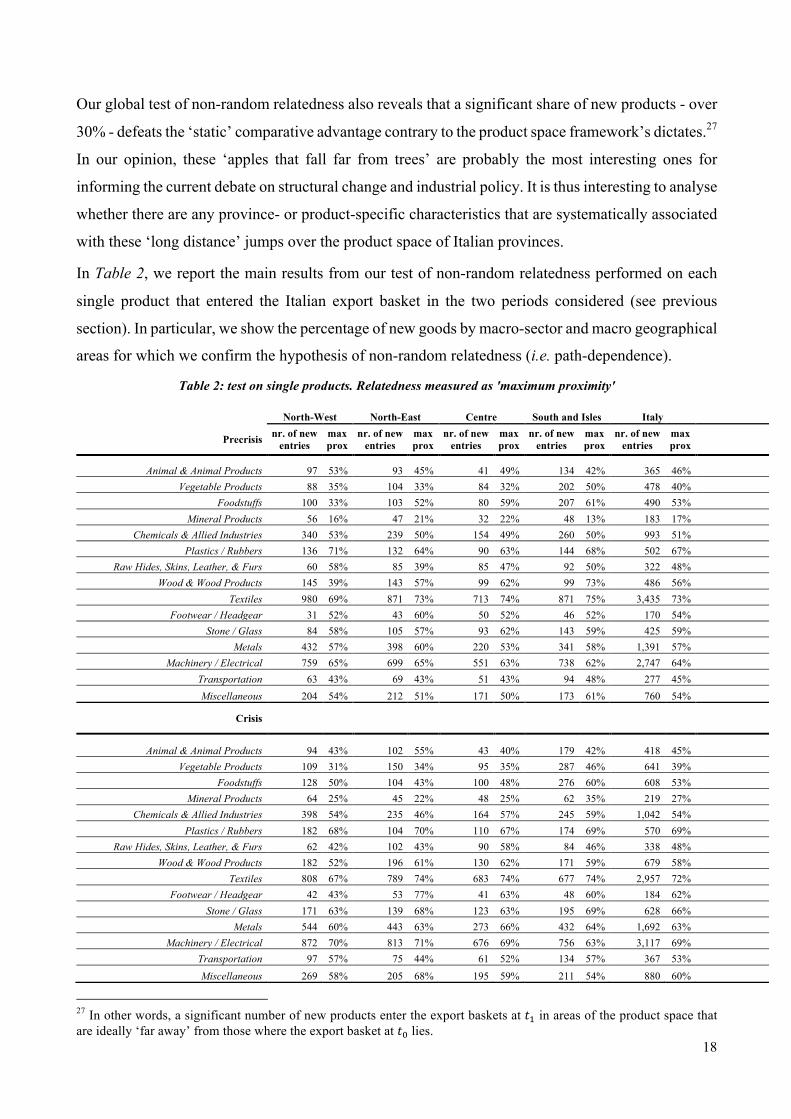
In Table 2, we report the main results from our test of non-random relatedness performed on each
single product that entered the Italian export basket in the two periods considered (see previous
section). In particular, we show the percentage of new goods by macro-sector and macro geographical
areas for which we confirm the hypothesis of non-random relatedness (i.e. path-dependence).
Table 2: test on single products. Relatedness measured as 'maximum proximity'
North-West North-East Centre South and Isles Italy
27 In other words, a significant number of new products enter the export baskets at 𝑡" in areas of the product space that are ideally ‘far away’ from those where the export basket at 𝑡# lies.
19
The results in Table 2 highlight a heterogeneous pattern through HS sections and Italian macro-
regions. The percentages reported represent the number of products for which the null hypothesis of
random relatedness is rejected over the total number of new entries for each region and each product
section. The higher the share, the more a provincial export basket follows a path-dependent pattern.
Textile products are, on average, those with the highest number of new entries and percentages of
randomness rejection, irrespective of the region that is taken into account (overall ratio of 73 and 72%
in the pre-crisis and crisis periods, respectively). High frequencies of new entries are recorded also
for machinery and electrical products with a total number of new entries increasing in the second sub-
period from 2,747 to 3,117. In this sector, the degree of path-dependence is also quite high and the
percentage of relatedness ranges from 62% in the pre-crisis period for southern provinces to 71% in
the crisis period for north-eastern provinces. A low degree of path-dependence is found, as expected,
given the weak role of local capabilities in resource extractive industries, for mineral products (17
and 27% in pre-crisis and crisis periods, respectively). Heterogeneity within sectors is evident in food
industries during the 2002-2006 period; results show path dependence for 33% of products entering
the export basket of north-western provinces with 61% for southern regions. A similar outcome is
shown – for the crisis period – in the Footwear section for which we find 43% of related entries for
the provinces in the north-west and 77% for north-eastern regions.
The high degree of heterogeneity highlighted in Table 2 suggests that the characteristics of local
economies – as well as product specificities – play an important role in influencing the pattern of
structural change.
4.3. Which provinces ‘defeat’ the static comparative advantage? A probit analysis
What economies produce matters for growth as emphasized by previous studies.28 The production
basket, but also its evolution, crucially depend on local capabilities. In this section, we focus on a
particularly important research question: which factors drive more radical (unrelated) changes in the
composition of production baskets? Figure 5 shows the positive relationship between provincial per
capita growth rate and the share of random entries in the analysed period. Provinces whose production
baskets have diversified into unrelated areas of the PS experienced on average better economic
performance, in particular before the (exogenous) shock of the global crisis.
28 We refer the reader to studies cited in Section 2. See also Coniglio et al. (2016) for a detailed analysis of provincial growth and sophistication in Italy.
20
Figure 5: Unrelated entries and economic growth
Note: The scatter plot representing the nexus between the percapita GVA growth and the share of random entries measured as the export value of random entries over the export value of the products exported with revealed comparative advantage. We implement a parametric analysis, by means of a probit model, with the aim of investigating which
factors are associated with a higher ability of provinces to diversify away from the initial comparative
advantage in the pre-crisis and crisis periods.29
Our dependent variable, random_entry, is a dummy which is equal to 1 if the new product i entering
the production space of province k at time t1 is statistically unrelated to pre-existing economic as
defined in the previous section, and 0 otherwise. We define new entries using our absolute measure
of distance as defined in eq. (4), i.e. maximum proximity. Our estimated model is the following:
29 The test will be on data with distances measured as the maximum among the proximities between new entrant goods and those present in the export basket at time t0. Among the three methods, this is the one that has an interpretation that is closer to geographical distance.
21
where 𝑋* includes our main province-level covariates, 𝑍> includes product-level controls and 𝐼𝑁𝐷>
is a set of (macro)sector fixed effects.30
We employ the measure developed by Hausmann et al (2007), ExpY, as a proxy for the level of
sophisticatedness of the export basket 31.We expect that the more complex the degree of
sophisticatedness of the production basket is, the higher the probability there will be more radical
changes. In fact, since more complex goods require a broader set of capabilities, it would be relatively
easier in these economies to redeploy these capabilities in order to develop new unrelated products.
Following Boschma and Iammarino (2009), we include a measure of export diversification variety in
our specification as defined in Frenken (2007).32 We expect more differentiated economies producing
a large number of varieties to be endowed with a relatively larger and broader set of production
capabilities which allows the provincial economy to diversify away from the initial production basket.
This positive association is expected to be stronger the higher the diversity in terms of unrelated
varieties that presumably use different local capabilities (as in Castaldi et al (2015) in the context of
the emergence of technological breakthroughs). Conversely, economies that are diversified within a
specific sector may experience a ‘lock-in’ effect which hampers diversification into other areas of the
PS. To this purpose, we include measures for related and unrelated variety in some specifications.
Moreover, we include the variables trade openness to control for the provincial exposure to
international trade and international knowledge transfers which may affect the ability of the provincial
economy to diversify its production bundle ‘away’ from the pre-existing one. Finally, as a proxy of
human capital, we also include a variable measuring the number of students enrolled in tertiary
education over the total active population.
Our specifications include two product-level controls. First, we include ProdY as a proxy of the
sophisticatedness of the new products that enter the provincial production basket at time t1. Second,
a measure of the ‘centrality’ of the new products in the network of relatedness – equals to its average
proximity - is included. Both measures, together with the macro-industry fixed effects, capture
product-specific characteristics which affect the dependent variable, but are unrelated to provincial
features (our main variables of interest).
30 We include industrial sectors’ fixed effects using the 21 Sections of HS nomenclature in order to consider heterogeneity across macro industries. All province-specific variables refer to the year t_0 whereas all product-specific variables refer to year t_1. 31 Index of export basket sophistication by Hausmann et al (2007). It is computed as the weighted sum of ProdYs of the products exported by a province with weights represented by the export shares. For ProdY’s definition, see note 25. For details, see Appendix A2. 32 In order to simplify the interpretation of results, we include all the ‘diversification’ indexes in logarithms. Such measures are computed as reported in Appendix A2.
22
Descriptive statistics of the dependent variable and covariates for both the pre-crisis and crisis periods
In Table 4 the marginal effects of the probit regressions are reported separately for the two sub-
periods, pre-crisis and crisis. In Models 1 and 5, we employ a parsimonious model of the probability
of unrelated new entries where we include our measure of overall provincial export basket
sophisticatedness, ExpY (in log), and a measure of production diversification,Variety(in log),
controlling for industry and product fixed effects. As expected, provinces characterized by a higher
degree of sophisticatedness are found to be positively associated with the probability of experiencing
more radical structural changes in the composition of the export basket. We interpret this result as
further evidence of the important role of the ‘complexity’ of what economies produce and export;
23
complexity has a direct effect on growth performance (Haussmann et al 2007), but also an effect on
the ability of an economy to diversify away from the initial comparative advantage.
It is interesting to note that the magnitude of the effect is rather stable in the considered time span and
slightly smaller during the crisis period. Furthermore, we find a weak positive effect of the degree of
export diversification (LnVariety) on the probability of unrelated new entries only in the pre-crisis
period. In models 2 and 6, we test for heterogeneous effects of related versus unrelated varieties. We
find that only the number of unrelated varieties is positively associated with the probability of
unrelated new entries. On the contrary, a higher provincial diversification within the same macro-
sector (i.e. product diversification within a 4-digit sector) is negatively associated with unrelated
entries in the provincial export basket. This result is strong evidence of the lock-in effect that ‘dense’
sectoral specialisation may represent. For instance, the presence of consolidated industrial districts
may hamper the diversification of the provincial economy over the PS. In the ascendant phase of
development of a district, this path dependence may reinforce growth, but in the maturity or decline
phases, this pattern may represent a less desirable feature of the local economy.
In the specifications reported in columns 3-4 and 7-8, we introduce two additional covariates, tertiary
education (a proxy for provincial human capital) and provincial international trade openness. It is
interesting to observe that openness to trade and (although less strongly) a larger endowment of
human capital are positively associated with the probability of unrelated new entries only in the period
of crisis. Intuitively, a larger market access amplifies the value of producing and the ability to adapt
to new products. The effect may also be driven by the presence of high-productivity firms in more
open economies which are in turn more able to react to market difficulties by diversifying
production.33 Neffke et al (2014) show that firms with a higher degree of internationalization
represent crucial agents of structural change since non-local firms and entrepreneurs tend to diversify
in sectors that are less related to pre-existing regional production bundles.
33 Recent contributions in the international trade literature have emphasized the structural differences between firms exporting and investing abroad and purely domestic ones in terms of productivity, wages, size, mark-ups and other crucial firm-level characteristics (Melitz 2003; Melitz and Ottaviano, 2008; Bernard et al 2007).
24
Table 4. Dependent variable: probability of experiencing a random new entry.
Relatedness measured as the maximum proximity between new entry and export basket at time 𝒕𝟎. 2002-2006 2007-2011 (1) (2) (3) (4) (5) (6) (7) (8) VARIABLES margin margin margin margin margin margin margin margin
Standard errors in parentheses *** p<0.01, ** p<0.05, * p<0.1
25
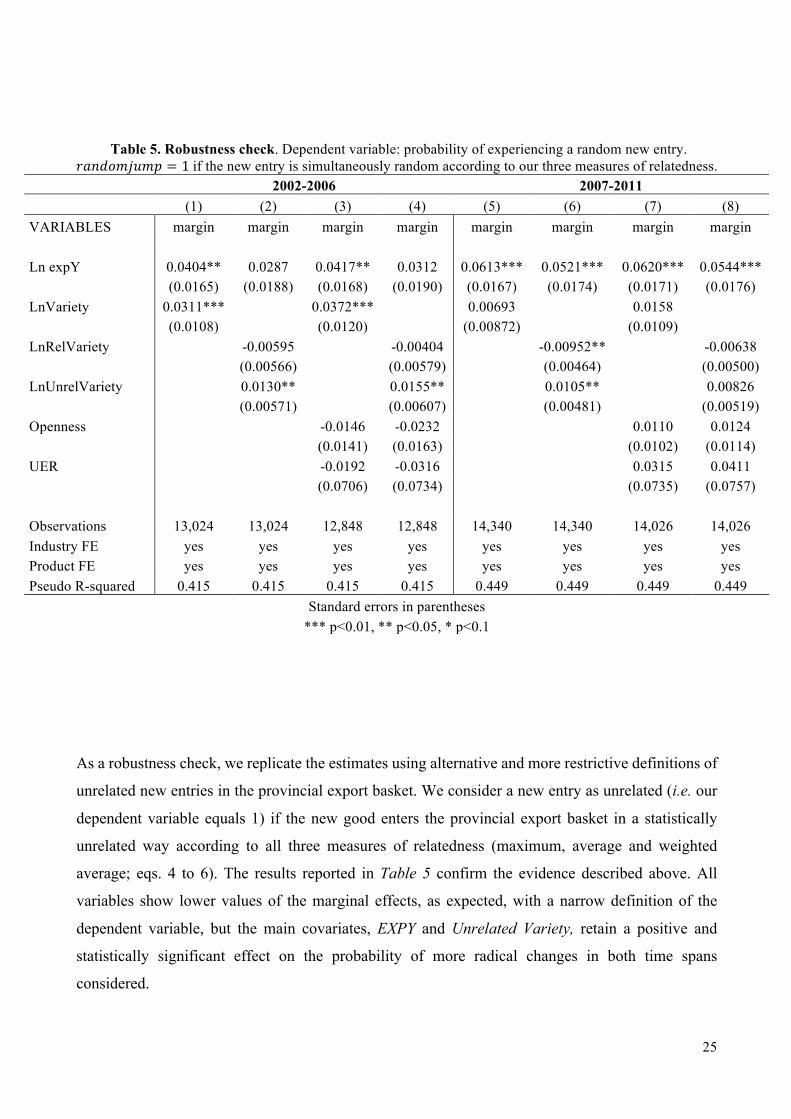
Table 5. Robustness check. Dependent variable: probability of experiencing a random new entry.
𝑟𝑎𝑛𝑑𝑜𝑚𝑗𝑢𝑚𝑝 = 1if the new entry is simultaneously random according to our three measures of relatedness. 2002-2006 2007-2011 (1) (2) (3) (4) (5) (6) (7) (8) VARIABLES margin margin margin margin margin margin margin margin
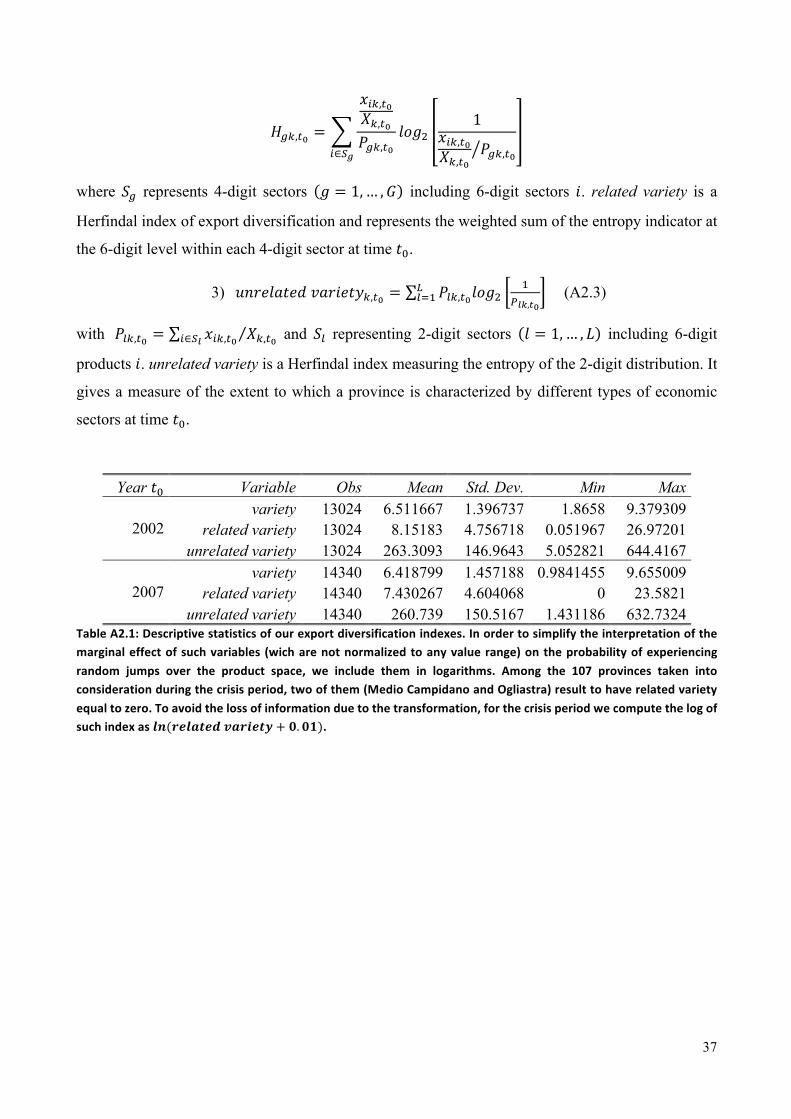
TableA2.1:Descriptivestatisticsofourexportdiversificationindexes.Inordertosimplifytheinterpretationofthemarginaleffectofsuchvariables (wicharenotnormalizedtoanyvaluerange)ontheprobabilityofexperiencingrandom jumps over the product space, we include them in logarithms. Among the 107 provinces taken intoconsiderationduringthecrisisperiod,twoofthem(MedioCampidanoandOgliastra)resulttohaverelatedvarietyequaltozero.Toavoidthelossofinformationduetothetransformation,forthecrisisperiodwecomputethelogofsuchindexas𝒍𝒏(𝒓𝒆𝒍𝒂𝒕𝒆𝒅𝒗𝒂𝒓𝒊𝒆𝒕𝒚 + 𝟎. 𝟎𝟏).