Page 1
ORIGINAL PAPER
The patterns of Corylus and Alnus pollen seasonsand pollination periods in two Polish cities locatedin different climatic regions
Małgorzata Puc • Idalia Kasprzyk
Received: 21 May 2012 / Accepted: 5 March 2013 / Published online: 14 March 2013
� The Author(s) 2013. This article is published with open access at Springerlink.com
Abstract This study compares phenological obser-
vations of Corylus (hazel) and Alnus (alder) flowering
with airborne pollen counts of these taxa recorded
using volumetric spore traps (2009–2011). The work
was carried out in the Polish cities of Szczecin and
Rzeszow that are located in different climatic regions.
Correlations between pollen concentrations and mete-
orological data were investigated using Spearman’s
rank correlation analysis. The timings of hazel and
alder pollination and the occurrence of airborne pollen
varied greatly and were significantly influenced by
meteorological conditions (p \ 0.05). The flowering
synchronization of hazel and alder pollination in
Szczecin and Rzeszow varied over the study period.
Hazel and alder trees flowered notably earlier in stands
located in places that were exposed to sunlight
(insolated) and sheltered from the wind. On the other
hand, a delay in the timing of pollination was observed
in quite sunny but very windy sites. In Rzeszow,
maximum hazel pollen concentrations did not coin-
cide with the period of full pollination (defined as
between 25 % hazel and alder and 75 % of flowers
open). Conversely, in Szczecin, the highest hazel
pollen concentrations were recorded during pheno-
phases of the full pollination period. The period when
the highest alder pollen concentrations were recorded
varied between sites, with Rzeszow recording the
highest concentrations at the beginning of pollination
and Szczecin recording alder pollen throughout the
full pollination period. Substantial amounts of hazel
and alder pollen grains were recorded in the air of
Rzeszow (but not Szczecin) before the onset of the
respective pollen seasons.
Keywords Corylus � Alnus � Phenology �Pollination � Pollen season � Poland
1 Introduction
The presence of pollen in the air at a particular place is
the result of interactions between factors that affect the
formation of inflorescences, pollination, and the
transport of pollen in the atmosphere. The proportion
of a pollen-producing taxon in the vegetation of a
particular region and the response of this taxon to
weather conditions are the most important factors
determining temporal variations in pollen concentra-
tions in the atmosphere (Aboulaıch et al. 2008;
Guardia and Belmonte 2004; Jato et al. 2007a, b;
Sugita et al. 2010). Knowledge of these relationships
M. Puc (&)
Department of Botany and Nature Conservation,
University of Szczecin, Felczaka 3c, 71-412 Szczecin,
Poland
e-mail: [email protected]
I. Kasprzyk
Department of Environmental Biology, University of
Rzeszow, Zelwerowicza 4, 35-601 Rzeszow, Poland
e-mail: [email protected]
123
Aerobiologia (2013) 29:495–511
DOI 10.1007/s10453-013-9299-x
Page 2
helps the interpretation of aerobiological data and
allows the construction of more accurate models for
predicting concentrations of allergenic pollen in the
air.
Hazel (Corylus L.) and alder (Alnus Mill.) trees are
common throughout Poland. Both genera belong to the
Fagales Engl. order and the Betulaceae S. F. Gray
family, which also includes Betula and Carpinus (APG
II 2003). In Europe, the Corylus pollen type includes
three species that are morphologically similar (Corylus
avellana L., C. colurna L., and C. maxima Mill.). Hazel
is absent from the northernmost parts of Europe and
from some coastal regions of southern Europe, partic-
ularly the Iberian and Balkan Peninsulas. C. avellana is
the most widespread species of hazel and is present
across almost the whole of Europe, occurring as far
south as the Caucasus Mountains and the Crimean
Peninsula. C. avellana occurs in natural habitats
throughout Poland; it is common in forests and
clearings, including the lower montane forest zone.
C. avellana prefers sunny sites, temporarily or period-
ically shaded and grows on a wide variety of soils: dry
to moist and fertile; humid-mineral to sandy clay; stony
clay. It is a very tolerant species with regard to light
conditions and can grow well even in shaded sites. It
plays an important role in biocoenosis—it provides
shaded conditions for soil formation, to which it
contributes easily decomposing litter; it also supplies
nuts for rodents and birds to consume (Senata 1991).
The occurrence of C. colurna and C. maxima is
restricted to certain areas of south-eastern Europe
(Jalas and Suominen 1988; Bugała 2000). However,
Corylus colurna (Turkish hazel) is widely cultivated as
an ornamental tree in Europe and is seen in many cites
of Poland. It is very tolerant of difficult growing
conditions in urban situations, which has increased its
popularity in urban planting schemes in recent decades
(Stachak et al. 2000).
Four species of alder occur in Europe: (1) Alnus
glutinosa (L.) Gaerther; (2) A. incana (L.) Moench.;
(3) A. viridis (Chaix) DC. in Lam. & DC.; and (4)
A. cordata (Loisel.) Loisel. The latter occurs only in
Corsica and in south-western Italy (Huntley and Birks
1983). In Poland, the genus Alnus Mill. is represented
by three species. Two are trees, A. glutinosa and
A. incana, and the third (A. viridis) is a small shrub
confined to the Bieszczady Mountains. The ranges of
each of the three species of alder in Poland are
different. Apart from quite important geographical
variations, there are also some ecological differences.
A. glutinosa is common throughout the country, but it
avoids higher altitudes in the mountains. A. incana is
less common; it is mainly situated in southern Poland
and along the course of the Vistula River (Zajac and
Zajac 2001). Both species occur on mineral and
organic soils, but the natural and semi-natural tree-
stands of A. glutinosa grow on peaty soils. On the other
hand, A. incana demands mainly young alluvial soils.
They display a similar range of soil requirements in
regard to acidity and moisture, although A. incana is
able to tolerate lower moisture conditions. Both
species are characterised by a tolerance of consider-
able fluctuations of water level. A. glutinosa and
A. incana can be regarded as pioneer plants easily
occupying new or previously disturb habitats. If grown
in the same habitat, A. incana flowers several days to
3 weeks prior to A. glutinosa (Pancer-Kotejowa and
Zarzycki 1980).
In Poland, in addition to hazel pollen, alder pollen is
considered to be the most important cause of airborne
allergy diagnosed at the beginning of the growing
season. Pollen concentrations are high, and they often
exceed the threshold values causing allergy symptoms
(Rapiejko et al. 2004; Puc 2007; Weryszko-Chmie-
lewska and Rapiejko 2007; Kaszewski et al. 2008).
The high degree of cross-reactivity between the major
allergens in hazel and the major allergens in other
members of the Betulaceae family (i.e. alder and
birch) means that it is important to monitor this pollen
type even though atmospheric concentrations of hazel
pollen are usually considerably lower (Puc 2003a, b;
D’Amato et al. 2007).
In Poland, hazel and alder are the first pollen grains
to appear in the air. The onset of pollen seasons and the
overall curve of the pollen season largely depend on
meteorological conditions before and during pollen
release. Hazel and alder set male inflorescences in late
summer in the year preceding pollination and a period
of dormancy, called the chilling period, are required to
enter a new growing cycle. After the dormancy period,
the plant is ready to begin growth processes, but this
coincides in time with a period of low or subzero
temperatures that are adverse to growth. The forced
dormancy period lasts until the day when the cumu-
lative temperature reaches a species-specific threshold
temperature (thermal energy) (Suszka 1980). For the
species in question, large variations are observed in
both pollination timing and the start of the pollen
496 Aerobiologia (2013) 29:495–511
123
Page 3
season (Kozłowski 1971; Cenci et al. 1997; Jato et al.
2004; Rodriguez-Rajo et al. 2004; Crepinsek et al.
2006; Puc 2007; Kaszewski et al. 2008; Hajkova et al.
2009). It has been shown in Poland that in the 1950s,
flowering isophenes of hazel female flowers closely
corresponded to the isotherms of March. Currently,
hazel blooms earlier; hence, the temperatures in
January/February are of major importance for the
initiation of flowering (Sokołowska 1962; Kasprzyk
2011). Weather patterns significantly affect daily
hazel and alder pollen concentrations. The most
important factors include temperature, precipitation,
humidity, sunlight hours, and wind speed. The
strength of correlations between these meteorological
elements and pollen counts is different during the pre-
peak and post-peak periods of the pollen season
(Rodriguez-Rajo et al. 2004; Puc 2007).
Meteorological factors have a strong impact on
variations in the production, release, and dispersal of
allergenic pollen. As a result, these variables can be
used for constructing forecast models (Puc 2012).
Recent attempts have been made to include pollination
(phenological observations) as a biotic factor in such
models, and research has included comparing varia-
tions in pollination and the occurrence of airborne
pollen (Latorre 1997; Kasprzyk and Walanus 2007;
Jato et al. 2004; Stach et al. 2006; Jato et al. 2007a, b).
The overall climate of a region affects the season-
ality of natural phenomena, hence also the pollination
and the occurrence of airborne pollen. Therefore, the
present study was carried out at sites located in
different climatic regions. A hypothesis was, there-
fore, put forward that the curve of the pollen seasons
and the timing of hazel and alder pollination would
differ in these regions. The main objectives were to
determine whether the hazel and alder pollen seasons
coincided with the pollination period, and whether the
relationships between these phenomena were similar
in the two cities studied.
2 Materials and methods
2.1 Site location
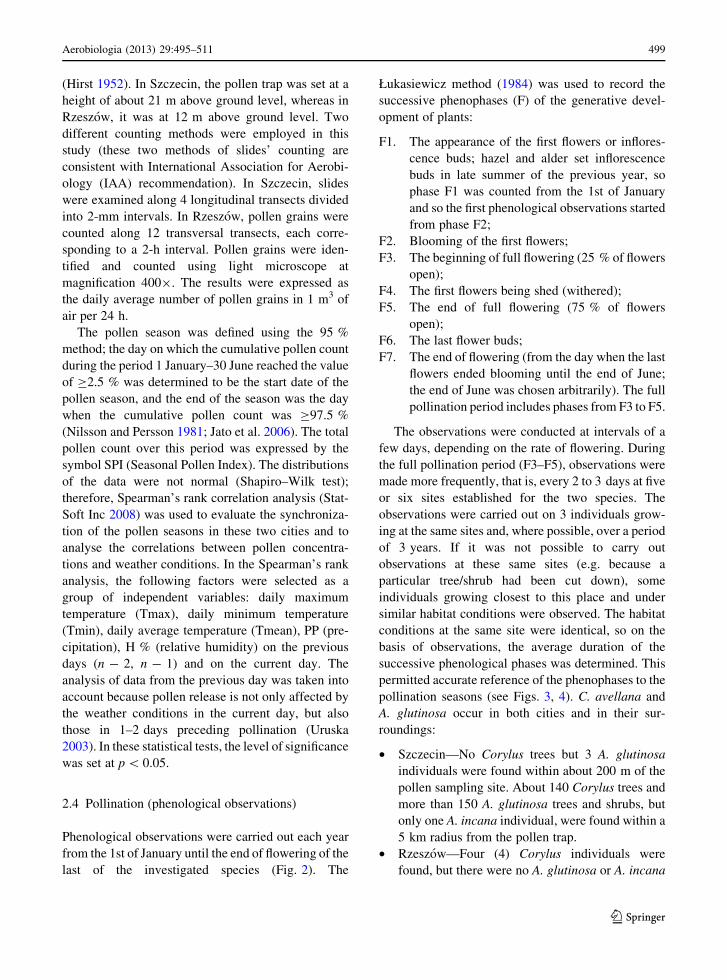
Aerobiological monitoring (2009–2011) was carried
out in two cities, Szczecin (53�2602600 N, 14�3205000 E)
and Rzeszow (50�010N; 22�020E). The cities are
located 640 km apart and situated in different climatic
regions (Fig. 1); the westerly circulation from the
North Atlantic has varying degrees of influence on the
climate of the two cities (Ziernicka-Wojtaszek and
Zawora 2008).
Szczecin is the capital of Western Pomerania, and it
is situated in north-western Poland. The area imme-
diately around the city consists of forested land (there
are three forests near to the city) as well as some hills
and water bodies. Within the city area, there are
introduced synanthropic plants and trees as well as
primeval forests. Forests occupy more than 16 % of
the Szczecin County area. The green areas of the city
also include numerous parks, lawns, and gardens. As a
result of spatial development of the city, several types
of residential districts have appeared. The city centre
is occupied by tall buildings with rented flats, char-
acteristic of the late nineteenth and early twentieth
century. Only the northern part of the city centre is
dominated by old villas. The majority of the city’s
districts are covered with villas or low houses and also
blocks of flats (Kozminska and Wojciechowska 2001).
The centre of Rzeszow lies in the valley of the
Wisłok River, 200–215 m above sea level. In this
region, there are no natural barriers and the altitude
ranges between 80 and 200 m a.s.l. The city is more
than a dozen kilometers from the Carpathian Foothills
(300–600 m a.s.l.). Rzeszow is a medium-sized city
with typical urban developments. Its vegetation is
concentrated in parks and urban lawns (Swies 1993).
Near the pollen trap, there are several planted trees and
shrubs as well as synanthropic plant associations. The
environs of Rzeszow are a mosaic of forests and crop
fields; agricultural land accounts for a major part in the
land use structure. Forests occupy about 20 % of
Rzeszow County area.
2.2 Climate
The climate of Szczecin is modified by the influence of
Atlantic air masses and the proximity of the Baltic Sea.
It has humid continental climate, with January the
coldest month (-1.1 �C) and July the hottest
(17.7 �C). The average annual temperature is 8.4 �C,
annual mean relative humidity ranges between 70 and
77 %, and rainfall is mainly concentrated in summer.
Mean annual precipitation is 528 mm. Daily precip-
itation of over 20 mm or draught periods lasting
longer than 20 days are rare. The climate of Szczecin
includes strong and very strong winds that are
Aerobiologia (2013) 29:495–511 497
123
Page 4
especially frequent from November till March. The
average monthly wind speed over the years
1956–1990 is 3.6 m/s (Kozminski and Czarnecka
1996; Wos 1999). The vegetation season, which is the
period with mean 24-h air temperature [5 �C and in
Poland in the moderate climate zone lasts from the last
spring ground frost to the first autumn ground frost, is
about 210–220 days in Szczecin (Kozuchowski and
Degirmendzic 2005).
Rzeszow is located in south-eastern Poland. Its
climatic conditions are chiefly affected by transformed
polar maritime and polar continental air masses.
During the year, there are roughly 230 days with
transformed maritime air masses (Niedzwiedz 1981,
2004). The city is situated in a region where very warm
days with precipitation occur frequently in summer,
and days with ground frost conditions and cool or very
cool sunny weather occur in winter. There are few cool
days with precipitation and high cloudiness (Wos
1999). In this region, western, north-western, and
south-western winds predominate. Mean wind veloc-
ity for Rzeszow is 4 m/s. The average annual air
temperature oscillates around 8 �C in the Carpathian
Foothills, which makes it one of the warmest regions
in Poland. The active growing season lasts from 215 to
220 days in Carpathian Foothills (Niedzwiedz 2004).
The mean annual temperature is 8.1 �C, and mean
annual precipitation is 633 mm. Mean temperatures
for July (the warmest month) and January (the coldest
month) are 18.3 and -2.1 �C, respectively. In the
Rzeszow region, maximum precipitation occurs in
July (mean 80 mm) and minimum precipitation in
February (mean 27–50 mm) (Brzezniak 2007).
2.3 Aerobiological monitoring (pollen counts)
In both towns, aerobiological monitoring was con-
ducted using volumetric spore traps of the Hirst design
Fig. 1 The geographic
location of Szczecin and
Rzeszow in central Europe
498 Aerobiologia (2013) 29:495–511
123
Page 5
(Hirst 1952). In Szczecin, the pollen trap was set at a
height of about 21 m above ground level, whereas in
Rzeszow, it was at 12 m above ground level. Two
different counting methods were employed in this
study (these two methods of slides’ counting are
consistent with International Association for Aerobi-
ology (IAA) recommendation). In Szczecin, slides
were examined along 4 longitudinal transects divided
into 2-mm intervals. In Rzeszow, pollen grains were
counted along 12 transversal transects, each corre-
sponding to a 2-h interval. Pollen grains were iden-
tified and counted using light microscope at
magnification 4009. The results were expressed as
the daily average number of pollen grains in 1 m3 of
air per 24 h.
The pollen season was defined using the 95 %
method; the day on which the cumulative pollen count
during the period 1 January–30 June reached the value
of C2.5 % was determined to be the start date of the
pollen season, and the end of the season was the day
when the cumulative pollen count was C97.5 %
(Nilsson and Persson 1981; Jato et al. 2006). The total
pollen count over this period was expressed by the
symbol SPI (Seasonal Pollen Index). The distributions
of the data were not normal (Shapiro–Wilk test);
therefore, Spearman’s rank correlation analysis (Stat-
Soft Inc 2008) was used to evaluate the synchroniza-
tion of the pollen seasons in these two cities and to
analyse the correlations between pollen concentra-
tions and weather conditions. In the Spearman’s rank
analysis, the following factors were selected as a
group of independent variables: daily maximum
temperature (Tmax), daily minimum temperature
(Tmin), daily average temperature (Tmean), PP (pre-
cipitation), H % (relative humidity) on the previous
days (n - 2, n - 1) and on the current day. The
analysis of data from the previous day was taken into
account because pollen release is not only affected by
the weather conditions in the current day, but also
those in 1–2 days preceding pollination (Uruska
2003). In these statistical tests, the level of significance
was set at p \ 0.05.
2.4 Pollination (phenological observations)
Phenological observations were carried out each year
from the 1st of January until the end of flowering of the
last of the investigated species (Fig. 2). The
Łukasiewicz method (1984) was used to record the
successive phenophases (F) of the generative devel-
opment of plants:
F1. The appearance of the first flowers or inflores-
cence buds; hazel and alder set inflorescence
buds in late summer of the previous year, so
phase F1 was counted from the 1st of January
and so the first phenological observations started
from phase F2;
F2. Blooming of the first flowers;
F3. The beginning of full flowering (25 % of flowers
open);
F4. The first flowers being shed (withered);
F5. The end of full flowering (75 % of flowers
open);
F6. The last flower buds;
F7. The end of flowering (from the day when the last
flowers ended blooming until the end of June;
the end of June was chosen arbitrarily). The full
pollination period includes phases from F3 to F5.
The observations were conducted at intervals of a
few days, depending on the rate of flowering. During
the full pollination period (F3–F5), observations were
made more frequently, that is, every 2 to 3 days at five
or six sites established for the two species. The
observations were carried out on 3 individuals grow-
ing at the same sites and, where possible, over a period
of 3 years. If it was not possible to carry out
observations at these same sites (e.g. because a
particular tree/shrub had been cut down), some
individuals growing closest to this place and under
similar habitat conditions were observed. The habitat
conditions at the same site were identical, so on the
basis of observations, the average duration of the
successive phenological phases was determined. This
permitted accurate reference of the phenophases to the
pollination seasons (see Figs. 3, 4). C. avellana and
A. glutinosa occur in both cities and in their sur-
roundings:
• Szczecin—No Corylus trees but 3 A. glutinosa
individuals were found within about 200 m of the
pollen sampling site. About 140 Corylus trees and
more than 150 A. glutinosa trees and shrubs, but
only one A. incana individual, were found within a
5 km radius from the pollen trap.
• Rzeszow—Four (4) Corylus individuals were
found, but there were no A. glutinosa or A. incana
Aerobiologia (2013) 29:495–511 499
123
Page 6
at a distance of up to 100 m. The closest site with
A. glutinosa was about 500 m from the pollen trap.
No A. incana stands were found within a 5 km
radius from the pollen trap.
By comparing the timing of flowering periods at the
chosen sites, the synchronization index (X) was
calculated according to the formula proposed by
Ollerton and Lack (1998), see Table 4.
x1 ¼1
n� 1
� �1
f1
� �Xn
j¼1
ej 6¼ i
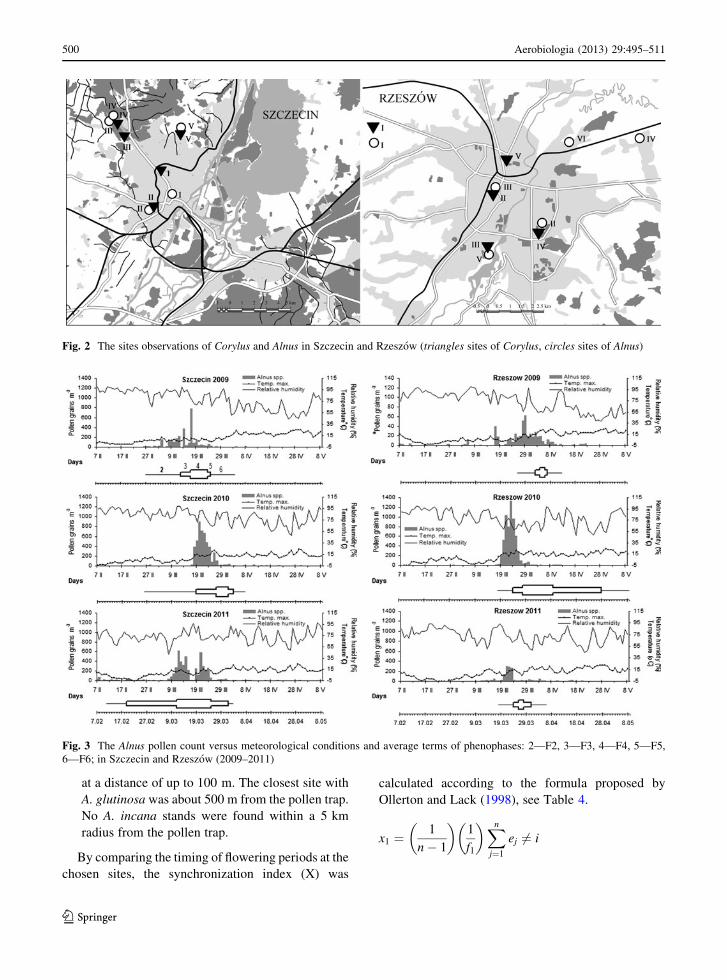
Fig. 2 The sites observations of Corylus and Alnus in Szczecin and Rzeszow (triangles sites of Corylus, circles sites of Alnus)
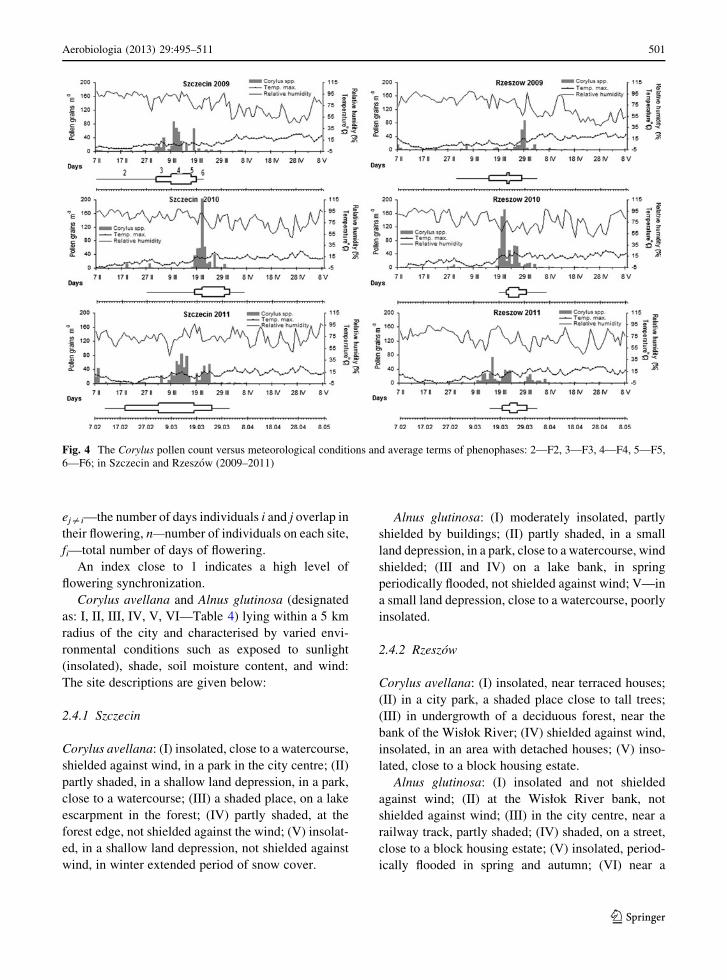
Fig. 3 The Alnus pollen count versus meteorological conditions and average terms of phenophases: 2—F2, 3—F3, 4—F4, 5—F5,
6—F6; in Szczecin and Rzeszow (2009–2011)
500 Aerobiologia (2013) 29:495–511
123
Page 7
ej=i—the number of days individuals i and j overlap in
their flowering, n—number of individuals on each site,
fi—total number of days of flowering.
An index close to 1 indicates a high level of
flowering synchronization.
Corylus avellana and Alnus glutinosa (designated
as: I, II, III, IV, V, VI—Table 4) lying within a 5 km
radius of the city and characterised by varied envi-
ronmental conditions such as exposed to sunlight
(insolated), shade, soil moisture content, and wind:
The site descriptions are given below:
2.4.1 Szczecin
Corylus avellana: (I) insolated, close to a watercourse,
shielded against wind, in a park in the city centre; (II)
partly shaded, in a shallow land depression, in a park,
close to a watercourse; (III) a shaded place, on a lake
escarpment in the forest; (IV) partly shaded, at the
forest edge, not shielded against the wind; (V) insolat-
ed, in a shallow land depression, not shielded against
wind, in winter extended period of snow cover.
Alnus glutinosa: (I) moderately insolated, partly
shielded by buildings; (II) partly shaded, in a small
land depression, in a park, close to a watercourse, wind
shielded; (III and IV) on a lake bank, in spring
periodically flooded, not shielded against wind; V—in
a small land depression, close to a watercourse, poorly
insolated.
2.4.2 Rzeszow
Corylus avellana: (I) insolated, near terraced houses;
(II) in a city park, a shaded place close to tall trees;
(III) in undergrowth of a deciduous forest, near the
bank of the Wisłok River; (IV) shielded against wind,
insolated, in an area with detached houses; (V) inso-
lated, close to a block housing estate.
Alnus glutinosa: (I) insolated and not shielded
against wind; (II) at the Wisłok River bank, not
shielded against wind; (III) in the city centre, near a
railway track, partly shaded; (IV) shaded, on a street,
close to a block housing estate; (V) insolated, period-
ically flooded in spring and autumn; (VI) near a
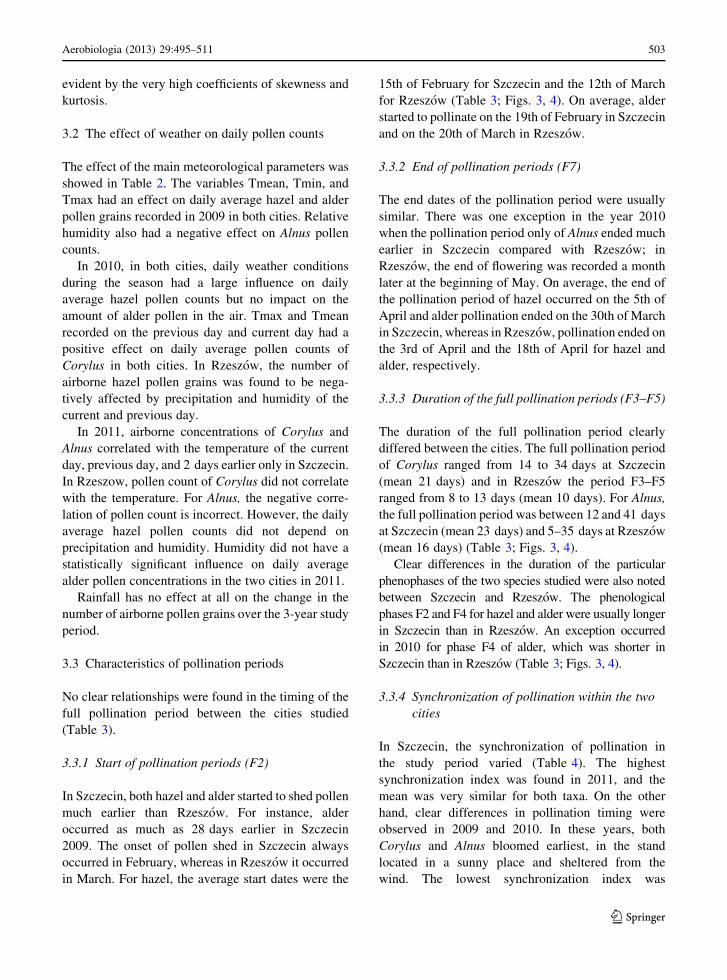
Fig. 4 The Corylus pollen count versus meteorological conditions and average terms of phenophases: 2—F2, 3—F3, 4—F4, 5—F5,
6—F6; in Szczecin and Rzeszow (2009–2011)
Aerobiologia (2013) 29:495–511 501
123
Page 8
drainage ditch, close to allotment gardens, shielded
against wind (Fig. 2).
2.5 Pollen seasons and pollination periods
For each phenophase, the pollen sum was calculated and
then expressed as a proportion. The similarity in the
distribution of grain numbers was tested by v2 at
p\0.05.
3 Results
3.1 Characteristics of the pollen seasons
3.1.1 General characteristics
Start dates of the pollen seasons of the studied taxa
varied greatly. In Szczecin, over the 3-year study period,
the differences were 42 days for hazel and 38 days for
alder. In Rzeszow, the differences were lower; 33 days
for hazel and also 33 days for alder. The end dates of
pollen seasons were characterised by much smaller
variations. In both Szczecin and Rzeszow, the maxi-
mum hazel and alder pollen concentrations generally
occurred in the second half of March.
The pollen seasons varied considerably between the
years and the monitoring stations. Generally, the first
hazel and alder pollen grains appeared earlier in
Szczecin compared with Rzeszow.
In 2009, concentrations of hazel and alder pollen
grains recorded in the air of Szczecin increased rapidly
while the increase was much slower in Rzeszow. In
Szczecin, alder pollen remained in the air longer than
hazel pollen. In 2010, the dynamics of the Alnus pollen
seasons were similar for both cities, in particular in the
pre-peak period, that is, until the peak date. In 2011,
two peaks were noted in Szczecin for both taxa. For
Corylus and Alnus in Szczecin, the start date was the
earliest over the 3-year study period. In Rzeszow, the
lowest values of pollen count were observed for
Corylus and Alnus (Figs. 3, 4).
3.1.2 Skewness and Kurtosis
Skewness The pollen seasons were generally strongly
skewed to the right (Table 1), which means that single
pollen grains of both hazel and alder remained in the
air for a long time after the pollen season had ended.
Single grains of Alnus were even observed into June in
Szczecin (in 2010) and the end of May in Rzeszow.
Kurtosis All kurtosis values were positive, which
showed that pollen counts usually increased rapidly at the
beginning of the season. For alder, the values of the
kurtosis were usually higher in Szczecin than in Rzeszow.
When analysed according to each feature (i.e. year,
city, and taxon), the seasonal curves were skewed to
the right and strongly peaked, that is to say with
narrow full-width half-maximum (FWHM). This is
Table 1 Descriptive statistics of Corylus and Alnus pollen seasons in Szczecin (SZ) and Rzeszow (RZ) (2009–2011)
Start End Length/days SPI Maximum Date of maximum Skewness Kurtosis
Corylus
SZ 2009 2 III 27 III 26 472 86 9 III 1.62 1.58
SZ 2010 20 III 30 III 34 528 205 21 III 3.13 11.34
SZ 2011 7 II 28 III 50 783 85 13 III 1.87 2.75
RZ 2009 7 II 8 IV 62 297 88 29 III 4.99 26.87
RZ 2010 12 III 2 IV 21 653 170 21 III 2.16 4.23
RZ 2011 10 III 28 III 19 337 73 16 III 2.08 5.59
Alnus
SZ 2009 2 III 4 IV 34 2698 778 17 III 3.66 15.76
SZ 2010 18 III 8 IV 23 4566 898 20 III 1.18 2.20
SZ 2011 9 II 31 III 51 4728 619 12 III 2.05 3.58
RZ 2009 15 II 12 IV 69 454 63 29 III 2.35 6.24
RZ 2010 19 III 30 III 11 6001 1325 23 III 0.59 1.00
RZ 2011 13 III 23 IV 41 1460 295 2 III 3.01 8.12
SPI seasonal pollen index
502 Aerobiologia (2013) 29:495–511
123
Page 9
evident by the very high coefficients of skewness and
kurtosis.
3.2 The effect of weather on daily pollen counts
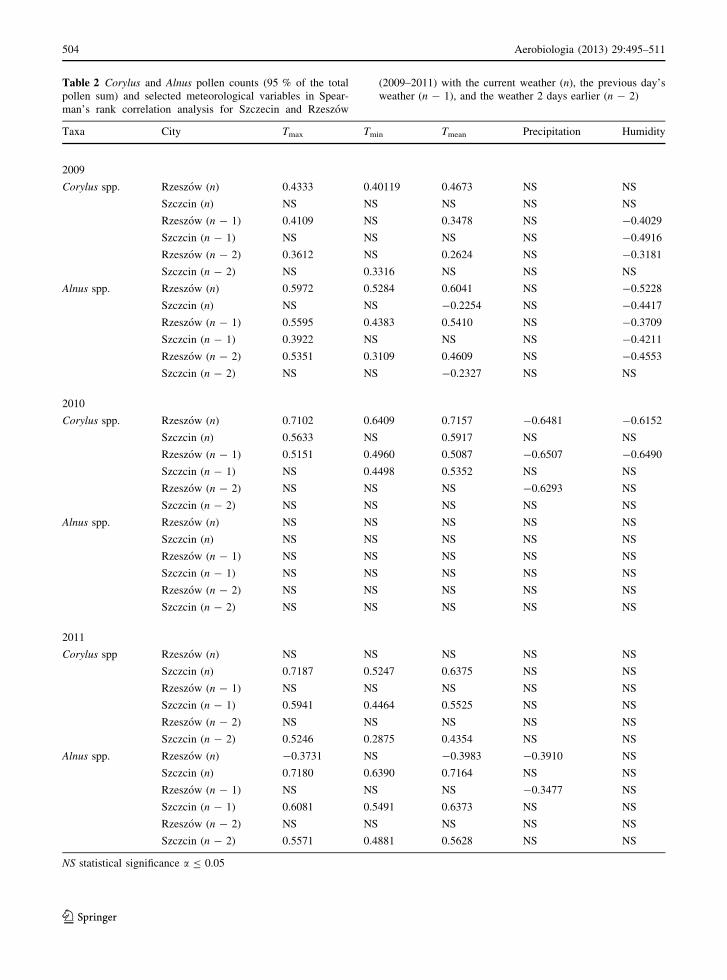
The effect of the main meteorological parameters was
showed in Table 2. The variables Tmean, Tmin, and
Tmax had an effect on daily average hazel and alder
pollen grains recorded in 2009 in both cities. Relative
humidity also had a negative effect on Alnus pollen
counts.
In 2010, in both cities, daily weather conditions
during the season had a large influence on daily
average hazel pollen counts but no impact on the
amount of alder pollen in the air. Tmax and Tmean
recorded on the previous day and current day had a
positive effect on daily average pollen counts of
Corylus in both cities. In Rzeszow, the number of
airborne hazel pollen grains was found to be nega-
tively affected by precipitation and humidity of the
current and previous day.
In 2011, airborne concentrations of Corylus and
Alnus correlated with the temperature of the current
day, previous day, and 2 days earlier only in Szczecin.
In Rzeszow, pollen count of Corylus did not correlate
with the temperature. For Alnus, the negative corre-
lation of pollen count is incorrect. However, the daily
average hazel pollen counts did not depend on
precipitation and humidity. Humidity did not have a
statistically significant influence on daily average
alder pollen concentrations in the two cities in 2011.
Rainfall has no effect at all on the change in the
number of airborne pollen grains over the 3-year study
period.
3.3 Characteristics of pollination periods
No clear relationships were found in the timing of the
full pollination period between the cities studied
(Table 3).
3.3.1 Start of pollination periods (F2)
In Szczecin, both hazel and alder started to shed pollen
much earlier than Rzeszow. For instance, alder
occurred as much as 28 days earlier in Szczecin
2009. The onset of pollen shed in Szczecin always
occurred in February, whereas in Rzeszow it occurred
in March. For hazel, the average start dates were the
15th of February for Szczecin and the 12th of March
for Rzeszow (Table 3; Figs. 3, 4). On average, alder
started to pollinate on the 19th of February in Szczecin
and on the 20th of March in Rzeszow.
3.3.2 End of pollination periods (F7)
The end dates of the pollination period were usually
similar. There was one exception in the year 2010
when the pollination period only of Alnus ended much
earlier in Szczecin compared with Rzeszow; in
Rzeszow, the end of flowering was recorded a month
later at the beginning of May. On average, the end of
the pollination period of hazel occurred on the 5th of
April and alder pollination ended on the 30th of March
in Szczecin, whereas in Rzeszow, pollination ended on
the 3rd of April and the 18th of April for hazel and
alder, respectively.
3.3.3 Duration of the full pollination periods (F3–F5)
The duration of the full pollination period clearly
differed between the cities. The full pollination period
of Corylus ranged from 14 to 34 days at Szczecin
(mean 21 days) and in Rzeszow the period F3–F5
ranged from 8 to 13 days (mean 10 days). For Alnus,
the full pollination period was between 12 and 41 days
at Szczecin (mean 23 days) and 5–35 days at Rzeszow
(mean 16 days) (Table 3; Figs. 3, 4).
Clear differences in the duration of the particular
phenophases of the two species studied were also noted
between Szczecin and Rzeszow. The phenological
phases F2 and F4 for hazel and alder were usually longer
in Szczecin than in Rzeszow. An exception occurred
in 2010 for phase F4 of alder, which was shorter in
Szczecin than in Rzeszow (Table 3; Figs. 3, 4).
3.3.4 Synchronization of pollination within the two
cities
In Szczecin, the synchronization of pollination in
the study period varied (Table 4). The highest
synchronization index was found in 2011, and the
mean was very similar for both taxa. On the other
hand, clear differences in pollination timing were
observed in 2009 and 2010. In these years, both
Corylus and Alnus bloomed earliest, in the stand
located in a sunny place and sheltered from the
wind. The lowest synchronization index was
Aerobiologia (2013) 29:495–511 503
123
Page 10
Table 2 Corylus and Alnus pollen counts (95 % of the total
pollen sum) and selected meteorological variables in Spear-
man’s rank correlation analysis for Szczecin and Rzeszow
(2009–2011) with the current weather (n), the previous day’s
weather (n - 1), and the weather 2 days earlier (n - 2)
Taxa City Tmax Tmin Tmean Precipitation Humidity
2009
Corylus spp. Rzeszow (n) 0.4333 0.40119 0.4673 NS NS
Szczcin (n) NS NS NS NS NS
Rzeszow (n - 1) 0.4109 NS 0.3478 NS -0.4029
Szczcin (n - 1) NS NS NS NS -0.4916
Rzeszow (n - 2) 0.3612 NS 0.2624 NS -0.3181
Szczcin (n - 2) NS 0.3316 NS NS NS
Alnus spp. Rzeszow (n) 0.5972 0.5284 0.6041 NS -0.5228
Szczcin (n) NS NS -0.2254 NS -0.4417
Rzeszow (n - 1) 0.5595 0.4383 0.5410 NS -0.3709
Szczcin (n - 1) 0.3922 NS NS NS -0.4211
Rzeszow (n - 2) 0.5351 0.3109 0.4609 NS -0.4553
Szczcin (n - 2) NS NS -0.2327 NS NS
2010
Corylus spp. Rzeszow (n) 0.7102 0.6409 0.7157 -0.6481 -0.6152
Szczcin (n) 0.5633 NS 0.5917 NS NS
Rzeszow (n - 1) 0.5151 0.4960 0.5087 -0.6507 -0.6490
Szczcin (n - 1) NS 0.4498 0.5352 NS NS
Rzeszow (n - 2) NS NS NS -0.6293 NS
Szczcin (n - 2) NS NS NS NS NS
Alnus spp. Rzeszow (n) NS NS NS NS NS
Szczcin (n) NS NS NS NS NS
Rzeszow (n - 1) NS NS NS NS NS
Szczcin (n - 1) NS NS NS NS NS
Rzeszow (n - 2) NS NS NS NS NS
Szczcin (n - 2) NS NS NS NS NS
2011
Corylus spp Rzeszow (n) NS NS NS NS NS
Szczcin (n) 0.7187 0.5247 0.6375 NS NS
Rzeszow (n - 1) NS NS NS NS NS
Szczcin (n - 1) 0.5941 0.4464 0.5525 NS NS
Rzeszow (n - 2) NS NS NS NS NS
Szczcin (n - 2) 0.5246 0.2875 0.4354 NS NS
Alnus spp. Rzeszow (n) -0.3731 NS -0.3983 -0.3910 NS
Szczcin (n) 0.7180 0.6390 0.7164 NS NS
Rzeszow (n - 1) NS NS NS -0.3477 NS
Szczcin (n - 1) 0.6081 0.5491 0.6373 NS NS
Rzeszow (n - 2) NS NS NS NS NS
Szczcin (n - 2) 0.5571 0.4881 0.5628 NS NS
NS statistical significance a B 0.05
504 Aerobiologia (2013) 29:495–511
123
Page 11
recorded for Corylus at site II in 2010, and this was
because over 50 % catkins in two out of three
individuals were frozen one week after the onset of
flowering. The greatest delay in the timing of
pollination in the 3-year study period was recorded
in a quite sunny, but very windy site with lower
temperatures in winter and the snow cover persisted
longer when compared to the city centre (site V for
both, Alnus and Corylus). At these sites, the
synchronization index over the 3-year period ranged
from X = 0.727 to X = 0.96 for hazel and X = 0.86
to X = 0.976 for alder (Table 4).
In Rzeszow, the synchronization of hazel polli-
nation in the 3-year study period also differed. In
2010 and 2011, the studied individuals shed pollen
at a similar time. Larger variations in pollination
timing were found in 2009 when the value of the
synchronization index was X = 0.6964. In 2009 and
2011, hazel trees flowered distinctly earlier in the
stands located in insolated and wind-sheltered
places. In 2009, a clear delay in the timing of hazel
pollination was recorded in the stand located at a
distance of about 5 km from the pollen trap, in a
sunny but very windy place. The synchronization of
alder pollination was similar in 2009 and 2010 at all
the sites in Rzeszow. In 2011, the average synchro-
nization of pollination was slightly higher. Likewise,
in the case of hazel, alder trees flowered distinctly
earlier at the sites located in insolated and wind-
sheltered places.
3.4 Pollen seasons versus pollination periods
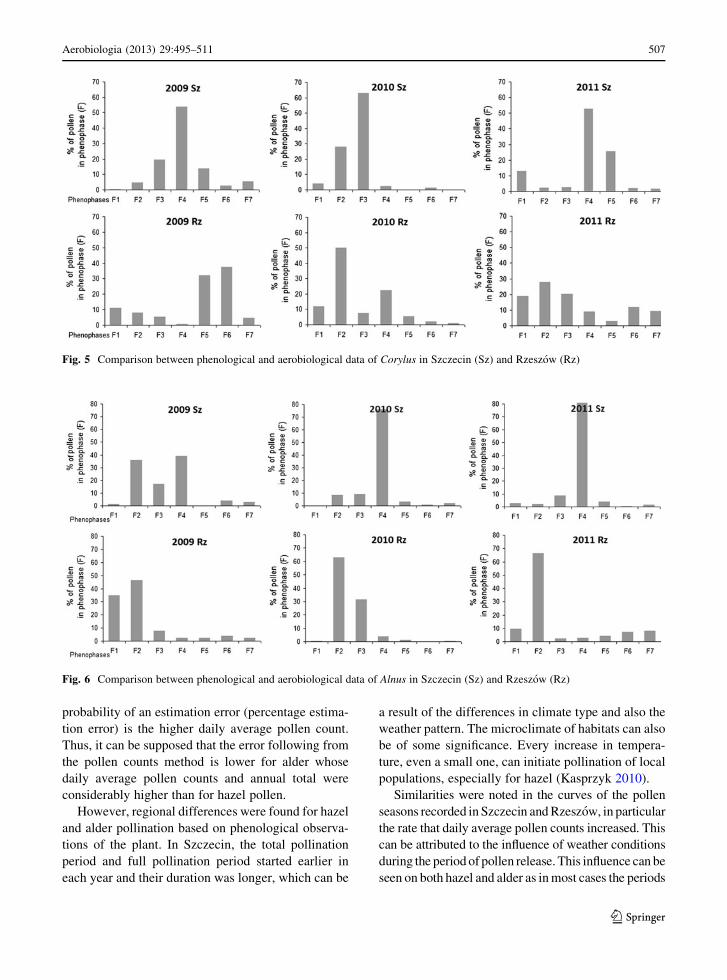
3.4.1 Hazel
In Szczecin, the distribution hazel pollen recorded in the
successive phenophases varied less than in Rzeszow
during 2009–2011. The highest hazel pollen concentra-
tions were found during phenophases of the full pollina-
tion period (F3 or F4), with the percentage of pollen
grains ranging between 54 and 63 % in these phases
(Fig. 5). During the other phases, the numbers of pollen
grains ranged from several to[12 %.
In Rzeszow, the full pollination period of hazel
(F3–F5) did not coincide with the period of the highest
concentrations, and the amounts of pollen recorded
during different phenophases varied in each year (Fig. 5).
In 2009, the lowest amount of pollen was found in F4,
while more than 10 % of the SPI was recorded before the
start of the pollination period. The highest amount of
pollen (70 %) was found at the end of the full pollination
period (F5 and F6). In 2010, the largest amounts of pollen
grains were recorded at the beginning of pollination
period. As in 2009, more than 10 % of the total seasonal
pollen count was recorded before the start of the
pollination period. In 2011, more than 65 % of pollen
occurred in the first three phases, including as much as
19 % before the onset of the local flowering (Fig. 5).
Statistically significant differences were found in the
distribution of the numbers of pollen grains in the years of
study (v2 test).
Table 3 Descriptive statistics of the pollination periods in Rzeszow (RZ) and Szczecin (SZ) (2009–2011)
Years Start (F2–F7) End (F2–F7) Length (F2–F7) Start of (F3–F5) End (F3–F5) Length (F3–F5)
Corylus
2009 SZ 7 II 21 III 43 03 III 18 III 16
2010 SZ 27 II 06 IV 39 18 III 31 III 14
2011 SZ 11 III 31 III 49 19 II 24 III 34
2009 RZ 02 III 02 IV 32 15 III 27 III 13
2010 RZ 19 III 06 IV 19 22 III 29 III 8
2011 RZ 15 III 02 IV 19 20 III 29 III 10
Alnus
2009 SZ 27 II 06 IV 39 13 III 24 III 12
2010 SZ 26 II 07 IV 41 19 III 02 IV 15
2011 SZ 11 II 02 IV 51 19 II 31 III 41
2009 RZ 26 III 12 IV 18 02 IV 06 IV 5
2010 RZ 18 III 08 V 52 24 III 27 IV 35
2011 RZ 18 III 05 IV 19 24 III 30 III 7
Aerobiologia (2013) 29:495–511 505
123
Page 12
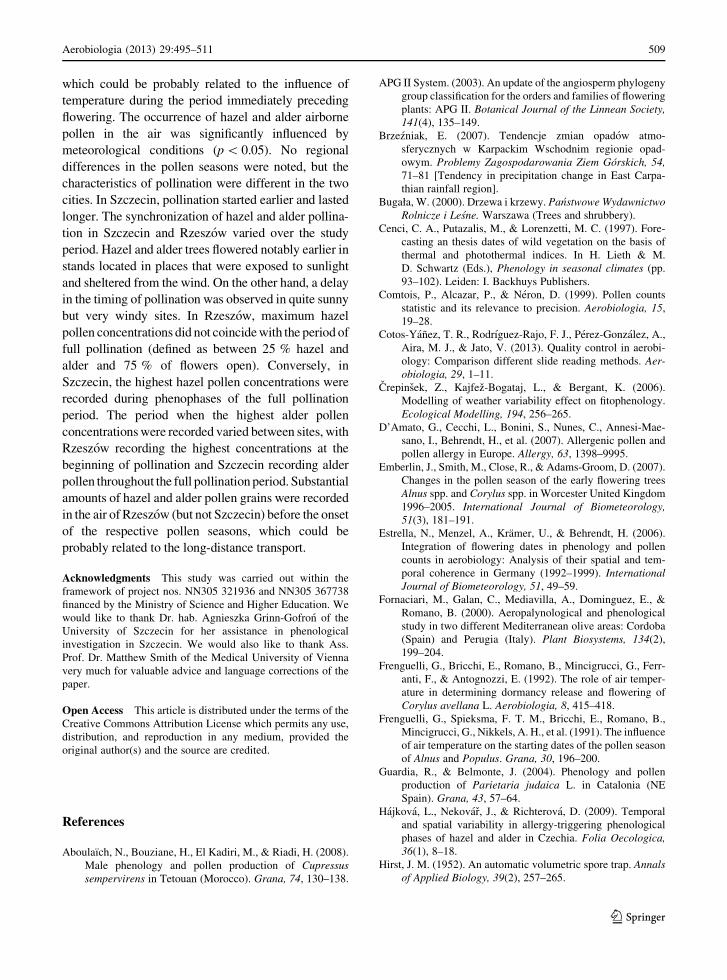
3.4.2 Alder
In Szczecin, in 2010 and 2011, more than 70 % of
alder pollen occurred in just one phase (F4). In 2009,
the highest amounts of pollen grains were recorded
from F2 to F4. Before the onset of pollen shed (F2),
only a few percent of the seasonal pollen count was
found in the air (Fig. 6). Statistically significant
differences were found in the distribution of the
numbers of pollen grains during the successive 3 years
and also between 2010 and 2011 (v2 test).
In Rzeszow, alder pollen occurred at the highest
concentrations at the beginning of pollination, mainly
in F2, but as much as 35 % of pollen grains were also
found before the beginning of alder pollination in the
study area. In 2010, pollen occurred primarily in one
phase. More than 60 % of pollen was found in F2,
even though this phase only lasted for 5 days. In phase
F3, the percentage of pollen grains in the SPI was
31 %. The year 2011 was similar to the two previous
years, and the highest amount of pollen was found in
F2 (66.3 %; Fig. 6). In spite of these similarities,
statistically significant differences were found in the
distribution of the numbers (v2 test).
4 Discussion
Research carried out in different European countries
shows that start dates of the hazel and alder pollen
seasons in successive years can vary from 2 weeks to
1.5 months (Piotrowicz and Myszkowska 2006; Em-
berlin et al. 2007; Smith et al. 2007; Stach et al. 2007;
Myszkowska et al. 2010). This can be explained by the
influence of meteorological factors, in particular air
temperature during the period preceding the pollen
season (January–February), which greatly affects the
phenology of early flowering species (Frenguelli et al.
1991, 1992; Jato et al. 2004; Rodriguez-Rajo et al.
2004, 2006, Ranta et al. 2008). In addition, Weryszko–
Chmielewska et al. (2001) compared the patterns of
the pollen seasons in Szczecin, Warsaw, and Lublin
and concluded that the geographic location and
thereby climatic differences affected the start date of
the pollen season. For instance, in Szczecin, the hazel
pollen season started about 2–3 weeks earlier and the
alder pollen season 1 week earlier than in Lublin,
which is located in south-eastern Poland. Myszkowska
et al. (2010) also proposed a relationship between the
timing of pollen seasons and the geographic location.
The results obtained in our study have not con-
firmed the thesis of Myszkowska et al. (2010) and
Weryszko–Chmielewska et al. (2001) that geographic
location influences pollen season characteristics. The
results that we obtained varied from year-to-year. In
2009, the pollen seasons of hazel and alder started
much later in Szczecin than in Rzeszow, but in 2011, it
was the other way around. The season end date showed
lower variations and similar tendencies have been
reported for other taxa (Wołek and Myszkowska 2008;
Myszkowska et al. 2010, Kasprzyk 2011). The results
can be also influenced by different ways of reading
slides (different counting methods), as has been
suggested by Cotos-Yanez et al. (2013). Similar to
Comtois et al. (1999), they have shown that the
Table 4 The synchronization index (X) between five sites of
Corylus and Alnus in Szczecin and Rzeszow
Taxon Station 2009 2010 2011
Corylus
Szczecin I 0.555 0.455 0.732
II 0.794 0.256 0.894
III 0.883 0.715 0.930
IV 0.711 0.615 0.930
V 0.727 0.799 0.960
X mean 0.6045 0.5684 0.8902
Rzeszow I 0.822 0.521 0.967
II 0.737 0.833 0.881
III 0.823 0.866 0.857
IV 0.657 0.458 0.896
V 0.443 0.916 0.868
X mean 0.6964 0.7188 0.8936
Alnus
Szczecin I 0.764 0.830 0.926
II 0.561 0.543 0.833
III 0.638 0.862 0.926
IV 0.749 0.756 0.900
V 0.976 0.937 0.860
X mean 0.7381 0.7861 0.8934
Rzeszow I 0.589 0.833 0.959
II 0.740 0.842 0.970
III 0.700 0.861 0.683
IV 0.489 0.519 0.969
V 0.633 0.633 0.677
VI 0.743 0.712 Site destroyed
X mean 0.6490 0.7333 0.8516
506 Aerobiologia (2013) 29:495–511
123
Page 13
probability of an estimation error (percentage estima-
tion error) is the higher daily average pollen count.
Thus, it can be supposed that the error following from
the pollen counts method is lower for alder whose
daily average pollen counts and annual total were
considerably higher than for hazel pollen.
However, regional differences were found for hazel
and alder pollination based on phenological observa-
tions of the plant. In Szczecin, the total pollination
period and full pollination period started earlier in
each year and their duration was longer, which can be
a result of the differences in climate type and also the
weather pattern. The microclimate of habitats can also
be of some significance. Every increase in tempera-
ture, even a small one, can initiate pollination of local
populations, especially for hazel (Kasprzyk 2010).
Similarities were noted in the curves of the pollen
seasons recorded in Szczecin and Rzeszow, in particular
the rate that daily average pollen counts increased. This
can be attributed to the influence of weather conditions
during the period of pollen release. This influence can be
seen on both hazel and alder as in most cases the periods
Fig. 5 Comparison between phenological and aerobiological data of Corylus in Szczecin (Sz) and Rzeszow (Rz)
Fig. 6 Comparison between phenological and aerobiological data of Alnus in Szczecin (Sz) and Rzeszow (Rz)
Aerobiologia (2013) 29:495–511 507
123
Page 14
of high concentrations of the studied taxa overlap. For
example, in Rzeszow, the beginning of February 2009
was warm, and the first hazel and alder pollen grains
were already being recorded at that time. This was
followed by a severe change in the weather during the
second half of February when average daily tempera-
tures dropped below -10 �C. Such weather conditions
did not promote intensive and rapid pollen release. On
the other hand, such large fluctuations in temperature
were not recorded in Szczecin; the number of airborne
pollen grains increased along with a distinct increase in
temperature, and the pollen season was compact and
shorter than in Rzeszow. The local weather conditions
influenced the differences in the timing and variation/
fluctuation pattern of the pollen seasons. These findings
are confirmed in the literature that describes temperature
as being the most important factor influencing variations
in pollen concentrations (Frenguelli et al. 1991; Mys-
zkowska et al. 2010). In Rzeszow, in 2010, the alder
pollen season was very short—only 11 days. The
relationship between the weather conditions and pollen
concentrations was weaker than expected, but this can
be attributed to the shortness of the dataset. A stronger
relationship could perhaps be detected over longer
periods. The negative correlation between daily average
pollen counts and daily mean temperature for alder in
Rzeszow was rather surprising because it contradicted
our a priori knowledge and should be considered an
artifact. The pollen count values show some inert
behavior depending not only on the thermal conditions
prevailing on the previous days, but also on the number
of pollen grains on these days (autocorrelation) (Uruska
2003; Estrella et al. 2006; Stach et al. 2010).
In this study, we have seen that the occurrence of
airborne pollen and pollination often coincides,
although correlation coefficients are not always
significant. These findings have been confirmed by
the literature (Latorre 1999; Jato et al. 2007a, b;
Kasprzyk and Walanus 2007). It is interesting to note
that in both Szczecin and Rzeszow, airborne hazel and
alder pollen grains were recorded before or during the
start of local pollination, frequently at high concen-
trations. It has been proposed (e.g. Mimet et al. 2009)
that higher minimum air temperatures in urban areas
can cause trees to flower earlier, especially in spring,
compared to more rural areas. The individuals selected
for phenological observations all grew within the area
of cities. The pollen traps were placed on the roofs of
buildings, and the airborne pollen counts reflect the
vegetation and its changes in the region. The pollen
season is generally longer than the flowering period,
since we take into account all airborne pollen grains,
including those originating from local and more
distant sources as well as particles that become
airborne through re-suspension. Ranta et al. (2006)
proved that phenological observations are not suffi-
cient to determine the timing of the main birch pollen
season because long-distance transport of pollen may
greatly affect the timing of the local birch pollen
season. It cannot be excluded that in Rzeszow, alder
pollen grains recorded before the flowering period of
in situ A. glutinosa could have been A. Incana pollen
grains or A. glutinosa pollen grains that were trans-
ported over long distances (Mahura et al. 2007; Puc
2007; Kaszewski et al. 2008; Kasprzyk 2010). In
microscopic analysis, pollen grains are not distin-
guished to the level of species and according to the
literature, gray alder flowers about 2 weeks earlier
(Pancer-Kotejowa and Zarzycki 1980). Though no
individuals of this species are found in the flora of the
city of Rzeszow, they are often found in the Carpa-
thian Foothills and, theoretically, long-distance trans-
port of pollen from these areas is possible. This is also
confirmed by the special location of Szczecin where
single A. incana individuals have been found at the
outskirts of the city (Stachak et al. 2000). For example,
in 2007, low alder pollen counts were recorded in
Szczecin 1–2 weeks before the main pollen season
(Puc 2007). The pollen of the studied taxa, especially
hazel, remains in the air in notable concentrations at
the end of the pollination period. In spite of the
synchronization in pollination witnessed in this study,
one should remember that there can be shifts in
pollination timing depending on the type of habitat in
which these individuals occur (Kasprzyk 2010). These
factors are interrelated and depend on the climate, the
taxonomic position of the studied taxon, aerodynamic
properties of pollen grains, and the location of pollen
sources (Latorre 1997, 1999; Fornaciari et al. 2000;
Stach et al. 2006; Kasprzyk and Walanus 2007; Jato
et al. 2007a, b; Puc et al. 2008).
5 Conclusions
We have found a high degree of variation in onset dates
of Corylus and Alnus pollination and pollen seasons of
these taxa in the Polish cities of Szczecin and Rzeszow,
508 Aerobiologia (2013) 29:495–511
123
Page 15
which could be probably related to the influence of
temperature during the period immediately preceding
flowering. The occurrence of hazel and alder airborne
pollen in the air was significantly influenced by
meteorological conditions (p \ 0.05). No regional
differences in the pollen seasons were noted, but the
characteristics of pollination were different in the two
cities. In Szczecin, pollination started earlier and lasted
longer. The synchronization of hazel and alder pollina-
tion in Szczecin and Rzeszow varied over the study
period. Hazel and alder trees flowered notably earlier in
stands located in places that were exposed to sunlight
and sheltered from the wind. On the other hand, a delay
in the timing of pollination was observed in quite sunny
but very windy sites. In Rzeszow, maximum hazel
pollen concentrations did not coincide with the period of
full pollination (defined as between 25 % hazel and
alder and 75 % of flowers open). Conversely, in
Szczecin, the highest hazel pollen concentrations were
recorded during phenophases of the full pollination
period. The period when the highest alder pollen
concentrations were recorded varied between sites, with
Rzeszow recording the highest concentrations at the
beginning of pollination and Szczecin recording alder
pollen throughout the full pollination period. Substantial
amounts of hazel and alder pollen grains were recorded
in the air of Rzeszow (but not Szczecin) before the onset
of the respective pollen seasons, which could be
probably related to the long-distance transport.
Acknowledgments This study was carried out within the
framework of project nos. NN305 321936 and NN305 367738
financed by the Ministry of Science and Higher Education. We
would like to thank Dr. hab. Agnieszka Grinn-Gofron of the
University of Szczecin for her assistance in phenological
investigation in Szczecin. We would also like to thank Ass.
Prof. Dr. Matthew Smith of the Medical University of Vienna
very much for valuable advice and language corrections of the
paper.
Open Access This article is distributed under the terms of the
Creative Commons Attribution License which permits any use,
distribution, and reproduction in any medium, provided the
original author(s) and the source are credited.
References
Aboulaıch, N., Bouziane, H., El Kadiri, M., & Riadi, H. (2008).
Male phenology and pollen production of Cupressus
sempervirens in Tetouan (Morocco). Grana, 74, 130–138.
APG II System. (2003). An update of the angiosperm phylogeny
group classification for the orders and families of flowering
plants: APG II. Botanical Journal of the Linnean Society,
141(4), 135–149.
Brzezniak, E. (2007). Tendencje zmian opadow atmo-
sferycznych w Karpackim Wschodnim regionie opad-
owym. Problemy Zagospodarowania Ziem Gorskich, 54,
71–81 [Tendency in precipitation change in East Carpa-
thian rainfall region].
Bugała, W. (2000). Drzewa i krzewy. Panstwowe Wydawnictwo
Rolnicze i Lesne. Warszawa (Trees and shrubbery).
Cenci, C. A., Putazalis, M., & Lorenzetti, M. C. (1997). Fore-
casting an thesis dates of wild vegetation on the basis of
thermal and photothermal indices. In H. Lieth & M.
D. Schwartz (Eds.), Phenology in seasonal climates (pp.
93–102). Leiden: I. Backhuys Publishers.
Comtois, P., Alcazar, P., & Neron, D. (1999). Pollen counts
statistic and its relevance to precision. Aerobiologia, 15,
19–28.
Cotos-Yanez, T. R., Rodrıguez-Rajo, F. J., Perez-Gonzalez, A.,
Aira, M. J., & Jato, V. (2013). Quality control in aerobi-
ology: Comparison different slide reading methods. Aer-
obiologia, 29, 1–11.
Crepinsek, Z., Kajfez-Bogataj, L., & Bergant, K. (2006).
Modelling of weather variability effect on fitophenology.
Ecological Modelling, 194, 256–265.
D’Amato, G., Cecchi, L., Bonini, S., Nunes, C., Annesi-Mae-
sano, I., Behrendt, H., et al. (2007). Allergenic pollen and
pollen allergy in Europe. Allergy, 63, 1398–9995.
Emberlin, J., Smith, M., Close, R., & Adams-Groom, D. (2007).
Changes in the pollen season of the early flowering trees
Alnus spp. and Corylus spp. in Worcester United Kingdom
1996–2005. International Journal of Biometeorology,
51(3), 181–191.
Estrella, N., Menzel, A., Kramer, U., & Behrendt, H. (2006).
Integration of flowering dates in phenology and pollen
counts in aerobiology: Analysis of their spatial and tem-
poral coherence in Germany (1992–1999). International
Journal of Biometeorology, 51, 49–59.
Fornaciari, M., Galan, C., Mediavilla, A., Dominguez, E., &
Romano, B. (2000). Aeropalynological and phenological
study in two different Mediterranean olive areas: Cordoba
(Spain) and Perugia (Italy). Plant Biosystems, 134(2),
199–204.
Frenguelli, G., Bricchi, E., Romano, B., Mincigrucci, G., Ferr-
anti, F., & Antognozzi, E. (1992). The role of air temper-
ature in determining dormancy release and flowering of
Corylus avellana L. Aerobiologia, 8, 415–418.
Frenguelli, G., Spieksma, F. T. M., Bricchi, E., Romano, B.,
Mincigrucci, G., Nikkels, A. H., et al. (1991). The influence
of air temperature on the starting dates of the pollen season
of Alnus and Populus. Grana, 30, 196–200.
Guardia, R., & Belmonte, J. (2004). Phenology and pollen
production of Parietaria judaica L. in Catalonia (NE
Spain). Grana, 43, 57–64.
Hajkova, L., Nekovar, J., & Richterova, D. (2009). Temporal
and spatial variability in allergy-triggering phenological
phases of hazel and alder in Czechia. Folia Oecologica,
36(1), 8–18.
Hirst, J. M. (1952). An automatic volumetric spore trap. Annals
of Applied Biology, 39(2), 257–265.
Aerobiologia (2013) 29:495–511 509
123
Page 16
Huntley, B., & Birks, H. J. B. (1983). An atlas of past and
present maps for Europe: 0–13000 years ago. Cambridge:
Cambridge University Press.
Jalas, J., & Suominen, J. (1988). Atlas Florae Europeae. In
Distribution of vascular plants in Europe, II (Eds.). Cam-
bridge: Cambridge University Press.
Jato, V., Mendez, J., Rodrıguez-Rajo, F. J., Dacosta, N., & Aira,
M. J. (2004). Heat and chill requirements of Fraxinus
flowering in Galicia (NW Spain). Grana, 43, 217–223.
Jato, V., Rodrıguez-Rajo, F. J., & Aira, M. J. (2007a). Use of
Quercus ilex subsp. ballota phenological and pollen pro-
duction data for interpreting Quercus pollen curves. Aer-
obiologia, 23, 91–105.
Jato, V., Rodrıguez-Rajo, F. J., & Aira, M. J. (2007b). Use of
phenological and pollen-production data for interpreting
atmospheric birch pollen curves. Annals of Agricultural
and Environmental Medicine, 14, 271–280.
Jato, V., Rodrıguez-Rajo, F. J., Alcazar, P., De Nuntiis, P., &
Galan, C. (2006). May the definition of pollen season
influence aerobiological results? Aerobiologia, 22, 13–25.
Kasprzyk, I. (2010). Poczatek sezonow pyłkowych olszy i les-
zczyny a poczatek pylenia w ro _znych warunkach siedli-
skowych Rzeszowa. Alergoprofil, 6(2), 32–37.
Kasprzyk, I. (2011). Time-series analysis of pollen seasons in
Rzeszow (SE Poland) in 1997–2005 with reference to
phenology (pp. 5–118). Rzeszow: University of Rzeszow.
Kasprzyk, I., & Walanus, A. (2007). Flowering and airborne
pollen—a novel statistical approach. Acta Agrobotanica,
60(2), 51–55.
Kaszewski, B. M., Pidek, I. A., Piotrowska, K., & Weryszko-
Chmielewska, E. (2008). Annual pollen sums of Alnus in
Lublin and Roztocze in the years 2001–2007 against
selected meteorological parameters. Acta Agrobotanica,
61(2), 57–64.
Kozłowski, T. T. (Ed.). (1971). Growth and development of
trees (Vol. 1). New York, London: Academic Press.
Kozminska, B., & Wojciechowska, D. (2001). Szczecin z daleka
i z bliska (Szczecin from a distance and from near by) (pp.
60–79). Zapol: Muzeum Narodowe, Szczecin.
Kozminski, C., & Czarnecka, M. (1996). Klimat miasta
Szczecina i okolicy. In J. Jasnowska (Ed.), Stan Srodow-
iska Miasta i Rejonu Szczecina (pp. 49–68). Szczecin:
Szczecinskie Towarzystwo Naukowe.
Ko _zuchowski, K., & Degirmendzic, J. (2005). Contemporary
changes of climate in Poland: Trends and variation in
thermal and solar conditions related to plant and vegeta-
tion. Polish Journal of Ecology, 53(3), 283–287.
Latorre, F. (1997). Comparison between phenological and
aerobiological patterns of some arboreal species of Mar del
Plata (Argentina). Aerobiologia, 13, 49–59.
Latorre, F. (1999). Differences between airborne pollen and
flowering phenology of urban trees with reference to pro-
duction, dispersal and interannual climate variability.
Aerobiologia, 15, 131–141.
Łukasiewicz, A. (1984). Potrzeba ujednolicenia metody fen-
ologicznej w polskich ogrodach botanicznych i arboretach.
Wiadomosci Botaniczne, 28(2), 153–158.
Mahura, A. G., Korsholm, U. S., Baklanov, A. A., & Rasmussen,
A. (2007). Elevated birch pollen episodes in Denmark:
Contributions from remote sources. Aerobiologia, 23,
171–179.
Mimet, A., Pellissier, V., Quenol, H., Aguejdad, R., Dubreuil,
V., & Roze, F. (2009). Urbanisation induces early flower-
ing: Evidence from Platanus acerifolia and Prunus cera-
sus. International Journal of Biometeorology, 53,
287–298.
Myszkowska, D., Jenner, B., Puc, M., Stach, A., Nowak, M.,
Malkiewicz, M., et al. (2010). Spatial variations in
dynamics of Alnus and Corylus pollen season in Poland.
Aerobiologia, 26(3), 209–221.
Niedzwiedz, T. (1981). Sytuacje synoptyczne i ich wpływ na
zro _znicowanie przestrzenne wybranych elementow kli-
matu w dorzeczu gornej Wisły. Rozprawy Habilitacyjne nr
58. Uniwersytet Jagiellonski, Krakow (Synoptic situations
and their influence on spatial differentiation of chosen
elements of climate of the upper Vistula a Basin).
Niedzwiedz, T. (2004). Kalendarz sytuacji synoptycznych dla
dorzecza gornej Wisły (1997–2004); plik komputerowy
dostepny w Katedrze Klimatologii, Wydział Nauk o Ziemi
Uniwersytetu Slaskiego, Sosnowiec (Calendar of synoptic
situations for Upper Wisła Basin; computer packet avail-
able in Climatology Department, Earth Science Faculty,
Slask University).
Nilsson, S., & Persson, S. (1981). Tree pollen spectra in the
Stockholm region (Sweden) 1973–1980. Grana, 20,
179–182.
Ollerton, J., & Lack, A. (1998). Relationships between flower-
ing phenology, plant size and reproductive success in Lotus
corniculatus (Fabaceae). Plant Ecology, 139, 35–47.
Pancer-Kotejowa, E., & Zarzycki, K. (1980). Zarys ekologii
(Outline of ecology). In: S. Białobok (Ed.), Olsze Alnus
Mill. (Alders) (pp. 229–257). Warsaw: Instytut Dendrologii
PAN.
Piotrowicz, K., & Myszkowska, D. (2006). Poczatek sezonow
pyłkowych leszczyny na tle zmiennosci klimatu Krakowa.
Alergologia, Immunologia, 3(3–4), 86–89.
Puc, M. (2003a). Characteristic of pollen allergens. Annals of
Agricultural and Environmental Medicine, 10, 143–149.
Puc, M. (2003b). Pyłek wybranych taksonow drzew w pow-
ietrzu Szczecina w latach 2000–2002. Annales Universi-
tatis Mariae Curie-Skłodowska, 13, 323–331.
Puc, M. (2007). The effect of meteorological conditions on
hazel and alder pollen concentration in the air of Szczecin.
Acta Agrobotanica, 60(2), 65–70.
Puc, M. (2012). Artificial neural network model of the rela-
tionship between Betula pollen and meteorological factors
in Szczecin (Poland). International Journal of Biometeo-
rology, 56, 395–401.
Puc, M., Grinn-Gofron, A., Mysliwy, M., Wolski, T., Rapiejko,
P., Sieczka, J., et al. (2008). Okres kwitnienia brzozy w
2008 roku w Szczecinie a zagro _zenie alergenami pyłku
tego drzewa. Alergoprofil, 4(3), 44–49.
Ranta, H., Hokkanen, T., Linkosalo, T., Laukkanen, L.,
Bondestam, K., & Oksanen, A. (2008). Male flowering of
birch: Spatial synchronization, year-to-year variation and
relation of catkin numbers and airborne pollen counts.
Forest Ecology and Management, 255, 643–650.
Ranta, H., Kubin, E., Siljamo, P., Sofiev, M., Linkosalo, T.,
Oksanen, A., et al. (2006). Long distance pollen transport
cause problem for determining the timing of birch pollen
season in Fennoscandia by using phenological observa-
tions. Grana, 45, 397–404.
510 Aerobiologia (2013) 29:495–511
123
Page 17
Rapiejko, P., Lipiec, A., Wojdas, A., & Jurkiewicz, D. (2004).
Threshold pollen concentration necessary to evoke allergic
symptoms. International Review of Allergology and Clin-
ical Immunology, 10(3), 91–94.
Rodriguez-Rajo, F. J., Dopazo, A., & Jato, V. (2004). Envi-
ronmental factors affecting the start of pollen season and
concentration of airborne Alnus pollen in two localities of
Galicia (NW Spain). Annals of Agricultural and Environ-
mental Medicine, 11, 35–44.
Rodriguez-Rajo, F. J., Valencia-Barrea, R. M., Vega-Maray, A.
M., Suarez, F. J., Fernandez-Gonzales, D., & Jato, V.
(2006). Prediction of airborne Alnus pollen concentration
by using ARIMA models. Annals of Agricultural and
Environmental Medicine, 13, 25–32.
Senata, W. (1991). Dendrologia 1. Warszawa: PWN.
Smith, M., Emberlin, J., Stach, A., Czarnecka–Operacz, M.,
Jenerowicz, D., & Silny, W. (2007). Regional importance
of Alnus pollen as an aeroallergen: A comparative study of
Alnus pollen counts from Worcester (UK) and Poznan
(Poland). Annals of Agricultural and Environmental
Medicine, 14, 123–128.
Sokołowska, J. (1962). Izofeny kwitnienia leszczyny (Corylus
avellana L.). Rocznik Dendrologiczny, 16, 137–151.
Stach, A., Garcia-Mozo, H., Prieto-Baena, J. C., Czarnecka-
Operacz, M., Jenerowicz, D., Silny, W., et al. (2007).
Prevalence of artemisia species pollinosis in western
Poland. Impact of climate change on aerobiological trends,
1995–2004. Journal of Investigational Allergology and
Clinical Immunology, 17(1), 39–47.
Stach, A., Kasprzyk, I., Puc, M., Weryszko-Chmielewska, E.,
Piotrowska, K., Stach, A. et al. (2010).Temporal and space-
time autocorrelation of daily concentrations of Alnus,
Betula and Corylus pollen in Poland. Abstract 9th ICA
(International Congress of Aerobiology, 23–27 08 2010,
Buenos Aires, Argentina).
Stach, A., Kluza-Wieloch, M., & Zientarska, A. (2006). The
phenology of flowering and fluctuations of airborne pollen
concentrations of selected trees in Poznan, 2003–2004.
Acta Agrobotanica, 59(1), 301–308.
Stachak, A., Grinn, U., Haas-Nogal, M., Kubus, M., Nowak, G.,
& Nowakowska, M. (2000). Zielen Szczecina. (pp.
64–273). Szczecin: Oficyna In Plus Press (Greenery of
Szczecin).
StatSoft Inc (2008). STATISTICA (data analysis software sys-
tem), version 9.0 www.statsoft.com.
Sugita, S., Hicks, S., & Sormunen, H. (2010). Absolute pollen
productivity and pollen-vegetation relationships in north-
ern Finland. Journal of Quaternacy Science, 25(5),
724–736.
Suszka, B. (1980). Rozmna _zanie generatywne. In: S. Białobok
(Ed.) Olsze Alnus Mill (pp. 99–144). Warszawa–Poznan:
PWN.
Swies, F. (1993). Roslinnosc synantropijna miasta Rzeszow.
Wyd. Uniw. Marii Curie-Skłodowska, Lublin. (The syn-
anthropic vegetation of the city of Rzeszow).
Uruska, A. (2003). Wpływ wybranych czynnikow meteorolog-
icznych na zmiane koncentracji ziaren pyłku drzew w at-
mosferze Gdanska. Ann. UMCS, Sec. EEE, Horticultura,
13, 293–301.
Weryszko–Chmielewska, E., Puc, M., & Rapiejko, P. (2001).
Comparative analysis of pollen counts of Corylus, Alnus
and Betula in Szczecin, Warsaw and Lublin (2000–2001).
Annals of Agricultural and Environmental Medicine, 8,
235–240.
Weryszko-Chmielewska, E., & Rapiejko, P. (2007). Analysis of
Alnus spp. pollen seasons in Lublin and Warszawa
(Poland), 2001–2007. Acta Agrobotanica, 60(2), 87–97.
Wołek, J., & Myszkowska, D. (2008). Strategia badan aerobi-
ologicznych. Alergologia and Immunologia, 5(1), 11–14.
Wos, A. (1999). Klimat Polski. Warsaw: Society Press PWN.
(The climate of Poland).
Zajac A., & Zajac M. (Eds.) (2001). Distribution atlas of vas-
cular plants in Poland. Laboratory of Computer Chorology,
Institute of Botany, Jagiellonian University, Krakow, ss.
715.
Ziernicka-Wojtaszek, A., & Zawora, T. (2008). Regionalizacja
termiczno-opadowa Polski w okresie globalnego ocieple-
nia. Acta Agrophysica., 11(3), 807–817.
Aerobiologia (2013) 29:495–511 511
123