The Pennsylvania System of School Assessment Pennsylvania Department of Education Bureau of Curriculum, Assessment and Instruction—September 2016 Item and Scoring Sampler 2016–2017 Mathematics Grade 8
Transcript
The Pennsylvania Systemof School Assessment
Pennsylvania Department of Education Bureau of Curriculum, Assessment and Instruction—September 2016
Item and Scoring Sampler
2016–2017
Mathematics
Grade 8
PSSA Grade 8 Mathematics Item and Scoring Sampler—September 2016 ii
PSSA Grade 8 Mathematics Item and Scoring Sampler—September 2016 1
INFORMATION ABOUT MATHEMATICS
INTRODUCTION
General Introduction
The Pennsylvania Department of Education provides districts and schools with tools to assist in delivering focused instructional programs aligned with the Pennsylvania Core Standards (PCS). These tools include Academic Standards, Assessment Anchor documents, assessment handbooks, and content-based item and scoring samplers. This Item and Scoring Sampler is a useful tool for Pennsylvania educators in preparing local instructional programs. It can also be useful in preparing students for the statewide assessment.
Pennsylvania Core Standards (PCS)
This sampler contains examples of test questions that are aligned to the new Pennsylvania Core Standards-based 2013 PSSA Assessment Anchors and Eligible Content. The Mathematics, Reading, and Writing PSSA transitioned to PCS-based operational Mathematics and English Language Arts assessments starting with the spring 2015 PSSA administration.
The 2013 PCS-aligned Assessment Anchor and Eligible Content documents are posted on this portal:
www.education.pa.gov [Hover over “K–12,” select “Assessment and Accountability,” and select “Pennsylvania System of School Assessment (PSSA).” Then select “Assessment Anchors” from the “Other Materials” list on the right side of the screen.]
What Is Included
This sampler contains test questions (items) that have been written to align to the Assessment Anchors that are based on the Pennsylvania Core Standards (PCS). The test questions provide an idea of the types of items that will appear on an operational, PCS-based PSSA. Each sample test question has been through a rigorous review process to ensure alignment with the Assessment Anchors.
Purpose and Uses
The items in this sampler may be used as examples for creating assessment items at the classroom level, and they may also be copied and used as part of a local instructional program.1 Classroom teachers may find it beneficial to have students respond to the open-ended item in this sampler. Educators can then use the sampler as a guide to score the responses either independently or together with colleagues within a school or district.
Item Format and Scoring Guidelines
The multiple-choice (MC) items have four answer choices. Each correct response to an MC item is worth one point.
Each open-ended (OE) item is designed to take approximately ten to fifteen minutes to complete. During the administration of the PSSA, students are given additional time as necessary to complete the test items. Each OE item in mathematics is scored using an item-specific scoring guideline based on a 0–4-point scale. In this sampler, every item-specific scoring guideline is combined with examples of student responses that represent each score point to form a practical, item-specific scoring guide.
This sampler also includes the General Description of Scoring Guidelines for Mathematics Open-Ended Questions that students will have access to during a PSSA mathematics administration. The general description of scoring guidelines can be distributed to students for use during local assessments and can also be used by educators when scoring local assessments.1
1 The permission to copy and/or use these materials does not extend to commercial purposes.
PSSA Grade 8 Mathematics Item and Scoring Sampler—September 2016 2
INFORMATION ABOUT MATHEMATICS
Item Alignment
All PSSA items are aligned to statements and specifications included in the Assessment Anchors and Eligible Content Aligned to the Pennsylvania Core Standards. The mathematics content, process skills, directives, and action statements included in the PSSA mathematics questions align with the Assessment Anchor Content Standards. The Eligible Content statements represent the limits of the content of the mathematics questions.
Testing Time and Mode of Testing Delivery for the PSSA
The PSSA is delivered in traditional paper-and-pencil format as well as in an online format. The estimated time to respond to a test question is the same for both methods of test delivery. During an official testing administration, students are given additional time as necessary to complete the test questions. The following table shows the estimated response time for each item type.
Mathematics Item Type MC OE
Estimated Response Time (minutes)
2 10 to 15
Mathematics Reporting Categories
The Assessment Anchors are organized into four classifications as listed below.
• A = Numbers and Operations • C = Geometry • B = Algebraic Concepts • D = Data Analysis and Probability
These four classifications are used throughout the grade levels. In addition to these classifications, there are five Reporting Categories for each grade level. The first letter of each Reporting Category represents the classification; the second letter represents the Domain as stated in the Common Core State Standards for Mathematics. Listed below are the Reporting Categories for Grade 8.
• A-N = The Number System
• B-E = Expressions and Equations
• B-F = Functions
• C-G = Geometry
• D-S = Statistics and Probability
Examples of multiple-choice and open-ended items assessing these categories are included in this booklet.
PSSA Grade 8 Mathematics Item and Scoring Sampler—September 2016 3
INFORMATION ABOUT MATHEMATICS
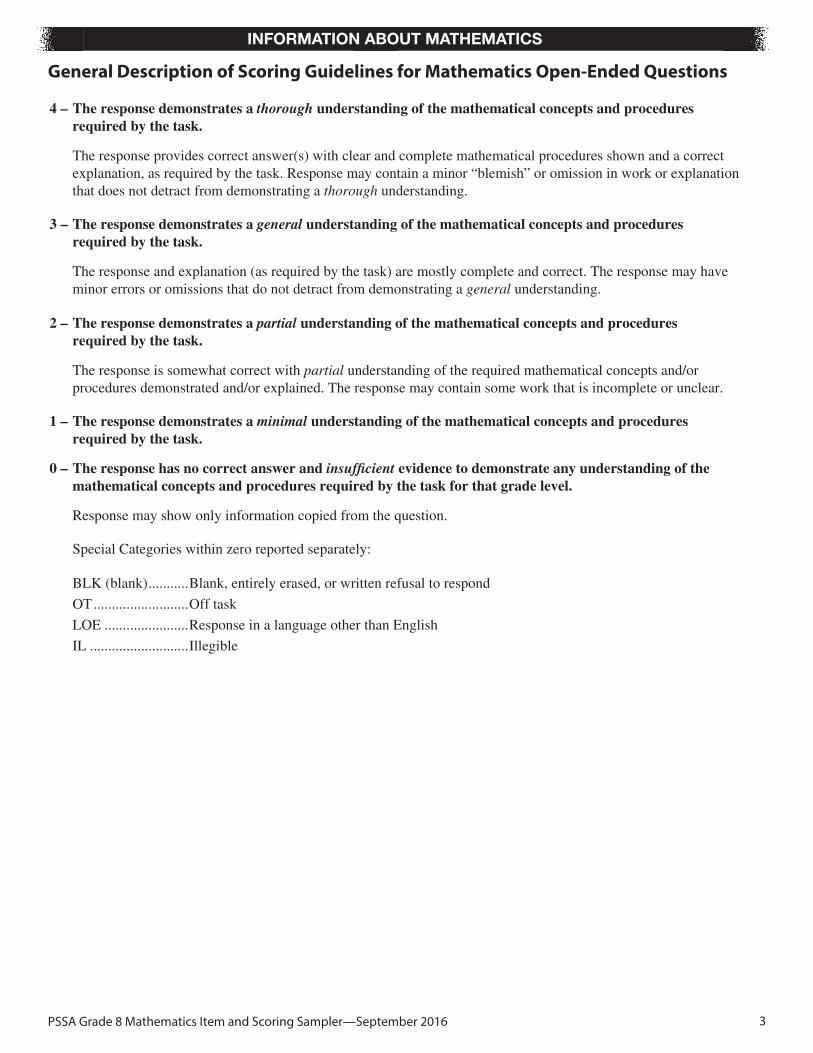
General Description of Scoring Guidelines for Mathematics Open-Ended Questions
PSSA Grade 8 Mathematics Item and Scoring Sampler—September 2016 4
INFORMATION ABOUT MATHEMATICS
Item and Scoring Sampler Format
This sampler includes the test directions and scoring guidelines that appear in the PSSA Mathematics assessments. Each multiple-choice item is followed by a table that includes the alignment, the answer key, the depth of knowledge (DOK) level, the percentage2 of students who chose each answer option, and a brief answer option analysis or rationale. The open-ended item is followed by a table that includes the item alignment, DOK level, and mean student score. Additionally, each of the included item‐specific scoring guidelines is combined with sample student responses representing each score point to form a practical, item‐specific scoring guide. The General Description of Scoring Guidelines for Mathematics Open-Ended Questions used to develop the item‐specific scoring guidelines should be used if any additional item‐specific scoring guidelines are created for use within local instructional programs.
Example Multiple-Choice Item Information Table
Item Information Option Annotations
Alignment Assigned AAEC
Brief answer option analysis or rationale
Answer Key Correct Answer
Depth of Knowledge Assigned DOK
p-values
A B C D
Percentage of students who selected each option
Example Open-Ended Item Information Table
Alignment Assigned AAEC Depth of Knowledge Assigned DOK Mean Score
2 All p-value percentages listed in the item information tables have been rounded.
PSSA Grade 8 Mathematics Item and Scoring Sampler—September 2016 5
INFORMATION ABOUT MATHEMATICS
Grade 8 Formula Sheet
Cylinder
h
Cone
r
V = r13
h
r
V = r
Sphere
r
V = r43
2016You may use calculator or the number 3.14. Grade 8
Formulas that you may need to work questions on this test are found below. You may refer back to this page at any time during the mathematics test.
am • an = am + n
= am – nam
an
1a
a 1 =
(am)n = am • n
Pythagorean Theorem
a
b
c
a2 + b2 = c2
Algebraic Equations
Slope:
Slope-Intercept Form:
m = x2 – x1
y2 – y1
y = mx + b
Exponential Properties
2h
2h
3
π
π
π
π
PSSA Grade 8 Mathematics Item and Scoring Sampler—September 2016 6
PSSA MATHEMATICS GRADE 8
MATHEMATICS TEST DIRECTIONS
On the following pages are the mathematics questions.
• You may not use a calculator for question 1. You may use a calculator for allother questions on this test.
Directions for Multiple-Choice Questions:
Some questions will ask you to select an answer from among four choices.
For the multiple-choice questions:
• First solve the problem on scratch paper.
• Choose the correct answer and record your choice in the answer booklet.
• If none of the choices matches your answer, go back and check your work forpossible errors.
• Only one of the answers provided is the correct response.
Directions for Open-Ended Questions:
Some questions will require you to write your response.
For the open-ended questions:
• These questions have more than one part. Be sure to read the directions carefully.
• You cannot receive the highest score for an open-ended question without completingall tasks in the question. For example, if the question asks you to show your work orexplain your reasoning, be sure to show your work or explain your reasoning in thespace provided.
• If the question does not ask you to show your work or explain your reasoning, youmay use the space provided, but only those parts of your response that the questionspecifically asks for will be scored.
• Write your response in the appropriate location within the response box in theanswer booklet. Some answers may require graphing, plotting, labeling, drawing, orshading. If you use scratch paper, be sure to transfer your final response and anyneeded work or reasoning to the answer booklet.
PSSA Grade 8 Mathematics Item and Scoring Sampler—September 2016 7
PSSA MATHEMATICS GRADE 8
Question 1 in this sampler is to be solved without the use of a calculator.
MULTIPLE-CHOICE ITEMS
1.
Item Information Option Annotations
Alignment B-E.1.1.1 A. correctB. ignores the negative in the second exponentC. thinks 2 negatives make it positiveD. multiplies the exponents
Answer Key A
Depth of Knowledge 1
p-values
A B C D
41% 12% 29% 18%
Simplify: 7 8 × 7 4
A.1
712
B.174
C. 712
D. 732
PSSA Grade 8 Mathematics Item and Scoring Sampler—September 2016 8
PSSA MATHEMATICS GRADE 8
A calculator is permitted for use in solving questions 2–17 in this sampler.
2.
Item Information Option Annotations
Alignment B-E.1.1.4 A. correctB. multiplies the exponentsC. incorrectly uses 7, because of 7 digitsD. incorrectly uses 7, because of 7 digits, and multiplies the
exponents
Answer Key A
Depth of Knowledge 1
p-values
A B C D
75% 13% 7% 5%
Which equation shows how to find the product of 1,000,000 and 1,000,000 usingscientific notation?
PSSA Grade 8 Mathematics Item and Scoring Sampler—September 2016 9
PSSA MATHEMATICS GRADE 8
3.
Item Information Option Annotations
Alignment B-E.3.1.4 A. correctB. uses a negative slope for the first equation and a positive slope
for the second equationC. uses the correct first equation but reverses the intercepts for the
second equationD. uses the reciprocal of the slope for the first equation and
reverses the intercepts for the second equation
Answer Key A
Depth of Knowledge 1
p-values
A B C D
46% 19% 22% 13%
Mr. Carter is mapping the boundaries of a park on a coordinate grid. The park’s headquartersare located at the origin. The equations shown below represent two boundaries of the park.
y = 2x – 5
2x + 4y = 12
The park’s entrance is located at the intersection of these two boundaries. Which coordinategrid correctly shows the two boundaries and the park’s entrance?
A. y
x2 4–4 –2
4
2
–2–4
B. y
x2 4–4 –2
4
2
–2–4
C. y
x2 4–4 –2
4
2
–2–4
D. y
x2 4–4 –2
4
2
–2–4
PSSA Grade 8 Mathematics Item and Scoring Sampler—September 2016 10
PSSA MATHEMATICS GRADE 8
4.
Item Information Option Annotations
Alignment B-E.3.1.5 A. tries these values in the first example; 2 × 12 + 3 × 20 = 84B. correctC. reverses the solutionD. reverses the meaning of each value in the ordered pair and tries
the values in the first example
Answer Key B
Depth of Knowledge 2
p-values
A B C D
19% 55% 15% 11%
A cleaning company charges x dollars per hour to clean floors and y dollars per hour to cleanthe rest of a house.
• When the company spends 2 hours to clean floors and 3 hours to clean the rest of ahouse, the total charge is $84.
• When the company spends 1 hour to clean floors and 4 hours to clean the rest of ahouse, the total charge is $87.
Which ordered pair represents the hourly charges to clean floors and to clean the rest ofthe house?
A. (12, 20)
B. (15, 18)
C. (18, 15)
D. (20, 12)
PSSA Grade 8 Mathematics Item and Scoring Sampler—September 2016 11
PSSA MATHEMATICS GRADE 8
5.
Item Information Option Annotations
Alignment B-F.1.1 A. sees 30 is represented, but not as slopeB. sees 30 and ignores the negative part of the slopeC. correctD. identifies slope as 30/1 instead of 10/3
Answer Key C
Depth of Knowledge 2
p-values
A B C D
28% 9% 48% 15%
Marianna has been adding $30 to her savings account every month. Which model couldrepresent the money in Marianna’s savings account (y) after x months?
A. y = 10x + 30 B. y = 10 – 30x
C.
357
$100$160$220
Month(x)
Money inSavingsAccount
(y)
Marianna’s Savings Account
D.
Month
Marianna’s Savings Account
Mon
ey in
Sav
ings
Acc
ount
($)
x
y
2 4 6 8
80
60
40
20
0
PSSA Grade 8 Mathematics Item and Scoring Sampler—September 2016 12
PSSA MATHEMATICS GRADE 8
6.
Item Information Option Annotations
Alignment B-F.1.1.1C-G.1.1.1
A. thinks a function must have some positive y-valuesB. confuses this with a reflection across y = xC. correctD. thinks all functions must go through the origin
Answer Key C
Depth of Knowledge 2
p-values
A B C D
14% 22% 48% 16%
The graph below represents a function.
y
x−4−8
5
10
15
4 8
Which single transformation could be applied to the graph so that it no longer representsa function?
A. reflection across the x-axis
B. reflection across the y-axis
C. rotation of 90° clockwise about the origin
D. translation 5 units to the left
PSSA Grade 8 Mathematics Item and Scoring Sampler—September 2016 13
PSSA MATHEMATICS GRADE 8
7.
Item Information Option Annotations
Alignment B-F.1.1.2B-F.1.1.3
A. sees 35x + 109 works for first pair in table, but writes as 35x – 109
B. uses difference of first two y-values as slopeC. misidentifies y-intercept of function 2D. correct
Answer Key D
Depth of Knowledge 2
p-values
A B C D
10% 12% 30% 48%
Two linear functions of x are shown below.
x
Function 2Function 1y = 30x + 19 y
−12−8−31
−311−211−8614
Which statement about the functions is true?
A. Function 2 can be described by the equation y = 35x – 109.
B. Function 2 can be described by the equation y = 100x – 11.
C. The y-intercept of function 1 is less than the y-intercept of function 2.
D. The rate of change of function 1 is greater than the rate of change of function 2.
PSSA Grade 8 Mathematics Item and Scoring Sampler—September 2016 14
PSSA MATHEMATICS GRADE 8
8.
Item Information Option Annotations
Alignment B-F.2.1.1 A. correctB. converts 75 to 7.5 and uses it as the rateC. reverses the rate and initial costD. adds 75 and 2.5 and assumes that is the rate per square foot
Answer Key A
Depth of Knowledge 2
p-values
A B C D
70% 8% 17% 5%
Luis is building a new deck and needs to have a slab of concrete poured. He knows thecontractor charges an initial cost of $75 plus an additional $2.50 per square foot of concrete.Which equation can be used to determine the cost (y), in dollars, to pour a concrete slab withan area of x square feet?
A. y = 2.5x + 75
B. y = 7.5x + 2.5
C. y = 75x + 2.5
D. y = 77.5x
PSSA Grade 8 Mathematics Item and Scoring Sampler—September 2016 15
PSSA MATHEMATICS GRADE 8
9.
Item Information Option Annotations
Alignment B-F.2.1.2 A. reverses meaning for slope and y-intercept and misreads direction of slope in graph
B. reads graph from right to leftC. correctD. uses change in value at end of 6 years as rate of change
Answer Key C
Depth of Knowledge 2
p-values
A B C D
3% 5% 79% 13%
The graph below shows the relationship between the number of years after a car is purchasedand the car’s value.
y
x2 4 610 3 5
Years after Purchase
Value of Car over Time
Valu
e of
Car
($)
6,00012,00018,00024,00030,00036,000
Which statement correctly describes the relationship shown in the graph?
A. The car’s initial value is $2,000, and the car’s value increases $30,000 each year.
B. The car’s initial value is $18,000, and the car’s value increases $2,000 each year.
C. The car’s initial value is $30,000, and the car’s value decreases $2,000 each year.
D. The car’s initial value is $30,000, and the car’s value decreases $12,000 each year.
PSSA Grade 8 Mathematics Item and Scoring Sampler—September 2016 16
PSSA MATHEMATICS GRADE 8
10.
Item Information Option Annotations
Alignment C-G.1.1.1 A. correctB. uses reflection across x-axisC. uses a translation, but thinks 90 degrees because of shifting
from one quadrant to anotherD. uses 180-degree rotation
Answer Key A
Depth of Knowledge 2
p-values
A B C D
49% 20% 7% 24%
Which coordinate plane shows that the shaded polygon is the image of the unshaded polygonafter a 90° counterclockwise rotation about the origin?
A.
x
y
4 8 12
–8–12
–4
48
12
–4–8–12
B.
x
y
4 8 12
–8–12
–4
48
12
–4–8–12
C.
x
y
4 8 12
–8–12
–4
48
12
–4–8–12
D.
x
y
4 8 12
–8–12
–4
48
12
–4–8–12
PSSA Grade 8 Mathematics Item and Scoring Sampler—September 2016 17
PSSA MATHEMATICS GRADE 8
11.
Item Information Option Annotations
Alignment C-G.1.1.2C-G.1.1.3
A. picks an option that includes the axesB. thinks the two triangles are rotations of one anotherC. reflects the point across the wrong axisD. correct
Answer Key D
Depth of Knowledge 2
p-values
A B C D
15% 20% 22% 43%
In the figure shown below, triangle PQR is transformed to create triangle P'Q'R'.
y
x−2−4−6−8−10
−4−6−8
−2
2468
10
S
2 4 6 8 10
Q
PR
Q'
P'R'
−10
Point S will be transformed the same way as triangle PQR. Which sentence could describehow point S will be transformed?
A. Point S will be translated to (6, 0) and then rotated to (0, 6).
B. Point S will be translated to (6, 0) and then rotated to (0, 6).
C. Point S will be translated to (4, 3) and then reflected to ( 4, 3).
D. Point S will be translated to (4, 3) and then reflected to (4, 3).
PSSA Grade 8 Mathematics Item and Scoring Sampler—September 2016 18
PSSA MATHEMATICS GRADE 8
12.
Item Information Option Annotations
Alignment C-G.3.1.1 A. correctB. uses formula for volume of a cylinder instead of a coneC. calculates 1 squared as 1 times 2D. uses 2 inches as the radius
Answer Key A
Depth of Knowledge 2
p-values
A B C D
49% 19% 18% 14%
A balloon in the shape of a crayon is shown below.
21 in.3 in.
2 in.
Crayon Balloon
The crayon balloon is made up of a cone and a cylinder. What is the volume, in cubic inches,of the crayon balloon?
A. 69.12
B. 75.40
C. 138.23
D. 276.46
PSSA Grade 8 Mathematics Item and Scoring Sampler—September 2016 19
PSSA MATHEMATICS GRADE 8
13.
Item Information Option Annotations
Alignment C-G.3.1.1 A. correctB. finds square root of 36C. finds value of r cubed and then divides by 3D. divides 36 by 3
Answer Key A
Depth of Knowledge 2
p-values
A B C D
40% 26% 15% 19%
Part of a sculpture is a stone sphere with a volume of 36 cubic feet. What is the radius, infeet, of the stone sphere?
A. 3
B. 6
C. 9
D. 12
PSSA Grade 8 Mathematics Item and Scoring Sampler—September 2016 20
PSSA MATHEMATICS GRADE 8
14.
Item Information Option Annotations
Alignment D-S.1.1.1 A. identifies where the point lies but thinks removing it would cause the line to move further down
B. gets the correct relationship between the location of the point and the slope but the wrong location of the point
C. correctD. gets the location of the line incorrect and thinks that removing a
point above the line will cause the slope of the line to increase
Answer Key C
Depth of Knowledge 2
p-values
A B C D
20% 9% 56% 15%
Christy created the scatter plot shown below.
43210
7654321
5 6x
y
7Number of Previous Plays
Leng
th o
f Gam
e (m
inut
es)
Length of Pinball Games Based on Experience
111098 12 13 14 15
12111098
Christy finds that the line of best fit for the data has the equation y = 0.51x + 1.48. Whichstatement best explains how removing the point (15, 7) would affect the slope of the line ofbest fit?
A. The slope of the line of best fit would decrease because the point lies below the originalline of best fit.
B. The slope of the line of best fit would decrease because the point lies above the originalline of best fit.
C. The slope of the line of best fit would increase because the point lies below the originalline of best fit.
D. The slope of the line of best fit would increase because the point lies above the originalline of best fit.
PSSA Grade 8 Mathematics Item and Scoring Sampler—September 2016 21
PSSA MATHEMATICS GRADE 8
15.
Item Information Option Annotations
Alignment D-S.1.1.2 A. chooses line that passes through data points (8, 29) and (12, 20)B. correctC. chooses line that passes through data points (6, 39) and (8, 29)D. chooses line that passes through data points (12, 20)
and (14, 10)
Answer Key B
Depth of Knowledge 2
p-values
A B C D
20% 46% 21% 13%
The scatter plot below shows the temperatures (y), in degrees Fahrenheit (°F), that wererecorded at different altitudes (x), in thousands of feet.
Temperature vs. Altitude
Altitude (thousands of feet)
Tem
pera
ture
(°F)
70605040302010
20 4 6 8 1210 14 16 18 20
y
x
Which equation could represent the line of best fit for the temperatures, in degreesFahrenheit, based on the altitudes, in thousands of feet?
A. y =94x + 47
B. y =72x + 59
C. y = 5x + 69
D. y = 5x + 80
PSSA Grade 8 Mathematics Item and Scoring Sampler—September 2016 22
PSSA MATHEMATICS GRADE 8
16.
Item Information Option Annotations
Alignment D-S.1.2.1 A. thinks both columns should be equal (6 + x = 3 + 7)B. finds how many do not participate in sportsC. correctD. finds how many do not collect sports cards
Answer Key C
Depth of Knowledge 2
p-values
A B C D
16% 17% 63% 4%
Blake interviewed 24 students to see whether they collected sports cards and whether theyparticipated in sports. The table below shows his data.
Sports-Card Collecting and Sports Participation
Participatesin Sports
Does NotParticipatein Sports
CollectsSports Cards
6 3
Does Not CollectSports Cards
x 7
How many of the students Blake interviewed participate in sports?
A. 4
B. 10
C. 14
D. 15
PSSA Grade 8 Mathematics Item and Scoring Sampler—September 2016 23
THIS PAGE IS
INTENTIONALLY BLANK.
PSSA MATHEMATICS GRADE 8
PSSA Grade 8 Mathematics Item and Scoring Sampler—September 2016 24
PSSA MATHEMATICS GRADE 8
OPEN-ENDED QUESTION
17.
Bill used a rain gauge to measure how much rain fell, in centimeters (cm), during arainfall.
The rain fell at the same rate throughout the first 180 minutes of the rainfall.
A. Complete the table below with the number of minutes it took for 9 centimeters ofrain to fall and the number of centimeters of rain that fell through 150 minutes.
Rainfall
Time(minutes)
30 45 60 90 150 180
Rain (cm) 2 3 4 6 9 12
B. Write an equation to describe the relationship between the time (t), in minutes,and the amount of rain (r), in centimeters.
Go to the next page to finish question 17.
PSSA Grade 8 Mathematics Item and Scoring Sampler—September 2016 25
PSSA MATHEMATICS GRADE 8
17. Continued. Please refer to the previous page for task explanation.
The total amount of rain that fell from 180 minutes through 280 minutes is shown inthe scatter plot below.
2402202001800
25
20
15
10
5
Total Rainfall
Minutes
Rai
n (c
m)
260 280
C. Describe the change in the slope between the first 180 minutes and thefollowing 100 minutes, and explain what it means in terms of the total amountof rainfall.
After 280 minutes, the slope of the graph is 0.
D. Explain what a slope of 0 means in this situation.
PSSA Grade 8 Mathematics Item and Scoring Sampler—September 2016 26
PSSA MATHEMATICS GRADE 8
Item-Specific Scoring Guideline
#17 Item Information
Alignment B-E.2 Depth of Knowledge 2 Mean Score 1.73
Assessment Anchor this item will be reported under:
M08.B-E.2—Understand the connections between proportional relationships, lines, and linear equations.
Specific Anchor Descriptor addressed by this item:
M08.B-E.2.1—Analyze and describe linear relationships between two variables, using slope.
Scoring Guide
Score In this item, the student . . .
4Demonstrates a thorough understanding of connections between proportional relationships, lines, and linear equations by correctly solving problems and clearly explaining procedures.
3
Demonstrates a general understanding of connections between proportional relationships, lines, and linear equations by correctly solving problems and clearly explaining procedures with only minor errors or omissions.
2Demonstrates a partial understanding of connections between proportional relationships, lines, and linear equations by correctly performing a significant portion of the required task.
1Demonstrates minimal understanding of connections between proportional relationships, lines, and linear equations.
0
The response has no correct answer and insufficient evidence to demonstrate any understanding of the mathematical concepts and procedures as required by the task. Response may show only information copied from the question.
Student demonstrates minimal understanding of connections between proportional relationships, lines, and linear equations.
0Response is incorrect or contains some correct work that is irrelevant to the skill or concept being measured.
PSSA Grade 8 Mathematics Item and Scoring Sampler—September 2016 27
PSSA MATHEMATICS GRADE 8
Top-Scoring Response
Part A (1 point):
1 } 2
point for each correct answer
What? Why?
Rainfall
Time(minutes)
30 45 60 90 135 150 180
Rain (cm) 2 3 4 6 9 1210
Part B (1 point):
1 point for correct equation
What? Why?
t = 15r
OR
r = 1 } 15
t
OR equivalent
Part C (1 point):
1 point for complete explanation
OR 1 } 2 point for correct but incomplete explanation
What? Why?
Sample Explanation:
The slope is steeper for the second part. This means it is raining more during that time.
Part D (1 point):
1 point for complete explanation
What? Why?
Sample Explanation:
A slope of 0 means it stopped raining.
PSSA Grade 8 Mathematics Item and Scoring Sampler—September 2016 28
PSSA MATHEMATICS GRADE 8
STUDENT RESPONSE
Response Score: 4 points
17.
Bill used a rain gauge to measure how much rain fell, in centimeters (cm), during arainfall.
The rain fell at the same rate throughout the first 180 minutes of the rainfall.
A. Complete the table below with the number of minutes it took for 9 centimeters ofrain to fall and the number of centimeters of rain that fell through 150 minutes.
Rainfall
Time(minutes)
30 45 60 90 150 180
Rain (cm) 2 3 4 6 9 12
B. Write an equation to describe the relationship between the time (t), in minutes,and the amount of rain (r), in centimeters.
The student has given two correct answers.
The student has given a correct equation.
Go to the next page to finish question 17.
PSSA Grade 8 Mathematics Item and Scoring Sampler—September 2016 29
PSSA MATHEMATICS GRADE 8
17.
Continued. Please refer to the previous page for task explanation.
The total amount of rain that fell from 180 minutes through 280 minutes is shown inthe scatter plot below.
2402202001800
25
20
15
10
5
Total Rainfall
Minutes
Rai
n (c
m)
260 280
C. Describe the change in the slope between the first 180 minutes and thefollowing 100 minutes, and explain what it means in terms of the total amountof rainfall.
After 280 minutes, the slope of the graph is 0.
D. Explain what a slope of 0 means in this situation.
The student has given a complete description.
The student has given a complete explanation.
PSSA Grade 8 Mathematics Item and Scoring Sampler—September 2016 30
PSSA MATHEMATICS GRADE 8
STUDENT RESPONSE
Response Score: 3 points
PARTS A AND B
Que
stio
n 17
Page
1 o
f 3
The
stud
ent h
as
give
n tw
o co
rrec
t an
swer
s.
The
stud
ent h
as g
iven
a
corr
ect e
quat
ion.
PSSA Grade 8 Mathematics Item and Scoring Sampler—September 2016 31
PSSA MATHEMATICS GRADE 8
PART C
Que
stio
n 17
Page
2 o
f 3
The
stud
ent h
as g
iven
an
inco
rrec
t exp
lana
tion.
PSSA Grade 8 Mathematics Item and Scoring Sampler—September 2016 32
PSSA MATHEMATICS GRADE 8
PART D
Que
stio
n 17
Page
3 o
f 3
The
stud
ent h
as g
iven
a
com
plet
e ex
plan
atio
n.
PSSA Grade 8 Mathematics Item and Scoring Sampler—September 2016 33
THIS PAGE IS
INTENTIONALLY BLANK.
PSSA MATHEMATICS GRADE 8
PSSA Grade 8 Mathematics Item and Scoring Sampler—September 2016 34
PSSA MATHEMATICS GRADE 8
STUDENT RESPONSE
Response Score: 2 points
17.
Bill used a rain gauge to measure how much rain fell, in centimeters (cm), during arainfall.
The rain fell at the same rate throughout the first 180 minutes of the rainfall.
A. Complete the table below with the number of minutes it took for 9 centimeters ofrain to fall and the number of centimeters of rain that fell through 150 minutes.
Rainfall
Time(minutes)
30 45 60 90 150 180
Rain (cm) 2 3 4 6 9 12
B. Write an equation to describe the relationship between the time (t), in minutes,and the amount of rain (r), in centimeters.
The student has given two correct answers.
The student has given a correct equation.
Go to the next page to finish question 17.
PSSA Grade 8 Mathematics Item and Scoring Sampler—September 2016 35
PSSA MATHEMATICS GRADE 8
17.
Continued. Please refer to the previous page for task explanation.
The total amount of rain that fell from 180 minutes through 280 minutes is shown inthe scatter plot below.
2402202001800
25
20
15
10
5
Total Rainfall
Minutes
Rai
n (c
m)
260 280
C. Describe the change in the slope between the first 180 minutes and thefollowing 100 minutes, and explain what it means in terms of the total amountof rainfall.
After 280 minutes, the slope of the graph is 0.
D. Explain what a slope of 0 means in this situation.
The student has given an incorrect explanation.
The student has given an incorrect explanation.
PSSA Grade 8 Mathematics Item and Scoring Sampler—September 2016 36
PSSA MATHEMATICS GRADE 8
STUDENT RESPONSE
Response Score: 1 point
PARTS A AND B
Que
stio
n 17
Page
1 o
f 3
The
stud
ent h
as
give
n tw
o in
corr
ect
answ
ers.
The
stud
ent h
as g
iven
an
inco
rrec
t equ
atio
n.
PSSA Grade 8 Mathematics Item and Scoring Sampler—September 2016 37
PSSA MATHEMATICS GRADE 8
PART C
Que
stio
n 17
Page
2 o
f 3
The
stud
ent h
as g
iven
an
inco
rrec
t exp
lana
tion.
PSSA Grade 8 Mathematics Item and Scoring Sampler—September 2016 38
PSSA MATHEMATICS GRADE 8
PART D
Que
stio
n 17
Page
3 o
f 3
The
stud
ent h
as g
iven
a
com
plet
e ex
plan
atio
n.
PSSA Grade 8 Mathematics Item and Scoring Sampler—September 2016 39
THIS PAGE IS
INTENTIONALLY BLANK.
PSSA MATHEMATICS GRADE 8
PSSA Grade 8 Mathematics Item and Scoring Sampler—September 2016 40
PSSA MATHEMATICS GRADE 8
STUDENT RESPONSE
Response Score: 0 points
17.
Bill used a rain gauge to measure how much rain fell, in centimeters (cm), during arainfall.
The rain fell at the same rate throughout the first 180 minutes of the rainfall.
A. Complete the table below with the number of minutes it took for 9 centimeters ofrain to fall and the number of centimeters of rain that fell through 150 minutes.
Rainfall
Time(minutes)
30 45 60 90 150 180
Rain (cm) 2 3 4 6 9 12
B. Write an equation to describe the relationship between the time (t), in minutes,and the amount of rain (r), in centimeters.
The student has given two incorrect answers.
The student has not given a correct equation.
Go to the next page to finish question 17.
PSSA Grade 8 Mathematics Item and Scoring Sampler—September 2016 41
PSSA MATHEMATICS GRADE 8
17.
Continued. Please refer to the previous page for task explanation.
The total amount of rain that fell from 180 minutes through 280 minutes is shown inthe scatter plot below.
2402202001800
25
20
15
10
5
Total Rainfall
Minutes
Rai
n (c
m)
260 280
C. Describe the change in the slope between the first 180 minutes and thefollowing 100 minutes, and explain what it means in terms of the total amountof rainfall.
After 280 minutes, the slope of the graph is 0.
D. Explain what a slope of 0 means in this situation.
The student has given an incorrect explanation.
The student has given an incorrect explanation.
PSSA Grade 8 Mathematics Item and Scoring Sampler—September 2016 42
PSSA MATHEMATICS GRADE 8
MATHEMATICS—SUMMARY DATA
MULTIPLE-CHOICE
Sample
Number Alignment Answer Key
Depth of
Knowledge
p-values
A B C D
1 B-E.1.1.1 A 1 41% 12% 29% 18%
2 B-E.1.1.4 A 1 75% 13% 7% 5%
3 B-E.3.1.4 A 1 46% 19% 22% 13%
4 B-E.3.1.5 B 2 19% 55% 15% 11%
5 B-F.1.1 C 2 28% 9% 48% 15%
6B-F.1.1.1C-G.1.1.1
C 2 14% 22% 48% 16%
7B-F.1.1.2B-F.1.1.3
D 2 10% 12% 30% 48%
8 B-F.2.1.1 A 2 70% 8% 17% 5%
9 B-F.2.1.2 C 2 3% 5% 79% 13%
10 C-G.1.1.1 A 2 49% 20% 7% 24%
11C-G.1.1.2C-G.1.1.3
D 2 15% 20% 22% 43%
12 C-G.3.1.1 A 2 49% 19% 18% 14%
13 C-G.3.1.1 A 2 40% 26% 15% 19%
14 D-S.1.1.1 C 2 20% 9% 56% 15%
15 D-S.1.1.2 B 2 20% 46% 21% 13%
16 D-S.1.2.1 C 2 16% 17% 63% 4%
OPEN-ENDED
Sample
Number Alignment Points
Depth of
Knowledge Mean Score
17 B-E.2 4 2 1.73
PSSA Grade 8 Mathematics Item and Scoring Sampler—September 2016 43


![The Pennsylvania System of School Assessment...Assessment (PSSA) .’ Then click on ‘Assessment Anchors/Eligible Content .’] What Is Included This sampler contains test questions](https://static.documents.pub/doc/80x56/5eb77a928702b62d736b25a8/the-pennsylvania-system-of-school-assessment-assessment-pssa-a-then-click.jpg)


